Abstract
This study combines convolutional neural network (CNN) recognition technology, Greenwich engineering software, and statistical yearbook methods to evaluate rural solar, wind, and biomass energy resources in pilot cities in China, respectively. The CNN method enables the rapid identification of the available roof area, and Greenwich software provides wind resource simulation with local terrain adaptability. The results show that the capacity of photovoltaic power generation reaches approximately 15.63 GW, the potential of wind power is 458.3 MW, and the equivalent of agricultural waste is 433,900 tons of standard coal. The city is rich in wind, solar, and biomass resources. By optimizing the hybrid power generation system through genetic algorithms, wind energy, solar energy, biomass energy, and coal power are combined to balance the annual electricity demand in rural areas. The energy trends under different demand growth rates were predicted through the LEAP model, revealing that in the clean coal scenario of carbon capture (WSBC-CCS), clean coal power and renewable energy will dominate by 2030. Carbon dioxide emissions will peak in 2024 and return to the 2020 level between 2028 and 2029. Under the scenario of pure renewable energy (H_WSB), SO2/NOx will be reduced by 23–25%, and carbon dioxide emissions will approach zero. This study evaluates the renewable energy potential, power system capacity optimization, and carbon emission characteristics of pilot cities at a macro scale. Future work should further analyze the impact mechanisms of data sensitivity on these assessment results.
1. Introduction
Energy crises and global warming have emerged as pressing global issues [1,2]. In response, China’s power sector aims to peak its CO2 emissions by 2030, with an aspirational target of 2028. Achieving this requires transformative changes to the national fossil fuel-dominated energy consumption structure, accelerating the transition toward a cleaner, low-carbon energy system with renewable and clean energy at its core [3].
The global use of renewable energy in power systems is expanding rapidly, with approximately 22,664 TWh of renewable electricity expected to be generated globally by 2040 [4]. As a kind of clean, renewable energy, biomass energy has great potential in solving the problem of energy shortage, helping to improve the ecological environment, and maintaining the ecological balance [5,6]. The utilization of biomass energy can realize the recycling of livestock manure, crop straw, and other agricultural production wastes and reduce agricultural pollution, which is an important way to implement the rural revitalization strategy and promote agricultural modernization [7]. Solar and wind energy systems are also among the promising sources of power generation, due to their availability and topological advantages, suitable for local power generation in remote areas [8]. Wind and solar power, given their technological maturity, have become pivotal drivers of China’s green transition, significantly decreasing fossil fuel dependence [9]. By 2030, China’s total installed capacity for wind and solar is projected to exceed 1.2 billion kilowatts. The world is actively building and operating multi-energy complementary systems, including wind, solar, hydro, thermal, and storage, to achieve the optimization of energy structure and high efficiency of energy utilization [10,11]. Among these, solar, wind, and biomass play increasingly critical roles in reducing energy consumption and mitigating environmental degradation [12].
The energy-use patterns and structures of urban and rural residents in China are very different [13]. Many rural regions face limitations in grid connectivity due to low electricity demand and high infrastructure costs, forcing remote communities to rely on diesel generators [14,15]. This approach suffers from inadequate supply, low reliability, and heightened environmental pollution [16]. However, rural areas are often rich in solar, wind, and biomass resources, which are inexhaustible and widely available. Renewable energy generation can improve the reliability of the rural power supply and significantly improve the quality of life in rural areas [17]. Thus, assessing rural renewable potential and quantifying its impact on carbon emissions is imperative.
1.1. Literature Review
Currently, significant progress has been made in resource assessment research for wind, solar, and biomass energy. In the field of solar energy, Jiao et al. [18] developed a building extraction method from remote sensing images based on the DeepLabv3+ semantic segmentation model to estimate regional rooftop photovoltaic installation capacity, achieving an Intersection over Union of 82.18% for building extraction. Tao et al. [19] proposed an improved MANet model, which demonstrated an accuracy of 99.53% in identifying photovoltaic installations from the Gaofen-7 satellite data set. In the field of wind energy assessment, Dobesch et al. [20] evaluated the wind energy potential at a 60 m height in Jilin Province by combining hourly wind speed data from ground observation stations with the WAsP computational model. Meanwhile, Wan et al. [21] employed the Weibull distribution to model wind speeds and assess wind energy indicators in Urad. Their results revealed an average annual wind speed of 9.33 m/s and an effective power generation duration exceeding 7000 h per year. Regarding biomass energy, statistical yearbook-based methods have been widely applied to quantify agricultural and forestry residues across China [22]. Researchers have utilized this approach to assess the exploitable potential of provincial-level biomass resources in China [23,24].
Building upon resource assessment, rational development and utilization of energy resources are of paramount importance. In recent years, numerous studies have focused on optimizing the installed capacity of hybrid wind–solar energy systems with the dual objectives of economic viability and environmental benefits [25,26]. Notably, biomass energy systems can serve as an effective complement to wind and solar power, making the capacity allocation of wind/solar/biomass hybrid energy systems a subject worthy of in-depth discussion [27].
Upon determining the installed capacity, it is essential to forecast renewable energy generation potential and pollutant reduction effects based on policy assumptions to verify development feasibility. The Long-range Energy Alternatives Planning System (LEAP) model has been extensively employed in studies on energy structure optimization, greenhouse gas mitigation, and pollutant control. For instance, Chen et al. [28] projected that Gansu Province’s power sector could achieve a 20.12% reduction in greenhouse gas emissions through renewable energy integration. Similarly, Cai et al. [29] analyzed the carbon peaking and carbon neutrality paths of Bengbu City from 2020 to 2060 using the LEAP model. The results indicated that achieving the carbon reduction targets in the power industry requires large-scale deployment of renewable energy (such as wind and solar energy) and thermal power generation systems equipped with carbon capture, utilization, and storage technology.
Current research predominantly analyzes resource assessment, optimal utilization, and carbon emission prediction as separate modules. The innovative contribution of this study lies in selecting a pilot city to establish an integrated research framework encompassing “resource assessment–optimized utilization–carbon emission prediction” (Table A1), thereby providing systematic solutions and decision-making references for the city’s renewable energy development and utilization.
1.2. Main Work of This Paper
Rural areas possess abundant renewable resources with significant development potential. This study focuses on a pilot city in China, conducting comprehensive research through three key components: resource assessment, optimized utilization, and carbon emission prediction, as illustrated in Figure A1.
- (1)
- This article presents a comprehensive evaluation of renewable energy resources in pilot cities to assess their development potential. Regarding solar energy resource assessment, deep learning technology is employed to address the issue of complex processes involved in extracting building information from remote sensing images using traditional digital image processing methods, thereby enhancing the recognition speed of building areas. For wind energy resource assessment, Greenwich online platform (http://greenwich.envisioncn.com/web/portal/login accessed on 8 April 2025) is utilized to construct a virtual wind measurement tower, reducing the cost of wind measurement. This software, in conjunction with Weibull distribution fitting technology, enables simultaneous optimization of both macro- and micro-site selection for wind farms, making it suitable for early-stage wind farm planning. In the case of biomass energy, the statistical yearbook method is adopted for resource assessment. This approach offers high computational efficiency and serves as an effective preliminary screening tool for evaluating the development potential of biomass energy.
- (2)
- This article determines the total installed capacity of the required power sources based on the actual local electricity demand. It optimizes the installed capacity of each energy source with the goals of economy and carbon emissions, ensuring a reasonable distribution and utilization of energy.
- (3)
- This study utilizes the optimized installed capacity of various energy sources as input parameters to conduct scenario-based modeling and analysis through the LEAP platform, systematically evaluating the projected evolution of China’s power generation, carbon emissions, and pollutant emissions from 2020 to 2030, thereby establishing both theoretical foundations and empirical evidence to support rural decarbonization policy formulation.
2. Resource Evaluation
2.1. Solar Resource
2.1.1. Basic Information of Solar Resource
A pilot city in China, with stable solar energy resources, receives an average of 1951.6 annual sunshine hours. The urban area comprises 22 towns and 3 subdistricts. The analysis utilized a 17-level high-resolution urban image (1.028 m pixel resolution), which was automatically divided into 512 × 512-pixel tiles through a systematic spatial segmentation process. The division followed a two-stage approach: initial north–south partitioning succeeded by subsequent west–east subdivision.
The Convolutional Neural Network (CNN) is a kind of deep neural network with structures such as convolutional layers, pooling layers, and fully connected layers. This section constructs a DeepLabV3+ semantic segmentation network based on the MobileNetV2 backbone. The network captures multi-scale features through the Atrous Spatial Pyramid Pooling (ASPP) module, combines the decoder to restore spatial details, and finally outputs the segmentation results through the pixel classification layer. During the training, the Adam optimizer was used, with a regularization coefficient of 0.005. A total of 30 cycles were trained.
2.1.2. Research Methodology of Solar Resource
- (1)
- Enrich the training set. In order to reduce the workload of manual labeling and enable the model to better extract the features of satellite remote sensing images, data enhancement is carried out according to the characteristics of the data set before data set training. In this study, the data richness is enhanced by rotating the image, increasing or decreasing the brightness, and increasing the noise.
- (2)
- Manual marking and training. In this paper, 40% of the images are selected as the training set and 60% of the images are selected as the verification set. The roof was marked by Image Labeler, an image marking tool of MATLAB 2020b, and the roof contour data set was trained by convolutional neural network.
- (3)
- Identify prediction areas. A certain area of the pilot city is selected as the prediction set for verification, and the training model obtained in Step 2 is used to predict the roof area of this area. In order to better match the actual solar installation area, the assessed area needs to be corrected by the ratio of available roof area, which is 0.85. At the same time, the inevitable errors in the training set recognition algorithm should be considered, and the area should be further corrected with the correction coefficient, which is 0.9.
- (4)
- Solar power generation forecast. After practical engineering verification, the optimal tilt of solar panel installation in this area is about 25°. This study assumes a “triangular” installation for resource assessment to ensure that the installed capacity of the solar power system under this installation is not limited by the type of roof [30]. Table 1 lists the solar module specifications.
 Table 1. Parameters of solar modules.
According to the following formula, the required roof area (S1) for a solar panel can be calculated:
Solar power generation is calculated according to the following formula:
l and w represent the length and width of the solar panel, respectively. cos 25° is the installation inclination angle of the solar panel. Ei represents the electricity produced by the solar power generation system in the i year; Ey is the annual solar radiation; ηp is the solar power conversion efficiency of the solar power generation system; ηs is the system efficiency of the solar power generation system, including circuit losses; and α is the interannual attenuation coefficient of the solar power generation system. Due to the aging of solar power generation equipment year by year, the annual attenuation coefficient is set at 0.5% [31].
2.1.3. Research Result of Solar Resource
Figure 1 shows the result of the DeepLabV3+ model in identifying the rooftops of the pilot city. The accuracy of the verification set reaches 92.34%. By identifying the roofs of the pilot city one by one, its total roof area is about 64.44 square kilometers, about 38.13 million solar panels can be installed, the installed capacity is about 15.63 GW, and the estimated reliable power generation in the first year is 14,944.07 GWh.
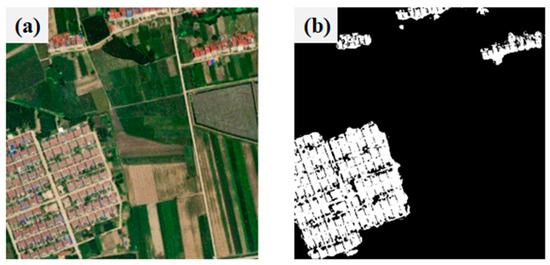
Figure 1.
Results of roof identification: (a) original; (b) Identification map.
2.2. Wind Resource
2.2.1. Basic Information of Wind Resource
This section assesses the wind resources of the pilot city in combination with Greenwich software. Greenwich is a high-precision wind resource assessment and wind farm optimization tool for the wind power industry, supporting 7 m grid simulation, global meteorological data integration, intelligent micro-site selection, and full life cycle management. According to the Greenwich integrated data and engineering survey results, the average annual wind speed in the pilot city is between 4 and 5 m/s, with a maximum wind speed of 17 m/s. At a height of 90 m, the average annual wind speed is 4.7 m/s, and the average annual wind power density is 117.3 W/m2. At a height of 140 m, the annual average wind speed is 5.3 m/s, and the annual average wind power density is 165.8 W/m2, which is suitable for wind power generation.
2.2.2. Research Methodology of Wind Resource
- (1)
- Identify the wind resource development area. Meteorological data for the study area will be collected using Greenwich software to verify its suitability for wind farm development.
- (2)
- Selection and macro-site selection. In Greenwich software, the wind turbine type is chosen as the IEC Class I-III model, with a hub height of 120 m, a single unit capacity ranging from 5 to 6 MW, and a minimum annual power generation requirement of 1700 h per unit. This selection forms the initial macro-site map for the fans.
- (3)
- Micro-site selection. The macro-site area does not automatically qualify for wind turbine construction, as it may contain non-construction zones. When planning wind farms, restricted areas such as basic farmland, ecological red lines, and urban development boundaries should be excluded based on local conditions. Additionally, residential areas within 300 m should be avoided, and the points that do not meet the criteria should be removed.
- (4)
- Calculation of wind resource potential. Greenwich software calculates the wind power potential of the pilot city based on the micro-site selection results and the total capacity of the wind turbines.
2.2.3. Research Result of Wind Resource
Figure 2 shows the planning distribution of wind turbines in the city. In this study, the wind turbine planning layout of the city is divided according to the western, central, and eastern regions, among which the eastern region plans the least, with 14 fans, 21 fans in the central region, and 53 fans in the eastern region. The total capacity of the city’s wind turbines is about 458.3 MW, and the annual on-grid electricity can be 851,328.5 MWh/year.
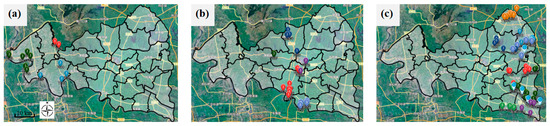
Figure 2.
Distribution of wind turbines: (a) Western region; (b) Central region; (c) Eastern region.
2.3. Biomass Resources
2.3.1. Basic Information of Biomass Resource
Through China’s Hubei Province Bureau of Statistics (http://tjj.hubei.gov.cn/tjsj/sjkscx/tjnj/qstjnj/ accessed on 8 April 2025) data, we can see that in 2022, the pilot cities saw a crop sown area of 241,114 hectares. The agricultural output comprised 803,300 tons of staple grains, 60,100 tons of cotton, 134,800 tons of oilseed crops, and 50,400 tons of sugar. Additionally, livestock production included 48,500 tons of pork and 1900 tons of beef, with a year-end live hog inventory of 408,900 heads. Thus, there is significant potential for energy utilization from crop and livestock waste in the pilot cities.
2.3.2. Research Methodology of Biomass Resource
- (1)
- Data acquisition for production yields. Production data for major crops and livestock in the pilot city were sourced from authoritative statistical yearbooks, including the China Statistical Yearbook 2023 and Hubei Rural Statistical Yearbook 2023.
- (2)
- Modeling of available resource quantities. Crop residue primarily refers to crop straw, a byproduct of agricultural production. This study employed the straw-to-grain ratio method to calculate the straw yield (Wi) using the following formula [32]:
Livestock farming generates significant amounts of manure. The available resource quantity of livestock manure (Fi) was calculated using the following formula:
Ji is the annual fecal output per head of the i type of livestock and poultry; Mi is the number of the i kind of livestock and poultry; Ni is the proportion of dry matter in the excrement of the i species; and Bi is the collectable utilization coefficient of the i livestock manure.
- (3)
- Parameter selection. Parameters for crop straw included the straw-to-grain ratio, collectible utilization coefficient, and lower heating value (LHV). Given the range of possible LHV values for each crop, the average LHV was used for calculations. Detailed parameters for different crops are presented in Table 2 [33,34].
Table 2. Grass–grain ratio, collectable utilization coefficient, and low calorific value of crop waste.
The relevant parameters of livestock manure include livestock manure yield, dry matter ratio, and collectable utilization coefficient, as shown in Table 3 [35,36].
Table 3.
Related parameters of livestock manure.
- (4)
- Conversion of fuel resources. According to the biomass energy potential of crop straw and livestock manure calculated above, the number of resources that can replace traditional fuels (standard coal or biogas) is converted into the following calculation method:
Pe is the energy output of different crops; Pcrop is the standard coal equivalent of crops; and Tcl is the converted standard coal coefficient of different biomass energy sources. Ai is the energy conversion potential of class i livestock manure used as biogas, and Gi is the gas-producing factor of class i livestock and poultry manure. Plivestock converts the standard coal equivalent of livestock manure. Z is the conversion coefficient of biogas into standard coal.
2.3.3. Research Result of Biomass Resource
Based on the evaluation method of the statistical yearbook, the resources of crop waste and livestock excrement in the pilot cities were assessed. The main crops in the pilot cities are wheat and rice. As can be seen from Figure 3a, the highest output of agricultural waste in the pilot city is rice, which reaches 468,300 tons, while the amount of soybean and sesame planting is small, and their corresponding waste output is also small. Standard coal equivalent calculations revealed that the total crop residue biomass in the pilot city reached 433,900 tons of standard coal equivalent (tce) in 2022. Rice residues constituted the largest proportion at 198,100 tce (45.6% of total), followed by wheat and rapeseed residues, indicating these three crops as the primary sources of agricultural waste in the study area.
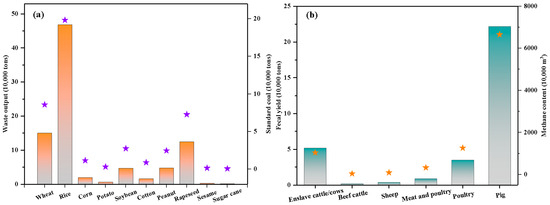
Figure 3.
Biomass production and converted resources: (a) agricultural waste; (b) livestock manure. Note that the columns show data of the vertical coordinate on the left, while the stars show data of the vertical coordinate on the right.
The livestock population in the study area primarily consists of cattle, sheep, poultry, and pigs. As illustrated in Figure 3b, analysis of animal manure resources reveals that pigs generate the highest manure output at 221,600 tons, representing the dominant livestock waste source. Biogas potential assessment indicates that the total biogas production capacity from livestock manure reaches 93.97 million m3. Notably, pig manure contributes 66.49 million m3 (70.75%) of biogas output, accounting for over two-thirds of the total production capacity.
3. Power Source Structure Distribution
This study focuses on rural areas within a pilot city of Hubei Province, China, where we established key parameters, including per capita electricity consumption and population size. The baseline data reveals that in 2015, rural residents in the study area consumed 401.36 kWh of electricity per capita annually. During the 2016–2020 period, aligned with China’s national electricity consumption growth rate of 5.7% per annum, a corresponding increase in rural electricity demand can be observed. By 2020, the annual per capita consumption in the pilot city’s rural areas reached 500 kWh, resulting in a total regional electricity demand of 260.65 GWh.
Our analysis indicates that this demand could be fully met by developing approximately 100 MW of local generation capacity. Furthermore, comprehensive resource assessments demonstrate significant potential for renewable energy development in the region. The combined exploitable capacity of solar, biomass, and wind resources substantially exceeds 100 MW, suggesting these renewable sources could completely satisfy the area’s electricity requirements if properly developed.
Therefore, in the power source structure allocation stage, this paper sets up two scenarios. Scenario A includes only renewable energy generation from wind, solar, and biomass. Scenario B includes coal, wind, solar, and biomass, and requires consideration of carbon emissions. This section will find the optimal ratio of each power generation mode to provide input conditions for the LEAP model.
3.1. The Objective and Constraint of Power Source Structure
3.1.1. Economy and Carbon Emission Model
CO2 emissions from renewable energy generation are negligible, considering only the annual investment. The investment amount (CNY/year) includes the initial cost, operation and maintenance (OM) cost of each type of power supply, and the residual value cost of each type of equipment to be deducted
where Ii, Spi, and OMpi are the initial cost, residual present value, and operation and maintenance cost of device i, respectively. N is the project life; the subscripts w, s, b, and c represent wind, solar, biomass, and coal power, respectively.
The initial cost calculation formula for the equipment is as follows [37]:
Cw, Cs, Cb, and Cc represent the installation cost of 1 MW of wind power, solar power, biomass, and coal power generation systems, respectively; and Pw, Ps, Pb, and Pc respectively represent the installed capacity of wind power, solar power, biomass, and coal power generation systems.
The formula for calculating the recovery cost of equipment is as follows [38]:
SPw, SPs, SPb, and SPc represent the residual value of wind, solar, biomass, and coal power generation systems, and the recovery value is set at 10% of the installation cost; β is the inflation rate, γ is the bank interest rate, and N is the useful life of the system.
The operating and maintenance costs of the equipment are calculated as follows [39]:
λ represents the ratio of the annual operation and maintenance cost of the system equipment to the initial investment cost of the system, which is 0.03 in this paper [39].
In addition, it is also necessary to consider the fuel cost of coal power (fc), other costs of coal power (Coth), and biomass fuel cost (fb), as follows [40]:
where Hi indicates the average number of generating hours per year of the type i generation system; φi is the coal or biomass consumption per power supply unit of the power plant [41]; and LHVSC is the low calorific value of standard coal, which is 29.31 MJ/kg. LHVRC is the low calorific value of raw coal, which is 20.91 MJ/kg. Ki is the price of coal or biomass, and Roth is the cost factor of other costs of coal power.
Renewable energy system power generation can reduce greenhouse gas emissions, and system greenhouse gas emissions are calculated as follows:
GHG represents the total greenhouse gas emissions of the system; C represents the consumption of fossil energy; U stands for greenhouse gas emission intensity of fossil energy; T stands for total standard coal consumption; and Q represents the heat release of standard coal.
3.1.2. Constraint Condition
The total installed capacity of the hybrid power generation system cannot exceed the designed total capacity, and the generation capacity must meet the local requirements. The constraints are as follows:
Imin and Imax represent the minimum and maximum installed capacity of type i power generation system, respectively. Because the pilot market is rich in wind and solar biomass resources, all kinds of resources can be developed, and the Imin is set at 10 MW. Wtotal indicates the total amount of electricity consumed in the local area per year.
3.2. Optimization of Installed Capacity Configuration of Hybrid Power Generation System
In this paper, the CO2 emission and investment cost of the hybrid power system are taken as optimization targets, and the installed capacity is optimized by the genetic algorithm, as shown in Figure 4. The population size of this algorithm is set to 300, and the crossover rate is set to 0.8. In Scenario A, it is concluded that the installed capacity of wind, solar energy, and biomass is 12 MW, 63 MW, and 25 MW, respectively. In scenario B, this paper adopts multi-objective optimization, comprehensively considers carbon emission and economy, adopts the ideal point method to select capacity allocation, and obtains the optimal compromise solution [42]. Taking the geometric distance (D) after normalization between the target vector point and the ideal point as the objective function, the installed capacity of wind, solar energy, biomass and coal power is determined to be 18 MW, 52 MW, 14 MW, and 16 MW, respectively, as shown in Figure 5.
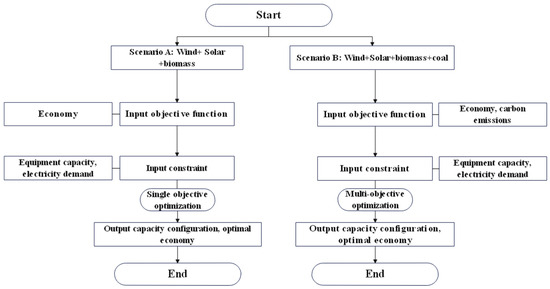
Figure 4.
Objective optimization flow chart.
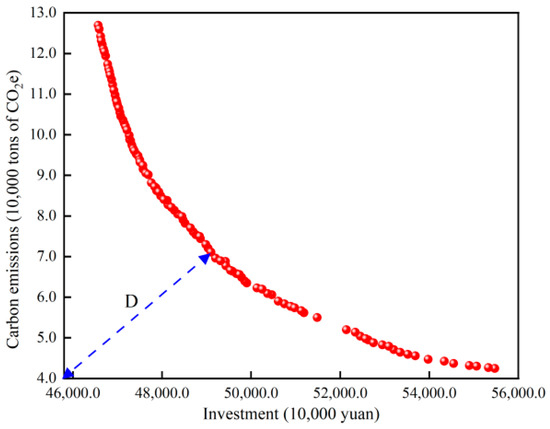
Figure 5.
Multi-objective optimization results.
4. Power Generation and Pollutant Emission Forecast
4.1. Scenario Assumptions
In this paper, the genetic algorithm is used to determine the installed capacity of various power generation types, and the LEAP model is used to predict the installed scale and pollutant emissions from 2020 to 2030. First, the population size of the pilot city is set in the model. Then, the power consumption intensity of rural residents is configured in the demand module to ensure that the model can truly reflect the electricity demand of rural residents. Finally, the installed capacity of different power generation types in the initial year is set in the energy conversion module, as shown in Figure 6a.
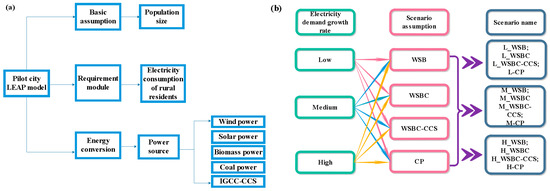
Figure 6.
(a) LEAP model diagram; (b) Scenario assumptions and combination names.
According to 2023 data from the pilot city, the population figures for 2020–2023 were 1.159 million, 1.106 million, 1.107 million, and 1.094 million, respectively. The rural population urbanization has led to a negative growth trend in the pilot city’s population, with an average annual rate of −1.42%. Consequently, a post-2020 population growth rate of 1.42% has been adopted for projections. According to the China Power Industry Annual Development Report 2021, China’s average annual electricity consumption growth rate from 2021 to 2025 will exceed 4.8%. The National Energy Administration projects continued growth in China’s energy consumption during 2026–2030. The International Energy Agency forecasts China’s electricity demand growth at approximately 6.2% for 2024. Based on data from the National Energy Administration and the International Energy Agency, this study establishes three electricity demand growth scenarios for the pilot city during 2020–2030: low speed (4.8%), medium speed (5.4%), and high speed (6.0%). As shown in Figure 6b, distinct research scenarios are developed corresponding to these different demand growth rates:
Scenario 1 (WSB): Based on the single-objective optimization results of wind power, solar power, and biomass power, the installed capacity of the base year is set to 12 MW, 63 MW, and 25 MW, respectively. The growth rate of wind, solar, and biomass installed capacity development scale is non-linear and volatile. Therefore, the average growth rate of Chinese cumulative installed capacity from 2019 to 2023 is set as an indicator in this study. According to the data released by the National Energy Administration, the annual growth rate of Chinese installed capacity in 2019–2023 is 9.5%, 8%, 7.9%, and 13.9%, respectively, with an average annual growth rate of 9.8%.
Scenario 2 (WSBC): Based on multi-objective optimization results for wind, solar, biomass, and coal power, the base year installed capacities are set at 18 MW, 52 MW, 14 MW, and 16 MW, respectively. This scenario assumes an annual growth rate of 9.8% for all four power generation types.
Scenario 3 (WSBC-CCS): This scenario incorporates clean coal transformation through Integrated Gasification Combined Cycle with Carbon Capture and Storage (IGCC-CCS) technology. For every 1 GWh of electricity generated using this power generation technology, approximately 870 tons of CO2, 0.4 tons of SO2, and 0.9 tons of NOx can be synergistically reduced [28,43]. Building upon Scenario 2, it replaces conventional coal power capacity increases post-2025 with IGCC-CCS installations while maintaining the same 9.8% annual growth rate.
Control Scenario (CP): A coal-dominated configuration with 100 MW of initial coal power capacity, growing at 9.8% annually through new conventional coal power installations.
4.2. The Forecast of Power Generation
Figure 7a–c show the changes in the average annual power generation of wind, solar, and biomass energy in scenario 1 when the growth rate of power demand is low, medium, and high, respectively. In the low-, medium-, and high-speed scenarios, the total electricity demand increases from 221.83 GWh to 307.27 GWh, 325.32 GWh, and 344.32 GWh, respectively. In the base year scenario, the power supply reliability of biomass power generation is higher. At this time, the biomass power generation is 106.27 GWh, while the wind and solar power generation are 31.88 GWh and 83.68 GWh, respectively. Since 2021, solar power has experienced substantial capacity expansion, resulting in progressively increasing annual generation that has gradually approached parity with biomass power output. In 2030, under the L_WSB scenario, the total biomass and wind power generation increased by 29%, and solar power increased by 55%. Under the H_WSB scenario, the total biomass, wind, and solar power generation increased by 44%, 44%, and 73%, respectively, reaching 136.87 GWh, 46.01 GWh, and 129.34 GWh. It can be seen that biomass and solar power generation has a larger growth.
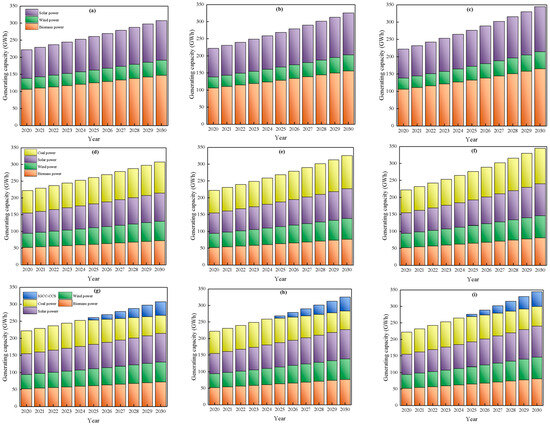
Figure 7.
Variations in power generation predicted by the LEAP model: (a) L_WSB; (b) M_WSB; (c) H_WSB; (d) L_WSBC; (e) M_WSBC; (f) H_WSBC; (g) L_WSBC-CCS; (h) M_WSBC-CCS; (i) H_WSBC-CCS.
Figure 7d–f illustrate the annual power generation trends for wind, solar, biomass, and coal in Scenario 2, under low-, medium-, and high-power demand growth rates. Power generation from all four sources increases annually. Coal consistently contributes the largest proportion of power due to its high reliability and generation efficiency. For example, in 2030 under the L_WSBC scenario, biomass, wind, solar, and coal generate 72.30 GWh, 58.10 GWh, 83.92 GWh, and 92.96 GWh, respectively. Under the H_WSBC scenario, total power generation is 12% higher than in the L_WSBC scenario. While coal currently leads in annual power generation, followed by solar, its higher pollutant emissions pose a challenge to achieving carbon neutrality.
Figure 7g–i illustrate the power generation trends across different energy sources under the IGCC-CCS scenario. During 2020–2024, all energy sources demonstrate consistent growth in power generation. Following the implementation of IGCC-CCS technology in 2025, traditional coal-fired power generation shows an annual decline in its proportion, while clean coal power generation progressively increases. By 2030, under conditions of high electricity demand growth, traditional coal power’s share decreases from 30% (2020 baseline) to 22.58%, with clean coal power rising to 13%. Notably, post-2025, both solar and biomass power generation exhibit steady growth, eventually exceeding traditional coal-fired power generation—a trend consistent with clean energy development objectives.
Comparing the energy generation changes across scenarios reveals a greater total contribution from biomass and solar power. Specifically, under high electricity demand growth, Scenario 1 generates 83.93 GWh and 35.86 GWh more biomass and solar power, respectively, than Scenarios 2 and 3. Therefore, this pilot city should prioritize the development of biomass and solar power generation.
4.3. The Forecast of Carbon Emissions
Scenario 1 completely excludes coal power generation. The CO2 emissions from biomass power production are fully offset by carbon sequestration during biomass cultivation through photosynthesis utilization, resulting in near-zero net CO2 emissions [44]. Figure 8 presents the comparative CO2 emission trajectories across all scenarios. The control scenario (CP), which relies solely on coal-fired power generation, shows dramatically increasing CO2 emissions that peak at 337,400 tons in 2030 under high-growth conditions (H_CP). In stark contrast, Scenario 1, which relies exclusively on wind, solar, and biomass energy generation, achieves an estimated reduction of approximately 300,000 metric tons of CO2 emissions by 2030 under high electricity demand growth.
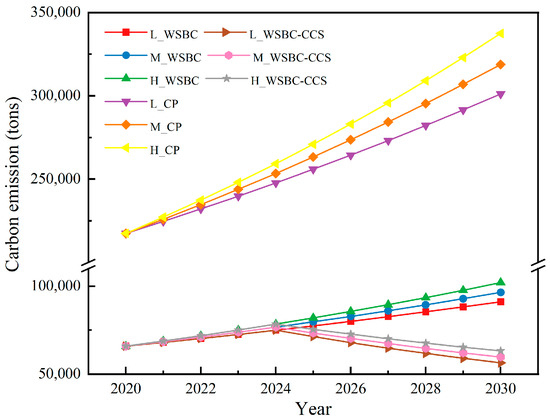
Figure 8.
CO2 emission change chart.
CO2 emissions in Scenario 2 are significantly lower than in the control scenario due to the simultaneous development of renewable energy and coal generation. From 2020 to 2030, under the L_WSBC scenario, carbon emissions from rural generators in the pilot city increase annually, reaching 91,000 tons by 2030, which is much lower than in the L_CP scenario (210,000 tons). Under the M_WSBC scenario, increased rural per capita electricity consumption further increases carbon emissions, approaching 100,000 tons annually by 2030. In the H_WSBC scenario, carbon emissions continue to rise from 2020 to 2030, reaching 11,000 tons higher than the L_WSBC scenario in 2030, but still 235,300 tons lower than the H_CP scenario.
The progressive implementation of IGCC-CCS technology demonstrates growing CO2 emission reduction benefits. The CO2 reduction rate attained through IGCC-CCS by 2030 proves critical for achieving carbon peaking targets in the Chinese power sector. In Scenario 3, which assumes the transition from traditional coal-fired power generation starting in 2025 with IGCC-CCS deployment, CO2 emissions experience substantial reductions. As illustrated in Figure 8, across different electricity demand growth scenarios, CO2 emissions first rise and then decline, peaking in 2024. Projections indicate emissions from 2028 to 2029 will return to 2020 levels. Consequently, expediting IGCC-CCS technology adoption becomes imperative for earlier carbon peaking achievement. Nevertheless, the significant capital investment required for CCS retrofitting may adversely affect the economic development of pilot cities.
4.4. The Forecast of Typical Pollutant
Figure 9a–c illustrate the annual SO2 and NOx emissions from wind, solar, and biomass power generation under low-, medium-, and high-growth scenarios in Scenario 1. Because only wind, solar, and biomass are used for power generation in this scenario, SO2 and NOx emissions are solely attributable to biomass. As per capita living standards improve and overall electricity demand increases, biomass power generation expands to ensure a reliable power supply, leading to a corresponding annual increase in SO2 and NOx emissions. Under the low electricity demand growth scenario, total SO2 and NOx emissions reach 19.9 tons and 46.1 tons, respectively. With high electricity demand growth, total SO2 and NOx emissions are 2.4 tons and 5.7 tons higher than under the medium growth scenario.
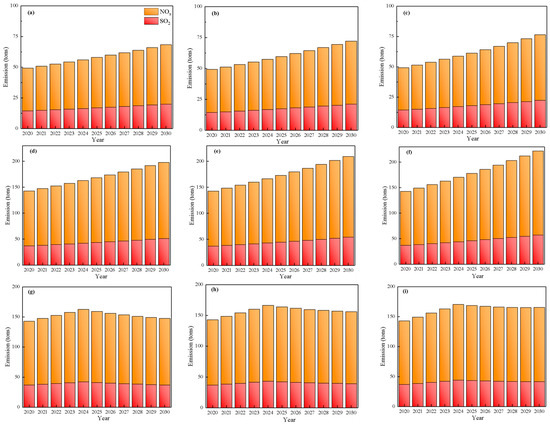
Figure 9.
The change in SO2 and NOx emissions: (a) L_WSB; (b) M_WSB; (c) H_WSB; (d) L_WSBC; (e) M_WSBC; (f) H_WSBC; (g) L_WSBC-CCS; (h) M_WSBC-CCS; (i) H_WSBC-CCS.
Figure 9d–f illustrate the annual SO2 and NOx emissions from wind, solar, biomass, and coal power generation under low-, medium-, and high-growth scenarios in Scenario 2. The inclusion of coal power results in significantly higher total SO2 and NOx emissions compared to Scenario 1. In 2030, under low-, medium-, and high-power demand growth rates, total SO2 emissions are 51.1 tons, 54.1 tons, and 57.3 tons, respectively, while total NOx emissions are 141.9 tons, 149.4 tons, and 157.2 tons, respectively.
Figure 9g–i show the SO2 and NOx emissions from the hybrid power generation system incorporating IGCC-CCS technology in Scenario 3. The implementation of IGCC-CCS leads to an initial increase in SO2 and NOx emissions, followed by a decreasing trend. Emissions decrease annually starting in 2025. In 2030, under low-, medium-, and high-power demand growth rates, total SO2 emissions are projected to be 37.0 tons, 39.1 tons, and 41.1 tons, respectively, and total NOx emissions are projected to be 110.4 tons, 116.9 tons, and 123.8 tons, respectively. The decline in SO2 and NOx emissions after 2025 is more gradual under the H_WSBC-CCS scenario, primarily due to the sharp increase in biomass power generation under the scenario.
Table 4 compares pollutant reduction rates under different high-power growth scenarios in 2030. As shown in the table, the continued development of coal power is not conducive to pollutant emission reductions. However, when renewable energy and coal power generation are developed simultaneously, emissions of SO2, NOx, and CO2 can be reduced by 62.60%, 63.91%, and 69.75%, respectively. If coal power plants are retrofitted with carbon capture technology, pollutant emissions can be further reduced by 10–20%. In contrast, if power generation relies entirely on renewable energy, CO2 emissions become negligible, while SO2 and NOx reductions reach 90–95% (a decrease of 10–15% compared to scenario 2). In summary, in the case of suitable economic development, reasonable development and utilization of wind, solar, biomass power generation, and appropriate introduction of CCS technology into traditional coal power will help reduce SO2, NOx, and CO2 emissions in the pilot city.
Table 4.
Pollutant reduction rate under high power growth in 2030.
5. Conclusions
After an assessment of the number of resources in the pilot city and the prediction of the power development and carbon emission scenario of the pilot city by the LEAP model, the main conclusions are as follows:
- (1)
- The pilot city boasts abundant solar, wind, and biomass resources. The estimated installed capacity for solar power generation in the region reaches approximately 15.63 GW. For wind power, the total planned installed capacity is projected to be 458.3 MW. In terms of biomass resources, the city’s crop waste translates to 433,900 tons of standard coal equivalent, while its livestock manure resources can potentially generate 93.97 million m3 of biogas.
- (2)
- The equipment capacity of the power generation system is optimized by the genetic algorithm. In the pure renewable energy generation system scenario, the installed capacity of wind, solar, and biomass is 12, 63, and 25 MW. In the WSBC scenario, wind, solar, biomass, and coal power installed capacity optimization results are 18, 52, 14, and 16 MW.
- (3)
- In the H_WSBC-CCS scenario, traditional coal power’s share declines from 30% (2020) to 22.58%, while clean coal power rises to 13%. Meanwhile, solar and biomass generation gradually expands, ultimately surpassing traditional coal power. This transition suggests the city should prioritize solar and biomass energy development.
- (4)
- If coal power remains the sole energy source, CO2 emissions are projected to reach 337,400 tons by 2030. However, with the concurrent development of renewable energy and the adoption of IGCC-CCS technology, emissions are expected to peak in 2024.
The primary focus of this study is the macro-level assessment of renewable energy resources, optimal allocation of power sources, and carbon emission forecasting in pilot cities. Future research should further investigate the impacts of land-use changes, ecosystem disturbances, data uncertainty, and other factors on renewable energy potential assessment and power system carbon emissions.
Author Contributions
Conceptualization, H.J. (Hai Jiang); methodology, H.J. (Haoshuai Jia), H.J. (Haoshuai Jia) and Y.M.; formal analysis, H.J. (Haoshuai Jia) and Y.M.; investigation, H.J. (Hai Jiang) and W.W.; data curation, Y.Q. and W.W.; writing—original draft, R.L., C.W. and W.W.; writing—review & editing, H.J. (Hai Jiang), W.L. and C.W.; visualization, W.W.; supervision, C.W.; project administration, Y.M. and C.W.; funding acquisition, C.W. All authors have read and agreed to the published version of the manuscript.
Funding
This research was funded by the Smart Grid National Science and Technology Major Project (2024ZD0800502) and the Science and Technology Project of General Institute of Hydropower Planning and Design (ZY-KJXN-20230010).
Data Availability Statement
The data reported in this study will be available on request from the corresponding author.
Conflicts of Interest
Authors Wenzhi Liu and Yijun Miao were employed by the company PowerChina HuBei Electric Engineering Co., Ltd. The remaining authors declare that the research was conducted in the absence of any commercial or financial relationships that could be construed as a potential conflict of interest.
Abbreviations
| Nomenclature | |
| Ai | the energy conversion potential |
| Bi | collectable utilization coefficient of livestock |
| C | consumption of fossil energy |
| Ci | the installation cost of power generation system |
| Coth | other costs of coal power |
| Ei | electricity produced by solar power |
| Ey | annual solar radiation |
| Fi | available resource quantity of livestock manure |
| Gi | gas-producing factor of livestock and poultry manure |
| Hi | average generating hours of generation system |
| Ii | the initial cost of power generation device |
| Ji | annual fecal output of livestock and poultry |
| Ki | price of coal or biomass |
| Mi | number of i livestock and poultry |
| Ni | proportion of dry matter in the excrement |
| Oi | collectable utilization coefficient of straw |
| OMpi | maintenance cost of power generation device |
| Pb | the installed capacity of biomass power generation system |
| Pc | the installed capacity of coal power generation system |
| Pcrop | standard coal equivalent of crops |
| Pe | energy output of different crops |
| Plivestock | standard coal equivalent of livestock manure |
| Ps | the installed capacity of solar power generation system |
| Pw | the installed capacity of wind power generation system |
| Q | heat release of standard coal |
| Ri | ratio of grass to grain |
| Spi | residual present value of power generation device |
| T | total standard coal consumption |
| Tcl | converted standard coal coefficient |
| U | greenhouse gas emission intensity |
| Wi | the output of the main product |
| Z | conversion coefficient of biogas into standard coal |
| fb | biomass fuel cost |
| fc | fuel cost of coal power |
| h | the height of the solar panel |
| l | the length of the solar panel |
| w | the width of the solar panel |
| Greek symbols | |
| α | interannual attenuation coefficient |
| ηs | system efficiency of the solar power |
| ηp | solar power conversion efficiency |
| γ | bank interest rate |
| β | inflation rate |
| φi | coal or biomass consumption |
| Abbreviations | |
| ASPP | atrous spatial pyramid pooling |
| CCS | carbon capture and storage |
| CNN | convolutional neural network |
| CO2 | carbon dioxide |
| CP | coal-fired power |
| GHG | greenhouse gas |
| H_ | high growth rate of electricity demand |
| IGCC | integrated gasification combined cycle |
| LHV | power heating value |
| L_ | low growth rate of electricity demand |
| M_ | medium growth rate of electricity demand |
| NOx | nitrogen oxides |
| SO2 | sulfur dioxide |
| WSB | wind–solar–biomass |
| WSBC | wind–solar–biomass–coal |
Appendix A
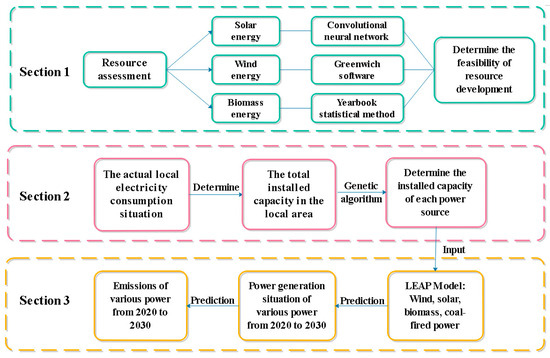
Figure A1.
Logical flowchart of the work.
Table A1.
A comparison table of this study with previous studies.
Table A1.
A comparison table of this study with previous studies.
| Reference | Resource Assessment | Optimization | Carbon Prediction | Integration Level |
|---|---|---|---|---|
| [18,19,20,21,22,23,24] | √ | Single aspect | ||
| [25,26,27] | √ | Single aspect | ||
| [28,29] | √ | Single aspect | ||
| This work | √ | √ | √ | Full integration |
References
- Pani, A.; Shirkole, S.S.; Mujumdar, A.S. Importance of renewable energy in the fight against global climate change. Dry. Technol. 2022, 40, 2581–2582. [Google Scholar] [CrossRef]
- Gupta, N.C.; Tanwar, R.; Dipesh; Kaushik, A.; Singh, R.; Patra, A.K.; Sar, P.; Khakharia, P. Perspectives on CCUS deployment on large scale in India: Insights for low carbon pathways. Carbon Capture Sci. Technol. 2024, 12, 100195. [Google Scholar] [CrossRef]
- Hu, D.; Zhang, S.; Han, T.; Zheng, X.; Gu, Y.; Xu, D. Research on the low carbon transformation path of power generation underthe goal of carbon neutralization. Clean Coal Technol. 2022, 28, 23–33. [Google Scholar]
- Zhang, H.; Tomasgard, A.; Knudsen, B.R.; Svendsen, H.G.; Bakker, S.J.; Grossmann, I.E. Modelling and analysis of offshore energy hubs. Energy 2022, 261, 125219. [Google Scholar] [CrossRef]
- Guo, H.; Cui, J.; Li, J. Biomass power generation in China: Status, policies and recommendations. Energy Rep. 2022, 8, 687–696. [Google Scholar] [CrossRef]
- Kant, G.; Hasan, A.; Yadav, P.; Pandey, A.; Srivastava, S. The generational shift in biofuels: A path toward sustainable energy solutions. Biomass Bioenergy 2025, 196, 107757. [Google Scholar] [CrossRef]
- Babu, S.; Singh Rathore, S.; Singh, R.; Kumar, S.; Singh, V.K.; Yadav, S.K.; Yadav, V.; Raj, R.; Yadav, D.; Shekhawat, K.; et al. Exploring agricultural waste biomass for energy, food and feed production and pollution mitigation: A review. Bioresour. Technol. 2022, 360, 127566. [Google Scholar] [CrossRef] [PubMed]
- Zhou, W.; Lou, C.; Li, Z.; Lu, L.; Yang, H. Current status of research on optimum sizing of stand-alone hybrid solar–wind power generation systems. Appl. Energy 2010, 87, 380–389. [Google Scholar] [CrossRef]
- Khurshid, H.; Mohammed, B.S.; Al-Yacouby, A.M.; Liew, M.S.; Zawawi, N.A.W.A. Analysis of hybrid offshore renewable energy sources for power generation: A literature review of hybrid solar, wind, and waves energy systems. Dev. Built Environ. 2024, 19, 100497. [Google Scholar] [CrossRef]
- Cheng, Y.; Shao, Z.; Zhang, J.; Gao, P.; Liu, S.; Wei, Z. Planning and design of thermal power and wind solar storage coupling. Clean Coal Technol. 2022, 28, 82–89. [Google Scholar]
- Jia, Y.; Xia, B.; Shi, Z.; Chen, W.; Zhang, L. Distributed risk-averse optimization scheduling of hybrid energy system with complementary renewable energy generation. Energies 2025, 18, 1405. [Google Scholar] [CrossRef]
- Rahul, S.; Goyal, V. A hybrid model of solar-wind—Biomass power generation system: A review. In Proceedings of the 2015 2nd International Conference on Computing for Sustainable Global Development (INDIACom), New Delhi, India, 11–13 March 2015; IEEE: New York, NY, USA, 2015; pp. 1201–1203. [Google Scholar]
- Zhang, G.; Shen, L.; Su, B. Temperature change and daily urban-rural residential electricity consumption in northwestern China: Responsiveness and inequality. Energy Econ. 2023, 126, 106973. [Google Scholar] [CrossRef]
- Li, C.; Zhang, L.; Qiu, F.; Fu, R. Optimization and enviro-economic assessment of hybrid sustainable energy systems: The case study of a photovoltaic/biogas/diesel/battery system in Xuzhou, China. Energy Strategy Rev. 2022, 41, 100852. [Google Scholar] [CrossRef]
- Li, C.; Zhou, D.; Wang, H.; Cheng, H.; Li, D. Feasibility assessment of a hybrid PV/diesel/battery power system for a housing estate in the severe cold zone-A case study of Harbin, China. Energy 2019, 185, 671–681. [Google Scholar] [CrossRef]
- Mobarra, M.; Rezkallah, M.; Ilinca, A. Variable Speed Diesel Generators: Performance and Characteristic Comparison. Energies 2022, 15, 592. [Google Scholar] [CrossRef]
- Agrawal, S.; Harish, S.P.; Mahajan, A.; Thomas, D.; Urpelainen, J. Influence of improved supply on household electricity consumption-Evidence from rural India. Energy 2020, 211, 118544. [Google Scholar] [CrossRef]
- Jiao, H.; Zhao, X.; Chen, J.; Guo, Y. Roof photovoltaic development potential assessment based on deep learning of remote sensing image. In Proceedings of the 2022 IEEE/IAS Industrial and Commercial Power System Asia (I&CPS Asia), Shanghai, China, 8–11 July 2022; pp. 1298–1301. [Google Scholar]
- Tao, H.; He, G.; Wang, G.; Yang, R.; Peng, X.; Yin, R. An information extraction method for industrial and commercial rooftop photovoltaics based on GaoFen-7 remote sensing images. Remote Sens. 2023, 15, 5744. [Google Scholar] [CrossRef]
- Hartwig, D.; Chen, S.; Hung, V.; Liu, J. The wind energy potential in Jilin province, China. J. Nat. Resour. 2005, 20, 684–689. [Google Scholar]
- Wan, J.; Zheng, F.; Luan, H.; Tian, Y.; Li, L.; Ma, Z.; Xu, Z.; Li, Y. Assessment of wind energy resources in the urat area using optimized weibull distribution. Sustain. Energy Technol. Assess. 2021, 47, 101351. [Google Scholar] [CrossRef]
- Zhou, X.; Wang, F.; Hu, H.; Yang, L.; Guo, P.; Xiao, B. Assessment of sustainable biomass resource for energy use in China. Biomass Bioenergy 2011, 35, 1–11. [Google Scholar] [CrossRef]
- Zhou, Y.; Wang, J.; Wang, S.; Xi, F.; Bing, L.; Yan, Y.; Hu, Q.; Zhang, L. Assessment of biomass resources for energy use potential in China. Chin. J. Ecol. 2024, 43, 2702–2713. [Google Scholar]
- Liu, S.; Pan, J.; Shan, M.; Liu, Y.; Jiang, T.; Yang, X. Quantitative assessment and energy substitution of biomass resources in China under the carbon peaking and carbon neutrality goals. Environ. Ecol. 2024, 6, 37–42. [Google Scholar]
- Khemissi, L.; Khiari, B.; Sellami, A. A novel optimal planning methodology of an autonomous Photovoltaic/Wind/Battery hybrid power system by minimizing economic, energetic and environmental objectives. Int. J. Green Energy 2021, 18, 1064–1080. [Google Scholar] [CrossRef]
- Ren, Y.; Sun, K.; Zhang, K.; Han, Y.; Zhang, H.; Wang, M.; Jing, X.; Mo, J.; Zou, W.; Xing, X. Optimization of the capacity configuration of an abandoned mine pumped storage/wind/photovoltaic integrated system. Appl. Energy 2024, 374, 124089. [Google Scholar] [CrossRef]
- Heydari, A.; Alborzi, Z.S.; Amini, Y.; Hassanvand, A. Configuration optimization of a renewable hybrid system including biogas generator, photovoltaic panel and wind turbine: Particle swarm optimization and genetic algorithms. Int. J. Mod. Phys. C 2022, 34, 2350069. [Google Scholar] [CrossRef]
- Chen, H.; Pang, K.; Liao, P.; Zhou, H.; Zhang, Q.; Pan, F.; Yang, H. Scenario simulation of coordinated emission reduction of greenhouse gases and pollutants in power sources in Gansu Province based on the LEAP model. J. Lanzhou Univ. (Nat. Sci.) 2023, 59, 727–734. [Google Scholar]
- Cai, L.; Luo, J.; Wang, M.; Guo, J.; Duan, J.; Li, J.; Li, S.; Liu, L.; Ren, D. Pathways for municipalities to achieve carbon emission peak and carbon neutrality: A study based on the LEAP model. Energy 2023, 262, 125435. [Google Scholar] [CrossRef]
- Ban, C.; Hong, T.; Jeong, K.; Koo, C.; Jeong, J. A simplified estimation model for determining the optimal rooftop photovoltaic system for gable roofs. Energy Build. 2017, 151, 320–331. [Google Scholar] [CrossRef]
- Obaid, A.H.; Mahdi, E.J.; Hassoon, I.A.; Hussein, H.F.; Jasime, A.A.A.-S.; Jafarf, A.N.; Abdulghanig, A.S. Evaluation of degradation factor effect on solar panels performance after eight years of life operation. Arch. Thermodyn. 2024, 45, 221–226. [Google Scholar] [CrossRef]
- Fang, Y.R.; Hossain, M.S.; Peng, S.; Han, L.; Yang, P. Sustainable energy development of crop straw in five southern provinces of China: Bioenergy production, land, and water saving potential. Renew. Energy 2024, 224, 120134. [Google Scholar] [CrossRef]
- Avcıoğlu, A.O.; Dayıoğlu, M.A.; Türker, U. Assessment of the energy potential of agricultural biomass residues in Turkey. Renew. Energy 2019, 138, 610–619. [Google Scholar] [CrossRef]
- Wang, W.; Porninta, K.; Aggarangsi, P.; Leksawasdi, N.; Li, L.; Chen, X.; Zhuang, X.; Yuan, Z.; Qi, W. Bioenergy development in Thailand based on the potential estimation from crop residues and livestock manures. Biomass Bioenergy 2021, 144, 105914. [Google Scholar] [CrossRef]
- Zhang, Y.; Shao, L.; Leng, S.; Pang, L.; Jiang, K.; Wang, L. Assessment of livestock and poultry excrement resources in Shandong and its fertilizer and energy utilization potential. China Biogas 2019, 37, 93–99. [Google Scholar]
- Afazeli, H.; Jafari, A.; Rafiee, S.; Nosrati, M. An investigation of biogas production potential from livestock and slaughterhouse wastes. Renew. Sustain. Energy Rev. 2014, 34, 380–386. [Google Scholar] [CrossRef]
- Wang, L.; Singh, C. Multicriteria design of hybrid power generation systems based on a modified particle swarm optimization algorithm. IEEE Trans. Energy Convers. 2009, 24, 163–172. [Google Scholar] [CrossRef]
- Lv, Z.; Chen, W.; Wang, Y.; Zhuang, H. Particle swarm algorithm based hybrid energy generation capacity allocation research for urban buildings. In Proceedings of the 2023 4th International Conference on Advanced Electrical and Energy Systems (AEES), Shanghai, China, 1–3 December 2023; pp. 823–829. [Google Scholar]
- Zeng, Y.; Dai, Y.; Wang, J. Capacity optimization of regional integrated energy system for carbon target based on improved NSGA-III. Manuf. Autom. 2022, 5, 134–139. [Google Scholar]
- Zhou, Y.; Yuan, H. Economic evaluation of coal power generation and photovoltaic power generation technologies in China. J. Technol. Econ. Manag. 2020, 12, 97–102. [Google Scholar]
- Fan, J.L.; Wei, S.; Yang, L.; Wang, H.; Zhong, P.; Zhang, X. Comparison of the LCOE between coal-fired power plants with CCS and main low-carbon generation technologies: Evidence from China. Energy 2019, 176, 143–155. [Google Scholar] [CrossRef]
- Zhang, Y.; Hu, W.; Yao, W.; Li, X.; Hu, J. A multi-objective particle swarm optimization based on local ideal points. Appl. Soft Comput. 2024, 161, 111707. [Google Scholar] [CrossRef]
- Yang, W.; Song, J. Simulating optimal development of clean coal-fired power generation for collaborative reduction of air pollutant and CO2 emissions. Sustain. Prod. Consum. 2021, 28, 811–823. [Google Scholar] [CrossRef]
- Zhang, D.; Shi, J.; Yang, H.; Lv, J.; Zhang, M.; Huang, Z.; Li, S. Prospect of biomass power generation under the background of carbon pricing. Clean Coal Technol. 2022, 28, 23–31. [Google Scholar]
Disclaimer/Publisher’s Note: The statements, opinions and data contained in all publications are solely those of the individual author(s) and contributor(s) and not of MDPI and/or the editor(s). MDPI and/or the editor(s) disclaim responsibility for any injury to people or property resulting from any ideas, methods, instructions or products referred to in the content. |
© 2025 by the authors. Licensee MDPI, Basel, Switzerland. This article is an open access article distributed under the terms and conditions of the Creative Commons Attribution (CC BY) license (https://creativecommons.org/licenses/by/4.0/).