Abstract
CO2 geo-storage is a promising approach in reducing greenhouse gas emissions and controlling global temperature rise. Although numerous studies have reported that offshore saline aquifers have greater storage potential and safety, current suitability evaluation models for CO2 geo-storage primarily focus on onshore saline aquifers, and site-level evaluations for offshore CO2 geo-storage remain unreported. In this study, we propose a framework to evaluate the site-level offshore CO2 geo-storage suitability with a multi-tiered indicator system, which considers three types of factors: engineering geology, storage potential, and socio-economy. Compared to the onshore CO2 geo-storage suitability evaluation models, the proposed indicator system considers the unique conditions of offshore CO2 geo-storage, including water depth, offshore distance, and distance from drilling platforms. The Analytic Hierarchy Process (AHP) and Fuzzy Comprehensive Evaluation (FCE) methods were integrated and applied to the analysis of the Ying–Qiong Basin, South China Sea. The results indicated that the average suitability score in the Yinggehai Basin (0.762) was higher than that in the Qiongdongnan Basin (0.691). This difference was attributed to more extensive fault development in the Qiongdongnan Basin, suggesting that the Yinggehai Basin is more suitable for CO2 geo-storage. In addition, the DF-I reservoir in the Yinggehai Basin and the BD-A reservoir in the Qiongdongnan Basin were selected as the optimal CO2 geo-storage targets for the two sub-basins, with storage potentials of 1.09 × 10⁸ t and 2.40 × 10⁷ t, respectively. This study advances the methodology for assessing site-level potential of CO2 geo-storage in offshore saline aquifers and provides valuable insights for engineering applications and decision-making in future CO2 geo-storage projects in the Ying–Qiong Basin.
1. Introduction
With the increasing severity of global climate change, reducing greenhouse gas emissions has emerged as a global objective [1,2,3]. Carbon dioxide (CO2), as the dominant contributor of greenhouse gas emissions, holds a crucial role in mitigating climate change through emission reduction efforts [4,5,6]. Climate change, driven by the rapid rise in atmospheric CO2 levels, has become one of the most urgent global environmental challenges of the 21st century [7,8]. To mitigate the adverse effects of greenhouse gas emissions, various Carbon Capture, Utilization, and Storage (CCUS) technologies have been developed and implemented worldwide. CCUS technologies utilize underground geological structures such as depleted oil and gas reservoirs, basaltic formations, unmineable coal seams, and deep saline aquifers [9,10]. Among these, the storage of CO2 in deep saline aquifers is considered a promising strategy for reducing CO2 emissions while maintaining energy security due to their widespread distribution, large storage potential, and relatively low risk [11,12]. However, the global implementation of CCUS technology remains in its early stages, constrained by challenges related to technological readiness, economic feasibility, policy frameworks, and potential leakage-factors that could impact the environment.
Numerous frameworks and evaluation systems for assessing the suitability of CO2 geo-storage have been established worldwide. For example, Bachu et al. (2003) proposed 15 relevant standards of storage site selection at a basin-level in Alberta [13]. Li et al. (2016) established an evaluation index system with 28 indicators by integrating the Analytic Hierarchy Process and index overlay methods in the Xining Basin in Northwest China [6,14]. Qin et al. (2023) assessed the CO2 storage potential of offshore saline aquifers in China [4]. Tian et al. (2024) evaluated the zone-level CO2 sequestration potential of saline aquifers in the Qiongdongnan–Yinggehai Basin [12]. In terms of evaluation approaches, multiple decision-making tools were utilized to evaluate the suitability of CO2 geo-storage, such as Fuzzy Comprehensive Evaluation (FCE), Technique for Order of Preference by Similarity to Ideal Solution (TOPSIS), the Compromise Ranking Method (CRM), and Gray Relational Analysis (GRA) [15,16,17]. Among these, FCE is particularly notable for its robustness and widespread adoption [18,19,20]. A pivotal step in this assessment process involves the assignment of indicator weights. Subjective weighting approaches commonly include the Analytic Hierarchy Process (AHP), Network Analysis, and Decision-Making Lab [18], whereas objective techniques comprise the Entropy Method, CRITIC Method, Principal Component Analysis (PCA), and Factor Analysis [17].
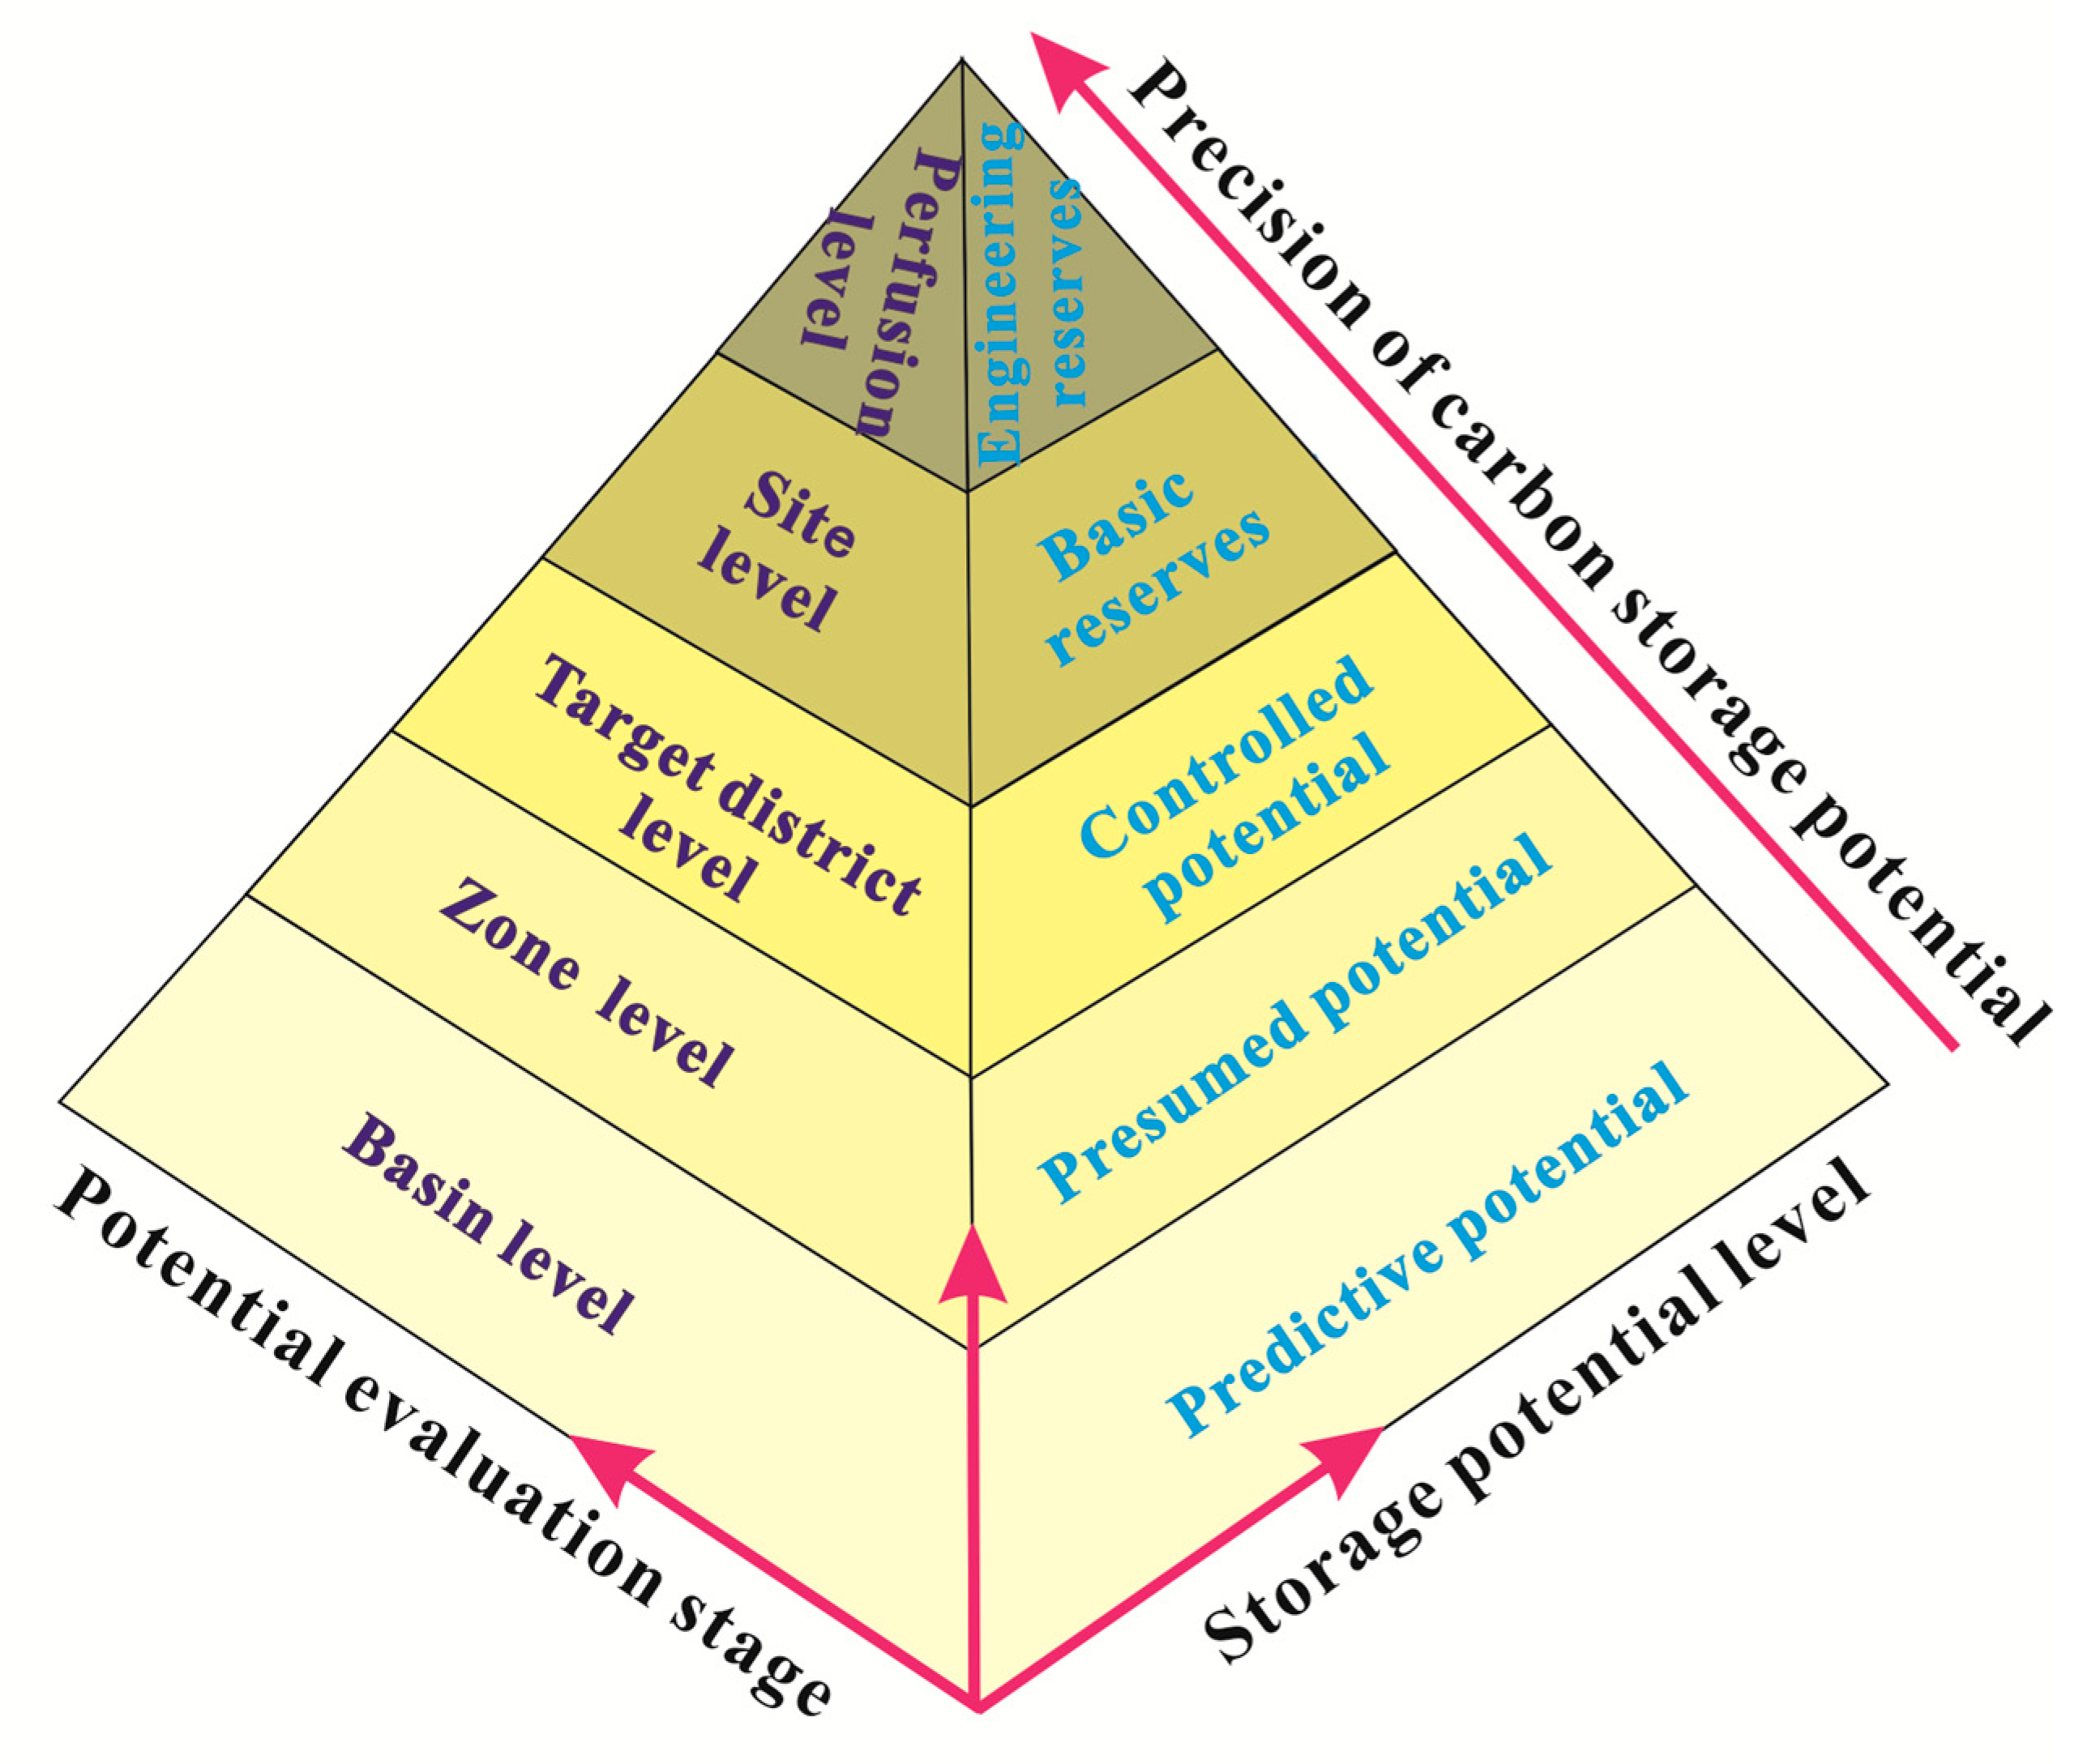
Despite the substantial thickness of saline aquifers in China’s offshore basins, which enables potential large-scale CO2 geo-storage, site-scale geological characteristics and storage suitability remain underexplored [21]. The Ying–Qiong Basin, located in the South China Sea, is a sedimentary basin with significant potential for CO2 geo-storage due to its unique geological characteristics [22,23,24]. The Ying–Qiong Basin is characterized by thick sedimentary sequences, extensive subsurface brine layers, and relatively stable geological conditions, which make it a favorable candidate for CO2 geo-storage [25]. The deep saline aquifers in the Ying–Qiong Basin, with their high pressure and low permeability, provide a natural seal to prevent the leakage of injected CO2, thus offering a safe and effective medium for geo-storage [21,26]. The assessment of CO2 geo-storage potential in saline aquifers worldwide typically follows a tiered evaluation approach [27], which classifies storage potential into predictive potential, presumed potential, controlled potential, basic reserves, and engineering reserves [12], as illustrated in Figure 1. However, due to limited data availability, previous studies on the Ying–Qiong Basin have primarily focused on basin-level and zone-level evaluations of CO2 geo-storage potential, which constrain a deeper understanding of site-level selection and injection feasibility. Additionally, achieving effective CO2 geo-storage first requires an accurate evaluation of its potential [28]. In this study, the Carbon Sequestration Leadership Forum (CSLF) methodology [4,29] is employed to calculate the CO2 geo-storage potential at the site level, providing technical foundations for suitability evaluation of CO2 geo-storage in the deep saline aquifers within the Ying–Qiong Basin.

Figure 1.
Hierarchical scheme for evaluating the sequestration potential of saline aquifers.
This study quantitatively evaluates the CO2 storage potential of the Ying–Qiong Basin based on 24 favorable reservoirs identified by the China National Offshore Oil Corporation (CNOOC) (Beijing, China). Additionally, the storage suitability of the 24 favorable reservoirs is assessed by integrating geological conditions, engineering constraints, and socio-economic factors through a comprehensive geological analysis employing the Analytic Hierarchy Process (AHP) and Fuzzy Comprehensive Evaluation (FCE) methods. The evaluation results offer valuable decision support for CO2 geo-storage in the Ying–Qiong Basin and serve as a reference for CO2 geo-storage assessments in similar offshore basins. Additionally, this research provides a scientific basis for developing the CCUS strategies in the South China Sea, supporting global efforts to mitigate climate change.
2. Regional Geological Features of the Ying–Qiong Basin
2.1. Geological Setting
The Yinggehai Basin, situated in the southern section of the Red River fault zone at the convergence of the Indian, Eurasian, and Pacific plates, spans an area of approximately km2 [30,31]. It primarily consists of the Yinggehai Depression, Lingao Uplift, and the Western and Eastern Slopes, as shown in Figure 2a. The Qiongdongnan Basin, Hainan Island, and the Beibu Gulf Basin are located to the east of the Yinggehai Basin [32,33]. The basin is characterized by low seismicity, high crustal stability, and shallow water environments, which maintain seafloor temperatures averaging 24 °C [30,34]. Geothermal gradients range from 31 to 43 °C/km, with values of approximately 39 °C/km along the Eastern Slopes and 36 °C/km within the central depression [12].
The Qiongdongnan Basin is located in the northern continental shelf of the South China Sea, between Hainan Island and the Xisha Islands, covering an area of km2 [35,36], as shown in Figure 2b. The basin exhibits minimal seismic activity and remarkable crustal stability, with moderate geothermal gradients averaging 40 °C/km [24,37]. Notably, geothermal gradients demonstrate spatial variability (25–61 °C/km), with regional averages of 39 °C/km in the central uplift, 40 °C/km in the central depression, and 37 °C/km in the northern depression [12].
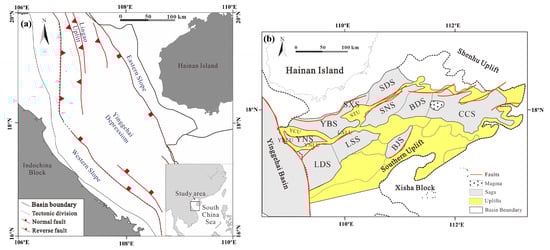
Figure 2.
(a) Tectonic settings of the Yinggehai Basin (Revised from Liu et al. (2019) [26]); (b) tectonic settings of the Qiongdongnan Basin (revised from Zhao et al. (2015) [36]).
Figure 2.
(a) Tectonic settings of the Yinggehai Basin (Revised from Liu et al. (2019) [26]); (b) tectonic settings of the Qiongdongnan Basin (revised from Zhao et al. (2015) [36]).
2.2. Carbon Storage Conditions
To ensure that the injected CO2 remains in a supercritical state (, ), this study defines an upper depth threshold of 1000 m for CO2 storage in deep saline aquifers of the Ying–Qiong Basin. Additionally, Zhang, Zhou [24] demonstrated that reservoirs deeper than 3500 m are unsuitable for CO2 storage due to excessive overpressure and significant compaction, which would hinder CO2 injection and storage. Within this interval, the T27–T30 sequence in the Yinggehai Basin and the T40–T70 sequence in the Qiongdongnan Basin are identified as suitable formations for CO2 geo-storage. Furthermore, a suitable pressure gradient is crucial for CO2 geo-storage, as the pressure build-up in the storage formation must not exceed the maximum tolerable gradient required to maintain the geomechanical integrity of the caprock [38,39]. Section S1 in the Supplementary Materials presents the contour map of the pressure coefficient of the Yinggehai Basin and Qiongdongnan Basin. Based on the pressure gradient distributions in the Ying–Qiong Basin, a threshold of 1.2 is considered suitable for CO2 geo-storage. By integrating sedimentary facies distributions and logging curves with the aforementioned screening criteria, the China National Offshore Oil Corporation (CNOOC) has identified 13 reservoirs in the Yinggehai Basin and 11 in the Qiongdongnan Basin, totaling 24 candidate reservoirs. Table 1 summarizes the detailed information about these reservoirs. Detailed information about the logging curves in the corresponding reservoirs are illustrated in Section S2 in the Supplementary Materials.

Table 1.
Detailed information of 24 identified favorable reservoirs.
2.3. Evaluation of CO2 Storage Potential
The Carbon Sequestration Leadership Forum (CSLF) methodology categorizes CO2 storage potential in saline aquifers into three distinct mechanisms: structural/stratigraphic trapping, residual gas trapping, and solubility trapping [10,40]. The storage potential for each mechanism is quantified through the following equations [4,41]:
where is the area of the saline aquifer [L2]; is the effective thickness of the saline aquifer [L]; is the average porosity of the saline aquifer [−]; is the density of CO2 under reservoir conditions [ML−3]; is the theoretical structural storage capacity of CO2 in the saline aquifer [M]; is the CO2 saturation of trapped brackish water after return flow [−]; is the theoretical dissolved storage capacity [M]; is the density of formation water when saturated with CO2 [ML−3]; is the density of initial formation water [ML−3]; is the average mass fraction of CO2 when the formation water is saturated with CO2 [−]; is the average mass fraction of CO2 in the initial formation water [−]; is the CO2 solubility in the saline aquifer [NV−1]; is the molar mass of CO2 [MN−1]; is the effective storage coefficient [−].
The CO2 density is determined by its actual temperature and pressure conditions when estimating effective CO2 storage potential in saline aquifers. In this study, the Span-Wagner model [42], widely recognized as the benchmark for CO2 density evaluation, is employed. Additionally, Monte Carlo simulations indicate that the effective coefficients of CO2 geo-storage in deep saline aquifers typically range from 0.01 to 0.04 within the 15–85% confidence interval [43]. These coefficients inherently depend on multiphase flow dynamics, formation geometry, reservoir heterogeneity, and well placements [11,44]. In this study, a value of 0.02 is adopted for computational simplification. Table 2 summarizes the calculated CO2 storage potential of the 24 identified reservoirs in the Ying–Qiong Basin.
Table 2.
Evaluation parameters for CO2 geological storage potential of the 24 identified favorable reservoirs.
3. Methods for Evaluating the Suitability of CO2 Storage
3.1. Analytic Hierarchy Process
The Analytic Hierarchy Process (AHP) is a structured decision-making framework designed to address complex, multi-level, and multi-criteria problems [45,46]. Through hierarchical decomposition, the AHP systematically divides decision elements into multiple hierarchical levels of indicators, with hierarchical weights calculated through qualitative index fuzzy quantization. The weight of each element within each hierarchy is determined by computing the eigenvectors of the judgment matrix. Considering that accurately assigning weighting values to different criteria simultaneously is challenging, as these criteria describe decision elements from different perspectives. In this case, pairwise comparisons and the AHP provide a simple and effective method for expert elicitation of criteria weights. By converting subjective judgments into quantifiable pairwise comparisons, this method mitigates evaluation uncertainties and establishes precise weight allocations for competing factors.
3.2. Fuzzy Comprehensive Evaluation
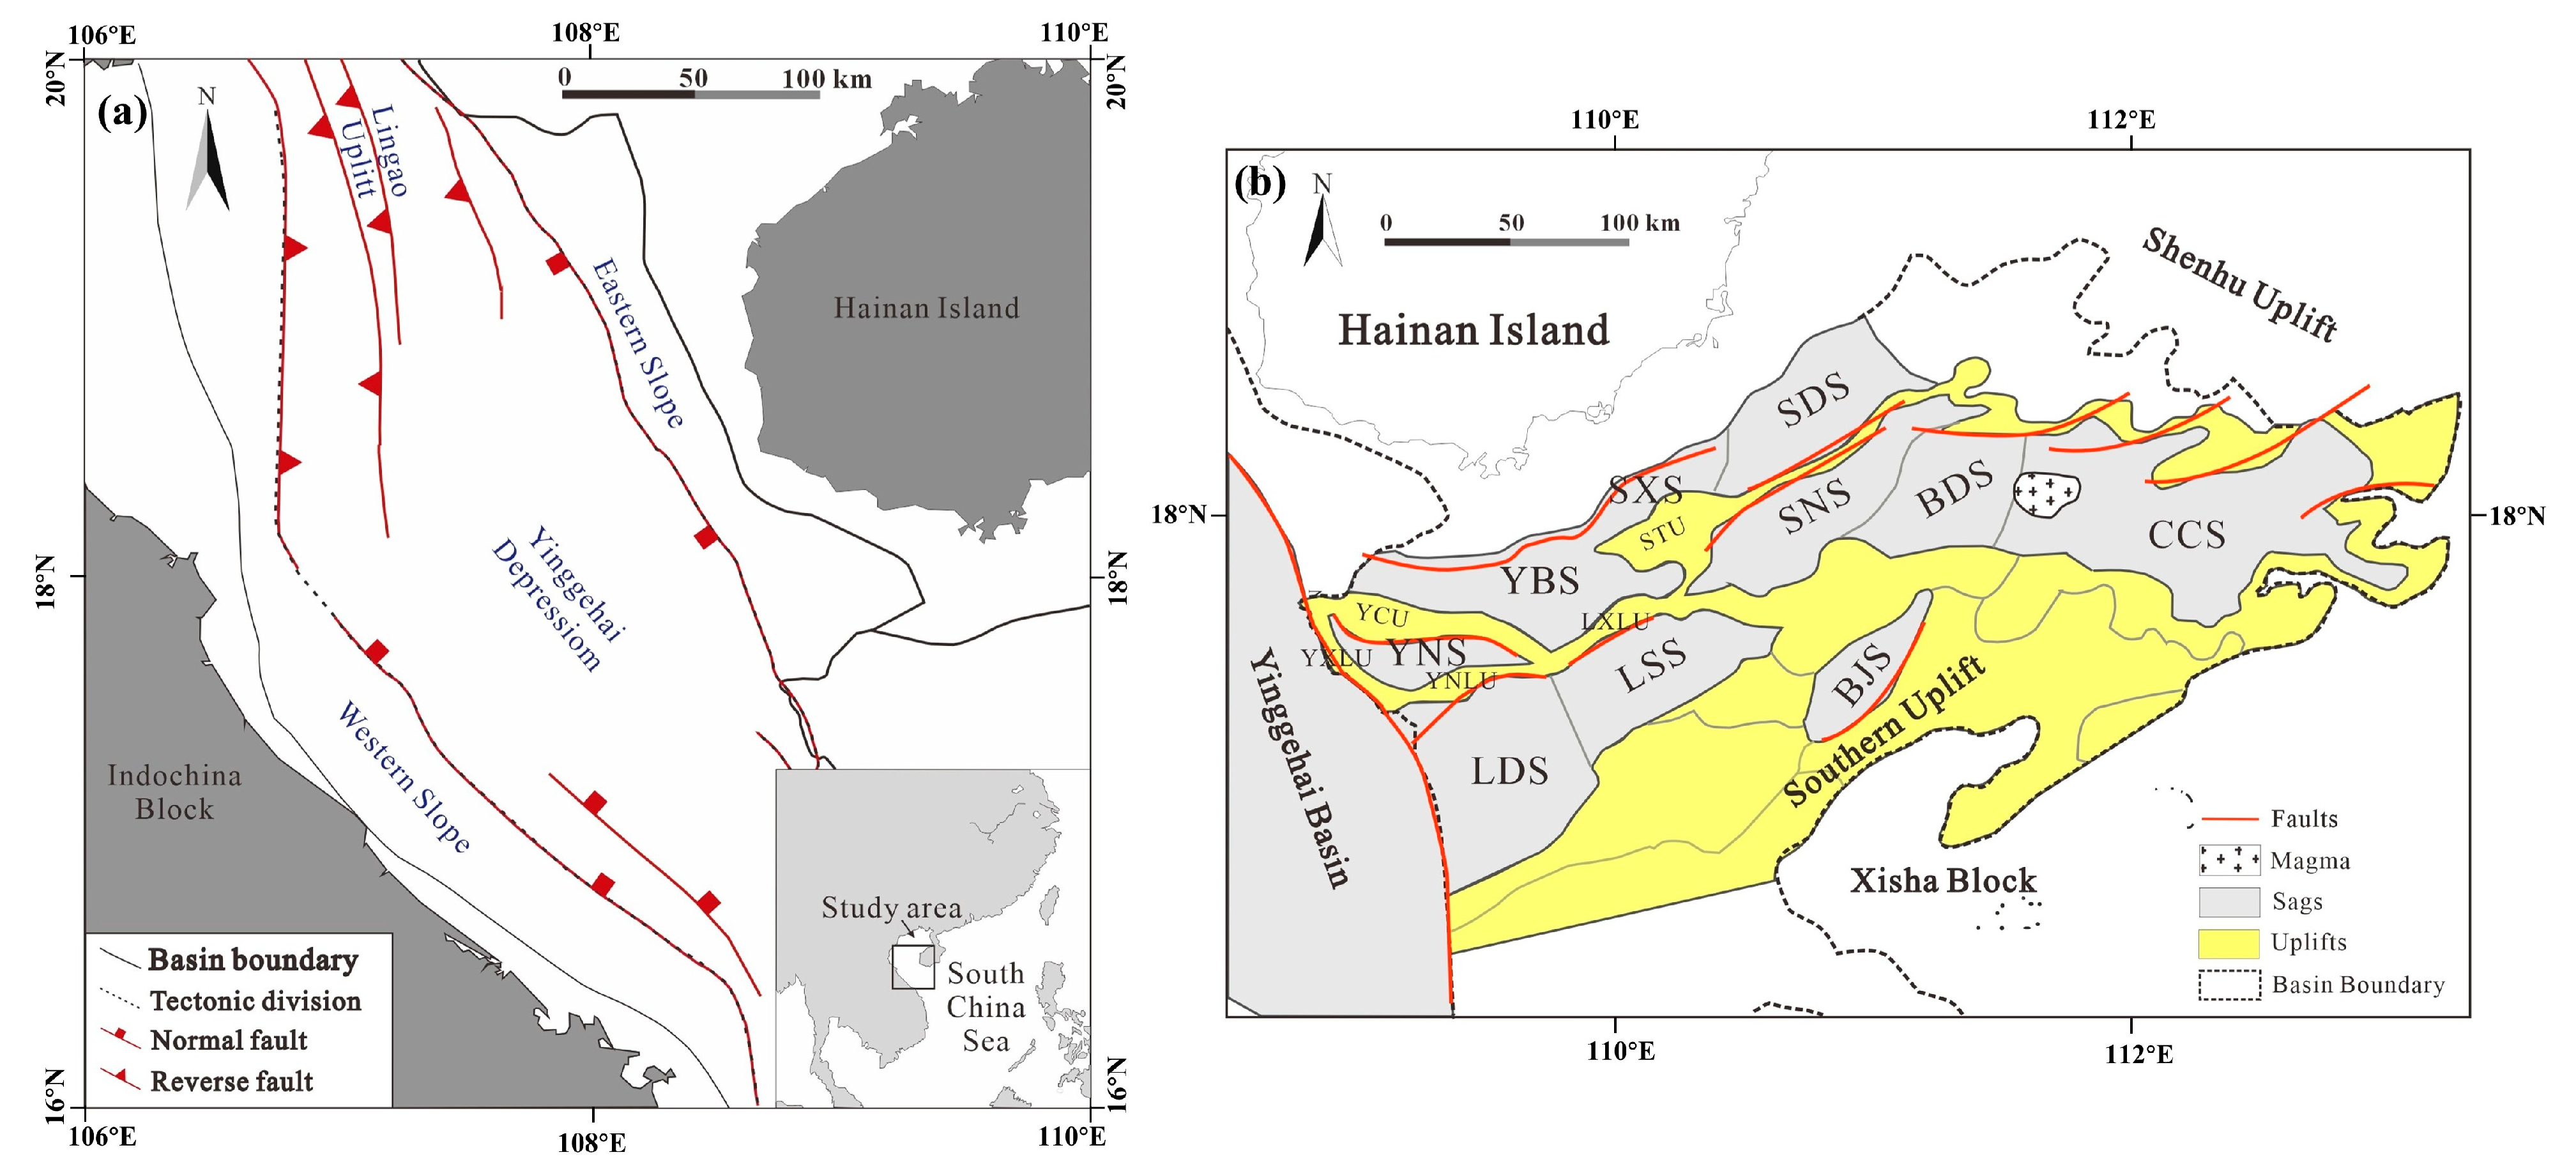
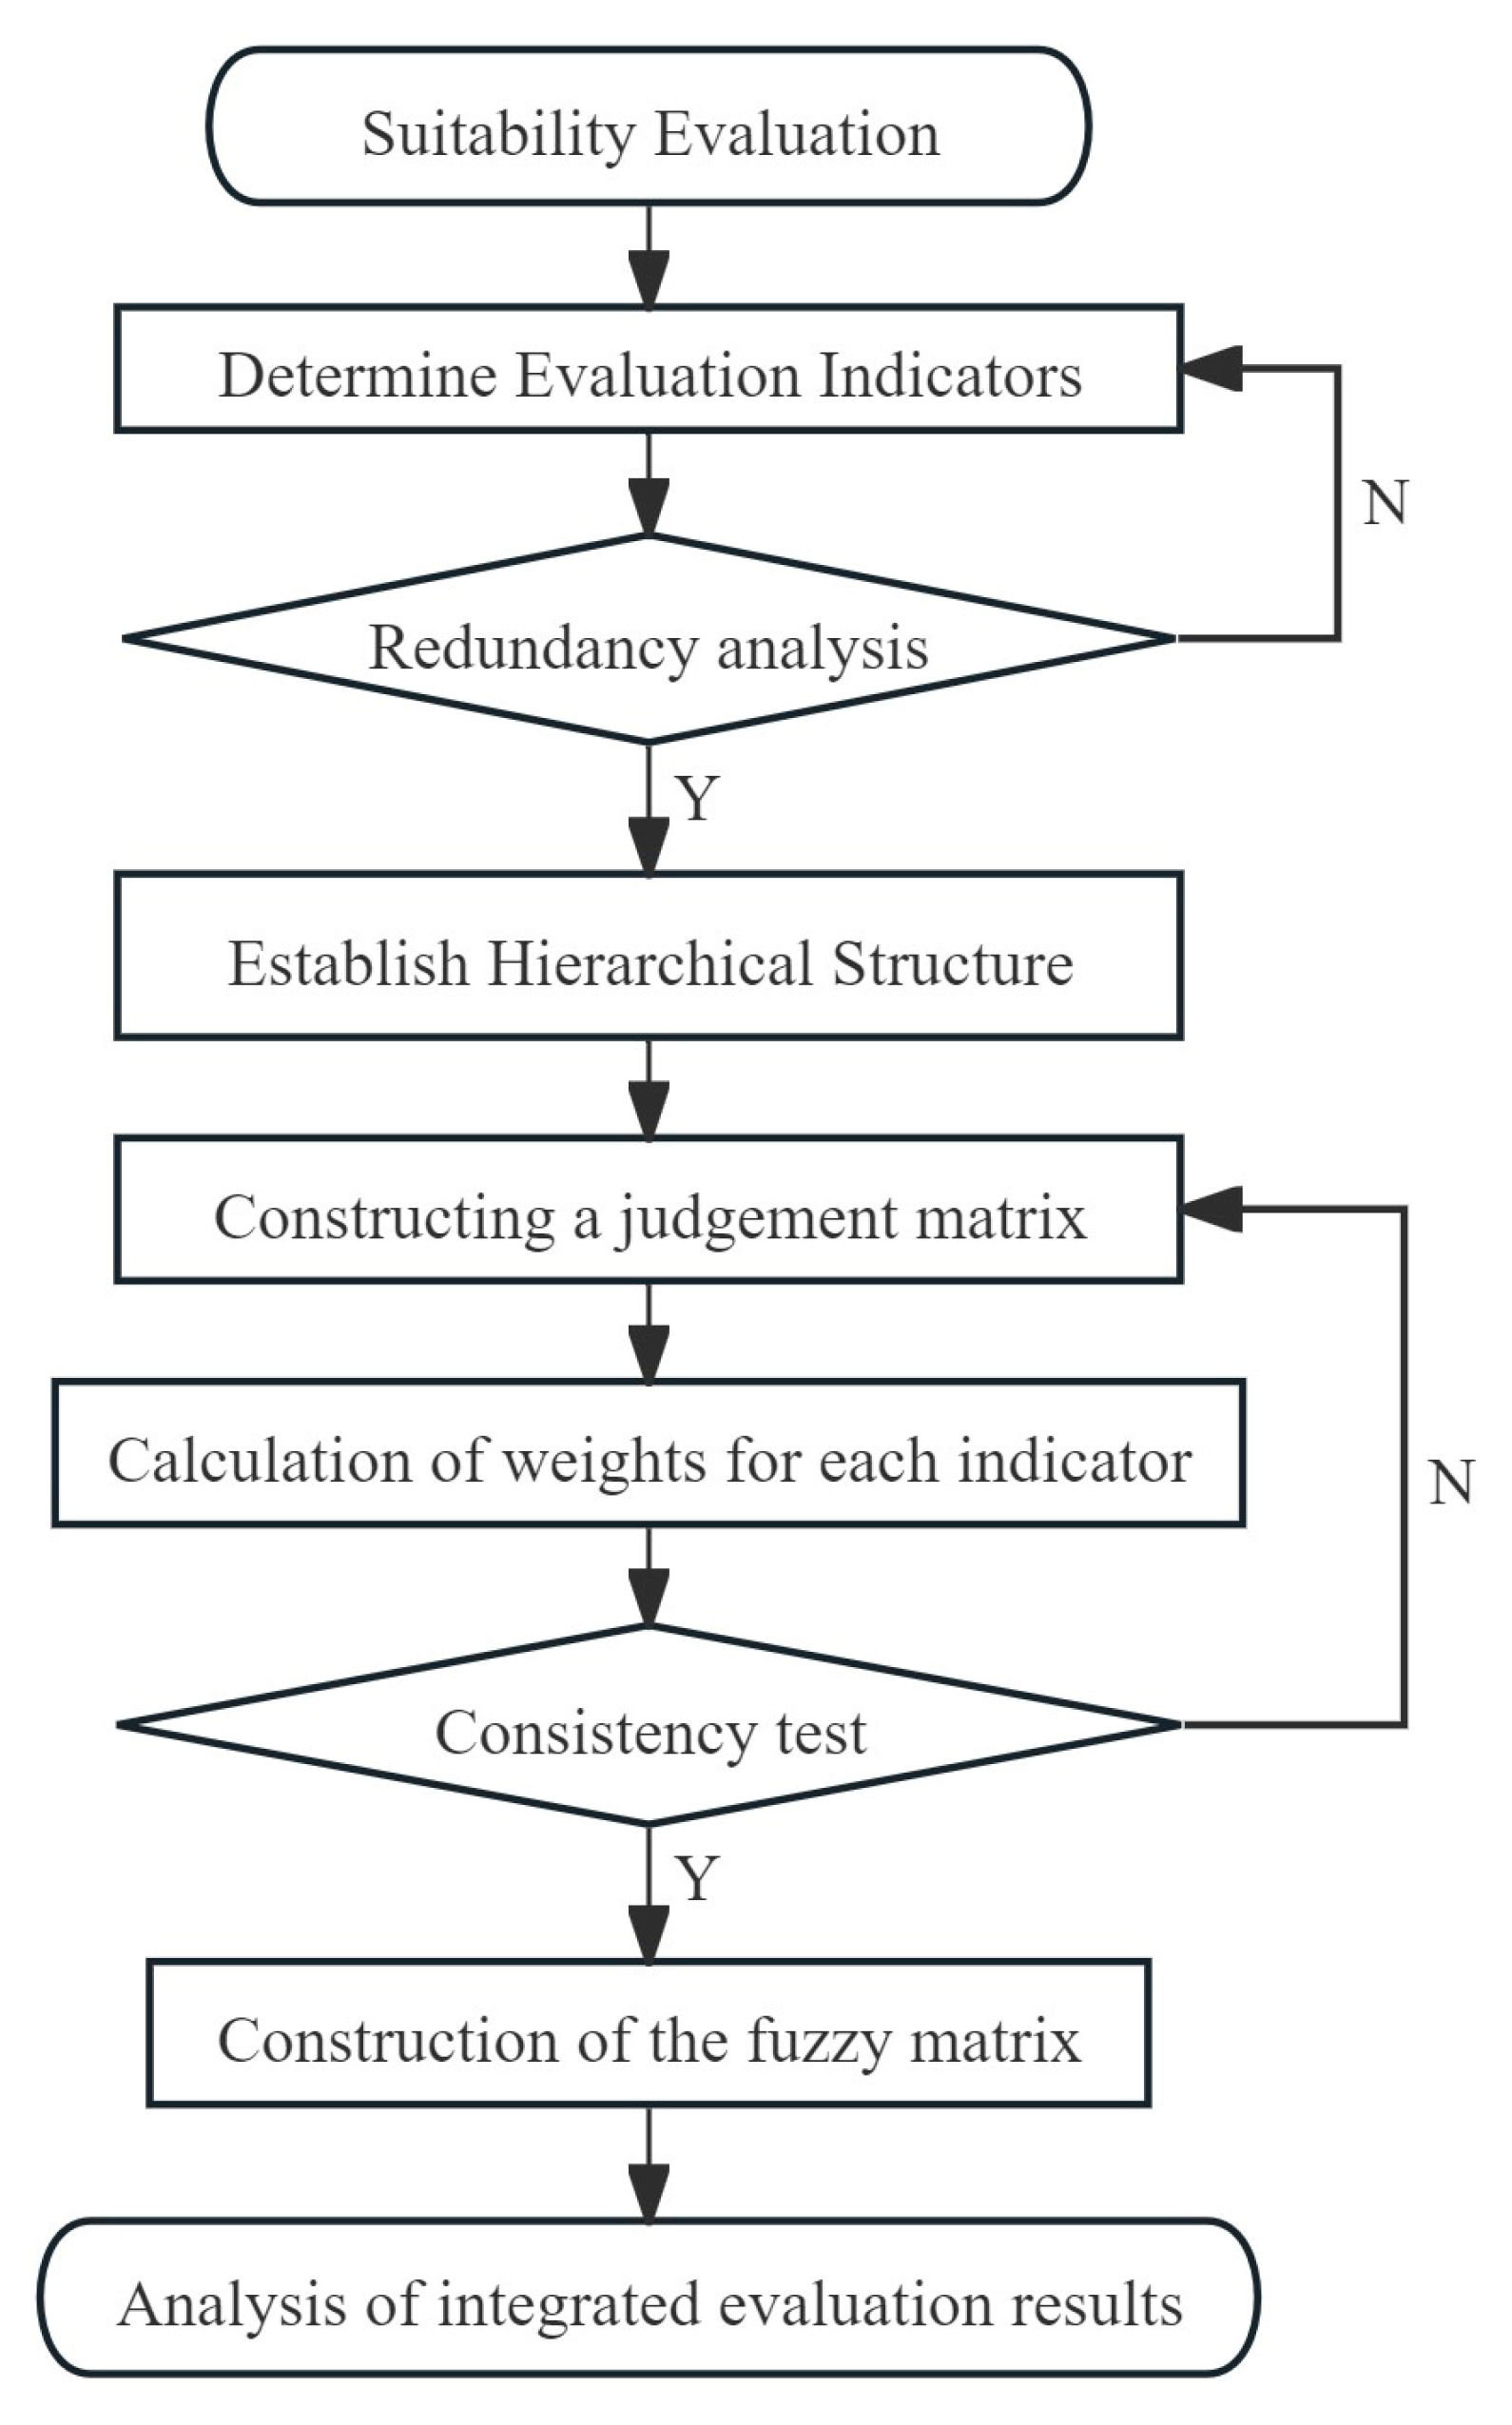
The Fuzzy Comprehensive Evaluation (FCE) method is a comprehensive evaluation method based on fuzzy mathematics and transforms qualitative evaluation into quantitative evaluation using the membership degree theory [47,48]. This method quantifies ambiguous factors using membership functions, constructs multidimensional evaluation sets, and integrates weighted vectors to derive a comprehensive evaluation. It provides clear results with strong systematicity, which is suitable for solving fuzzy and difficult-to-quantify problems, including various non-deterministic issues. The Fuzzy Comprehensive Evaluation method consists of four steps: establishing the Fuzzy Comprehensive Evaluation criteria, determining the weight vector, constructing the evaluation matrix, and combining the evaluation matrix with the weight vector. The weight vector was determined using the AHP. The complete evaluation process used in this study is illustrated in Figure 3.
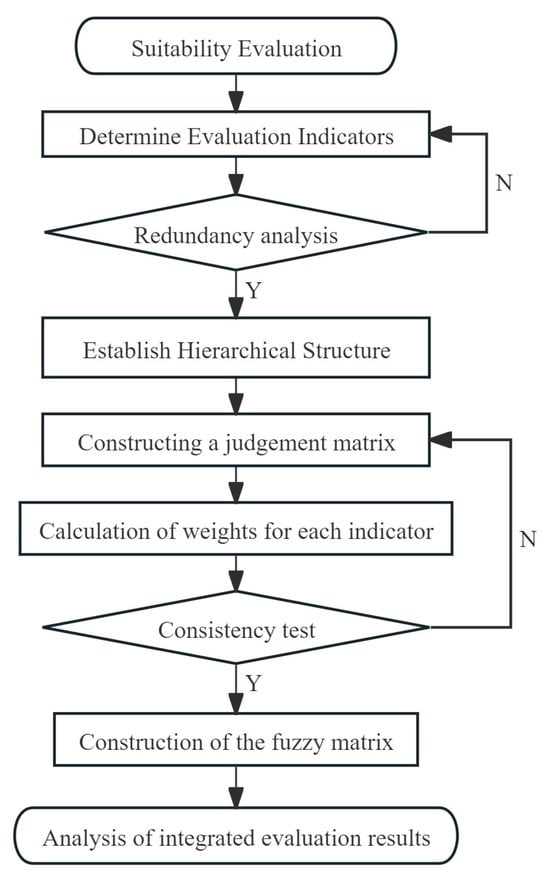
Figure 3.
General flow of the Fuzzy Comprehensive Evaluation method.
3.3. Evaluation Methodology and Steps
The key steps in applying AHP and FCE to determine the appropriate weights for selected criteria and perform a comprehensive evaluation are as follows.
3.3.1. Establishment of a System of Evaluation Indicators
Given that various indicators reflect the evaluation targets and exhibit complex causal relationships, a hierarchical structure should be chosen based on the complexity of the evaluation problem to identify the evaluation targets and influencing factors. This structure is then applied to analyze the factors influencing the evaluation targets and to establish a suitable evaluation indicator system.
3.3.2. Constructing a Judgment Matrix
The judgment matrix can be expressed as follows:
where the matrix elements and represent the relative importance between the two evaluation indicators.
In this study, we integrate field investigation data with expert knowledge to develop a framework for evaluating CO2 geo-storage suitability. A hierarchical analytical structure is established, and the relative importance of different levels and indicators is quantitatively assessed using the judgment matrix method, which enables precise determination of indicator weights.
3.3.3. Calculation of Weights for Each Indicator
Based on the judgment matrix and eigenvector, the weights are determined to quantify the importance of each indicator. The geometric mean of the elements of each row in the judgment matrix is computed to derive the dimensional eigenvector ():
The feature vector is standardly normalized to the weight vector ():
3.3.4. Consistency Test
To ensure the reliability of the computed weights, a consistency test is performed to minimize errors in assessing relative importance. The consistency ratio () serves as the evaluation criterion: if , the judgment matrix exhibits good consistency; if , significant inconsistency exists, requiring adjustment of the judgment matrix accordingly. Firstly, eigenvalue decomposition of the judgment matrix is performed to compute the maximum eigenvalue () and the consistency index ():
where is the order of the judgment matrix, and is the column vector of the normalized and row-accumulated weights. The average stochastic is obtained by simulating the generation of a random matrix.
The is calculated by comparing with to assess the rationality of the ranking weights:
The judgment matrix is regarded as consistent, and the ranking weights are considered acceptable when . The consistency test results of this study are shown in Table 3. It can be seen that the values of the judgment matrices for the indicator layer, first-level indicators, and the second-level indicators are all , indicating that the results have passed the consistency test and are acceptable.
Table 3.
Summary of consistency test calculation results for each level.
3.3.5. Construction of the Fuzzy Matrix
Given that all indicators in the multi-level indicator system are fuzzy when determining the membership degree, the membership degree of each level is used to reduce the fuzziness and ensure the accuracy of the results. Based on the established indicator system and criteria, the membership degree function of each evaluation indicator is determined to quantify its association with a specific level within the evaluation set. For a specific evaluation target, evaluation criteria are established to grade each indicator, and experts ( total) are requested to vote on each indicator individually based on these criteria. Each indicator factor is voted on and scored based on the evaluation criteria, and the number of experts who believe the -th indicator belongs to level is denoted as . The membership degree for each indicator can be calculated as , resulting in the fuzzy evaluation set. For the evaluation target, once the membership degrees of all indicators are determined, the fuzzy matrix is obtained:
The fuzzy matrix of each evaluation target is weighted according to the weights of all indicators to obtain the Fuzzy Comprehensive Evaluation set :
where is the membership degree of the -th suitability criterion.
3.3.6. Analysis of Integrated Evaluation Results
Each suitability evaluation indicator is assigned a standard score, which is then weighted and averaged according to the membership degree in the Fuzzy Comprehensive Evaluation set . The total score is calculated as
where is the comprehensive evaluation score of the -th evaluation target, and is the corresponding score of the -th suitability criterion. Following the evaluation procedure, the Fuzzy Comprehensive Evaluation set for each reservoir can be established, and the final ranking of reservoir suitability can be determined by calculating comprehensive scores.
4. Evaluation of the CO2 Geo-Storage Suitability
4.1. Robustness Analysis
In this section, we employed redundancy analysis to systematically evaluate the independence of CO2 geo-storage suitability evaluation system within the Ying–Qiong Basin. This approach involves constructing a correlation coefficient matrix (), where each element represents the correlation coefficient between the -th and -th indicators, while quantifies the overall system redundancy:
where denotes the number of evaluation objects, denotes the number of evaluation indicators, denotes the value of the -th index corresponding to the -th evaluation object, and represents the mean of the -th evaluation index.
Given the inherent complexity of geological storage site selection, the indicators within the suitability evaluation index system inevitably exhibit some interdependence. When the redundancy of the system falls below 0.5, the indicator system can be considered effectively free of redundant elements [49,50]. To quantify inter-indicator correlations in the evaluation system proposed in this study, we calculated Pearson correlation coefficients and determined the redundancy of the proposed evaluation system with . The low value indicates minimal interdependencies among indicators, confirming the robustness of the proposed suitability evaluation system.
Additionally, the sensitivity analysis of evaluation indicators is a critical measure for assessing the robustness of the evaluation system. To examine this, we selected nine key indicators with high weight contributions and systematically perturbed their values by . By analyzing the corresponding variations in evaluation outcomes, we quantified the sensitivity of the proposed suitability evaluation system. Figure 4 shows the sensitivity analysis results of the AHP-FCE framework. It can be found that the exploration and development degree and storage potential exhibit significant sensitivity to parameter variations. A change in these indicators leads to corresponding changes of approximately and in evaluation outcomes, respectively. The sensitivity analysis indicates that all indicators exhibit limited sensitivity within the AHP-FCE framework. These findings demonstrate that the proposed AHP-FCE method effectively mitigates indicator sensitivity, thereby enhancing the stability and reliability of the evaluation results for practical decision-making applications.
Figure 4.
Sensitivity analysis results of the AHP-FCE framework.
4.2. Establishment of the Indicator System
A site suitability evaluation for CO2 geo-storage considers geological, engineering, storage potential, and socio-economic factors, providing scientific foundation for subsequent engineering and decision-making processes. This study developed a multi-tiered indicator system comprising essential and critical parameters to assess the geological suitability for CO2 geo-storage in an offshore basin. According to the unique geological characteristics and data availability of the Ying–Qiong Basin, the developed indicator system consists of 3 principal indicator layers, 8 first-level indicators, and 28 s-level indicators, as summarized in Table 4. Quantitative indicators are analyzed directly using original datasets, while qualitative factors are systematically quantified through interval-based classification standards to ensure a consistent impact assessment.
Table 4.
Site-level indicator system for the suitability evaluation of geological CO2 storage in the Ying–Qiong Basin.
Given the presence of qualitative indicators across all classification levels, the AHP and consistency test were employed to determine indicator weights. This study systematically analyzes CO2 geo-storage conditions in the Ying–Qiong Basin using the established multi-tiered indicator system. To perform quantitative assessments of all evaluation units, we derived standardized weighting coefficients for multi-tier evaluation parameters, as summarized in Table 5. Furthermore, Figure 5 visually illustrates the weight distribution of all and specific indicators. The blue, orange, and gray segments represent the engineering geology, storage potential, and socio-economy conditions, respectively. The size of each segment reflects the relative weight of its corresponding indicator.
Table 5.
The weight of geological CO2 storage suitability evaluation indicators for target layers.
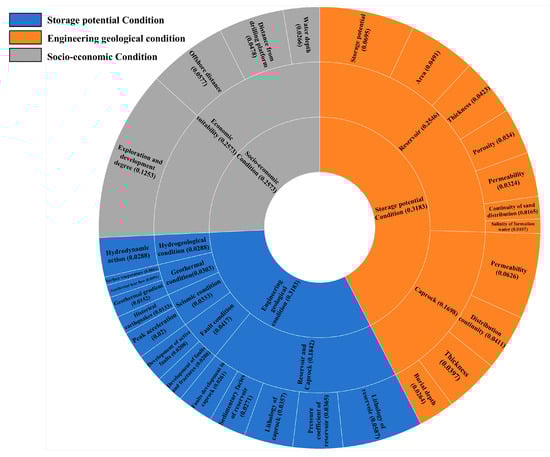
Figure 5.
Pie graph of the weight distribution for all specific indicators.
4.3. Suitability Evaluation of the Ying–Qiong Basin
Among the primary indicators for CO2 geo-storage in the Ying–Qiong Basin, the weights of engineering geological and storage potential conditions are 0.3183 and 0.4244, respectively, whereas socio-economic conditions hold a lower weight of 0.2573. Consequently, engineering geological and storage potential should be prioritized during the suitability evaluation of CO2 geo-storage, followed by socio-economic conditions. Table 6 summarizes the comprehensive suitability evaluation scores of the 24 identified favorable reservoirs. According to the previous studies [19,20] and expert knowledge, the suitability of the three primary indicators was classified as unsuitable, moderately suitable, and suitable according to the equidistant score interval, as listed in Table 7.
Table 6.
Comprehensive suitability evaluation scores for the 24 identified favorable reservoirs.
Table 7.
Classification criteria for suitability levels.
The comprehensive evaluation results reveal significant spatial variations in CO2 geo-storage suitability across the Ying–Qiong Basin. The ranking results of CO2 geo-storage suitability for the Ying–Qiong basin are presented in Figure 6. Specifically, three sites have been identified as suitable (DF-I, DF-E, and DF-B), seven as moderately suitable (DF-C, DF-A, DF-J, DF-K, DF-L, DF-D, and HK-A), and three as unsuitable (DF-G, DF-H, and DF-F) for CO2 geo-storage in the Yinggehai Basin. In the Qiongdongnan Basin, two sites have been identified as suitable sites (BD-A and YC-B), two as moderately suitable (YC-C and ST-C), and seven as unsuitable (YC-A, ST-B, ST-A, CC-A, Y-A, CC-B, and CC-C) for CO2 geo-storage. Overall, the average suitability score of the reservoirs in the Yinggehai Basin (0.72) is higher than that of the Qiongdongnan Basin (0.54), indicating that the Yinggehai Basin is more suitable for CO2 geo-storage. A comparative basin analysis reveals critical geological controls: the Qiongdongnan Basin has more extensively developed faults than the Yinggehai Basin, leading to reservoir boundaries that are predominantly fault-controlled, which increases the risk of CO2 leakage. It should be pointed out that the DF-I reservoir stands out as the most favorable site for CO2 geo-storage in the Ying–Qiong Basin, exhibiting optimal characteristics such as extensive spatial coverage, structural stability, favorable reservoir and caprock conditions, and a superior economic factor, with an estimated CO2 storage potential exceeding 1.09 × 10⁸ t. In contrast, although the HK-A reservoir exhibits substantial storage potential, structural stability, and favorable reservoir and caprock conditions, its considerable distance from emission sources (113 km) increases transportation costs, resulting in a moderate suitability.
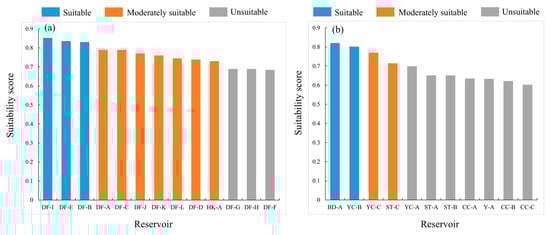
Figure 6.
Ranking results of CO2 geological storage suitability of the Ying–Qiong Basin, (a) Yinggehai Basin, (b) Qiongdongnan Basin.
4.4. Limitations
The integrated AHP-FCE methodology is well-suited for assessing CO2 storage suitability in geologically complex and data-scarce regions, such as the Ying–Qiong Basin. Unlike modern data-intensive approaches, e.g., entropy–TOPSIS, Bayesian networks, and machine learning techniques, which rely on extensive site-specific datasets for reliable calibration, the AHP-FCE framework performs particularly effectively under limited data conditions. However, although the AHP-FCE method offers practical advantages in data-scarce environments, it also has notable limitations. The reliance on expert judgment for weight determination and membership function design introduces subjectivity and potential bias, which may compromise result consistency and reproducibility. Compared to modern machine learning techniques, the AHP-FCE method lacks the capability to automatically learn complex nonlinear relationships from large, high-dimensional datasets. In contrast, machine learning models adaptively improve with more data and integrate heterogeneous data sources more effectively. Furthermore, machine learning approaches provide advanced capabilities for model interpretability and uncertainty quantification, enabling deeper insights into underlying patterns, which remain largely unaddressed within the conventional rule-based, expert-driven AHP-FCE framework. Consequently, the application of the AHP-FCE method may be constrained in situations necessitating scalable and data-driven modeling in the context of dynamically changing datasets.
Overall, the AHP-FCE method provides a resource-efficient and scientifically robust strategy for preliminary CO2 geo-storage site selection by incorporating insights from the existing literature, analogous regions, and institutional expert knowledge. Although machine learning techniques hold growing potential with expanding the availability of datasets, the AHP-FCE method currently remains the most validated and applicable solution for assessing CO2 storage suitability in geologically intricate and data-limited basins.
5. Conclusions
This study evaluates the site-level CO2 geo-storage potential and suitability in the Ying–Qiong Basin based on 24 favorable reservoirs identified by the China National Offshore Oil Corporation (CNOOC). The proposed evaluation framework establishes a multi-tiered indicator system that consists of engineering, geological, storage potential, and socio-economic conditions by integrating the AHP and FCE for CO2 geo-storage site selection in offshore saline aquifers.
The integration of the AHP-FCE methodology in this study offers a comprehensive and balanced framework by combining expert-based subjective judgment with the variability of objective data. This methodology effectively mitigates indicator sensitivity and result volatility, thereby enhancing the consistency, dependability, and reliability of the evaluation results. Based on the existing data and methodology, the suitability evaluation results indicate that the average suitability score for the Yinggehai Basin (0.762) is higher than that for the Qiongdongnan Basin (0.691), suggesting that the Yinggehai Basin is more suitable for CO2 geo-storage. Specifically, the DF-I reservoir is identified as the optimal CO2 storage target in the Yinggehai Basin, with a CO2 storage potential of 1.09 × 10⁸ t. Secondary priority targets include the DF-E and DF-B reservoirs, with CO2 storage potentials of 4.44 × 10⁷ t and 1.52 × 10⁷ t, respectively. For the Qiongdongnan Basin, the BD-A reservoir is identified as the optimal storage target, followed by the YC-B reservoir, with CO2 storage potentials of 2.40 × 10⁷ t and 2.57 × 10⁷ t, respectively. These reservoirs may be considered high-priority targets for the deployment of CO2 geo-storage projects. Future research and more comprehensive geological investigations are expected to enhance the precision of these findings and reveal further prospective storage sites.
The approach employed in this study is well-suited for the preliminary assessment of data-limited regions, offering advantages in computational simplicity and minimal data demands. Nevertheless, its application to different geographical regions may require methodological modifications and further refinement. Overall, the evaluation results identified optimal sites for CO2 sequestration within the Ying–Qiong Basin, offering a scientific foundation for the CCUS project layout in Hainan Province. This is of great significance for regional carbon reduction and supports the achievement of China’s carbon neutrality goals.
Supplementary Materials
The following supporting information can be downloaded at: https://www.mdpi.com/article/10.3390/en18133388/s1, Section S1: Pressure coefficient of the Ying–Qiong Basin; Section S2: Logging curves in 24 favorable reservoirs.
Author Contributions
J.L.: Methodology, Visualization, Writing—original draft; C.L.: Methodology, Validation, Writing—review and editing; Q.Y., A.S. and G.S.: Validation, Writing—review and editing; J.C.: Writing—review and editing; A.J.: Methodology, Software, Validation, Visualization, Writing—review and editing; Q.W.: Writing—review and editing, Funding acquisition, Project administration. All authors have read and agreed to the published version of the manuscript.
Funding
This research was funded by Hainan Province Science and Technology Special Fund (Grant No. ZDYF2024GXJS037), National Natural Science Foundation of China (Grant No. 42222704), and Joint Funds of the National Natural Science Foundation of China (Grant No. U24A20596), Guangxi Science and Technology Major Program (Grant no. AB25069394). And The APC was funded by Hainan Province Science and Technology Special Fund (Grant No. ZDYF2024GXJS037).
Data Availability Statement
The original contributions presented in the study are included in the article/Supplementary Materials, further inquiries can be directed to the corresponding author.
Conflicts of Interest
Authors Liao Jin, Cai Li, Aixia Sun and Guangze Song were employed by the company Hainan Branch of CNOOC Limited. The remaining authors declare that the research was conducted in the absence of any commercial or financial relationships that could be construed as a potential conflict of interest.
References
- Xu, T.; Tian, H.; Zhu, H.; Cai, J.G. China actively promotes CO2 capture, utilization and storage research to achieve carbon peak and carbon neutrality. Adv. Geo-Energy Res. 2022, 6, 1–3. [Google Scholar] [CrossRef]
- Mahjour, S.K.; Faroughi, S.A. Risks and uncertainties in carbon capture, transport, and storage projects: A comprehensive review. Gas Sci. Eng. 2023, 119, 205117. [Google Scholar] [CrossRef]
- Leng, J.; Bump, A.; Hosseini, S.A.; Meckel, T.A.; Wang, Z.; Wang, H. A comprehensive review of efficient capacity estimation for large-scale CO2 geological storage. Gas Sci. Eng. 2024, 126, 205339. [Google Scholar] [CrossRef]
- Qin, J.; Zhong, Q.; Tang, Y.; Rui, Z.; Qiu, S.; Chen, H. CO2 storage potential assessment of offshore saline aquifers in China. Fuel 2023, 341, 127681. [Google Scholar] [CrossRef]
- Lin, Z.; Kuang, Y.; Li, W.; Zheng, Y. Research status and prospects of CO2 geological sequestration technology from onshore to offshore: A review. Earth-Sci. Rev. 2024, 258, 104928. [Google Scholar] [CrossRef]
- Ahmed, S.; Khan, M.K.; Kim, J. Revolutionary advancements in carbon dioxide valorization via metal-organic framework-based strategies. Carbon Capture Sci. Technol. 2025, 15, 100405. [Google Scholar] [CrossRef]
- Lee, D.S.; Fahey, D.W.; Forster, P.M.; Newton, P.J.; Wit, R.C.N.; Lim, L.L.; Owen, B.; Sausen, R. Aviation and global climate change in the 21st century. Atmos. Environ. 2009, 43, 3520–3537. [Google Scholar] [CrossRef]
- Levy, P.E.; Cannell, M.G.R.; Friend, A.D. Modelling the impact of future changes in climate, CO2 concentration and land use on natural ecosystems and the terrestrial carbon sink. Glob. Environ. Change 2004, 14, 21–30. [Google Scholar] [CrossRef]
- Aminu, M.D.; Nabavi, S.A.; Rochelle, C.A.; Manovic, V. A review of developments in carbon dioxide storage. Appl. Energy 2017, 208, 1389–1419. [Google Scholar] [CrossRef]
- Massarweh, O.; Abushaikha, A.S. CO2 sequestration in subsurface geological formations: A review of trapping mechanisms and monitoring techniques. Earth-Sci. Rev. 2024, 253, 104793. [Google Scholar] [CrossRef]
- Bachu, S. Review of CO2 storage efficiency in deep saline aquifers. Int. J. Greenh. Gas Control 2015, 40, 188–202. [Google Scholar] [CrossRef]
- Tian, Y.; Du, Z.; Zhang, L.; Zhang, L.; Xu, G.; Chen, J. Research on Evaluation of the carbon dioxide sequestration potential in saline aquifers in the Qiongdongnan-Yinggehai Basin. J. Mar. Sci. Eng. 2024, 12, 997. [Google Scholar] [CrossRef]
- Bachu, S.; Shaw, J. Evaluation of the CO2 sequestration capacity in Alberta’s oil and gas reservoirs at depletion and the effect of underlying aquifers. J. Can. Pet. Technol. 2003, 42, PETSOC-03-09-02. [Google Scholar] [CrossRef]
- Li, F.; Zhang, Y.; Jia, X.; Li, X.; Jia, X.; Guo, S. A Method for Evaluating the Suitability of CO2 Geological Storage in Deep Saline Aquifers. Acta Geol. Sin.-Engl. Ed. 2016, 90, 1838–1851. [Google Scholar] [CrossRef]
- Carlotto, V.; Dueñas, A.; Ingol-Blanco, E.; Santa-Cruz, S. A multi-criteria approach to the selection of geological storage of CO2 sites in Peru. Int. J. Greenh. Gas Control 2022, 114, 103600. [Google Scholar] [CrossRef]
- Deveci, M.; Demirel, N.Ç.; John, R.; Özcan, E. Fuzzy multi-criteria decision making for carbon dioxide geological storage in Turkey. J. Nat. Gas Sci. Eng. 2015, 27, 692–705. [Google Scholar] [CrossRef]
- Derse, O. CO2 capture, utilization, and storage (CCUS) storage site selection using DEMATEL-based Grey Relational Analysis and evaluation of carbon emissions with the ARIMA method. Environ. Sci. Pollut. Res. 2023, 30, 14353–14364. [Google Scholar] [CrossRef]
- He, H.; Tian, C.; Jin, G.; Han, K. Evaluating the CO2 geological storage suitability of coal-bearing sedimentary basins in China. Environ. Monit. Assess. 2020, 192, 1–13. [Google Scholar] [CrossRef]
- Wang, J.; Yuan, Y.; Chen, J.; Zhang, W.; Zhang, J.; Liang, J.; Zhang, Y. Geological conditions and suitability evaluation for CO2 geological storage in deep saline aquifers of the Beibu Gulf Basin (South China). Energies 2023, 16, 2360. [Google Scholar] [CrossRef]
- Xiang, W.; Sang, S.; Han, S.; Liu, S.; Zhou, X.; Wang, D. Assessment of CO2 geological sequestration potential in the Northern Jiangsu-Southern yellow Sea Basin via AHP-CRITIC methodology. Int. J. Greenh. Gas Control 2025, 142, 104321. [Google Scholar] [CrossRef]
- Zhou, X.; Wu, S.; Bosin, A.; Chen, Y.; Fang, X.; Zhu, L. Evaluation of CO2 hydrate storage potential in the Qiongdongnan Basin via combining the phase equilibrium mechanism and the volumetric method. Adv. Geo-Energy Res. 2024, 11, 220–229. [Google Scholar] [CrossRef]
- Liu, J.; Sun, L.; Wu, X.; Yao, J. Feasibility of combination of CO2 geological storage with geothermal-type water-soluble gas recovery in Yinggehai Basin, China. Int. J. Greenh. Gas Control 2016, 45, 139–149. [Google Scholar] [CrossRef]
- Xia, C.; Ye, B.; Jiang, J.; Hou, Z. Review of natural origin, distribution, and long-term conservation of CO2 in sedimentary basins of China. Earth-Sci. Rev. 2022, 226, 103953. [Google Scholar] [CrossRef]
- Zhang, C.; Zhou, D.; Li, P.; Li, F.; Zhang, Y.; Sun, Z.; Zhao, Z. CO2 storage potential of the Qiongdongnan Basin, northwestern South China Sea. Greenh. Gases Sci. Technol. 2014, 4, 691–706. [Google Scholar] [CrossRef]
- Yu, L.; Li, S.; Wu, K.; Zhao, Y.; Liu, L.; Liu, N.; Pang, K. A natural analogue for carbon capture and storage: Petrographic and geochemical changes in sandstone after CO2 emplacement in the Yinggehai Basin, South China Sea. AAPG Bull. 2023, 107, 643–683. [Google Scholar] [CrossRef]
- Liu, R.; Heinemann, N.; Liu, J.; Zhu, W.; Wilkinson, M.; Xie, Y.; Wang, Z.; Wen, T.; Hao, F.; Haszeldine, R.S. CO2 sequestration by mineral trapping in natural analogues in the Yinggehai Basin, South China Sea. Mar. Pet. Geol. 2019, 104, 190–199. [Google Scholar] [CrossRef]
- Bradshaw, J.; Bachu, S.; Bonijoly, D.; Burruss, R.; Holloway, S.; Christensen, N.P.; Mathiassen, O.M. CO2 storage capacity estimation: Issues and development of standards. Int. J. Greenh. Gas Control 2007, 1, 62–68. [Google Scholar] [CrossRef]
- Ding, S.; Li, Y.; Zhang, M.; Xu, C.; Wang, S.; Gao, Y.; Yu, H.; Du, Y.; Ma, J. Holistic review on CO2 geological storage potential evaluation. Energy Fuels 2024, 38, 19946–19965. [Google Scholar] [CrossRef]
- Ye, J.; Afifi, A.; Rowaihy, F.; Baby, G.; De Santiago, A.; Tasianas, A.; Hamieh, A.; Khodayeva, A.; Al-Juaied, M.; Meckel, T.A.; et al. Evaluation of geological CO2 storage potential in Saudi Arabian sedimentary basins. Earth-Sci. Rev. 2023, 244, 104539. [Google Scholar] [CrossRef]
- Yao, Y.; Guo, S.; Li, X.; Zhao, X.; He, S. Geological Structure and Dynamics of the Yinggehai Active Rift Basin, South China Sea. J. Earth Sci. 2023, 34, 1732–1743. [Google Scholar] [CrossRef]
- Huang, Y.; Kane, I.A.; Zhao, Y. Effects of sedimentary processes and diagenesis on reservoir quality of submarine lobes of the Huangliu Formation in the Yinggehai Basin, China. Mar. Pet. Geol. 2020, 120, 104526. [Google Scholar] [CrossRef]
- Duan, W.; Li, C.-F.; Chen, X.-G.; Luo, C.-F.; Tuo, L.; Liu, J.-Z. Diagenetic differences caused by gas charging with different compositions in the XF13 block of the Yinggehai Basin, South China Sea. AAPG Bull. 2020, 104, 735–765. [Google Scholar] [CrossRef]
- Wu, S.; Qiu, X.; Zhou, D.; Zeng, G.; Xia, K.; Ye, S. Crustal structure beneath Yinggehai basin and adjacent Hainan Island, and its tectonic implications. J. Earth Sci. 2009, 20, 13–26. [Google Scholar] [CrossRef]
- Lv, X.; Fu, M.; Zhang, S.; Liu, Y.; Ding, X.; Meng, X.; Yin, S.; Sun, T. The effect of thermal fluid derived from mud diapir on sandstone reservoirs in the Yinggehai Basin, South China Sea. Energy Geosci. 2022, 3, 473–484. [Google Scholar] [CrossRef]
- Zhao, Z.; Sun, Z.; Sun, L.; Wang, Z.; Sun, Z. Cenozoic tectonic subsidence in the Qiongdongnan Basin, northern South China Sea. Basin Res. 2018, 30, 269–288. [Google Scholar] [CrossRef]
- Zhao, Z.; Sun, Z.; Wang, Z.; Sun, Z.; Liu, J.; Zhang, C. The high resolution sedimentary filling in Qiongdongnan Basin, Northern South China Sea. Mar. Geol. 2015, 361, 11–24. [Google Scholar] [CrossRef]
- Wang, Z.; Shi, X.; Yang, J.; Huang, B.; Sun, Z.; Wang, Y.; Jiang, H.; Yu, C.; Yang, X. Analyses on the tectonic thermal evolution and influence factors in the deep-water Qiongdongnan Basin. Acta Oceanol. Sin. 2014, 33, 107–117. [Google Scholar] [CrossRef]
- Zhou, Q.; Birkholzer, J.T. On scale and magnitude of pressure build-up induced by large-scale geologic storage of CO2. Greenh. Gases Sci. Technol. 2011, 1, 11–20. [Google Scholar] [CrossRef]
- Eigbe, P.A.; Ajayi, O.O.; Olakoyejo, O.T.; Fadipe, O.L.; Efe, S.; Adelaja, A.O. A general review of CO2 sequestration in underground geological formations and assessment of depleted hydrocarbon reservoirs in the Niger Delta. Appl. Energy 2023, 350, 121723. [Google Scholar] [CrossRef]
- Maalim, A.A.; Ben Mahmud, H.; Seyyedi, M. Assessing roles of geochemical reactions on CO2 plume, injectivity and residual trapping. Energy Geosci. 2021, 2, 327–336. [Google Scholar] [CrossRef]
- Abuov, Y.; Seisenbayev, N.; Lee, W. CO2 storage potential in sedimentary basins of Kazakhstan. Int. J. Greenh. Gas Control 2020, 103, 103186. [Google Scholar] [CrossRef]
- Span, R.; Wagner, W. A new equation of state for carbon dioxide covering the fluid region from the triple-point temperature to 1100 K at pressures up to 800 MPa. J. Phys. Chem. Ref. Data 1996, 25, 1509–1596. [Google Scholar] [CrossRef]
- Kopp, A. Evaluation of CO2 Injection Processes in Geological Formations for Site Screening; Online Publications of University Stuttgart: Stuttgart, Germany, 2009. [Google Scholar]
- Raza, A.; Rezaee, R.; Gholami, R.; Bing, C.H.; Nagarajan, R.; Hamid, M.A. A screening criterion for selection of suitable CO2 storage sites. J. Nat. Gas Sci. Eng. 2016, 28, 317–327. [Google Scholar] [CrossRef]
- Vaidya, O.S.; Kumar, S. Analytic hierarchy process: An overview of applications. Eur. J. Oper. Res. 2006, 169, 1–29. [Google Scholar] [CrossRef]
- Ma, J.; Gennaro, V.D.; Tan, B. Using AHP and stochastic TOPSIS for carbon storage screening and ranking with uncertainty analysis. In Proceedings of the International Petroleum Technology Conference, Dhahran, Saudi Arabia, 12 February 2024; p. IPTC-24150-MS. [Google Scholar] [CrossRef]
- Guo, T.; Tang, S.; Sun, J.; Gong, F.; Liu, X.; Qu, Z.; Zhang, W. A coupled thermal-hydraulic-mechanical modeling and evaluation of geothermal extraction in the enhanced geothermal system based on analytic hierarchy process and fuzzy comprehensive evaluation. Appl. Energy 2020, 258, 113981. [Google Scholar] [CrossRef]
- He, Y.; Zhao, G.; Tang, Y.; Song, J.; Chen, Y. Available target evaluation of underground gas storage based on AHP-FCE methods. Geoenergy Sci. Eng. 2024, 242, 213255. [Google Scholar] [CrossRef]
- Park, K.; Kim, C.Y.; Kirk, M.F.; Chae, G.; Kwon, M.J. Effects of natural non-volcanic CO2 leakage on soil microbial community composition and diversity. Sci. Total Environ. 2023, 862, 160754. [Google Scholar] [CrossRef]
- Fu, M.; Jiang, J.; Wang, D.; Fu, G.; Song, Y.; Wang, H.; Zhang, D. Assessment of the community status of seagrass bed and its relationship with environmental characteristics in Wenchang, Hainan Island, China. Front. Mar. Sci. 2024, 11, 1433104. [Google Scholar] [CrossRef]


Disclaimer/Publisher’s Note: The statements, opinions and data contained in all publications are solely those of the individual author(s) and contributor(s) and not of MDPI and/or the editor(s). MDPI and/or the editor(s) disclaim responsibility for any injury to people or property resulting from any ideas, methods, instructions or products referred to in the content. |
© 2025 by the authors. Licensee MDPI, Basel, Switzerland. This article is an open access article distributed under the terms and conditions of the Creative Commons Attribution (CC BY) license (https://creativecommons.org/licenses/by/4.0/).