Article

Floating Platform and Mooring Line Optimization for Wake Loss Mitigation in Offshore Wind Farms Through Wake Mixing Strategy †

by
Guido Lazzerini
1,‡,
Giancarlo Troise
2 and
Domenico P. Coiro
1,*
1
Department of Industrial Engineering, University of Naples Federico II, Via Claudio 21, 80125 Naples, Italy
2
SEAPOWER Scrl, Via Lepanto 137, 80125 Naples, Italy
*
Author to whom correspondence should be addressed.
Lazzerini, G.; Coiro, D.P.; Troise, G. Optimization of a floating offshore wind turbine platform and mooring lines according to an innovative wind farm wake control technique. In Proceedings of the 7th Offshore Energy & Storage Symposium (OSES 2023), St. Julian’s, Malta, 12–14 July 2023.
Current address: Delft Center for Systems and Control, Delft University of Technology, Mekelweg 2, 2628 CD Delft, The Netherlands.
Energies 2025, 18(11), 2813; https://doi.org/10.3390/en18112813
Submission received: 28 April 2025 / Revised: 13 May 2025 / Accepted: 27 May 2025 / Published: 28 May 2025
(This article belongs to the Section A3: Wind, Wave and Tidal Energy)

Abstract

:
Floating offshore wind turbines present peculiar characteristics that make them particularly interesting for the implementation of wind farm control strategies such as wake mixing to increase the overall power production. Wake mixing is achieved by generating an unsteady cyclical load on the blades of upwind turbines to decrease the wind deficit on downwind turbines. The possibility of exploiting the yaw motion of a floating offshore wind turbine allows for amplified wake mixing or a reduction in the workload of the control mechanism. To amplify the yaw motion of the system at a selected excitation frequency, a multi-disciplinary optimization framework was developed to modify selected properties of the floating platform and mooring line configuration of the DTU 10 MW turbine on the Triple Spar platform. At the same time, operational and structural constraints were taken into account. A simulation-based approach was chosen to design a floating platform and mooring line configuration that were optimized to integrate with the new control strategy based on wake mixing in floating offshore wind farms. Modifying the floating platform spar arrangement and mooring line properties allowed us to tune the yaw natural frequency of the system in accordance with the excitation frequency of the wake control technique and amplify the yaw motion while controlling the deviations of the operational constraints and costs from the baseline configuration.

1. Introduction

Despite being considered one of the most promising fields in ocean renewable energy, energy extracted from floating offshore wind turbines is still considerably expensive compared to other forms of renewable energy. To play a vital role in decarbonization goals, the cost of energy produced by floating offshore wind turbines should be decreased to be competitive with other electricity generation technologies. Innovation has been predicted to account for a reduction of 30% in the costs of floating offshore wind turbines (FOWTs) by 2040 in the UK energy market (as shown in [1]). Upsizing the generator, rotor, and hub height will increase the energy production for FOWTs in the following years [2]. Increasing the size and the number of wind turbines in a farm leads to an increased overall power capacity but also introduces more pronounced wake-to-turbine interactions. Research focuses on designing wake control strategies to counteract the decrease in wind kinetic energy available to the downstream turbines. While often seen as a disadvantage, the possibility of exciting the motion of FOWTs can be exploited to enhance the characteristics of wind farm control. Despite the growing interest, difficulties regarding the design, installation, and maintenance operations due to the harsh sea environment and the intrinsic complexity of the FOWT systems lead to a high levelized cost of energy (LCoE) produced by this technology [2]. For the development of the industry, it is vital that technological advancements eventually lead to a drop in the LCoE. To reduce the LCoE, the design of single FOWTs (especially the assembly of substructure mooring lines) can be optimized to satisfy wind farm layout goals. In this work, we employ a simulation-based approach to optimize the design of FOWTs to satisfy the requirements of a wind farm flow control technique aimed at mitigating power losses from wake-to-turbine interactions. Some different approaches to address the mitigation of wake-to-turbine interactions and their shortcomings are briefly summarized in the following subsection.

1.1. Prior Works on Wind Farm Flow Control

A classical approach, based on studies developed for land-based farms and extended to floating plants, aims at an enhancement in farm energy production by reducing wake interactions through layout optimization [3,4]. This approach, however, may have the drawback of requiring larger wind turbine spacing, with a consequent increase in water area occupation and the cost of the inter-turbine electrical connections.
A promising opportunity to decrease the LCoE lies in the modification of the wake and turbulence in wind farms to increase the overall energy production—a field of research that has been recently named “wind farm flow control” in the work by Meyers et al. [5]. It has been shown that the control strategies of turbines composing wind farms can be optimized to allow a global increase in energy production. Wake control is a well-known way to re-energize or deflect the wind that has already passed through the turbine rotors, losing a considerable part of its kinetic energy, to increase the global production of wind farms. A control strategy to deflect the wake through yaw steering was successfully implemented through numerical studies and an experimental campaign in China by Fleming et al. [6]. This study proved that a global increase in power production is possible when yaw control is applied to the first row of upwind turbines and their wake is deflected from downstream turbines. The feasible positive effect of wake control has also been shown by Silva et al. in [7]. In the cited work, besides the improvement yielded by wake velocity recovery, the authors also take into account the problem of the possible load increase on the trailing turbines due to the increased velocity fluctuations.
In this context, another significant issue has to be considered. Due to the nature of the floating platform’s foundations, the change in rotor action generated by blade pitch variations (generally considered as the control parameter used to apply the desired control laws) may significantly affect the overall floating turbine’s response. Such strong interaction between the substructure response and the behavior of the control system generally requires a tailored design approach for the platform and the mooring system to match the target control requirements. This consideration is the primary motivation of the present work, as outlined in the following subsection.

1.2. Objective and Motivation of the Present Work

As has emerged from recent developments, the design and optimization of FOWTs poses a unique challenge, in which loads coming from aerodynamic and hydrodynamic phenomena are coupled with the mooring reaction, structural deformation, and control actuation, leading to the need for multi-physics analyses. An FOWT is usually designed to deliver the best operational service, i.e., the highest production of electricity given the available wind resources, while ensuring survival under extreme fatigue loads and abnormal loads arising from the occurrence of faults and transient conditions. To demonstrate the feasibility of the optimization of a well-known FOWT configuration for the implementation of an innovative wake control strategy, a framework was developed integrating a simulation-based approach, employing a well-known mid-fidelity multi-physics environment [8], and the automatic generation of different platform geometries and mooring line layouts. Such a simulation-based approach involves using numerical models to simulate the behavior of the FOWT system with a chosen level of fidelity and then using the analyzed performance to carry out optimization. The optimizer generates new values for the design variables and, through a dedicated algorithm, performs the operations needed to find an optimal solution, i.e., one that minimizes the objective function. Among the other types, heuristic algorithms have been proven to be very efficient in finding optimal solutions in the field of FOWTs and other complex systems. These algorithms (see [9] for an exhaustive description) try to mimic natural evolution by selection, applying the “survival of the fittest” principle in a certain population of individuals. Generation by generation, the characteristics of the fittest individuals are inherited by new ones to maintain the characteristics that return the best objective function evaluation. Through this metaphor, the individuals are represented by specific configurations of FOWTs, and the objective function is evaluated based on a particular system’s performance. Differing from gradient-based approaches, which are based on the gradient estimation of the objective function to find the global optimum, evolutionary algorithms do not require the continuity of the objective function because no assumption is made regarding the mathematical nature of the optimum. Hence, they are particularly well suited for the evaluation of non-linear discontinuous objective functions, such as when the objective function is evaluated based on the post-processed outputs of FOWT time simulations (see [10], where the authors chose to use a different non-gradient-based algorithm with OpenFAST simulations). The combination of heuristic optimization algorithms and numerical simulations offers a powerful tool for the design and optimization of FOWTs, as it allows for the exploration of many design options without the need to evaluate gradients. This work presents the following contributions:
  • an optimization framework was developed with a simulation-based approach to optimize the floating platform and mooring lines of an FOWT;
  • to enhance the yaw motion with beneficial effects on the “Helix” control strategy, an optimization problem was derived;
  • two different optimized configurations were obtained to solve the optimization problem with a differential evolution algorithm.
This work is organized as follows. In the first part, a reference FOWT is defined, and the modeling simulation and optimization approach are described. The purpose of the first part is to justify the configuration and give a brief overview of the procedure carried out to manage modifications of the chosen geometry, analyze the free-oscillation response, and optimize the floating platform and mooring lines. In the second part, the results of the optimization of the floating platform and mooring lines are shown. Finally, conclusions are drawn, and possible paths for future work are outlined.
It has to be noted that the main goal of this work is not directly related to the detailed investigation of the aerodynamic behavior of the rotor and the study of the wake development behind the rotor. Such investigations have been performed in previous studies [11], which provide the starting point for the present work. The main objective of this work is the definition of an optimization procedure to generate an optimal configuration for the platform and mooring system, with the purpose of enhancing the yawing response of the FOWT, increasing the oscillations generated by the action of the Helix control, and improving its effect on wake recovery.

2. Methodology

2.1. Baseline Configuration

A baseline configuration for the FOWT is assumed as the design’s starting point, based on the DTU 10MW floating wind turbine mounted on the “Triple Spar” platform, with three catenary mooring lines, as shown in Figure 1. Data related to the DTU 10MW reference wind turbine (RWT) can be found in [12], while a definition of the “Triple Spar” platform is included in [13]. This configuration is selected based on the following considerations:
  • the DTU 10MW RWT is widely used in studies on floating offshore wind farms; its geometry and features are open-source and easily accessible through an online database [14];
  • the use of three buoyant bodies can reduce the need for a large draft, which may limit the applicability of the studied configuration to sites with a considerable seabed depth in comparison with a single-spar configuration;
  • other available configurations, such as tension leg platforms (TLP), may have larger frequencies, being incompatible with preliminary estimations of the expected required frequency for the application of the desired wake control technique [11];
  • the geometry of the “Triple Spar” model seems more flexible, offering more parameters to be changed in the selection of the design variables compared to simpler geometries (such as a spar buoy).
Figure 1. Front view of the DTU 10 MW turbine, installed on a Triple Spar platform, from [8].
Energies 18 02813 g001
On the other hand, some possible disadvantages of this choice should also be pointed out; for example, the presence of large bodies at a significant distance from the yaw axis is potentially associated with larger damping on the yaw degree of freedom, which may be detrimental to the implementation of control schemes requiring significant yaw motion. The data summarized below describe the baseline configuration for the platform and the nacelle–tower assembly (Table 1 and Table 2). It must also be noted that, in the remainder of this work, and to simplify the effects of the control strategy on the yaw motion of the system, the loads generated by wind and the effects of the pitch control on the aerodynamics of the system are simulated through point forces and moments at the hub. Thus, the rotor dynamics are replaced by a prescribed force, simulating the thrust force, and a prescribed sinusoidal moment, simulating the cyclical loads imposed by the control strategy.
In this work, the focus is on the yaw dynamics of the system, aiming to determine response amplification at the desired excitation frequency for the “Helix” control strategy. “Helix” is a wake control technique for wind farms that allows the fast recovery of the wind speed in the wakes of wind turbines, promoting the mixing process through the controlled motion of the wake (which forms a helicoidal shape, as shown in [11]). Wake mixing techniques are used to lower the turbine-to-turbine interaction within wind farms and can potentially increase the overall power production of wind farms. When floating platforms are designed to enhance wake mixing, either the wake mixing performance can be augmented, resulting in higher energy yields, or the workload of the turbine control system can be lowered without sacrificing the wake mixing performance, potentially improving the fatigue behavior. The motion of the platform is expected to be effective in further enhancing wake recovery, provided that the oscillation response of the platform can increase the favorable wake recovery behavior, as was shown in [11]. Nonetheless, besides the control-related constraints, other restrictions or objectives can be accounted for in the optimal configuration search process, such as station keeping and structural limitations or cost-related issues. The optimal Strouhal number for the “Helix” strategy is deemed to be equal to 0.25 (see [11]), which, for our reference case (the DTU reference turbine at a wind speed of 9 m/s), returns a yaw period of about 100 s.

2.2. Design Space

Based on an analysis of the sensitivity of the frequencies to the design variables, which is not reported here for the sake of brevity, the parameters in Table 3, related to the geometry of the platform and mooring lines, are selected for the preliminary optimization.
In Figure 2, the relevant quantities that will be modified during the preliminary optimization are colored in blue. The mooring line length factor, indicated in the table presented above, represents a measure of the mooring line length nondimensionalized with respect to the distance between the fairlead and the anchor point, and it is defined as follows:
M L L F = l m z F + D 2 + Δ x F A 2
where D is the depth of the site of installation, l m is the length of a mooring line, z F is the vertical height of the fairlead above the SWL, and Δ x F A is the horizontal distance between the fairlead and anchor.

2.3. Design Assumptions

Following an approach that is common in floating platforms for FOWT design, as in [15], some requirements must be verified in the preliminary design to ensure the operation and survival of the whole system. The assumptions considered in the preliminary design can be summarized as follows:
  • Hydrostatic equilibrium and stability (influencing the most relevant mass and inertia properties);
  • Economic feasibility;
  • Compliant response to hydrodynamic loads (seakeeping analysis);
  • Compliant mooring system;
  • Good dynamics in fully coupled design load cases (DLC);
  • Survival under critical load cases.
The “Triple Spar” reference floating platform geometry, together with the three-line catenary moorings, has been designed to satisfy these requirements (see [13]). While the complete redesign of the platform would arguably need a full set of simulations of DLCs, in this preliminary analysis, which requires slight modifications of the reference geometry, only consistency checks on the basic assumptions are taken into account to avoid the violation of the main design requirements (specifically, the verification of points 1, 2, and 4 in the above-reported list is considered in the optimal configuration search process).

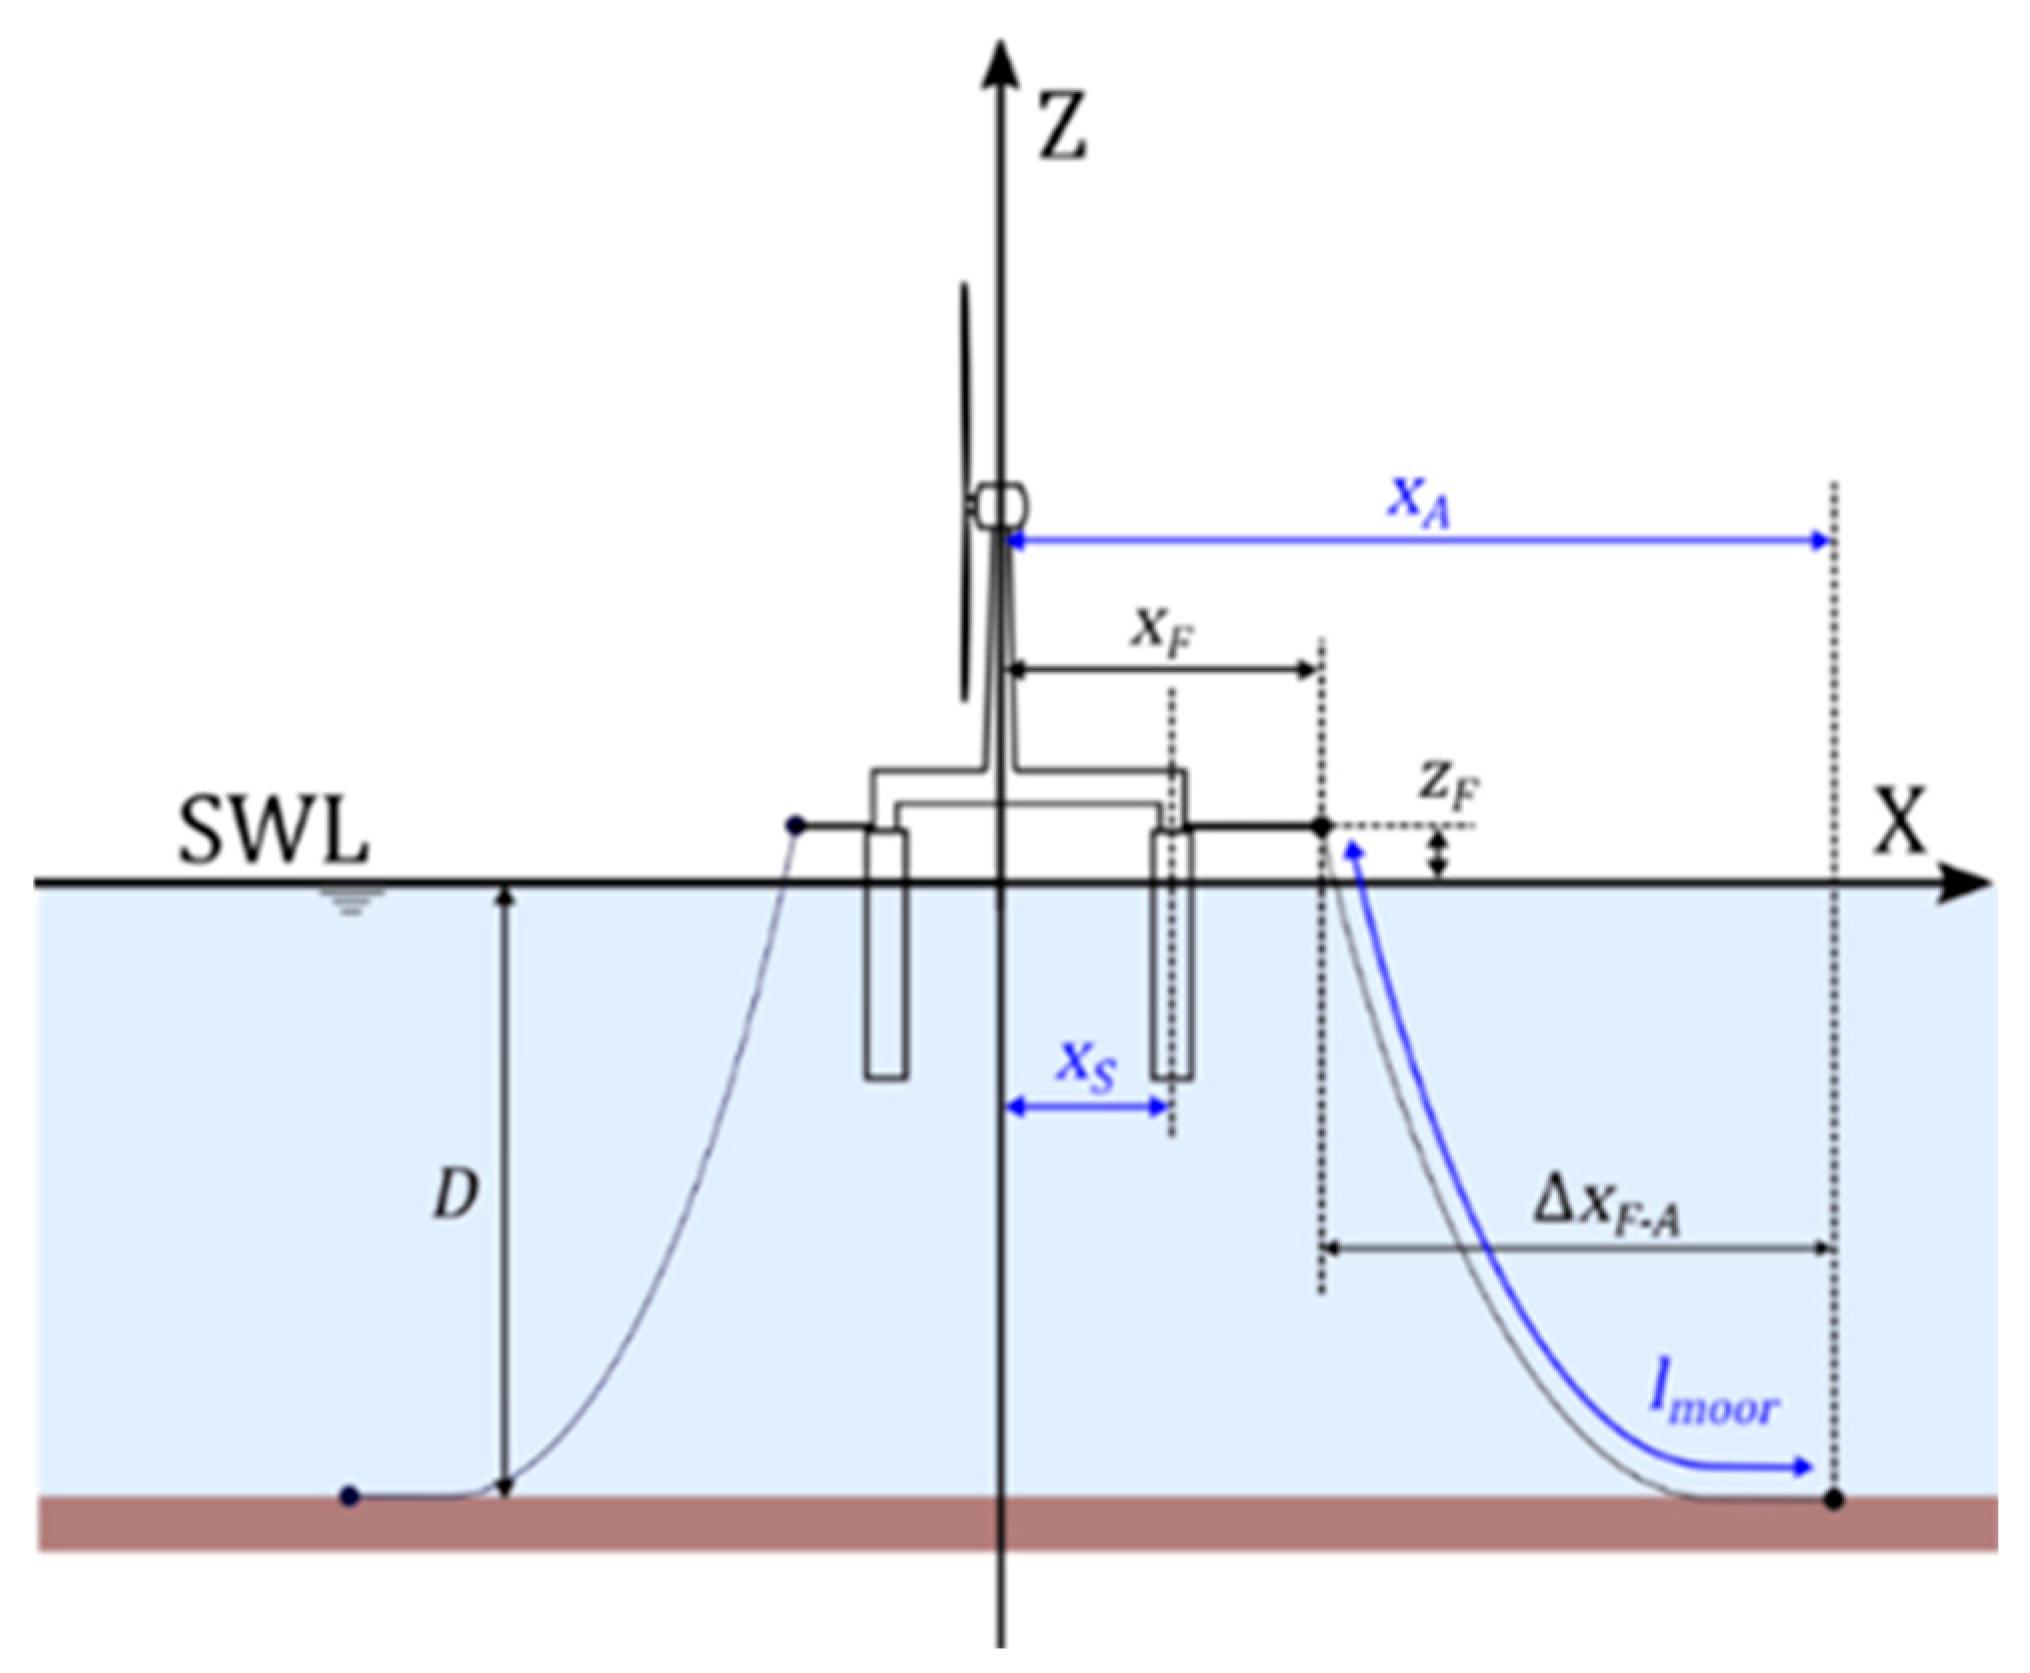
2.4. Buoyancy Equilibrium

The total weight of the FOWT is considered unvaried (negligible change in heave displacement) since the weight of the platform is kept constant, while the mooring lines’ weight variation only accounts for a negligible fraction of the total weight, which can be calculated as
Δ W m , w a t , M A X = 3 Δ l m , M A X ρ m V o l w a t , M A X ρ w a t W m , w a t . R E F
where Δ l m , M A X can be calculated from the extreme values in the range of the design space as
Δ l m , M A X = M L L F M A X D + z F , R E F 2 + x A , M A X x F . M I N 2
where D is the reference depth, z F , R E F is the fairlead height above sea level, and x F , M I N is the minimum distance of the fairlead from the yaw axis, calculated as
x F , M I N = x F , R E F + ( x S , M I N x S , R E F )
The values and the meanings of the used symbols are listed in the Table 4 below.
Table 4. Properties of mooring lines and floating platform.
PropertyValueUnit
Minimum spar distance ( x S , M I N )23.4m
Reference spar distance ( x S , R E F )26.0m
Reference fairlead distance ( x F , R E F )54.5m
Minimum fairlead distance ( x F , M I N )51.9m
Water depth ( D )180.0m
Reference fairlead height ( z F , R E F )8.0m
Maximum anchor distance ( x A , M A X )750.0m
Maximum mooring line length ( l m , M A X )839.7m
Reference weight of mooring lines ( W m , R E F )1087ton
Reference weight of mooring lines in water ( W m , w a t , R E F )949ton
Maximum weight of mooring lines in water ( W m , w a t , M A X )1314ton
Difference in weight of mooring lines in water ( Δ W m , w a t , M A X )227ton
Reference total weight of FOWT including mooring lines in water30,290ton
Maximum difference in weight over the reference total weight of FOWT0.7%
Thus, the maximum percentage of weight change only accounts for 0.7% of the total weight. In the remainder, a simplified procedure to calculate the weight increase due to tripod structure length variation is indicated, showing a negligible effect on the total weight.

2.5. Hydrostatic Stability

Hydrostatic stability constraints are implemented to check when the rotor’s thrust is at its rated value and whether the heeling angle and surge displacement comply with the suggested values found in the literature. As regards the heeling angle, the current value is selected to avoid an excessive decrease in power production (see [16]). The surge excursion must be limited, depending on the water depth, to ensure the survivability of the electrical cable (see [15]).
Δ θ r a t e d = F X , r a t e d · z h u b C 55 5 °
Δ x r a t e d = F X , r a t e d C 11 25   m
where F X , r a t e d is a static force in the direction of the thrust applied at the hub axis, and C 11 and C 55 are the diagonal elements of the hydrostatic stiffness matrix of the whole system. The latter two values are determined by the platform geometry and by the properties of the mooring lines. In particular, the surge restoring force is given by the action of the mooring lines (the tension at the fairleads), while the pitch restoring moment is provided by the hydrostatic properties of the platform (waterplane area and platform buoyancy center), the mass distribution of the whole system (center of gravity), and the restoring moment given by the mooring lines’ tensions.

2.6. Economic Feasibility

To ensure that the total cost of the system is not excessively increased by the change in the floating platform and mooring line configuration, the variations in cost must be considered in the objective function. The definition of the total cost function is split into two parts: one accounting for the floating platform’s cost variation and the other accounting for the variation in the cost of the mooring lines.

2.7. Cost Variation of Floating Platform

As regards the costs of the floating platform, the following simplified assumptions are made:
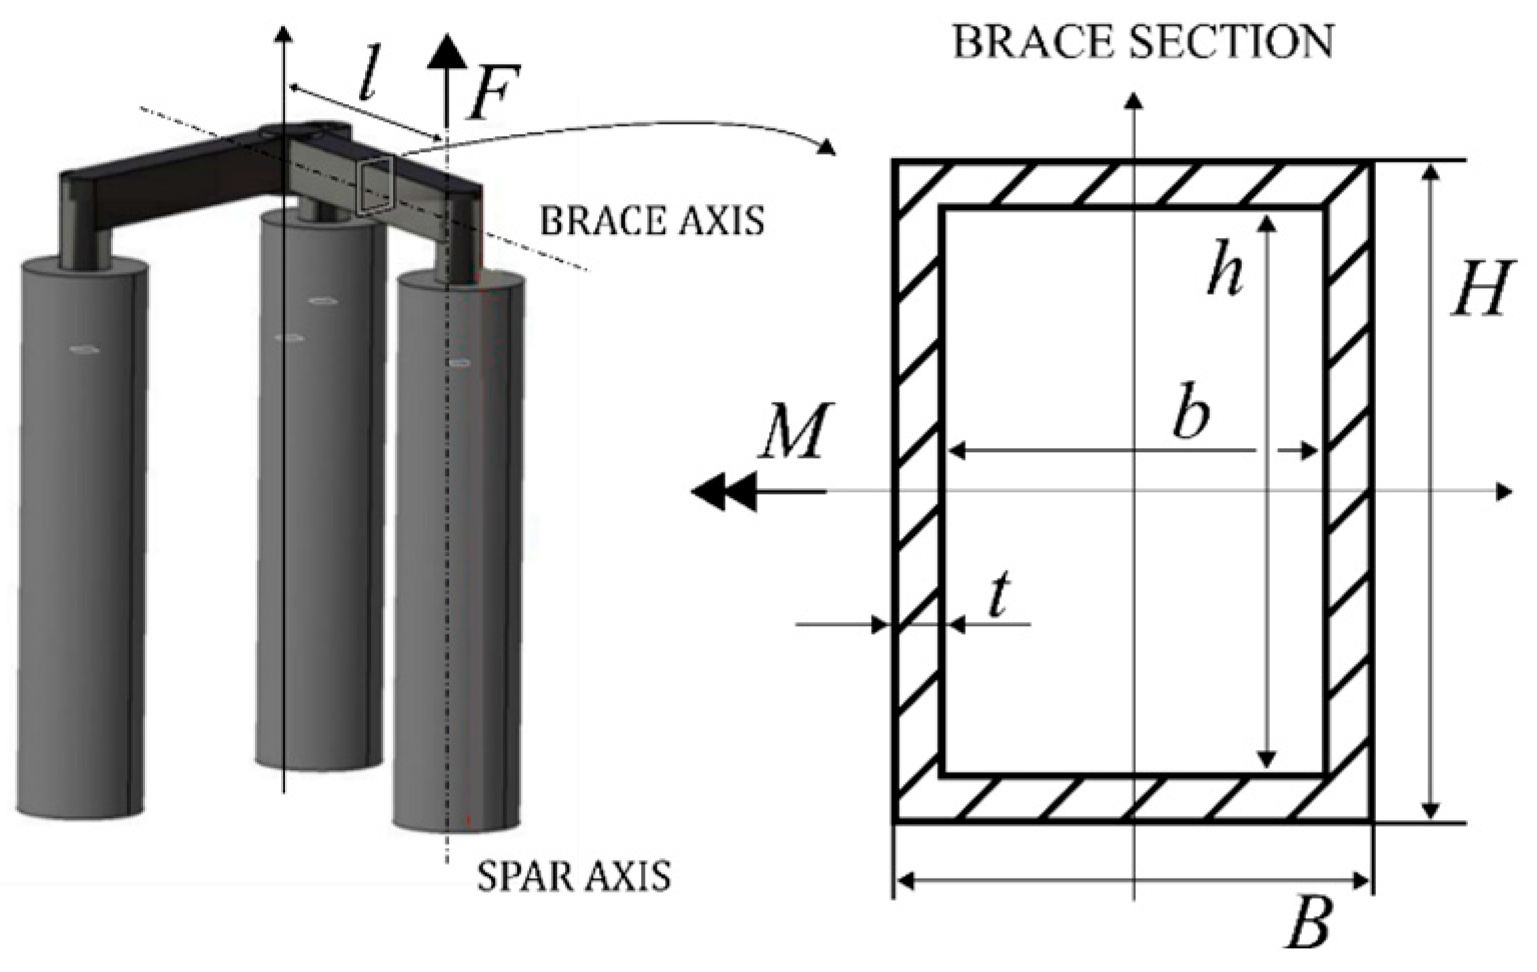
  • the cost of the spars does not change due to modifications of the floating platform during the optimization;
  • the cost of the steel tripod structures changes as a direct function of the structure’s length (also related to the structure’s section size and overall material weight);
  • the tripod structure’s length is assumed to be equal to the distance of the spars from the yaw axis ( x S );
  • to preserve the structural integrity of the floating platform, the same stress level in the tripod structures should be maintained.
To ensure the same stress level, the following procedure is established. All relevant quantities defined in the procedure below are visible in Figure 3.
First, we approximate the maximum stress in the tripod structure as
σ = M S
where M is the maximum flexural moment on the structure and S is the elastic section modulus. For the moment acting on the most stressed section of the structure, a simplified expression (hydrodynamic and hydrostatic forces) is assumed to assess the effect of the structure length, l :
M = F l
with F force applied from a spar at the end of a structure of the tripod and l length of the tripod brace. Considering a hollow rectangular section with a height H , width B , thickness t , internal height h = H 2 t , and internal width b = B 2 t , the following elastic section modulus is assumed:
S = 1 6 H B H 3 b h 3
Rearranging this in terms of thickness and neglecting terms of the second order in t , we have
S = 1 6 H B H 3 B 2 t H 2 t 3 B H t 6 6 + 2 H B = B H t 1 + 1 3 H B
With the assumed simplifications, the stress in the structure can be expressed approximately as
σ = F l S F l B H t 1 + 1 3 H B = F l H 2 B H t 1 + 1 3 H B
and an expression for the ratio between stress and force is obtained as
σ F = l H 2 B H t 1 + 1 3 H B
Thus, assuming an approximately constant force applied by the hydrodynamic actions on the spars, a constant thickness, and a constant aspect ratio of the section, H / B = 1 (square section) to ensure the same stress level in the tripod structures, the following relation between the structure length, l , and the section height, H , should be assumed:
l H 2 = k
where k is a given constant dependent on the specific design. For the initial design, as reported in [18], the above-indicated ratio is equal to
l R E F H R E F 2 = 26 4.6164 2 = 1.22   m 1
The thickness of the original design, as reported in [18], is equal to t = 0.0564   m . The area of the section (recalling that H = B ) can be approximately expressed as
A = H 2 H 2 t 2 = H 2 H 2 + 4 H t 4 t 2 4 H t
With the above assumptions, the increase in weight and the total mass can be expressed as
Δ W b 3 4 H t l l R E F ρ s
while the actual weight of the structures is
W b = W b , R E F + 3 4 H t l l R E F ρ s
with the reference structure’s weight equal to W b , R E F = 948   t o n and the steel density ρ s = 7800   k g · m 3 . In this way, the maximum value of the system’s total weight can be calculated. When the tripod braces are at their maximum lengths, the total weight increase due to the length variation of the braces is
Δ W b , M A X = 3 4 l M A X 1.22 t l M A X l R E F ρ s = 96   t o n
which only accounts for 0.3% of the total weight of the system. The cost increase due to the length of the tripod structure is approximately expressed as
C t r i = c t r i W b = c t r i W b , R E F + 3 4 H t l l R E F ρ s
The cost per unit mass is assumed equal to c t r i = 5 · k g 1 . This value comes from private conversations with providers and can be considered representative of the current market. Considering the assumed relation between the structure height and length, k = 1.22   m 1 , the cost of the structures, C t r i , can be expressed as
C t r i = c t r i W b , R E F + 3 4   l 1.22   t   l l R E F ρ s
which only depends on the structure length and allows a suitable expression for an optimization problem with the selected parameters. The initial cost, C t r i 0 , is assumed equal to the above expression with the initial length of the structures l = l 0 = 26   m .

2.8. Cost Variation of Mooring Lines

The cost of the mooring lines can be expressed from [15] as
C m = 3   0.0591   M B L 89.69   l m
with M B L as the “minimum breaking load” of the chain and l m the chain length. The original unstretched length is equal to 610 m and is associated with the assumed initial cost of a chain line C m 0 .

2.9. Optimization Framework

A framework for the automated modification of the configuration parameters and for the execution of multiple FOWT simulation runs was established with the objective of estimating the amplitude of the system’s yaw motion. Simulations have been performed using the NREL code OpenFAST, which can evaluate the overall response of floating wind turbines. The following simplifying assumptions were made in all simulations:
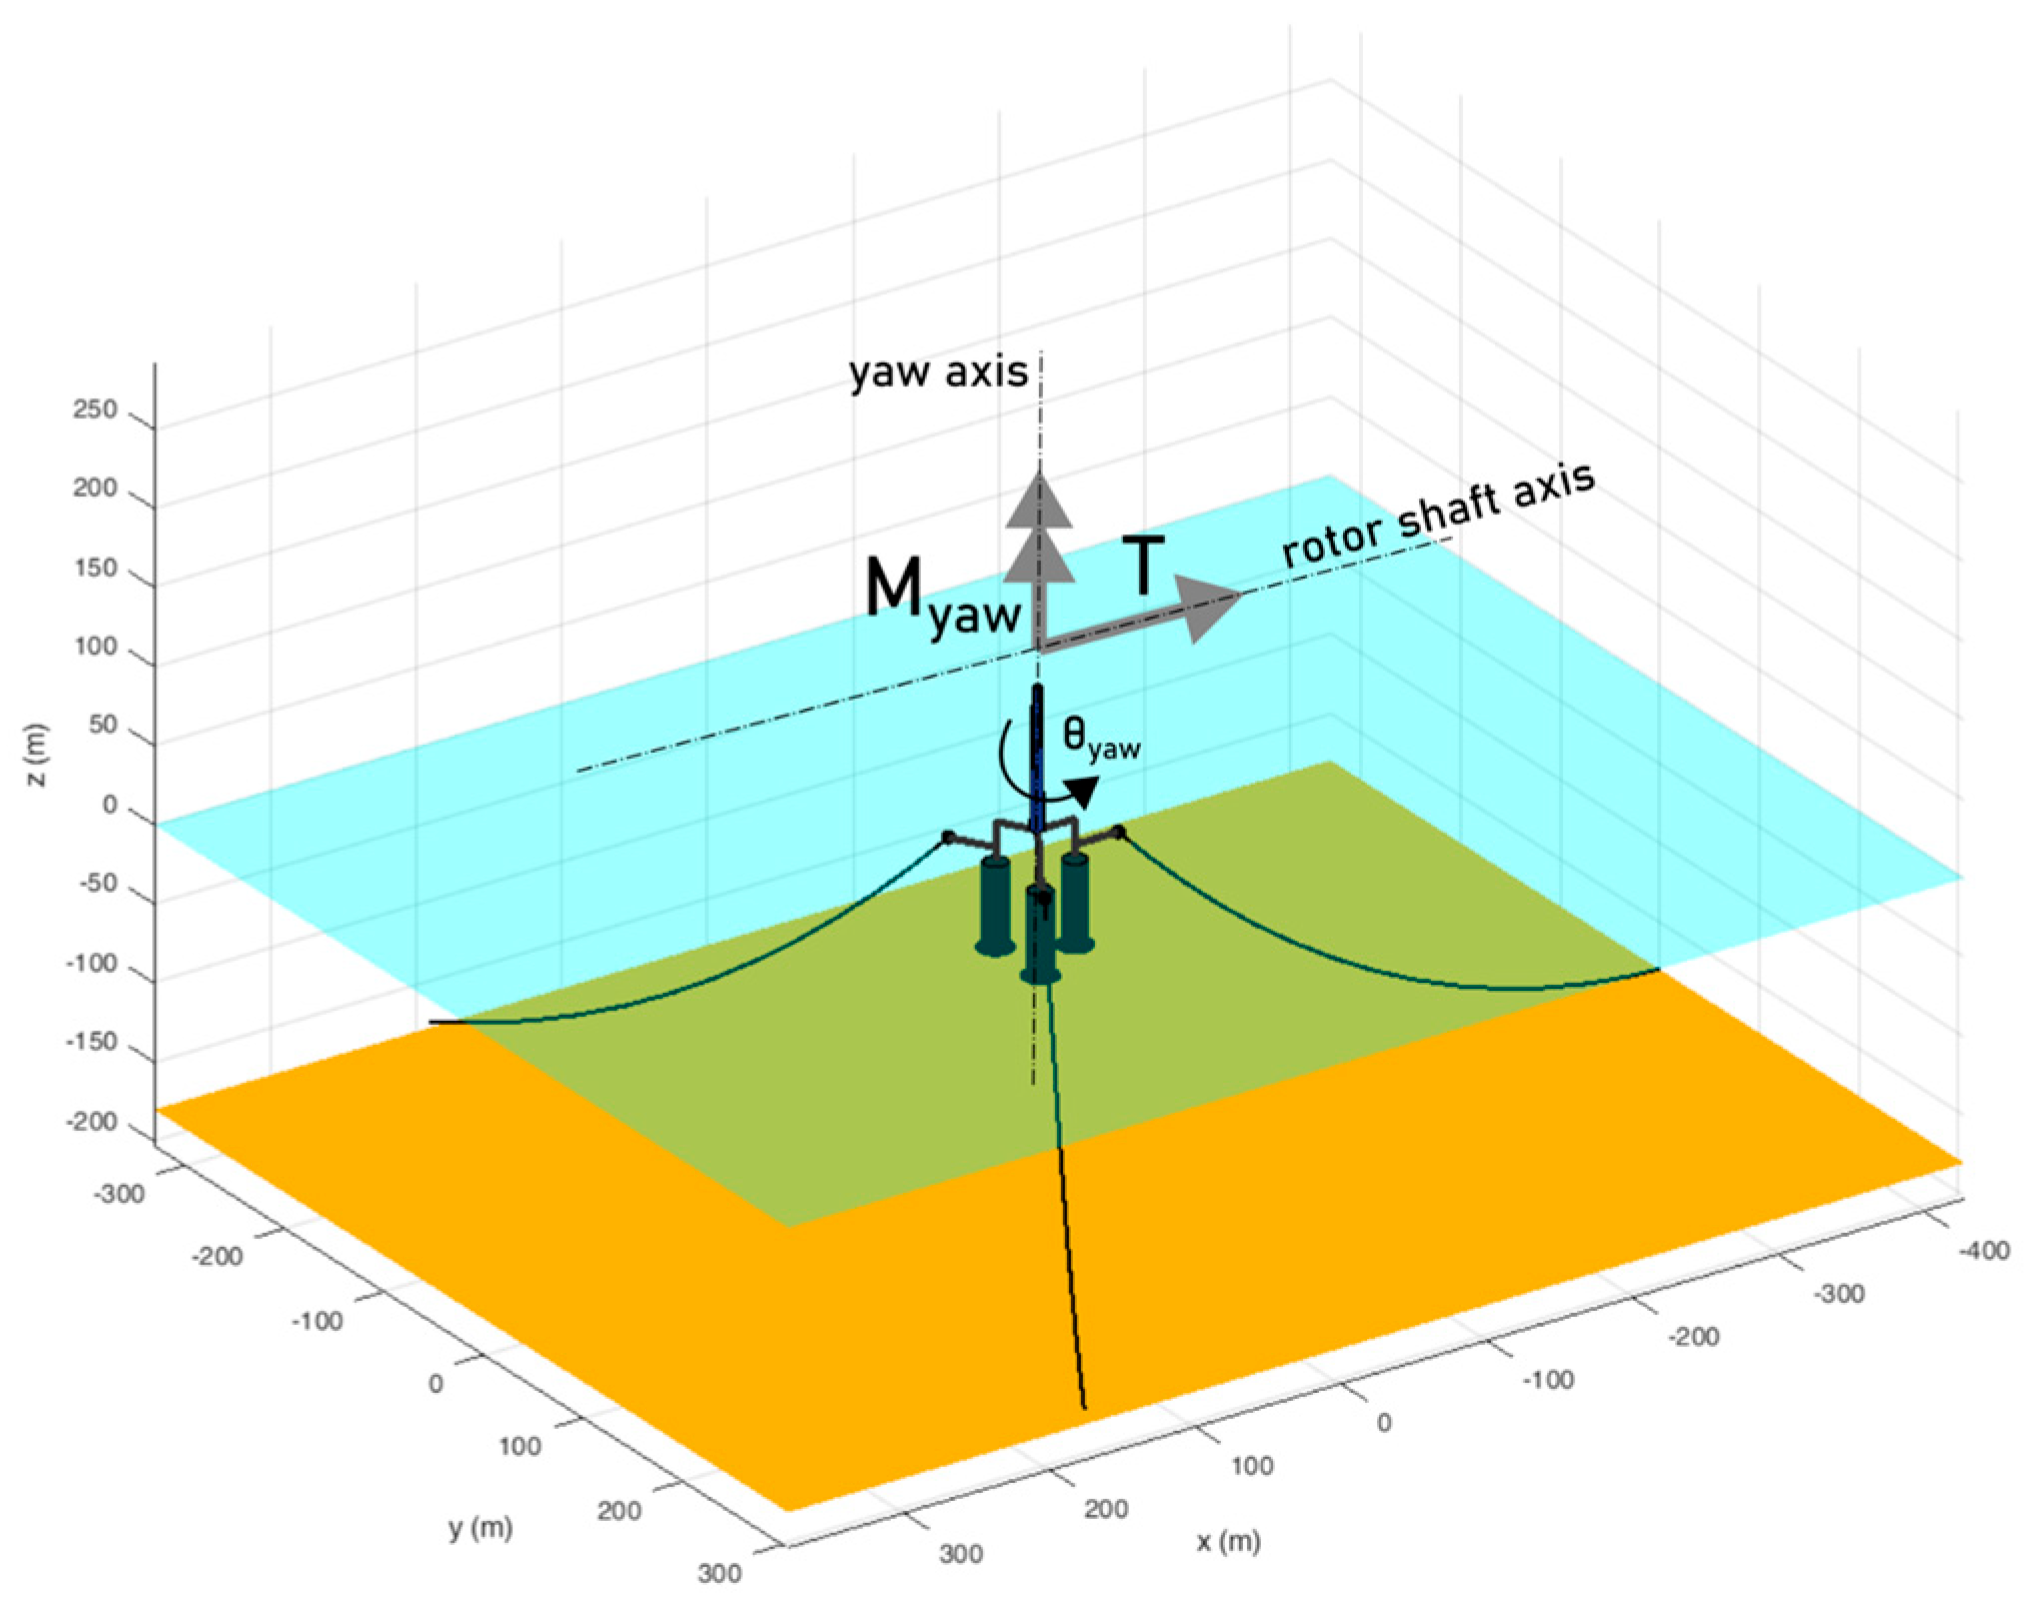
  • Zero wind speed (the wake behavior and the loadings on the system are derived from previous studies [11]—to reduce the computational cost of the optimization, the estimated loading actions have been directly applied to the tower/platform assembly in order to evaluate and optimize the response of the support structure under the action of the Helix control strategy);
  • A deactivated control system (as indicated in the previous point, the action of the Helix control system has been derived from previous studies);
  • A fixed rotor.
As mentioned earlier, the aerodynamic loads generated by the wind and the cyclical variation produced by the control strategy are modeled with a point force and a moment around the yaw axis, as seen in Figure 4.
A schematic description of the process used to evaluate the objective function in the optimization framework is reported in the following sequence.
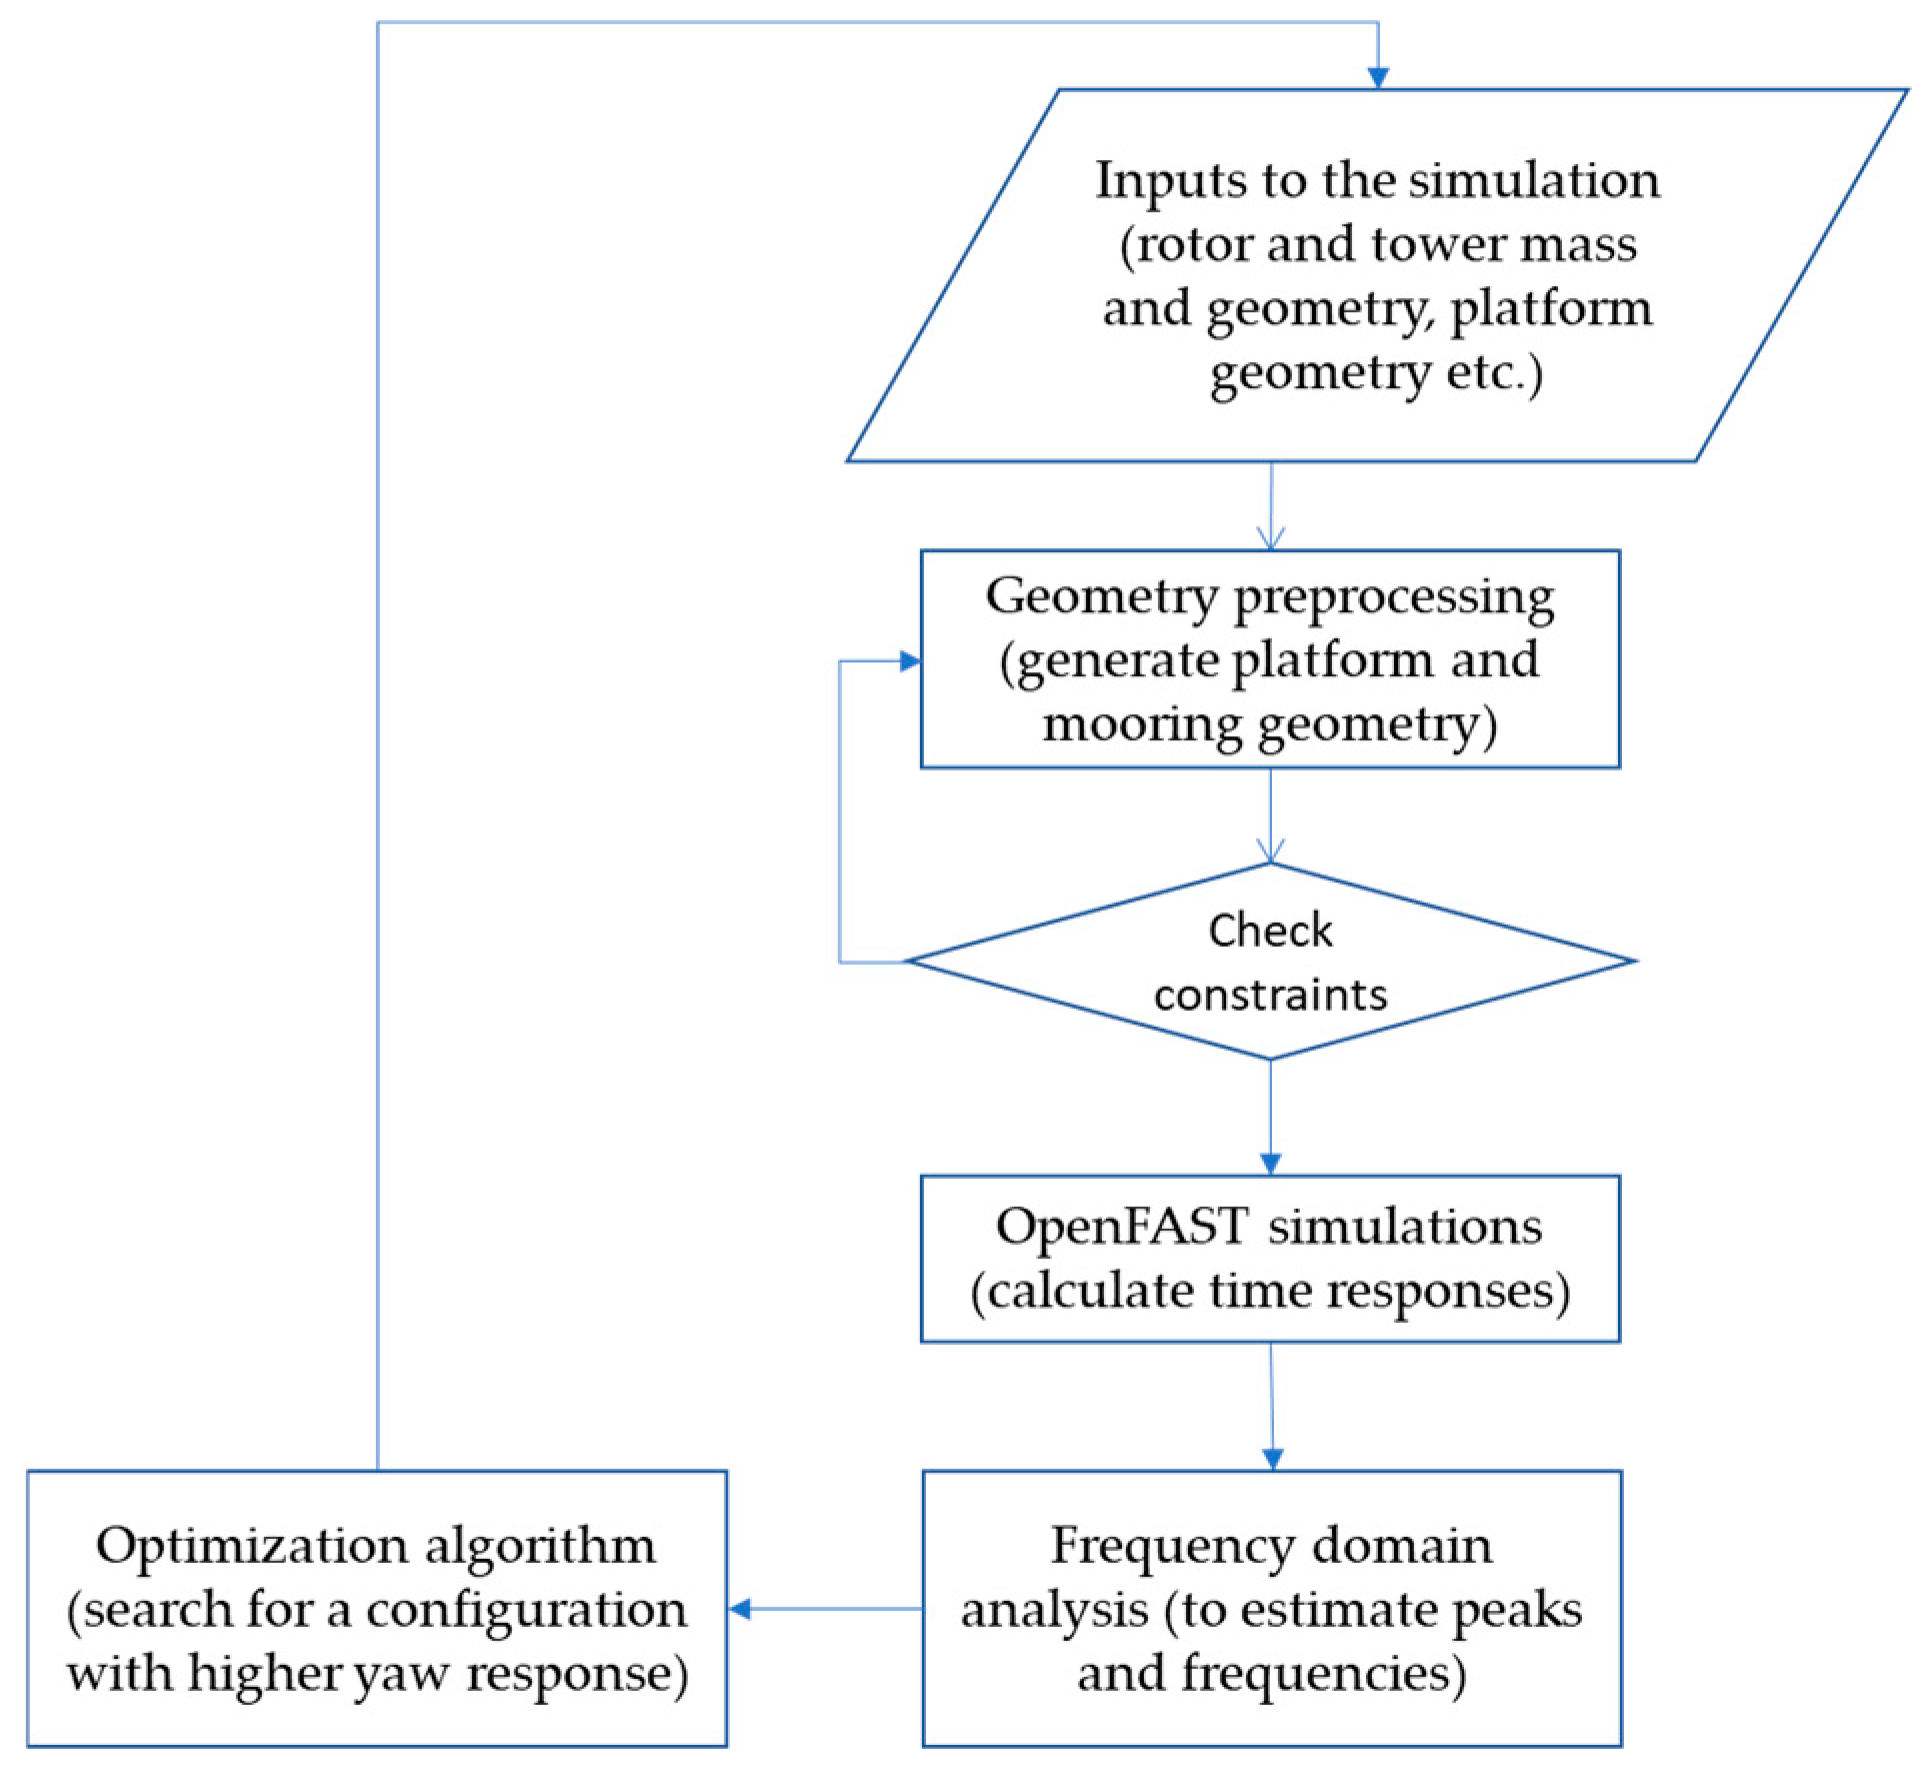
  • The inputs to the simulation block can be classified as follows:
    • Fixed configuration parameters (for example, rotor and tower mass and geometry, etc.);
    • Operating characteristics and control (wind, control laws)—in this simplified analysis, the control and aerodynamic actions are simulated using prescribed external actions;
    • Variable input parameters (for example, spar radius, draft, heave plate position, mooring cable length, fairlead positions, and anchor distance from the yaw axis).
  • A pre-processor is implemented to define a consistent configuration (platform geometry and mooring lines’ integration with the wind turbine system). This part of the process generates a set of input files for the computation, describing a configuration based on the assigned input parameters. The pre-processor performs several operations:
    • It generates the input files for the mooring system;
    • It generates the surface mesh files needed for hydrodynamic calculation (using the open-source code Gmsh [15])—in this step, an equilibrium analysis is performed to set the platform in the equilibrium position around which hydrodynamic analyses are performed;
    • It runs the hydrodynamic analysis to obtain the hydrodynamic coefficients in the frequency domain (using the open-source Python module Capytaine version 1.5, described in [16]), which are needed to describe the behavior of the platform’s interaction with water;
    • It adds Morison’s coefficients for viscous damping directly in the OpenFAST input files;
    • It performs a consistency check to verify that the physical constraints are not violated and to avoid unfeasible geometries.
  • The design constraints are checked before performing OpenFAST simulations.
  • The computation of the dynamic parameters of interest (oscillations and loads) is performed using OpenFAST time-domain simulations. Once the geometries and the hydrodynamic data are determined, a simulation is carried out. The results are post-processed and analyzed to obtain the desired information (a simulation time must be set at this stage).
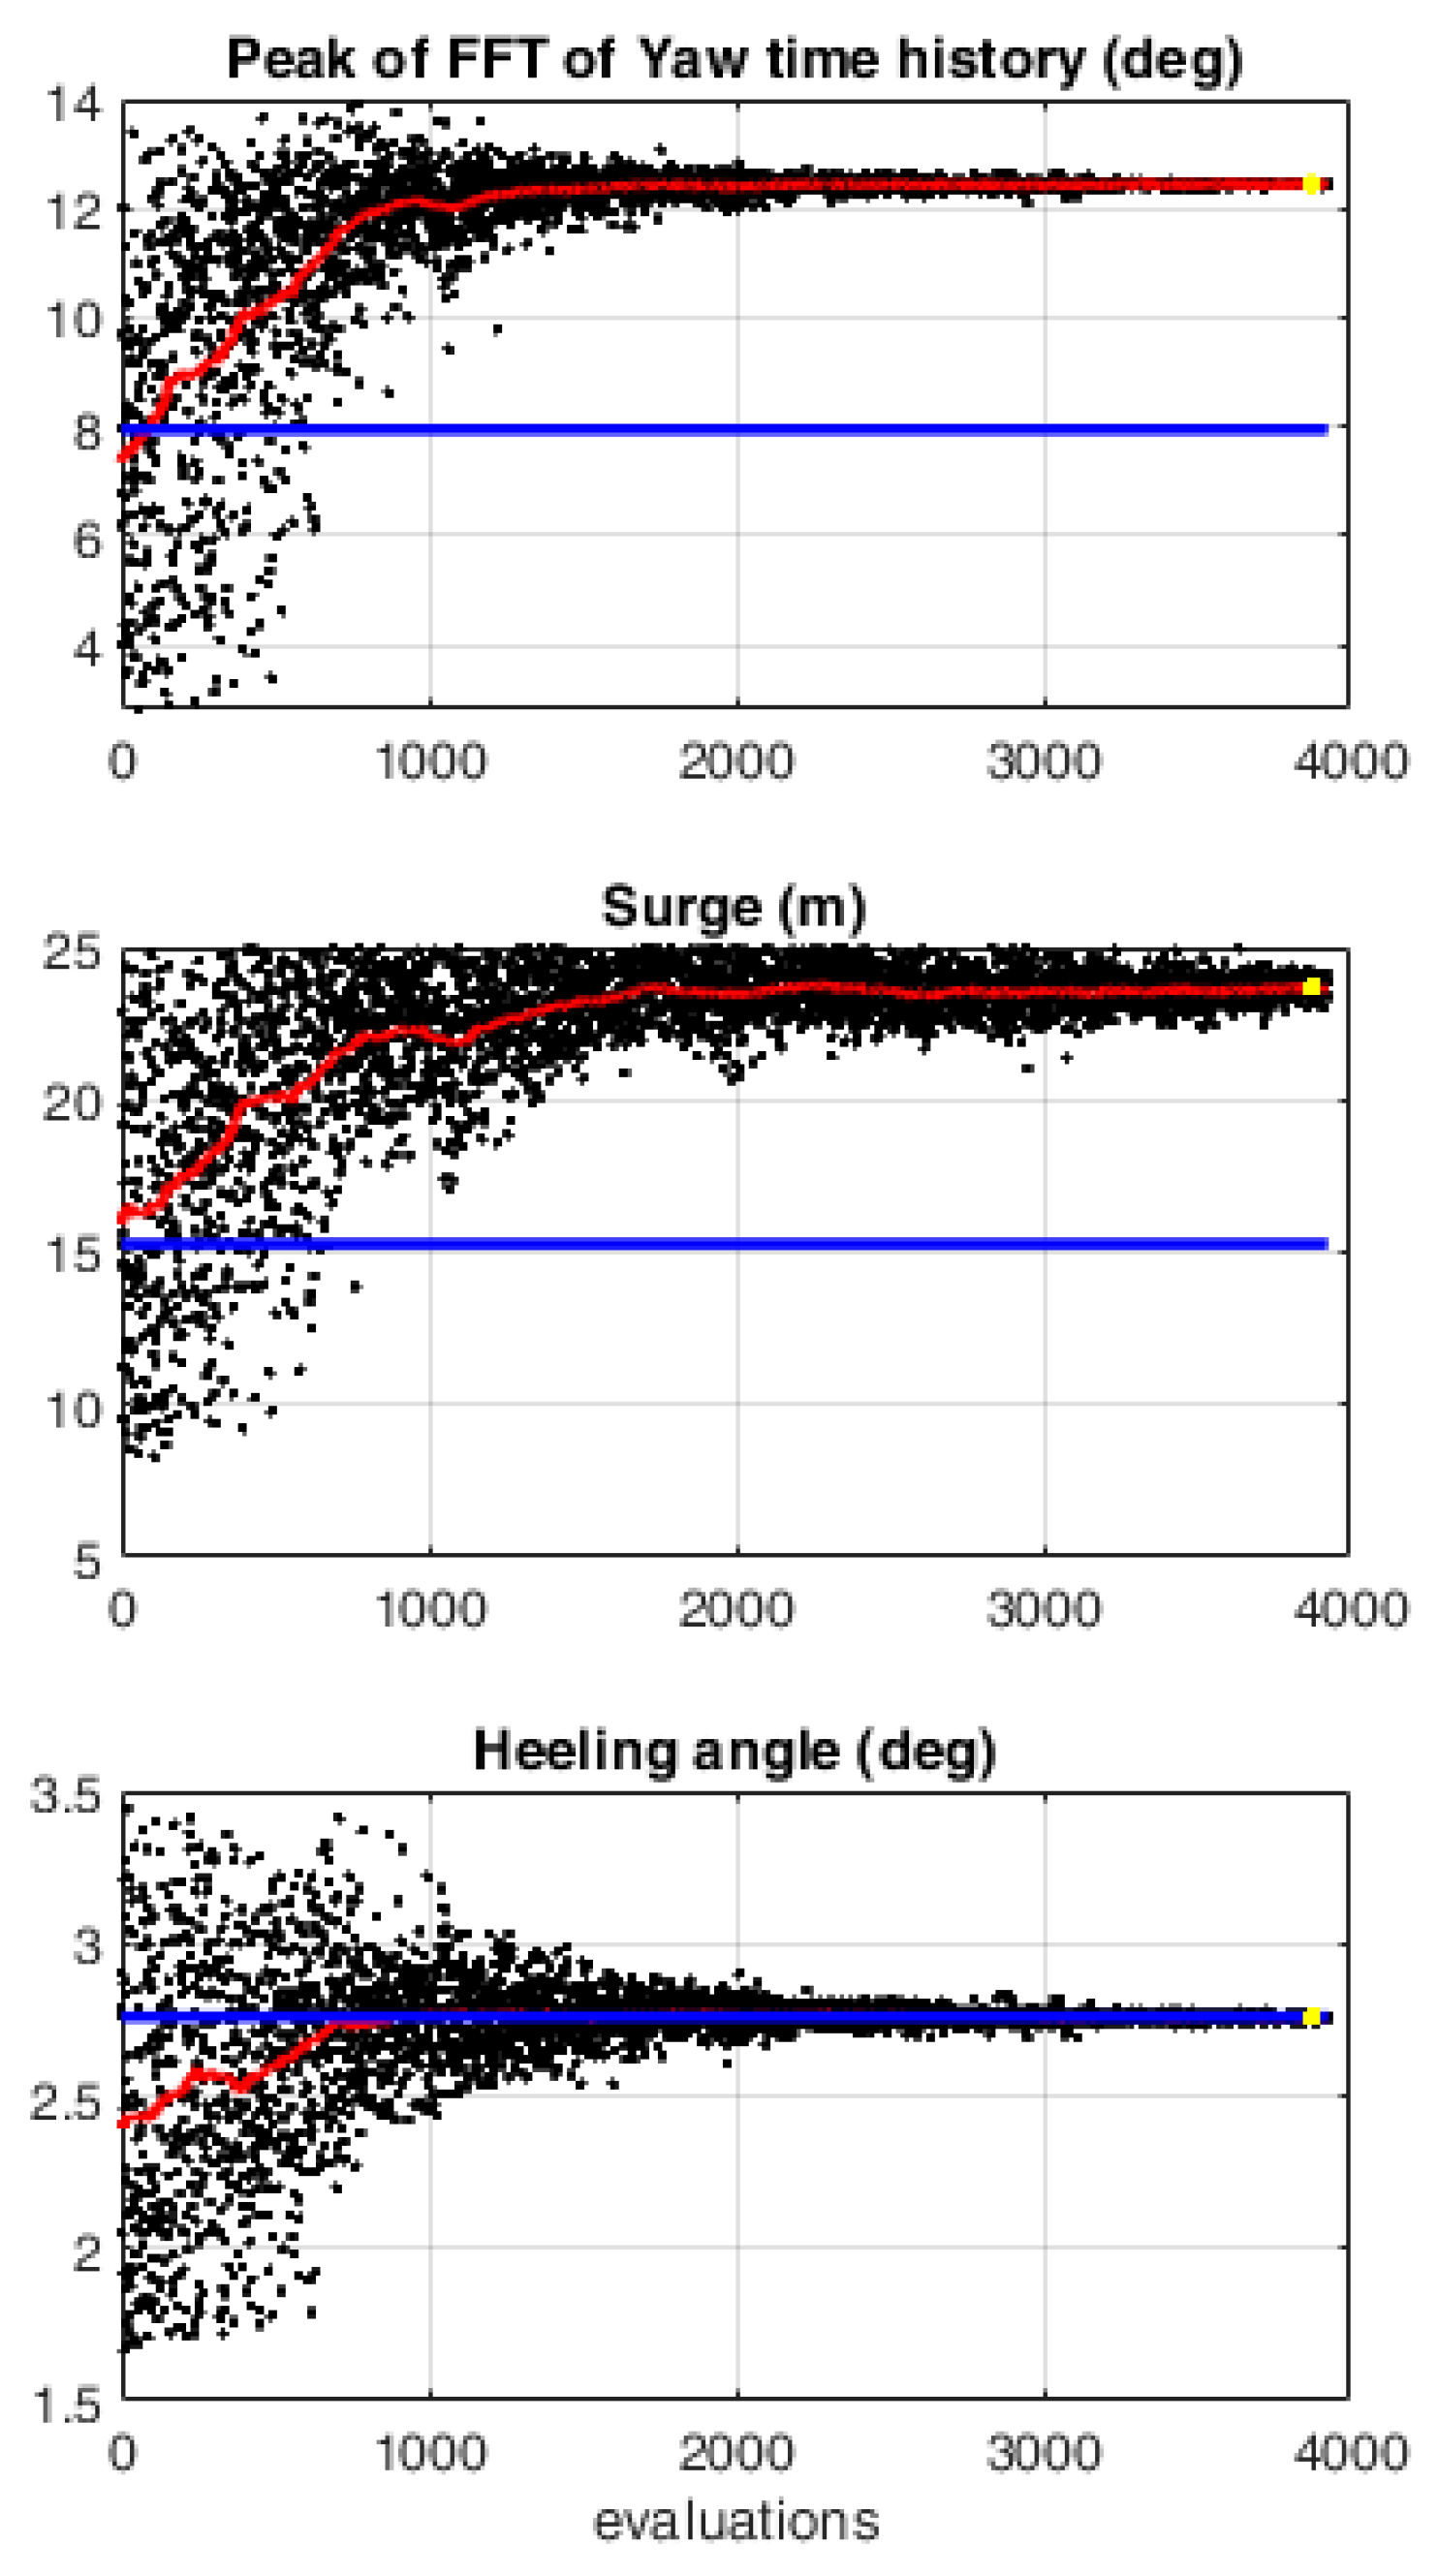
  • A frequency-domain analysis of selected time histories can be implemented at this stage to estimate the peak value of the yaw motion amplitude, which is included in the objective function of the optimization algorithm (described in more detail in the next section).
A schematic flowchart of the outlined procedure is shown in Figure 5.
These steps are repeated inside an optimization loop to maximize the chosen objective function. The choice of the design variables and their ranges of variation is fundamental and is driven by two conflicting necessities: on the one hand, a larger parameter space can more easily contain a solution that fully satisfies all of the design requirements; on the other hand, besides the larger computational time, larger ranges of variation for the parameters may lead to a solution that is very different from the original design, implying structural difficulties and a possible significant cost increase. The optimization process loop continues until the maximum value of the objective function is reached (within the tolerance defined by the convergence criteria). Some details of the optimization algorithm are given in the next section.

3. Results

By integrating the optimization framework discussed above, selected dimensions of the floating platform and the mooring lines’ properties were chosen, and the frequency and amplitude of oscillation of the yaw motion were optimized in compliance with the operation of the selected wake control scheme. Moreover, a simplistic model of the structural modifications of the tripod and mooring lines was implemented, and the effect on the costs was considered to avoid cost-ineffective solutions. Due to the number of design variables and the non-linearity of the output objective function discussed in the following paragraph, a heuristic method was chosen to find the best-performing configuration. A differential evolution method, already implemented in an open-source Python module, was selected for the optimization process [19,20]. The differential evolution algorithm is a stochastic population-based method used for global optimization problems. The algorithm creates a series of initial candidate solutions, trying to encompass all of the design space (hypercube method). At each iteration, it generates new candidate solutions by mixing the design variables of some selected candidates (crossover) or stochastically modifying the design variables of some selected individuals (mutation), using a selection criterion based on the value of the objective function. Following the analysis performed in [18], the distance of the spars (buoyant bodies), the distance of the anchors, and the length of the mooring lines were selected as design variables.

3.1. Optimization Definition

The complete objective function, including the cost of the tripod brace and moorings, together with the maximization of the yaw amplitude, can be represented by the following expression:
F o b j = w a m p   1 Δ θ z , p e a k + w C   | C m C m 0 | C m 0 +   | C t r i C t r i 0 | C t r i 0  
The weighting factors w a m p and w C are introduced to account for the different “importance” attributed to each of the two components of the target function (yaw amplitude, costs). The first part of the objective function allows the maximization of the yaw motion. The procedure to evaluate the term Δ θ z , p e a k , representing the maximum yaw oscillation amplitude, is described in the next paragraph. As regards the costs, the minimization of the target function will lead to a solution that is still close to the reference one (trying to minimize the absolute value of the difference in costs). This is implemented to avoid solutions with excessively different structural safety margins, both in the structure and in the mooring lines.

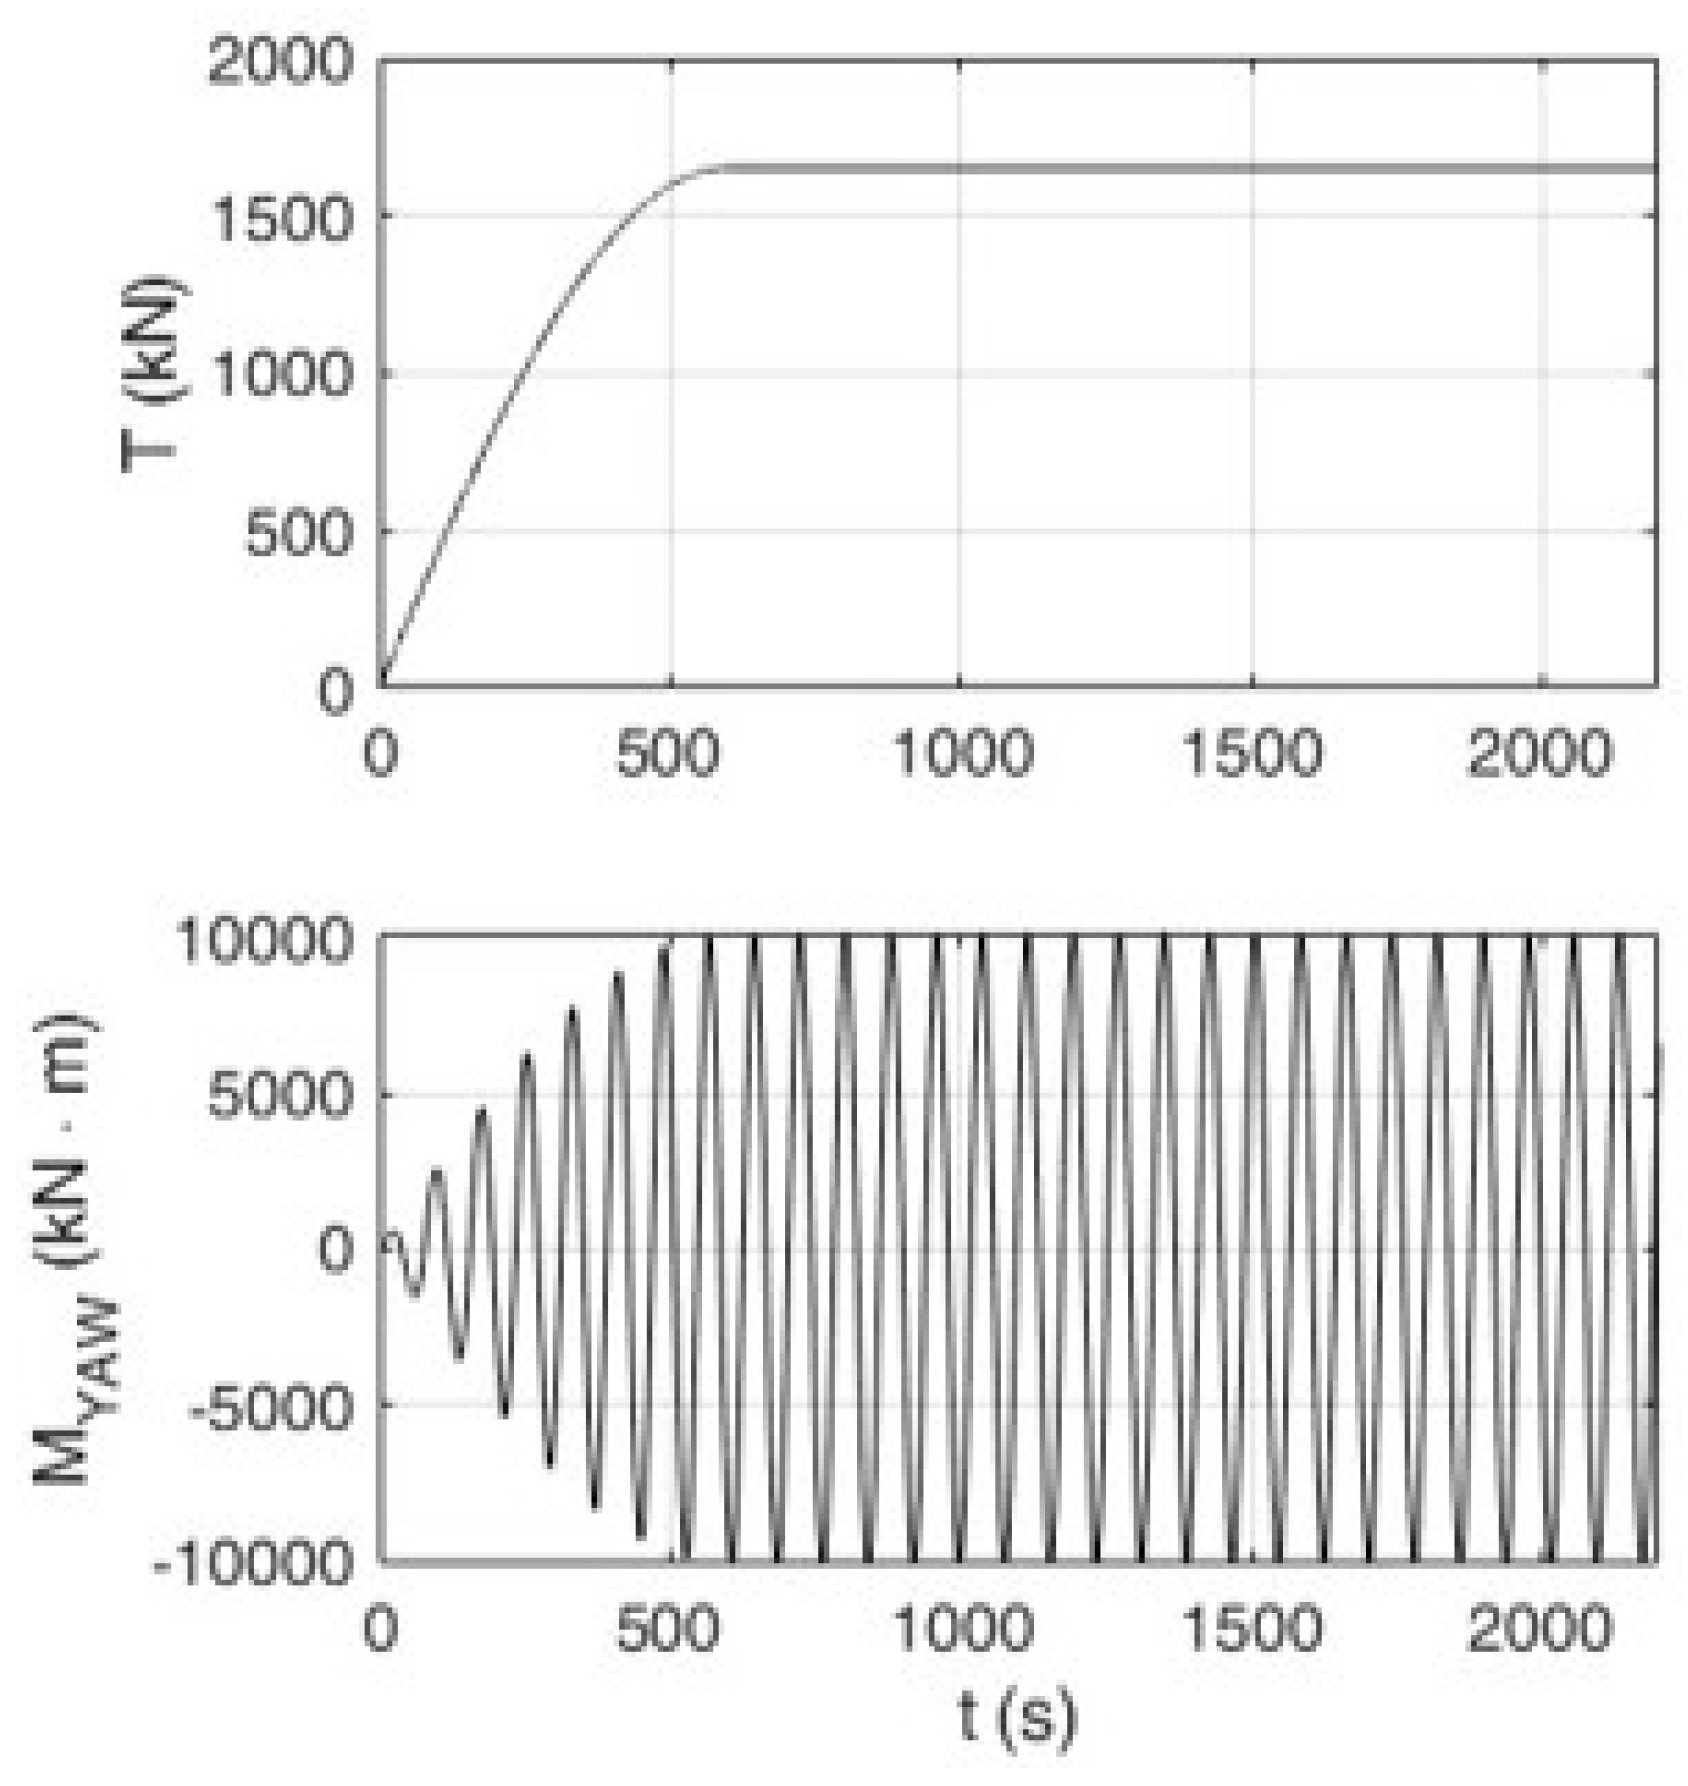
3.2. Simulation Setup and Response Analysis

The simulation setup for the optimization of the yaw amplitude motion was as follows:
  • still air;
  • still water;
  • a deactivated control system;
  • a fixed rotor;
  • a constant force applied along the rotor shaft axis, modeling the rated thrust of the rotor.
To simulate the effects of the chosen control logic (“Helix strategy”) on the loads applied to the rotor, a time-varying periodic yaw moment was used at the tower top, with an assigned time history, resulting in the forced motion of the system.
A simulation time equal to 2200 s was assumed (this value was chosen to ensure the settling of a steady-state response under the Helix control action, after the initial transient; the chosen value was a trade-off between accuracy and computational cost).
To obtain Δ θ z , p e a k , a frequency-domain analysis of the yaw response in the last 800 s was performed to determine the normalized Fourier transform of the signal. The peak value was stored for each simulation, representing the maximum amplitude of the yaw motion at the “steady” periodic state due to the yaw moment excitation.

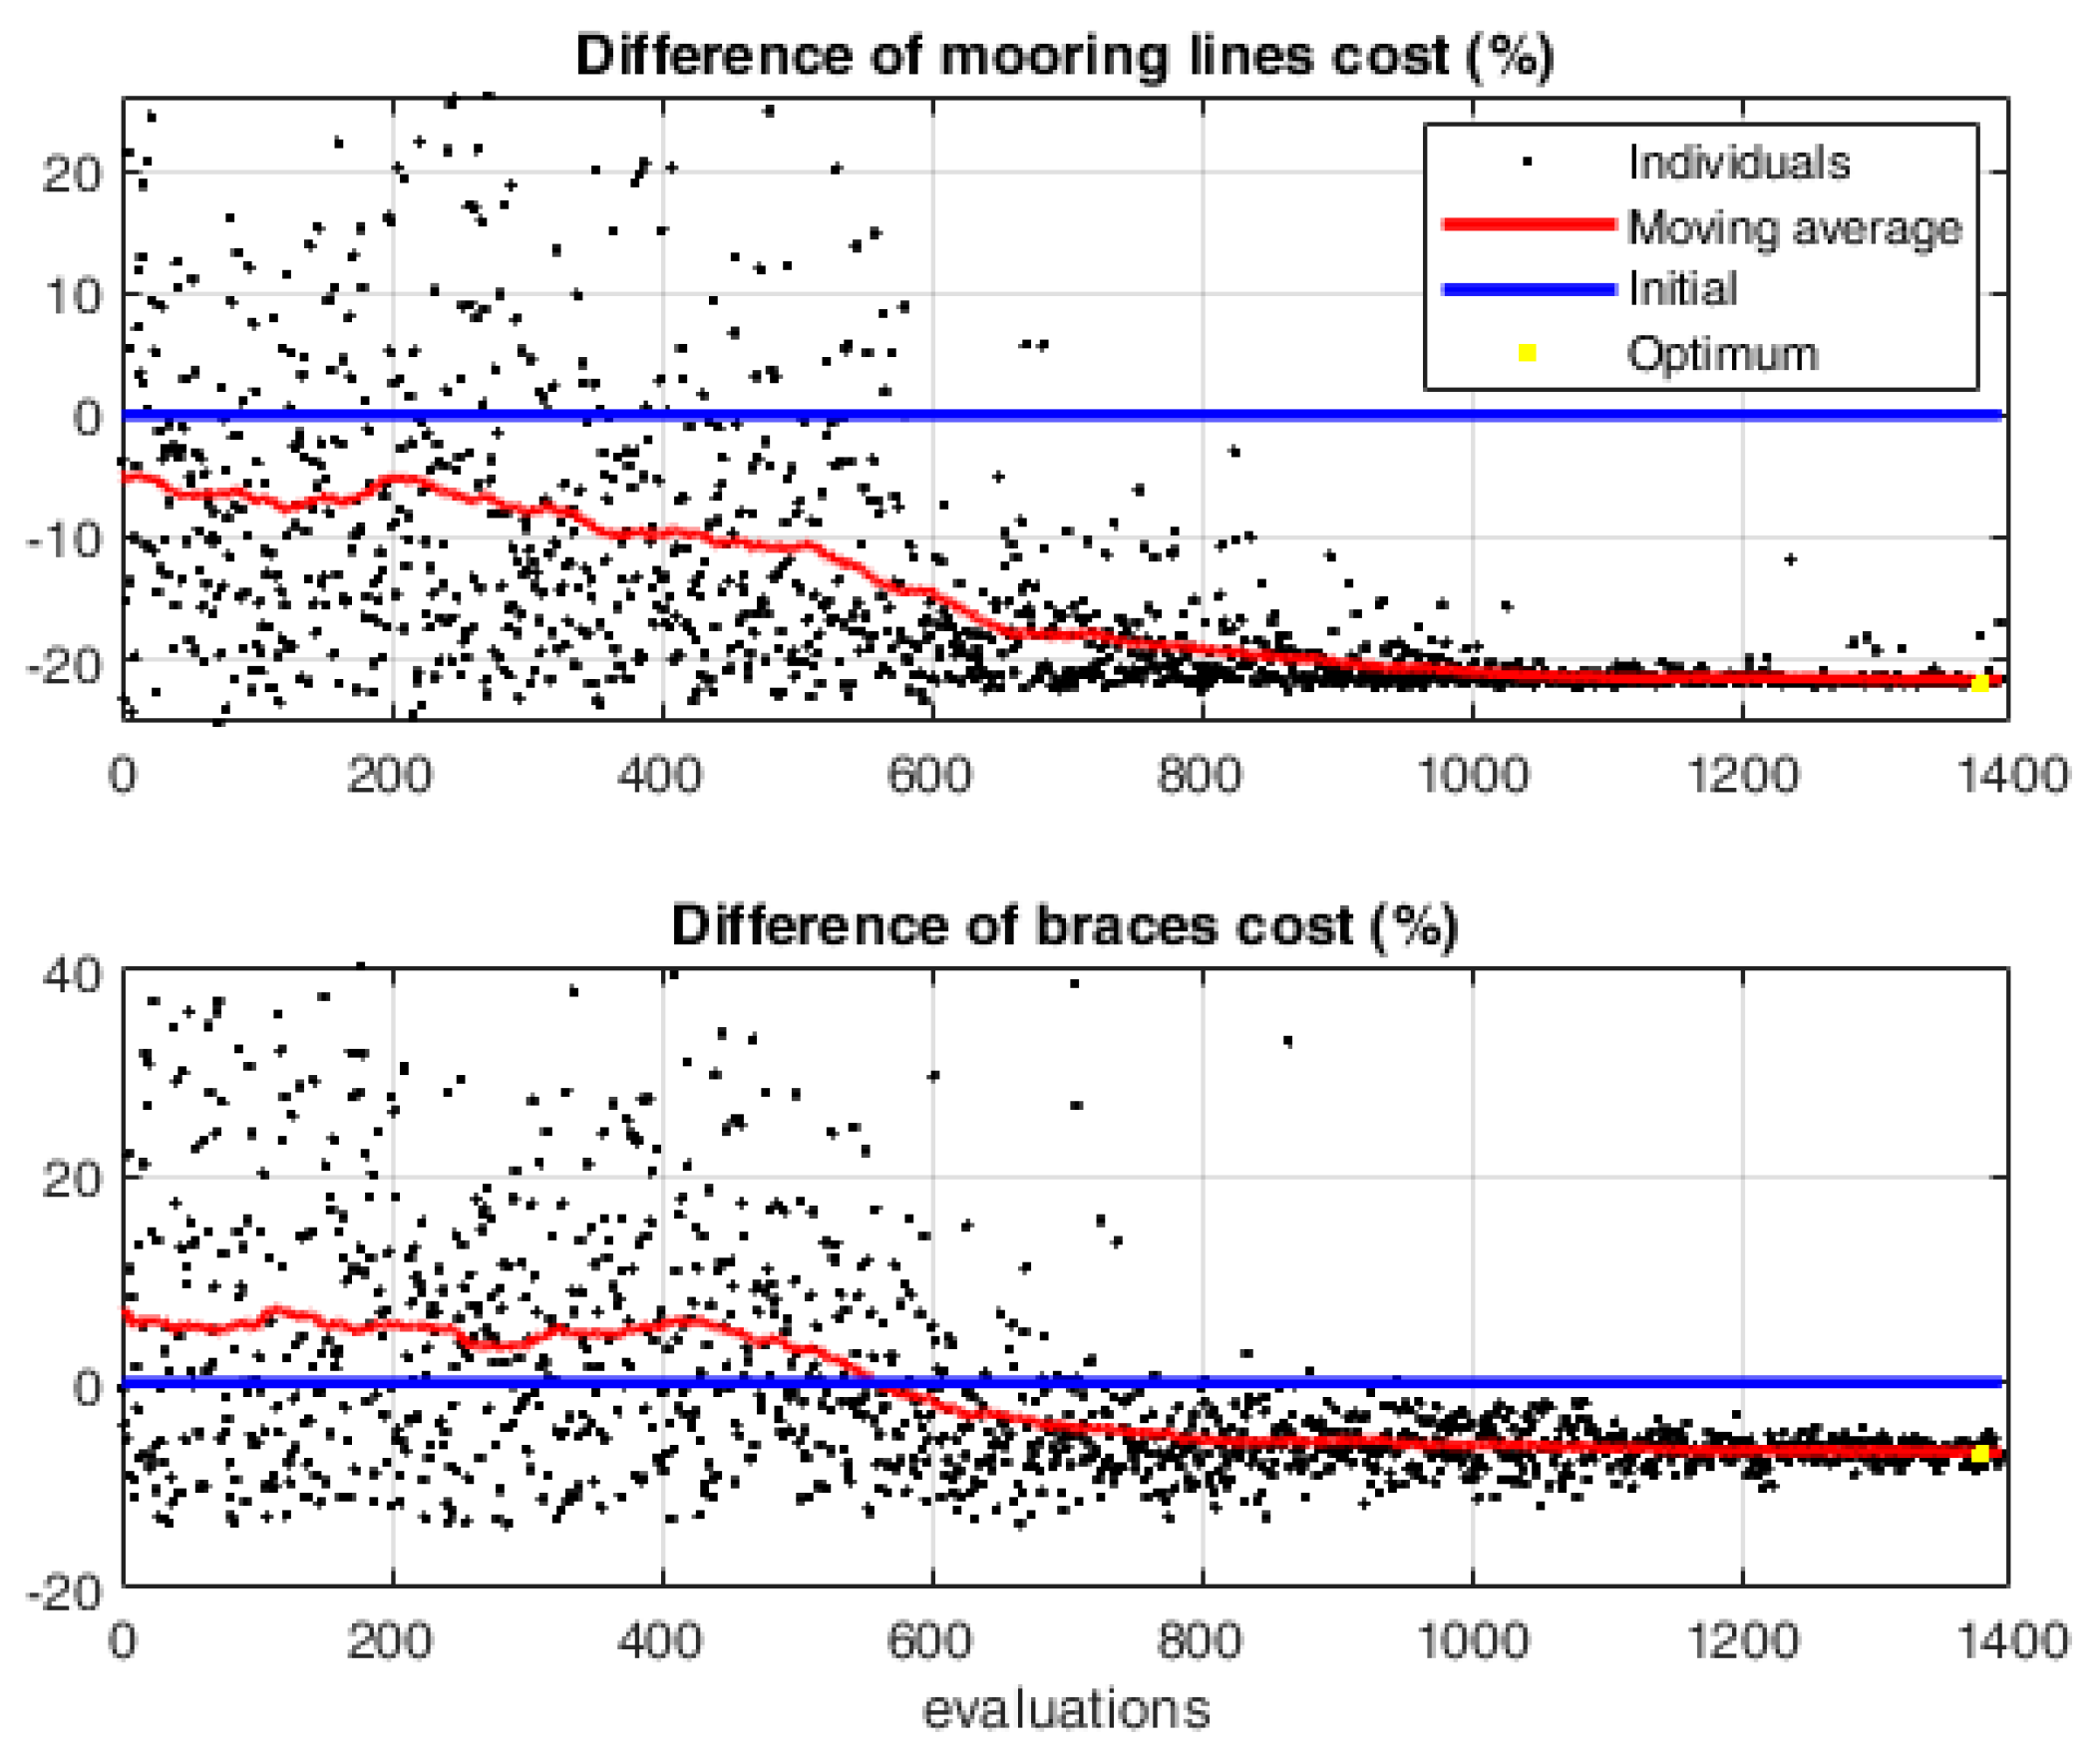
3.3. Optimization Results

The results obtained from the initial optimization runs (shown in [18]) were based on the assumption that the yaw motion of the platform experiences amplification only when the natural frequency of the floating platform–mooring system is the same as the desired excitation frequency. Instead, in this work, the effective motion amplitude has been taken into consideration, so that we consider not only the excitation frequency requirement but also the damping of the system, which can significantly influence the dynamics at the natural frequency. In fact, considering the effective amplitude of the yaw motion presents two main advantages compared to the simplified optimization approach reported in [18]:
  • It provides a slight improvement in the modeling accuracy of the control action, directly accounting for the effective input yaw moment related to the adopted control strategy, instead of considering the free decay response;
  • It allows the evaluation of the motion response amplitude for a given frequency and amplitude of the excitation input yaw moment, instead of simply seeking a desired peak frequency, thus providing more information to evaluate the effectiveness of the control strategy to be optimized in the next stage of the work.
To simulate the effects of the chosen control logic (“Helix strategy”) on the loads applied to the rotor, a time-varying periodic yaw moment was applied at the tower top, with an assigned time history, resulting in the forced motion of the system. The individual pitch control generates a yaw moment, which is transferred from the rotor shaft to the nacelle and eventually from the nacelle–tower connection to the tower top, inducing yaw motion in the floating offshore wind turbine. The yaw moment’s time history is incorporated as an independent load at the tower top, along with a fixed thrust, and the assumed loading time histories are shown in Figure 6. The uncoupled superposition of the effects produced by these two independent loads is assumed to evaluate the amplitude of yaw motion and surge displacement. Thus far, no coupling between the loads and motions has been modeled. Two optimization runs were carried out, with 50 iterations for each optimization and with 60 individuals created for each iteration. The choice of the number of iterations and individuals was based on the observation of the convergence process by successive attempts, ensuring that the generated individuals in subsequent generations tend to reduce their dispersion around the final design values of the main configuration parameters. The convergence process is illustrated in the figures reported in the following sections (Figure 7, Figure 8, Figure 9 and Figure 10), which show the progressive approach of the design parameters toward the final definite value.
Some of these individuals resulted in diverging outputs in time-domain simulations. These individuals were discarded automatically in the optimization framework, assigning a penalty value to the objective function so that they were unlikely to generate new individuals.
Due to the multi-objective nature of the considered optimization problem, the choice of the weighting factor for the two design goals may significantly affect the search process’ evolution and the final design. Since the Helix control strategy adopted in this study is still in the development stage, the main focus of the analyses is on improving the platform response to match the control requirements and enhance the desired wake recovery performance. Thus, a larger weight has been assigned to the platform response goal. Two test cases are considered in this study: in the first case, a relatively small influence of the economic goal is assumed (setting a 10% weighting factor for the cost component of the objective function), while, in the second test case, the economic goal is completely neglected to explore the unconstrained potential performance enhancement. In summary, accounting for the greater interest in enhancing the yawing response, the weighting factors were set as w a m p = 0.90 and w C = 0.10 for the first optimization and as w a m p = 1.00 and w C = 0 for the second one.
The definition of the structure of the objective function was guided by the need to account for the two different design goals: the goal of improving the platform’s response to match the requirements of the control strategy and the limitation of the cost increase. Thus, the proposed form of the objective function is the more natural choice to consistently represent the nature of the assumed design problem. Moreover, due to the highly non-linear nature of the problem, based on the results of multiple independent simulations, the use of a genetic algorithm was considered to explore the complex design space, accounting for various configuration variables and feasibility constraints, while avoiding possible problems caused by local minima (such as in gradient-based approaches).

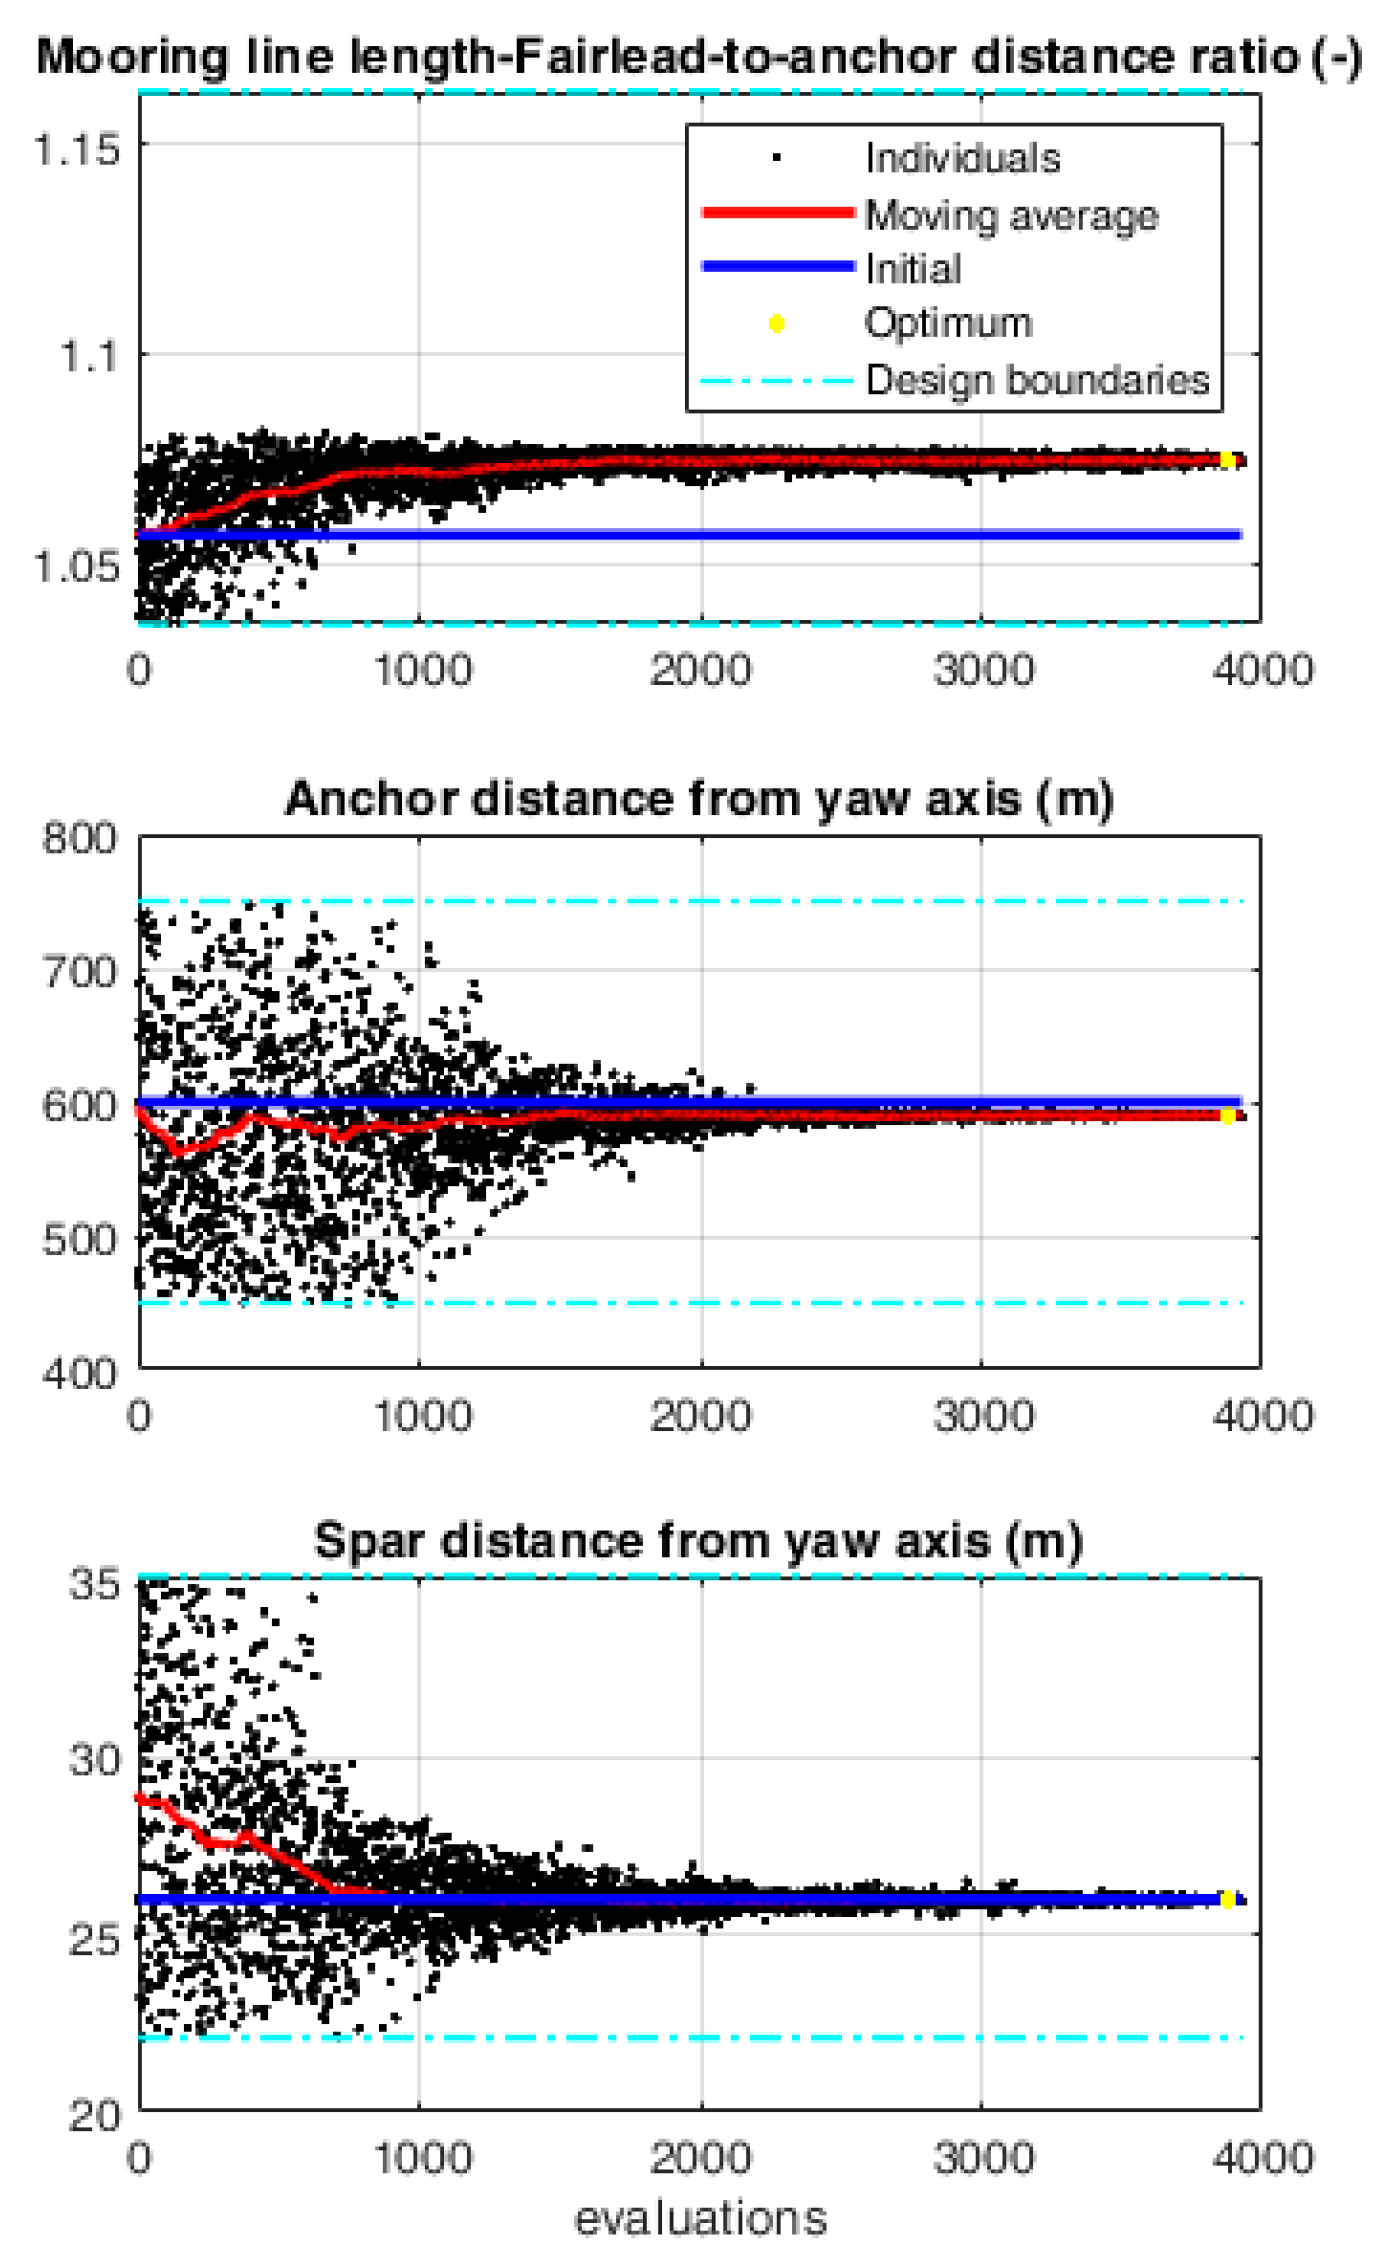
3.4. First Optimization Run

In this paragraph, the main results of the first optimization run (with w a m p = 0.90 and w C = 0.10) are described. The optimization process was performed on an Intel® Core™ i9-10940X CPU @ 3.30GHz employing 12 cores and taking up to 2 days to complete. The unfeasible solutions that did not comply with the assumed constraints have been excluded from the analysis. The evolution of the design variables and post-processed outputs for each simulated individual is shown in Figure 7 and Figure 8, while the differences in the costs are shown in Figure 9. The optimum solution, represented as a yellow star in the plots, shows an increase in the value of the yaw amplitude motion (13.6 deg) with respect to the baseline configuration (8.0 deg), while keeping the structures and mooring costs practically unchanged (Figure 9). Despite the relatively low weight attributed to the part of the objective function related to costs ( w C = 0.10), the geometry of the platform (i.e., the spar distance from the yaw axis) is unchanged between the initial and final (optimized) configurations, while the mooring line length factor M L L F ) and the anchor’s distance from the yaw axis ( x A ) show more significant changes. To obtain such an increase in the yaw amplitude motion, the optimizer modifies the mooring line configuration so that the slackness of the mooring lines allows for an increase in the yaw natural period, synchronizing it with the Helix excitation period, as was shown in previous works [18]. The optimized configuration shows a large increase in surge displacement (23.5 m), which is caused by the applied thrust force; however, it is within the considered design constraint of 25 m.
Figure 7. Design variables’ evolution in the first optimization.
Energies 18 02813 g007
Figure 8. Selected post-processed outputs. First optimization. In the figure, the black dots represent all the configurations generated in the optimization process. The initial design is represented by the blue solid line, while the red solid line indicates a moving average trend of the generated solutions throughout the iterations.
Energies 18 02813 g008
Figure 9. Cost variation evolution for each individual as simulated in the first optimization.
Energies 18 02813 g009

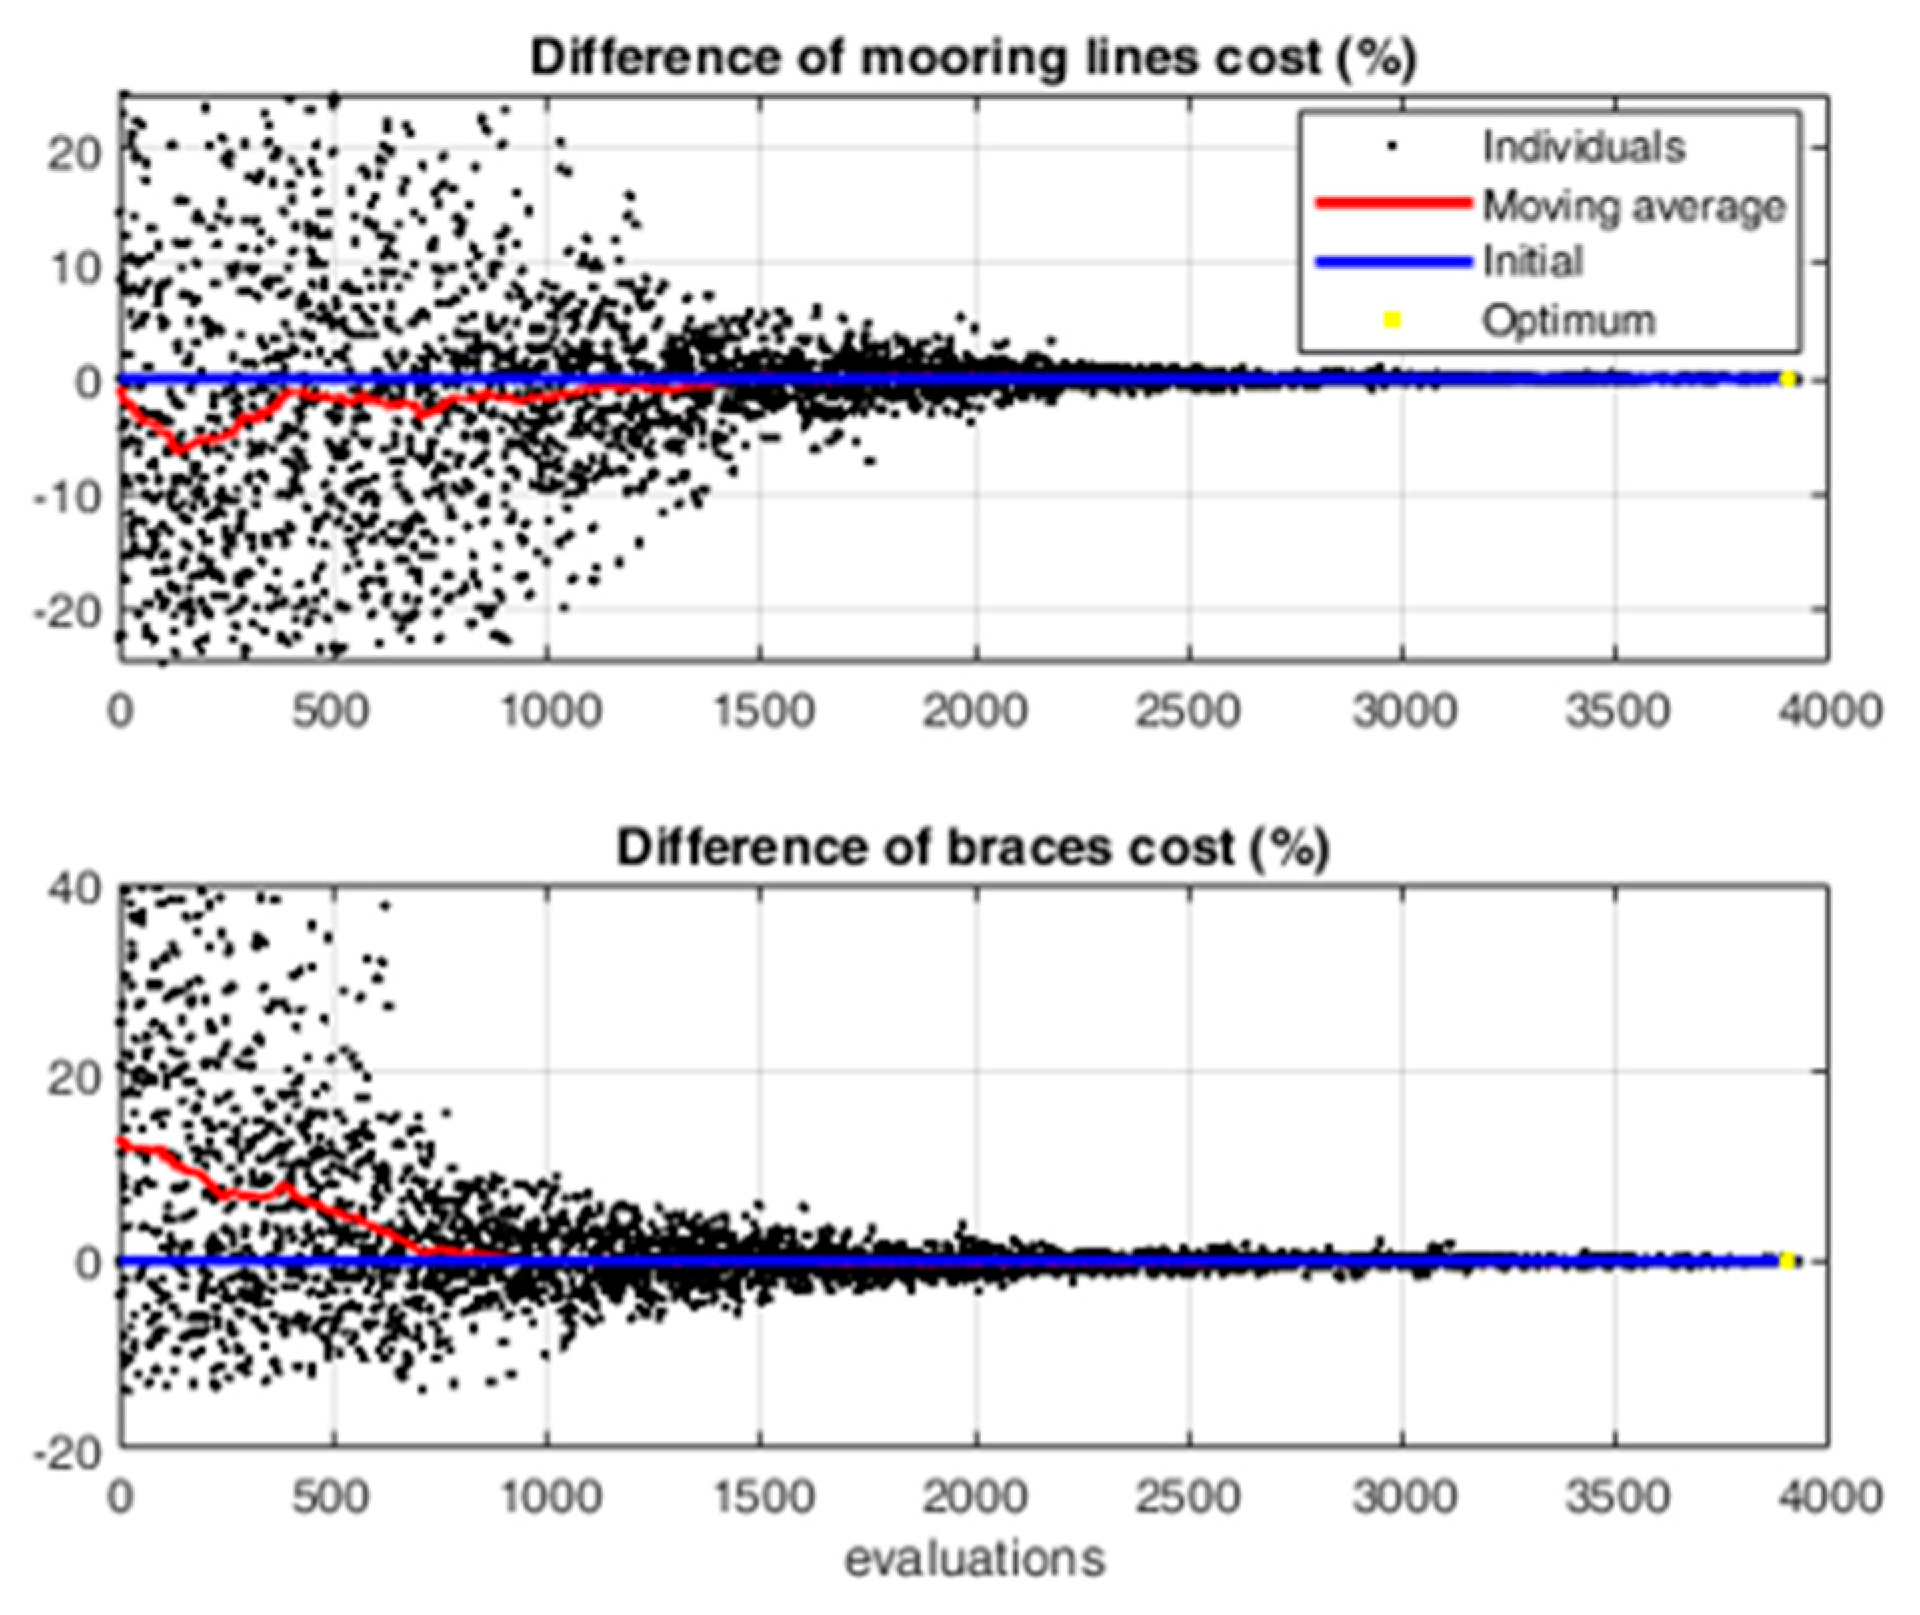
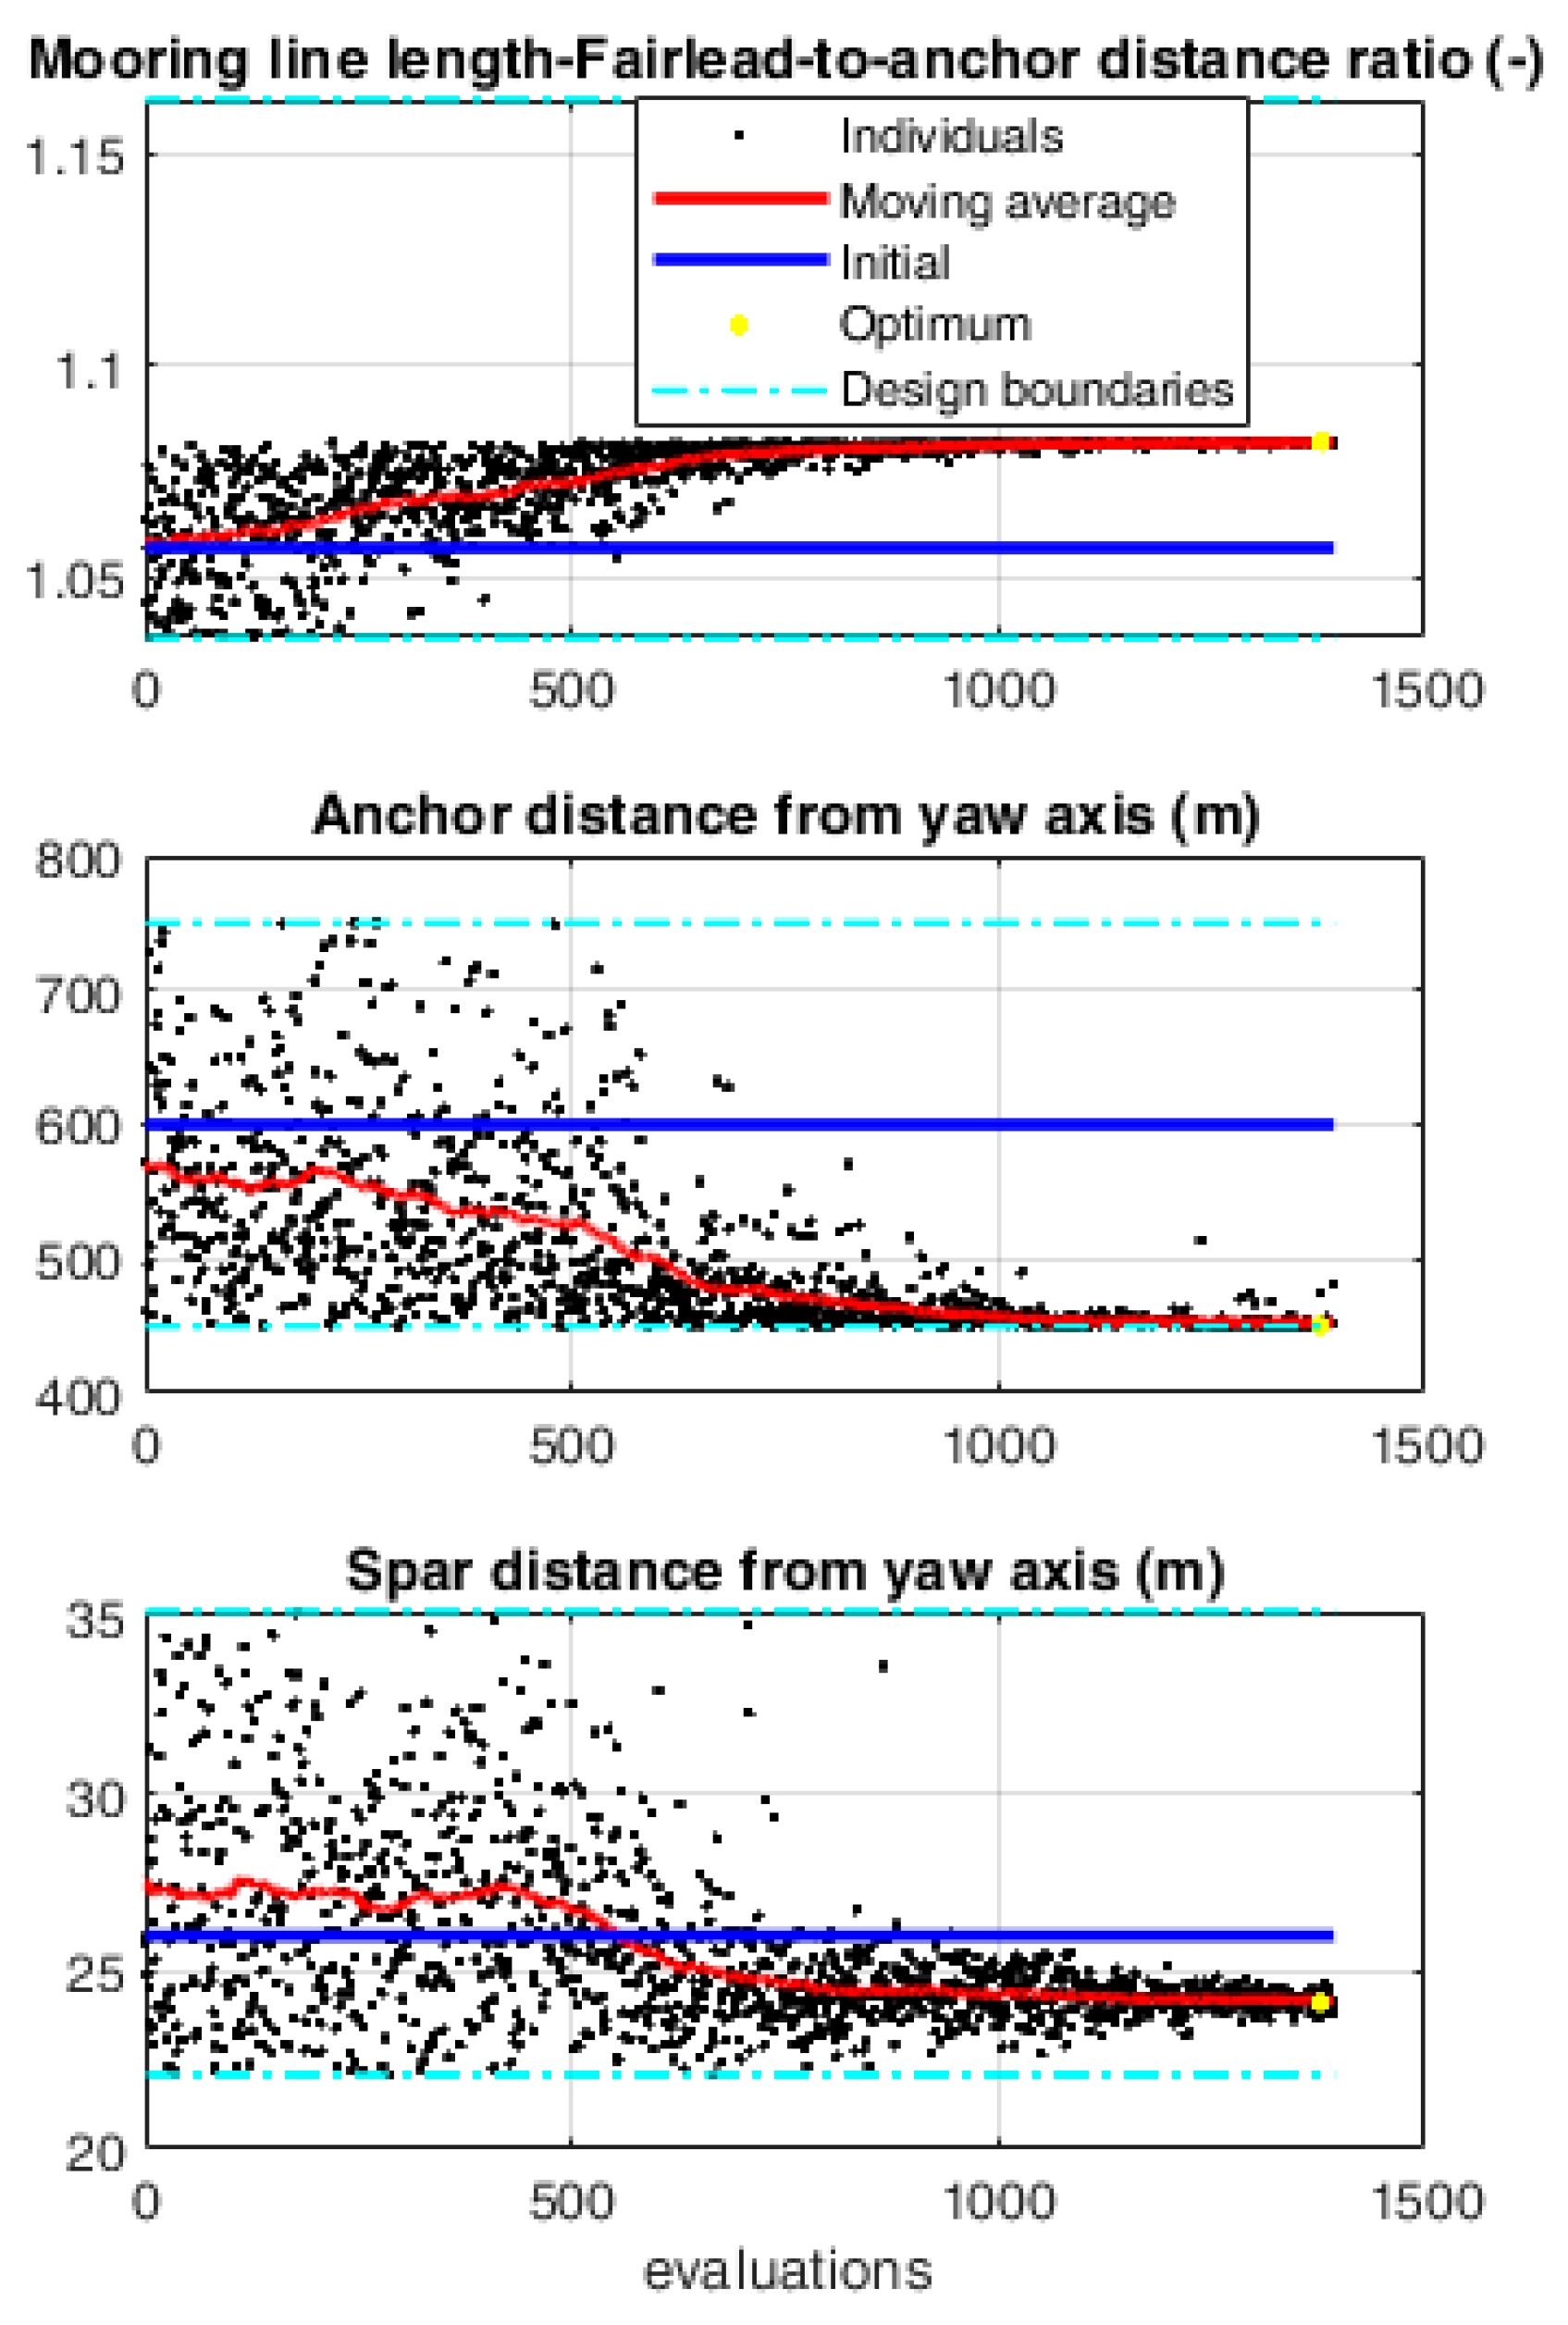
3.5. Second Optimization Run

A second optimization run with w a m p = 1.0 and w C = 0 was carried out to relax the constraint on the costs. In this second optimization run, due to the wider exploration of the design variables, more configurations led to diverging OpenFAST simulations, so only roughly 1400 individuals were post-processed in the framework, as shown in the following plots. The design variables’ evolution is shown in Figure 10.
Figure 10. Design variables’ evolution in the second optimization.
Energies 18 02813 g010
The post-processed outputs and the differences in costs with respect to the baseline configuration are shown in Figure 11 and Figure 12, respectively. In this second run, where no cost constraint was applied (i.e., w C = 0), a larger variation in both the platform geometry and mooring lines could be observed (in Figure 10, the optimal spar distance is 24 m), with a somewhat surprising reduction in the mooring and platform costs (Figure 12), which was related to the reduction in both the structure’s size and the mooring lines’ length in the final configuration. The yaw amplitude motion is increased to 13.6 deg, while both design constraints remain within the boundaries (the surge is 25 m and the heeling angle is 3.08 deg). A summary of the main results obtained from the performed optimization runs is reported in Table 5, which indicates the variations in the considered platform parameters, together with the design and constraint variables.
It can be seen that, generally, larger variations in the configuration parameters can be observed for Configuration 2 in Table 5, which refers to the second optimization run (Section 3.5), compared to the variations observed in the first optimization run (indicated in Table 5 as Configuration 1; described in Section 3.4). In the first run (Config. 1), the effect of the cost limitation was considered within the objective function; thus, the variations in the geometric parameters were limited by the necessity of limiting the increase in the platform and mooring costs. In contrast, in the second run (Config. 2), no constraint on the costs was applied, with the aim of exploring the full potentiality of the oscillation improvement procedure; in this case, larger variations in the main configuration parameters could generally be observed.

4. Conclusions

As already observed from a preliminary optimization study, the parameters related to the mooring line configuration seem to have a major impact on the response-related part of the objective function, especially when the cost is accounted for in the optimization. Thus, two optimal configurations were obtained: one, essentially based only on a mooring line configuration change (first optimization run), provides an increase in the amplitude yaw motion and presents characteristics that are close to those of the initial configuration; the other has a significant reduction in costs but with larger geometry variations from the initial configuration and is thus potentially less reliable due to the larger difference from the original geometry.
It must be remembered that the cost target in the objective function is defined as a cost variation from the baseline configuration. Thus, the minimization of this element of the objective function tends to reduce the cost variations from the initial configuration, in terms of both an increase and a reduction. This is necessary because the cost variation estimates are based on scaling reasoning around the initial configuration: deviating too far from the initial configuration reduces the accuracy of the assumed cost model. When the weight of the cost in the objective function is set to zero, as in the second optimization run, the optimization algorithm also explores solutions further from the starting point. In this sense, the optimization procedure achieves a significantly larger reduction in costs. Further studies aimed at the more complex modeling of the FOWT and the implementation of pitch control to study the effective motion amplitudes of the system are expected to be carried out. This will enable us to correctly evaluate the impacts of the obtained improvements on the yaw amplitude motion caused by the control strategy and the increase in power production in a floating offshore wind farm with the implementation of such modifications in the design and control strategy.

Author Contributions

G.L.: Conceptualization, methodology, software, validation, formal analysis, investigation, writing—original draft preparation, writing—review and editing. G.T.: Conceptualization, methodology, software, writing—review and editing. D.P.C.: Conceptualization, methodology, supervision, writing—review and editing. All authors have read and agreed to the published version of the manuscript.

Funding

This project has received funding from the European Union’s Horizon 2020 research and innovation program under grant agreement No. 101007142. The authors would like to thank all of the participants in the FLOATECH project.

Data Availability Statement

The original contributions presented in this study are included in the article. Further inquiries can be directed to the corresponding author.

Conflicts of Interest

The authors declare no conflicts of interest.

References

  1. CATAPULT Offshore Renewable Energy. Floating Offshore Wind: Cost Reduction Pathways to Subsidy Free. January 2021. Available online: https://ore.catapult.org.uk/wp-content/uploads/2021/01/FOW-Cost-Reduction-Pathways-to-Subsidy-Free-report-.pdf (accessed on 16 January 2024).
  2. Jensen, M.K. Update of recent trends (Offshore). In Proceedings of the 6th Wind Energy Systems Engineering Workshop, Boulder, CO, USA, 29 August–1 September 2022. [Google Scholar]
  3. Eikrem, K.S.; Lorentzen, R.J.; Faria, R.; Stordal, A.S.; Godard, A. Offshore wind farm layout optimization using ensemble methods. Renew. Energy 2023, 216, 119061. [Google Scholar] [CrossRef]
  4. Lerch, M.J.; Prada Gil, M.D.; Molins i Borrell, C. A metaheuristic optimization model for the inter-array layout planning of floating offshore wind farms. Int. J. Electr. Power Energy Syst. 2021, 131, 107128. [Google Scholar] [CrossRef]
  5. Meyers, J.; Bottasso, C.; Dykes, K.; Fleming, P.; Gebraad, P.; Giebel, G.; Göçmen, T.; van Wingerden, J.-W. Wind farm flow control: Prospects and challenges. Wind Energy Sci. Discuss. 2022, 7, 2271–2306. [Google Scholar] [CrossRef]
  6. Fleming, P.; Annoni, J.; Shah, J.J.; Wang, L.; Ananthan, S.; Zhang, Z.; Hutchings, K.; Wang, P.; Chen, W.; Chen, L. Field test of wake steering at an offshore wind farm. Wind Energy Sci. 2017, 2, 229–239. [Google Scholar] [CrossRef]
  7. Silva, J.G.; Ferrari, R.; van Wingerden, J.W. Wind farm control for wake-loss compensation, thrust balancing and load-limiting of turbines. Renew. Energy 2023, 203, 421–433. [Google Scholar] [CrossRef]
  8. OpenFAST Repository. Available online: https://github.com/OpenFAST/openfast (accessed on 28 April 2024).
  9. Eiben, A.E.; Smith, J.E. Introduction to Evolutionary Computing; Springer: Berlin/Heidelberg, Germany, 2015. [Google Scholar]
  10. Abbas, N.J.; Bortolotti, P.; Kelley, C.; Paquette, J.; Pao, L.; Johnson, N. Aero-servo-elastic co-optimization of large wind turbine blades with distributed aerodynamic control devices. Wind Energy 2023, 26, 763–785. [Google Scholar] [CrossRef]
  11. Van den Berg, D.; de Tavernier, D.; van Wingerden, J.W. Using The Helix Mixing Approach On Floating Offshore Wind Turbines. J. Phys. Conf. Ser. 2022, 2265, 042011. [Google Scholar] [CrossRef]
  12. Bak, C.; Zahle, F.; Bitsche, R.; Kim, T.; Yde, A.; Henriksen, L.C.; Hansen, M.H.; Blasques, J.P.; Gaunaa, M.; Natarajan, A. The DTU 10-MW Reference Wind Turbine; DTU Orbit: Kongens Lyngby, Denmark, 2013. [Google Scholar]
  13. Lemmer, F.; Raach, S.; Schlipf, D.; Guzmán, R.F. Definition of the SWE-TripleSpar Floating Platform for the DTU 10MW Reference Wind Turbine; Institute of Aircraft Design, Univerisity of Stuttgart: Stuttgart, Germany, 2016. [Google Scholar]
  14. DTU 10MW Reference Wind Turbine Repository. Available online: https://nrel.github.io/turbine-models/DTU_10MW_178_RWT_v1.html (accessed on 26 May 2025).
  15. Ikhennicheu, M.; Lynch, M.; Doole, S.; Borisadem, F.; Matha, D.; Dominguez, J.L.; Vicente, R.D.; Habekost, T.; Ramirez, L.; Potestio, S.; et al. D2.1—Review of the State of the Art of Mooring and Anchoring Designs, Technical Challenges and Identification of Relevant DLCs; Corewind, EU Funded Project: 2020. Available online: https://corewind.eu/ (accessed on 26 May 2025).
  16. Wang, S.; Moan, T. Serviceability Limit State Assessment of Semi-Submersible Floating Wind Turbines. J. Offshore Mech. Arct. Eng. 2024, 146, 022003. [Google Scholar] [CrossRef]
  17. Azcona, J.; Vittori, F.; Schmidt, U.; Savenije, F.; Kapogiannis, X.K.G.; Manolas, D.; Voutsinas, S.; Amann, F.; Faerron-Guzmán, R.; Lemmer, F. Design Solutions for 10MW Floating Offshore Wind Turbines; INNWIND.EU, EU funded project, Deliverable D4.37; 2017. Available online: https://www.innwind.eu/ (accessed on 26 May 2025).
  18. Lazzerini, G.; Coiro, D.P.; Troise, G. Optimization of a floating offshore wind turbine platform and mooring lines according to an innovative wind farm wake control technique. In Proceedings of the 7th Offshore Energy & Storage Symposium (OSES 2023), St. Julian’s, Malta, 12–14 July 2023. [Google Scholar]
  19. Storn, R.; Price, K. Differential Evolution—A Simple and Efficient Heuristic for Global Optimization over Continuous Spaces. J. Glob. Optim. 1997, 11, 341–359. [Google Scholar] [CrossRef]
  20. Lampinen, J. A constraint handling approach for the differential evolution algorithm. In Proceedings of the 2002 Congress on Evolutionary Computation. CEC’02 (Cat. No. 02TH8600), Honolulu, HI, USA, 12–17 May 2002; Volume 2. [Google Scholar]
Figure 2. Side-view sketch of the DTU 10 MW mounted on the Triple Spar. In this picture, only two of the three mooring lines are visible. Relevant quantities are defined in Table 4.
Energies 18 02813 g002
Figure 3. “Triple Spar” platform geometry with an indication of the overall structure and of the tripod brace section. Adapted from [17].
Energies 18 02813 g003
Figure 4. Turbine model used in the optimization framework.
Energies 18 02813 g004
Figure 5. Schematic flowchart of the optimization procedure.
Energies 18 02813 g005
Figure 6. Applied loads of time histories. The thrust value was chosen based on the DTU 10 MW RWT’s performance, while the yaw moment time history was obtained from internal discussions with the developers of the control strategy [11].
Energies 18 02813 g006
Figure 11. Selected post-processed outputs. Second optimization. In the figure, the black dots represent all the configurations generated in the optimization process. The initial design is represented by the blue solid line, while the red solid line indicates a moving average trend of the generated solutions throughout the iterations.
Energies 18 02813 g011
Figure 12. Cost variation evolution for each individual as simulated in the second optimization.
Energies 18 02813 g012
Table 1. Main turbine and baseline data.
PropertyValueUnit
Diameter178.23m
Hub height119m
Tower height90.630m
Total mass29,341.5ton
Nacelle yaw inertia7326kg∙m2
Platform yaw inertia2.0235 × 1010kg∙m2
Table 2. Mooring line characteristics.
PropertyValueUnit
Unstretched length610m
Cable diameter0.31m
Mass density594kg/m
Stiffness1.38 × 109N
Note: A certain degree of variability among the sources for the assumed baseline configuration has been observed in the available data.
Table 3. Selected design variables of the system.
Design VariableReference ValueRange of Variation
Platform MinMax
Spar distance from yaw axis ( x S )26 m23.4 m33.8 m
Mooring Lines MinMax
Mooring line length factor ( M L L F ) as defined in Equation (1)1.0571.0401.152
Anchor distance from yaw axis ( x A )600 m450 m750 m
Table 5. Design variables and output variables of starting and final configurations.
Design VariablesStarting Config.Optimal Config. 1Optimal Config. 2
Platform
Spar distance from yaw axis ( x S )26.0 m26.0 m24.1 m
Mooring
Mooring line length factor ( M L L F )1.0571.0751.082
Anchor distance from yaw axis ( x A )600.0 m589.2 m451.6 m
Output variables
Yaw amplitude ( Δ θ z , p e a k ) 7.9 deg12.0 deg13.6 deg
Difference in mooring line costs   | C m C m 0 | C m 0 --−22%
Difference in brace costs   | C t r i C t r i 0 | C t r i 0 --−7%
Surge excursion at rated thrust ( Δ x r a t e d ) 15.0 m24.0 m25.0 m
Heel angle with rated thrust ( Δ θ r a t e d ) 2.0°2.8°3.1°
Mooring line length ( l m ) 609.9 m609.7 m475.0 m
Disclaimer/Publisher’s Note: The statements, opinions and data contained in all publications are solely those of the individual author(s) and contributor(s) and not of MDPI and/or the editor(s). MDPI and/or the editor(s) disclaim responsibility for any injury to people or property resulting from any ideas, methods, instructions or products referred to in the content.

