Abstract
The lower and middle Carboniferous shale sequences are one of the important potential hydrocarbon source rocks in the piedmont of the southwestern Tarim Basin, China (PSTB). Rock samples were collected from the lower and middle Carboniferous formations on the Kushanhe, Altash, and Aitegou outcrops in the PSTB with the intention of mapping the hydrocarbon molecules within these shale sources and disclosing the relevant geochemical implications. The ratios of Pr/Ph < 1.0 and DBT/P < 0.4 and the enrichment of C23 tricyclic terpanoid indicate that the Carboniferous shale sources were deposited in a reducing and sulfate-poor marine setting with the contribution of terrestrial freshwater. Marine aquatic algae act as the major contributor, resulting in the formation of Type II1 kerogen. The Carboniferous shale sequences contain abundant diamondoids with 2–4 cages with the predominance of methyldiamantanes, dimethyldiamantanes, and methyltriamantanes. Quantitative extended diamondoid analysis indicates the occurrence of carbonate-rich and carbonate-poor organic facies in the PSTB. Compared to the carbonate-poor facies, the carbonate-rich facies is relatively depleted in C27 diasteranes and rich in gammacerane, C27 regular steranes, and alkylated triamantanes. This indicates that it was deposited in the more salty and stratified water column but with less input of land higher plants. The clay catalysis effects are assumed to be responsible for the discrepancy in steranes and diamondoids. The Carboniferous shale sequences also contain abundant polycyclic aromatic hydrocarbons with 2–5 rings with the predominance of C0–1-phenanthrenes, chrysenes, and benzofluoranthenes. Thermal maturity parameters associated with polycyclic aromatic hydrocarbons and diamondoids suggest that the Carboniferous shale sources have arrived at the late mature to highly mature stage. This study provides the detailed molecular fingerprints of the lower and middle Carboniferous shale source sequences and explores the underlying geochemical implications. This should be helpful for oil–oil and oil–source correlations and hence petroleum exploration activity in the PSTB.
1. Introduction
The piedmont of the southwestern Tarim Basin, China (PSTB) hosts a huge amount of oil and gas resources with the estimated geologic reserves of 4.5 × 10⁸ t for crude oil and 1.9 × 10¹² m3 for natural gas, and is hence considered to be one of the promising candidates for petroleum exploration in the Tarim Basin [1,2] (Figure 1).
Several sets of hydrocarbon source rocks were deposited in the PSTB including the shale sequences within the Carboniferous, Permian, and Jurassic formations [2] (Figure 2). The Permian and Jurassic source sequences have proved to be effective source rocks in the Kekeya Oilfield and Akemomu gas field [1,2,3,4]. The Carboniferous source sequences were deposited in the marginal marine to shallow marine shelf settings, and are located mainly in the lower and middle Carboniferous formation including Kelitage (C1k), Heshilafu (C1h), Kelawuyi (C2k), and Azigan (C2a) [1,5]. They contain mainly Type II organic matter at the mature to overmature stage [1,6]. Owing to their deep burial depth in the Kashgar-Hotan tectonic belt, the Carboniferous shale sequences were considered to be potentially important sources [3]. Liquid oil extracted from Kelatuo oil sands was believed to be derived mainly from the lower Carboniferous shale sequences [3]. Natural gas produced from Well AK1 was supposed to have the major contribution of the overmatured Carboniferous sources in the Akemomu gas field [7,8]. However, the extremely 13C-enriched methane with the δ13C value ranging from −24.2 to −23.3% lead some investigators to believe that the Jurassic coal-bearing shale sequences may play the major role [9]. To date, few wells have penetrated into the Carboniferous source rocks, and little knowledge is available regarding the specific molecular marker fingerprints within these shale sequences. This hinders a better understanding of the origins of oil and gas produced from the PSTB.
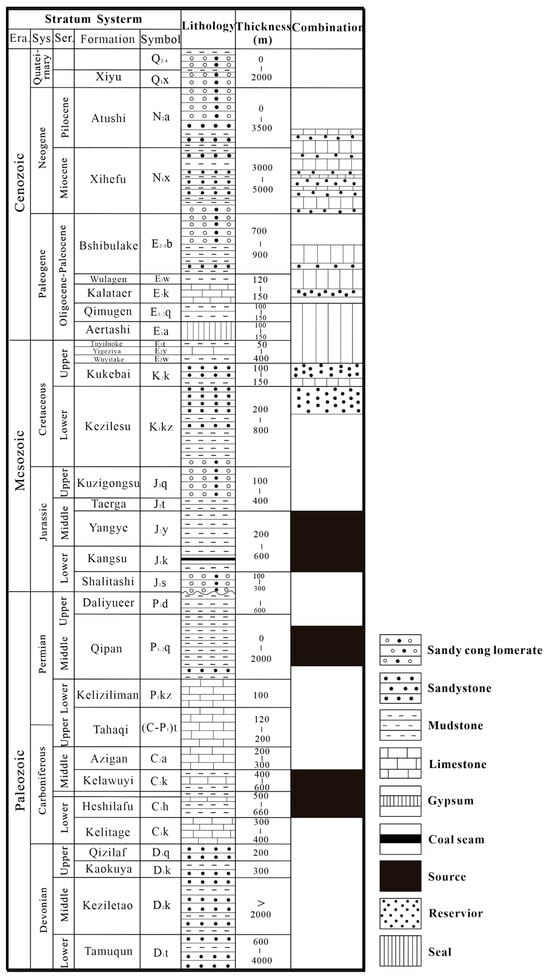
Figure 2.
Generalized stratigraphic column for the piedmont of southwestern Tarim Basin (modified after [1,5]).
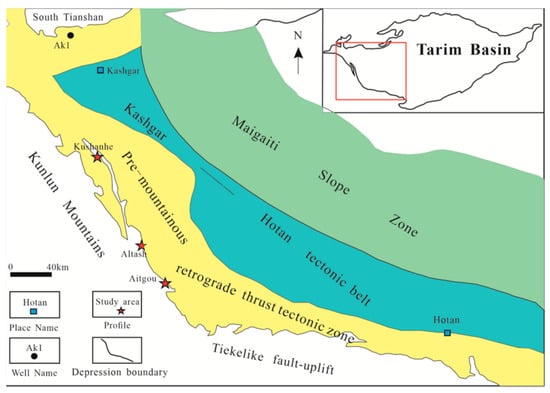
Figure 1.
Tectonic elements and outcrop locations of the piedmont of southwestern Tarim Basin (modified after [1,10]).
The occurrence of Carboniferous source rocks on the Kushanhe, Altash, and Aitegou outcrops in the PSTB provides us with a good opportunity for a comprehensive mapping of the hydrocarbon molecules generated from the lower and middle Carboniferous shale sequences. The rock samples were collected from these three outcrops (Figure 1), covering the main shale sequences and organic facies of Carboniferous formation [1]. Specifically, the samples were deposited in the slope and open marine shelf environments on the Kushanhe Outcrop, the platform margin and lagoon facies on the Altash Outcrop, and the lagoon facies on the Aitegou Outcrop, respectively [1]. This study sheds light on the molecular compositions of hydrocarbons within these rock samples to clarify the molecular fingerprints of lower and middle Carboniferous shale sequences. This should be helpful for oil–oil and oil–source correlations and hence petroleum exploration activity in the PSTB.
2. Samples and Experiments
2.1. Rock Samples
A total of 15 rock samples were collected from the PSTB including 6 samples from the Kushanhe Outcrop, 5 samples from the Altash Outcrop, and 4 samples from the Aitegou Outcrop (Table 1). These samples are hosted in the lower and middle Carboniferous formations and were deposited in various sedimentary facies (Table 1).

Table 1.
The Rock-Eval pyrolysis parameters of Carboniferous rock samples from the outcrops in the piedmont of southwestern Tarim Basin.
2.2. Rock-Eval
The original sample was dried at 80 °C, then crushed to <200 mesh. About 100 mg powder sample was weighted for rock pyrolysis analysis by using a Rock-Eval 6 instrument (France). Free hydrocarbons (S1), pyrolyzable hydrocarbons (S2), the oxygen-containing volatiles (S3), the inert carbon content (S4), and the maximum pyrolysis temperature corresponding to the S2 peak (Tmax) can be determined through a heating program [11]. The hydrogen index (HI) was calculated as the ratio of S2 to TOC [11].
2.3. X-Ray Fluorescence Spectrometer (XRF)
The major element analysis of the whole rock sample was performed using the fusion method for sample pretreatment. The flux consisted of a mixture of lithium tetraborate, lithium metaborate, and lithium fluoride (45:10:5 by weight), with ammonium nitrate and lithium bromide serving as the oxidant and release agent, respectively. The fusion was conducted at 1050 °C for 15 min.
Major element analysis was carried out using the ZSX Primus II wavelength dispersive X-ray fluorescence spectrometer (XRF) manufactured by Rigaku Corporation, Tokyo, Japan [12]. The X-ray tube was equipped with a 4.0 kw end window Rh target. The analysis was performed under the following conditions: A voltage of 50 kV and current of 60 mA. All major element analyses were conducted using kα lines. The calibration was performed using national standard reference materials, including rock standard GBW07101-14 [12], soil standard GBW07401-08 [12], and stream sediment standard GBW07302-12 [12]. Data correction was applied using the theoretical α coefficient method. The relative standard deviation (RSD) for the measurements was less than 2%.
2.4. Gas Chromatography–Mass Spectrometry (GC–MS)
The rock samples were cleaned, dried, and crushed to <200 mesh. Soluble organic matter was extracted using a mixed solvent of dichloromethane and methanol (9:1, v/v) for 72 h. The dealsphaltened samples were separated by using column chromatography with aluminum oxide as the solid phase. The saturated hydrocarbons, aromatic hydrocarbons, and non-hydrocarbon fractions were sequentially eluted with n-hexane, benzene, and dichloromethane/methanol mixture (9:1, v/v) [13,14].
The saturated fraction was analyzed using an Agilent 7980B-5977B gas chromatography–mass spectrometry (GC–MS) system (Agilent Technologies, Santa Clara, CA, USA). The chromatographic separation was performed using an HP-5MS capillary column (60 m × 0.25 mm × 0.25 μm)(Agilent J&W Scientific, Folsom, CA, USA). The oven temperature was initially held at 50 °C for 5 min, ramped to 300 °C at 4 °C/min, and held for 30 min. Helium was used as the carrier gas with the flow rate of 1.0 mL/min. The mass spectrometry conditions were electron ionization (EI) mode at 70 eV, ion source temperature of 200 °C, and a mass scanning range of m/z 50~500. During SIM GC–MS analysis, ions were monitored at m/z 71 for n-alkanes and acyclic isoprenoids, m/z 191 for terpanes, m/z 271 for steranes, m/z 135, 136, 149, 163, 177 and 191 for adamantanes, m/z 188, 187, 201, 215 for diamantanes, m/z 240, 239, 253 for triamantanes, and m/z 292 and 291 for tetramantanes.
An Agilent 7890A-GC/5975C-MSD (Agilent Technologies, Santa Clara, CA, USA) was used for the analysis of aromatic hydrocarbons. The separation was conducted using an HP-1MS capillary column (30 m × 0.25 mm × 0.25 μm) (Agilent J&W Scientific, Folsom, CA, USA). The oven temperature program was as follows: an initial temperature of 50 °C held for 1 min, ramped to 120 °C at 20 °C/min, then to 310 °C at 3 °C/min, and held for 15 min. Helium was used as the carrier gas with the flow rate of 1.0 mL/min. The mass spectrometry conditions included EI mode at 70 eV, an ion source temperature of 300 °C, and a mass scanning range of m/z 50~500. Full scan and SIM GC–MS analyses were performed to identify the aromatic compounds. During SIM GC–MS analysis, ions were monitored at m/z 154, 168, 182 for biphenyls, m/z 142, 156, 170, 184 for naphthalenes, m/z 178 and 192 for phenanthrenes and anthracenes, m/z 184, 198, 212 for dibenzothiophenes, m/z 168, 182 for dibenzofurans, m/z 166 and 180 for fluorenes, m/z 231 for triaromatic steranes, m/z 202 and 216 for fluoranthenes, pyrenes and benzofluorenes, m/z 228 and 242 benzoanthracenes and chrysenes, and m/z 252 for benzofluoranthene and benzopyrenes.
3. Results
3.1. General Geochemical Compositions of Carboniferous Source Rocks
Table 1 shows the Rock-Eval results for 15 Carboniferous rock samples. In general, these samples are good source rocks with 0.51–2.1% for TOC and 0.11–0.90 for S1 + S2 (Figure 3a). The high thermal maturity (%Ro > 1.3) is indicated by the crossplot of HI versus Tmax (Figure 3b).
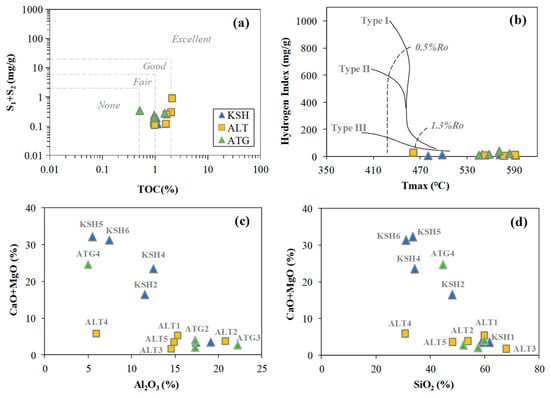
Figure 3.
The crossplots of (a) S1 + S2 versus TOC, (b) HI versus Tmax, (c) CaO + MgO versus Al2O3, (d) CaO + MgO versus SiO2 for rock samples collected from the outcrops in the piedmont of southwestern Tarim Basin.
The major elements presented in Table 2 are dominated by Si (29–68%, SiO2) and Al (5.5–22.2%, Al2O3) for mudstone samples (KSH1, KSH3, ALT1–5, and ATG1–3), and Si (31–60.3, SiO2), Al (5.48–15.2, Al2O3) and Ca (3.42–30.4, CaO) for calcareous mudstone samples (KSH2, KSH4–6, and ATG4) (Table 2). The calcareous mudstones rich in carbonates are indicated by the greater values of CaO and MgO than the sandy and shaly mudstones (Figure 3c,d).

Table 2.
Major elements (%) of Carboniferous rock samples from the outcrops in the piedmont of southwestern Tarim Basin.
3.2. n-Alkanes and Acyclic Isoprenoids
Figure 4 shows the typical mass chromatographs of n-alkanes and acyclic isoprenoids for hydrocarbons extracted from the Carboniferous source rocks. The main peak of n-alkanes is usually located at n-C14–n-C16 and n-C21–n-C24 (Figure 4). The OEP value is 0.65–1.39, the CPI value is around 1.00 (Table 3). The Σn-C21-/Σn-C22+ value is generally greater for samples from the Kushanhe and Altash outcrops than those samples from the Aitegou outcrop. The Pr/Ph ratio is <1.0 and lower for samples from the Aitegou Outcrop (Table 3).
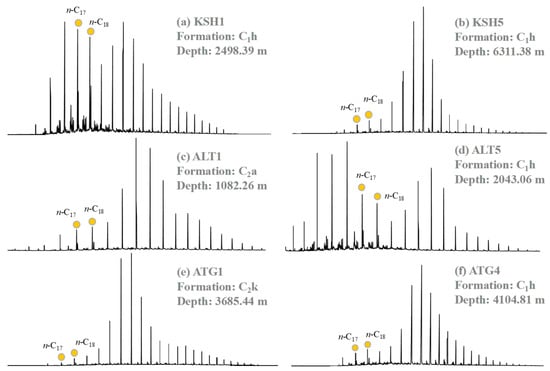
Figure 4.
The representative mass chromatograms of n-alkanes (m/z 71) for the extractable bitumen within the rock samples from the piedmont of southwestern Tarim Basin.

Table 3.
Molecular parameters of the saturated hydrocarbons within Carboniferous rock samples from the piedmont of southwestern Tarim Basin.
3.3. Terpanes and Steranes
Abundant terpanes and steranes can be detected in the lower and middle Carboniferous rock samples (Figure 5). Terpanes are composed of tricyclic terpanes (TT), tetracyclic terpane (Ter), and hopanes. C23TT and C30H are the two main peaks (Figure 5). The Ts/(Ts + Tm) ratio is slightly greater for samples collected from the Altash Outcrop relative to that for samples from the Kushanhe and Aitegou outcrops. The C19–23TT/C30H ratio is obviously greater for ALT4–5 than that for the other samples. More importantly, compared to the sandy and shaly mudstone samples, the calcareous shale samples have greater gammacerane index (Ga/C30H) and lower C19–20TT/C23TT ratio (Table 3).
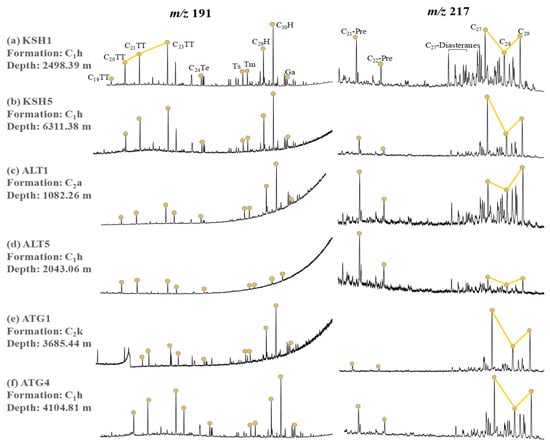
Figure 5.
The representative mass chromatograms of terpanes (m/z 191) and steranes (m/z 217) for the rock extracts from the piedmont of southwestern Tarim Basin.
Steranes comprise mainly C21–22 pregnanes, C27 diastreanes, and C27–C29 regular steranes (Figure 5). Compared to the sandy and shaly mudstone samples, the calcareous shale samples are relatively depleted in C21–22 pregnanes and C27 diastreanes and rich in C27 regular steranes (Figure 5), and hence have lower values of C21–22 Pre/C29-ααα 20R and Dia/Regular C27 steranes and greater value of C27-ααα 20R/C29-ααα 20R (Table 3).
3.4. Diamondoids
Owing to natural evaporation on the outcrops, adamantanes are too low to be detected (Table 4). Abundant higher diamondoids can be detected in hydrocarbons extracted from the lower and middle Carboniferous rock samples (Table 4 and Figure 6). They are composed mainly of diamondoids with 2–4 cages, and dominated by methyldiamantanes (MDs), dimethyldiamantanes (DMDs) and methyltriamantanes (MTs) (Table 4).

Table 4.
Molecular compositions and parameters of diamondoids within the Carboniferous rock samples collected from the outcrops in the piedmont of southwestern Tarim Basin.
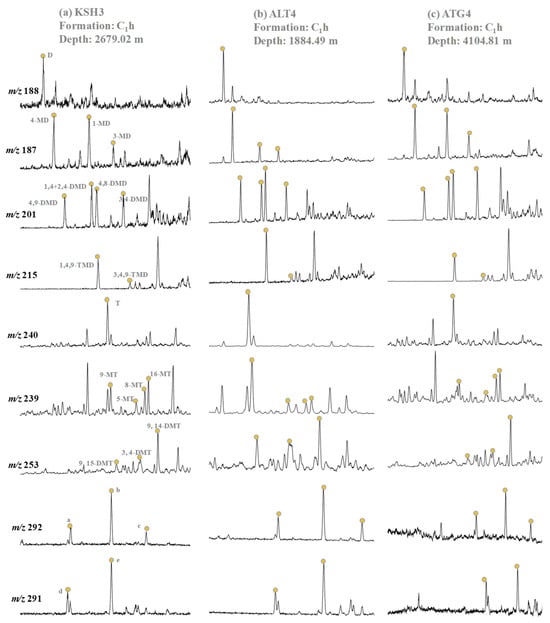
Figure 6.
The representative mass chromatograms of diamantanes, triamantanes, and tetramantanes within the Carboniferous rock samples collected from the outcrops in the piedmont of southwestern Tarim Basin. a = a-tetramantane; b = b-tetramantane; c = c-tetramantane; d = d-methyltetramantane; e = e-methyltetramantane.
The distribution profiles of diamantanes vary with different outcrops. The Altash samples show the predominance of 4-MD and 4,9-DMD. While the Kushanhe and Aitegou samples present the enrichment of 1-MD and 3,4-DMD. A similar distribution pattern of TMDs can be observed for all samples with the predominance of 1,4,9-TMD relative to 3,4,9-TMD (Figure 6). Triamantanes are composed of parent triamantane (T), methyltriamantanes (C1-MTs), and dimethyltriamantanes (C2-DMTs) with the dominance of C1-MTs (Table 4). Moreover, the Kushanhe and Aitegou samples are rich in 16-MT and 9,14-DMT, while the Altash samples are rich in 9-MT and 9,15-DMT. Tetramantanes comprise three tetramantane isomers (Te) and two methyltetramantane isomers (MTe), and the predominance of b-Te and e-MTe can be observed (Figure 6).
The diamondoid parameters present the stronger dependent-on-burial depth for the Altash samples than those for the Kushanhe samples (Table 4). With burial depth increasing, the diamondoid isomer ratios present the increased trend for MDI and %4,9-DMD, and the decreased pattern for DMDI-1and DMDI-2, %3,4-DMD, and MTI. The ratios of Cx/Cx+1 and low to high cage numbers generally increase with burial depth increasing (Table 4).
3.5. Aromatics
The aromatics in the extractable organic matter of Carboniferous source rocks are composed mainly of polycyclic aromatic hydrocarbons with 2–5 rings (Figure 7 and Table 5). The main peaks are located at C0–1-phenanthrenes, chrysene, and benzofluoranthene (Figure 7). In general, aromatics with 2–3 rings increase and aromatics with 4–5 rings decrease with burial depth increasing (Table 5). For example, on the Altash Outcrop phenanthrenes increase with burial depth increasing, and the decreased trend can be observed on aromatics with 4–5 rings such as chrysenes, benzofluoranthenes, and benzopyrenes (Table 5). The Altash samples are comparatively enriched in phenanthrenes and depleted in chrysenes and pyrenes relative to the Kushanhe and Aitegou samples (Table 5). Moreover, the calcareous shale samples KSH2 and KSH4–6 are more enriched in dibenzothiophenes than the siliciclasitic mudstone samples KSH1 and KSH3 (Table 5).
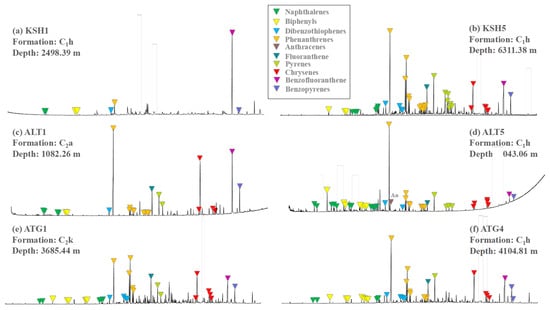
Figure 7.
The representative mass chromatograms of total ion chromatography (TIC) for the aromatic hydrocarbons within the rock samples from the outcrops in the piedmont of southwestern Tarim Basin.

Table 5.
Molecular compositions and parameters of aromatics in Carboniferous rock samples from the piedmont of southwestern Tarim Basin.
DBT/P and MPI-1 show the wide variations with the values of 0.003–0.36 and 0.10–1.31 (Table 5). The Altashi samples have smaller MPI-1, and the Aitegou samples have greater DBT/P. The calcareous mudstone samples KSH4–6 have greater DBT/P than the siliciclasitic mudstone samples KSH1 and KSH3. F1 and F2 show no significant variation with the values of 0.66–0.82 and 0.38–0.49. The aromatic ratios of low to high rings generally show the increased pattern with burial depth. For example, the 3R/4R ratio increases from 0.77 for ALT1 to 4.39 for ALT5 (Table 5).
4. Discussion
4.1. Depositional Environments of Carboniferous Source Sequences
Depositional environments of Carboniferous shale sequences are determined by using molecular biomarkers including acyclic isoprenoids, tricyclic terpanes, and steranes in the saturated fraction as well as sulfur-containing compounds in the aromatic fraction. More importantly, abundant diamondoids with 3–4 cages were detected in the Carboniferous rock samples, providing us the opportunity of using the quantitative extended diamondoid analysis method (QEDA) to distinguish organic facies.
4.1.1. Molecular Markers
The ratios of Pr/n-C17 and Ph/n-C18 are 0.2–0.46 and 0.38–0.68, respectively (Table 3). All samples are located at the reducing area with Type II1 organic matter on the crossplot of Pr/n-C17 versus Ph/n-C18 (Figure 8a). This indicates that the lower and middle Carboniferous source rocks were deposited under the reducing conditions with the major inputs of aquatic algae, resulting in the formation of Type II1 kerogen [15,16,17].
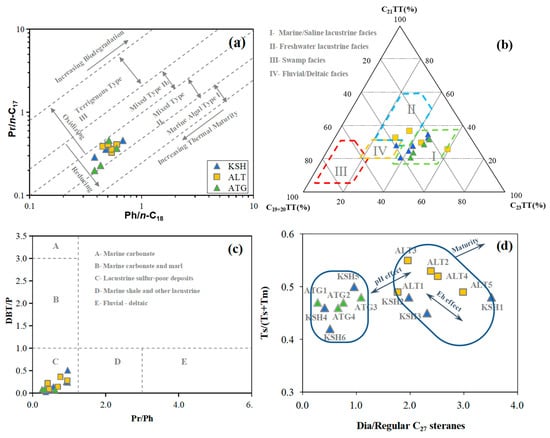
Figure 8.
The crossplots of (a) Pr/n-C17 versus Ph/n-C18, (b) Ternary diagram of C19+20TT, C21TT, and C23TT, (c) DBT/P versus Pr/Ph, (d) Ts/(Ts + Tm) versus Dia/Regular C27 steranes for rock samples from the outcrops in the piedmont of southwestern Tarim Basin.
The ternary diagram of C19+20TT, C21TT, and C23TT can provide an alternative way to discriminate the various depositional environments of Carboniferous source rocks [18]. The predominance of C23TT leads most samples to be in the area of marine/saline lacustrine facies; two samples from the Altash Outcrop are located at the freshwater lacustrine facies and one sample from the Kushanhe Outcrop is located at the fluvial and deltaic facies (Figure 8b). This indicates that most samples were deposited in the marine saline water column but with the somewhat inputs of terrestrial freshwater and associated organic matter, since the Carboniferous source sequences were deposited in the marginal marine to shallow marine shelf environments [1].
The crossplot of DBT/P versus Pr/Ph is also useful to indicate the depositional environments of source rocks [19]. In the current study, it is 0.26–0.96 for Pr/Ph (Table 3) and 0.09–0.38 for DBT/P (Table 5). This suggests that the Carboniferous source rocks were deposited in the anoxic and lacustrine sulfate-poor settings on the crossplot of DBT/P versus Pr/Ph [19] (Figure 8c). In fact, the Carboniferous source rocks were not deposited in the lacustrine setting as stated above. Here it is supposed to be caused by the input of terrestrial freshwater and associated organic matter, resulting in the lower value of DBT/P than the expected values.
The ratios of Ts/(Ts + Tm) and Dia/Regular C27 steranes are considered to be the functions of both thermal maturity and sedimentary environments [20]. The crossplot of Ts/(Ts + Tm) versus Dia/Regular C27 steranes indicates two groups for the collected rock samples. The first group includes the samples KSH1–3 and ALT1–5 with the enrichment of carbonates or higher thermal maturity; the second group contains the samples KSH4–6 and ATG1–4 with the enrichment of carbonates or lower thermal maturity. This highlights the Lewis acid-catalyzed effect of clay minerals on the occurrence of isomerization and rearrangement reaction of regular steranes to form diasteranes [20]. Moreover, ATG4 with greater burial depth shows the lower values relative to ATG1–3, still indicating the stronger acid-catalyzed reactions induced by clays within ATG1–3. ATG1–4 generally have the lower ratios than ALT1–5, which is attributed mainly to the lower thermal maturity of ATG1–4 as stated below. The Ga/C30H value is generally greater for the second group (0.20–0.29) than that for the first group (0.06–0.23) (Table 3). This indicates the water was more salty and stratified during the deposition of calcareous mudstone [21].
4.1.2. Quantitative Extended Diamondoid Analysis (QEDA)
QEDA compares the relative concentrations of higher diamondoids isomers and homologs and has proved useful in oil–oil and oil–source correlations and clarifying organic facies [22,23,24,25]. Owing to its resistance to natural evaporation and biodegradation, QEDA plays a critical role in clarifying the organic facies of Carboniferous source rocks from these three outcrops and shows two kinds of lithofacies clearly (Figure 9).
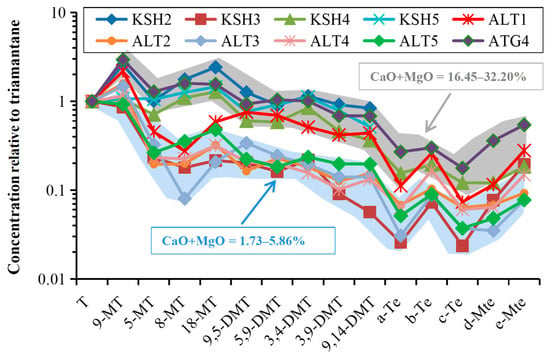
Figure 9.
Quantitative extended diamondoid analysis for distinguishing the lithofacies of Carboniferous source rocks from the outcrops in the piedmont of southwestern Tarim Basin, indicating carbonate-rich and carbonate-poor organic facies.
The first one includes samples ALT2–5 and KSH3 with the depletion of alkylated triamantanes and tetramantanes and carbonates (MgO + CaO = 1.73–5.86%). On the contrary, the second one includes samples KSH2, KSH4–5, and ATG4 with the enrichment of alkylated triamantanes and tetramantanes and carbonates (MgO + CaO = 16.45–32.20%). This is generally consistent with that suggested by the crossplot of Ts/(Ts + Tm) versus Dia/Regular C27 steranes (Figure 8d). A similar situation has been reported in the petroleum expelled from the calcareous and shaly source rocks within the Triassic Shublik Formation, Alaska North Slope [23]. The clay-mediated acid-catalyzed rearrangement of biological precursors during diagenesis is supposed to be responsible for this. Previous investigations have demonstrated that diamondoids with <3 cages are formed mainly by Lewis acid-catalyzed isomerization and rearrangement of cyclic hydrocarbon precursors [26,27,28,29], and diamondoids with ≥3 cages are generated by homologation of the lower alkyl-substituted at high pressures and temperatures in hydrocarbon reservoirs [30]. Moreover, hydrous pyrolysis experiments on modern immature sediments have demonstrated that the generation of diamondoids can be accelerated by the addition of clays and retarded by the presence of carbonates [29]. The clay catalysis effects on the isomerization of cyclic hydrocarbon precursors such as steranes may be feasible for the generation of parent diamondoids. The distribution of higher diamondoids for ALT1 presents the intermediate, although it is also depleted in carbonates as ALT2–5 (Figure 9). The specific organic matter input is supposed to be responsible for this as indicated by the lower ratio of C19+20TT/C23TT and higher percentage of regular C28 steranes (Table 3). More work is therefore needed to obtain a better understanding of the elements regulating the occurrence of higher diamondoids, which is beyond the main scope of the current study.
4.2. Organic Matter Inputs of Carboniferous Source Sequences
Regardless of the carbonate-rich and carbonate-poor shale sequences, C23TT is the main peak of tricyclic terpenoids. This indicates that marine algae make the major contribution to Carboniferous sources [21]. However, the C19–20TT/C23TT ratio is lower for the carbonate-rich or calcareous shale samples relative to the carbonate-poor samples (Table 3 and Figure 10a). This suggests that higher plants make less of a contribution to calcareous shale sources [21,31].
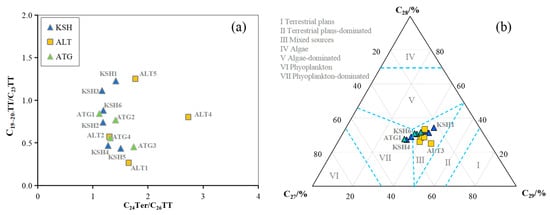
Figure 10.
The crossplots of (a) C19−20TT/C23TT versus C24Ter/C26TT (b) Ternary diagram of C27 ααα20R, C28 ααα20R, and C29 ααα20R for rock samples from the outcrops in the piedmont of southwestern Tarim Basin.
The Carboniferous shale sequences were deposited in the reduced marine setting. The organic matter inputs are dominated by marine aquatic algae with the contribution of terrestrial higher plants to a certain degree. This is suggested by the distribution of regular steranes (Figure 10b). The enrichment of C27 ααα20R for the carbonate-rich samples and C29 ααα20R for the carbonate-poor samples also indicates that higher plants play a less important role in carbonate-rich organic facies (Table 3 and Figure 10b).
4.3. Thermal Maturity of Carboniferous Source Sequences
Thermal maturity levels of lower and middle Carboniferous source sequences as indicated by Rock-Eval data are %Ro ≥ 1.3 (Figure 3b). Thermal maturity parameters associated with terpanes and steranes are no longer effective at this maturity range [21]. However, the geochemical indices related to polycyclic aromatic hydrocarbons and diamondoids with 2–4 cages are still robust and then utilized to evaluate the thermal maturity levels of Carboniferous sources in study area.
4.3.1. The Polycyclic Aromatic Hydrocarbon Indices
In general, the polycyclic aromatic hydrocarbon indices indicate that the highly matured sources are hosted in the lower and middle Carboniferous shale sequences. Previous investigation has demonstrated that MPI-1 varies linearly with %Ro, and presents the increased trend at %Ro = 0.5–1.35 and the decrease pattern at Ro > 1.35% [32,33]. The calculated %Ro value with MPI-1 is 1.64–2.07 for KSH1–6, 1.95–2.24 for ALT1–5, and 1.51–2.00 for ATG1–4 (Table 5), indicating the occurrence of highly mature to the beginning of overmature source rocks. This agrees with that suggested by the crossplot of F1 versus F2. Bao and Wang suggested that F1 and F2 are less than 0.4 and 0.27 for low-matured source rocks, 0.40–0.55 and 0.27–0.35 for matured source rocks, and higher than 0.55 and 0.35 for highly matured source rocks [34]. The F1 and F2 are 0.66–0.82 and 0.38–0.49, implying the highly matured organic matter within the Carboniferous formation (Figure 11a).
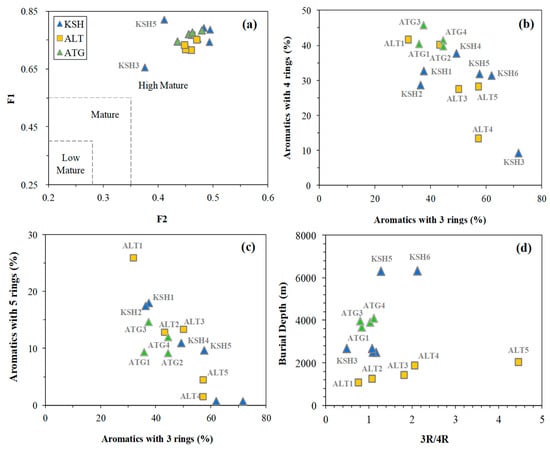
Figure 11.
The crossplots of (a) F1 versus F2 indicating the highly matured Carboniferous source rocks, (b,c) showing the negative correlations between aromatics with 3 rings and aromatics with 4–5 rings, and (d) showing the positive correlation between the 3R/4R ratio with burial depth increasing.
Aromatics with 3 rings are dominated by phenanthrenes (Table 5 and Figure 8), and show good negative correlations with aromatics with 4–5 rings (Figure 11b,c). The 3R/4R ratio increases with burial depth increasing for the Altash samples (Figure 11d). This indicates that aromatics with 3 rings prefer to be generated and the more fused aromatics tend to be consumed with thermal maturity increasing. ATG1–4 have the smaller 3R/4R ratio than KSH5–6 and ALT3–5, indicating the Carboniferous source sequences on the Aitegou Outcrop are less matured than those on the Kushanhe and Altash outcrops. This is generally consistent with those indicated by MPI-1 (Table 5).
4.3.2. The Diamondoids Parameters
The unique chemical structures of diamondoids allow them to be resistant to thermal degradation in petroleum reservoirs, and hence play a crucial role in evaluating the thermal maturity levels [35,36]. Diamondoids isomers with alkyl substitution on bridgehead carbons are supposed to be thermally more stable than those on secondary carbons [37,38]. The thermal maturity indices of methyladamantanes (MAI), methyldiamantanes (MDI), dimethyldiamantanes (DMAI), ethyladamantanes (EAI), and methyltriamantanes (MTI) have been widely used to constrain the thermal maturity levels of source rocks and associated crude oils [29,35,36,39]. The calculated %Ro value based on MDI is 1.26–1.36 for KSH2–4, 1.38–2.02 for ALT1–5, and 1.45 for ATG4 (Table 4), indicating the late and highly matured source sequences within the lower and middle Carboniferous on the outcrops. The Altash samples are generally more matured than the Kushanhe and Aitegou samples as indicated by the enrichment of 4,9-DMD relative to 3,4-DMD (Figure 12a) and greater values of MTI and DMTI (Figure 12b).
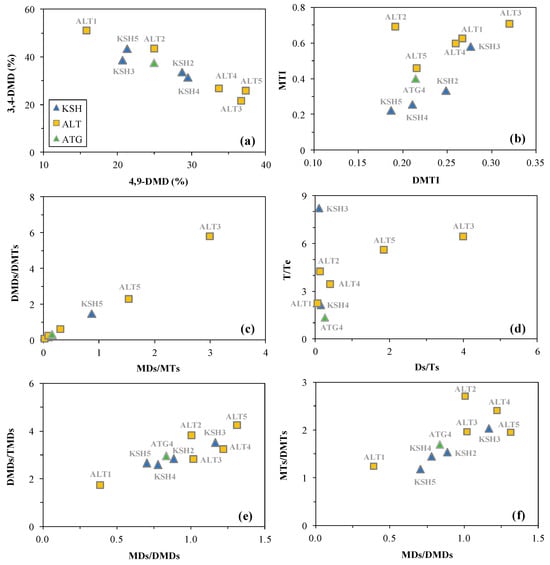
Figure 12.
The crossplots showing the correlations between various molecular parameters of measured diamondoids within the Carboniferous rock samples from the outcrops in the piedmont of southwestern Tarim Basin including (a) 3,4-DMD (%) versus 4,9-DMD (%), (b) MTI versus DMTI, (c) DMDs/DMTs versus MDs/MTs, (d) T/Te versus Ds/Ts, (e) DMDs/TMDs versus MDs/DMDs, and (f) MTI/DMTs versus MDs/DMDs.
The diamondoid ratios of low to high cage numbers and the compositional Cx/Cx+1 ratio were believed to increase at Easy%Ro < 2.5–3.0 and decrease at higher thermal maturity levels [40]. The positive correlations can be observed in Figure 12c–f, and these parameters increase with burial depth increasing on the Altashi Outcrop. This indicates that hydrocarbons within these shale samples were generated at %Ro < 2.5–3.0, which is less sophisticated than that constrained by diamondoids isomer ratios.
5. Conclusions
This study presents the detailed molecular compositions of saturated and aromatic hydrocarbons within the lower and middle Carboniferous shale sequences on the Kushanhe, Altash, and Aitegou outcrops in the piedmont of the southwestern Tarim Basin (PSTB) by using GC–MS analysis to explore the relevant geochemical implications. The following conclusions can be made:
- (1)
- The Carboniferous shale sequences contain abundant diamondoids with 2–4 cages with the predominance of methyldiamantanes, dimethyldiamantanes, and methyltriamantanes. The carbonate-rich and carbonate-poor organic facies were recognized for the first time in the PSTB by using the quantitative extended diamondoid analysis (QEDA) and further confirmed by the X-Ray fluorescence spectrometer analysis (XRF) of the whole rock samples. They were deposited in the anoxic and sulfur-poor marine setting, and the water was more salty and stratified during the deposition of carbonate-rich facies.
- (2)
- The organic matter inputs are dominated by marine aquatic algae with the contribution of terrestrial higher plants, resulting in the formation of Type II kerogen in the Carboniferous sources. Higher plants have a greater contribution in the carbonate-poor facies relative to that in the carbonate-rich organic facies as indicated by the enrichment of C29 ααα20R for the carbonate-poor samples.
- (3)
- Molecular compositions and associated parameters of polycyclic aromatic hydrocarbons and diamondoids with 2–4 cages suggest that the Carboniferous shale sequences have arrived at the late mature to highly mature stage. The Carboniferous source sequences on the Aitegou Outcrop are less matured than those on the Kushanhe and Altash outcrops. The Carboniferous source sequences on the Altash Outcrop are more matured than the others.
- (4)
- The clay catalysis effects in the carbonate-poor facies facilitate the isomerization of steranes and hence the generation of triamantane, and the presence of carbonates is feasible for the generation of alkylated triamantanes in the carbonate-rich facies. This is suggested by the fact that samples collected from the carbonate-rich facies are relatively depleted in C27 diasteranes and triamantane and rich in C27 regular steranes and alkylated triamantanes relative to those from the carbonate-poor facies.
Author Contributions
Conceptualization, Q.X.; Methodology, X.T.; Software, Z.G.; Validation, Z.G. and S.C.; Formal analysis, S.C.; Investigation, X.T. and Z.G.; Resources, Q.X.; Data curation, Q.X.; Writing—original draft, X.T.; Writing—review & editing, Q.X.; Visualization, Z.G. and S.C.; Supervision, S.C. All authors have read and agreed to the published version of the manuscript.
Funding
This research was funded by [the National Nature Science Foundation of China] grant number [42030803, 42073066]. And the APC was also funded by [the National Nature Science Foundation of China].
Data Availability Statement
The original contributions presented in the study are included in the article, further inquiries can be directed to the corresponding author.
Conflicts of Interest
The authors declare no conflict of interest.
References
- Wang, Q.; Yang, H.; Li, Y.; Cai, Z.; Yang, X.; Xu, Z.; Chen, C.; Sun, C. Major breakthrough in the Carboniferous-Permian in Well Qiatan 1 and exploration prospect in the piedmont southewestern Tarim Basin. China Pet. Exporation 2023, 28, 34–45. [Google Scholar] [CrossRef]
- Wang, Q.; Yang, H.; Li, Y.; Cai, Z.; Yang, X.; Xie, H.; Chen, C.; Sun, C. Major oil and gas discovery and significance of Well Yetan 1 in the peripheral Kekeya area in the piedmont of southwestern Tarim Basin. China Pet. Exporation 2024, 29, 1–17. [Google Scholar] [CrossRef]
- Hu, J.; Cui, J. Geochemical Analysis of Crude Oils and Oil Sand in the Kashi Sag, Tarim Basin. Sci. Technol. Eng. 2015, 15, 122–129+142. [Google Scholar] [CrossRef]
- Wang, X.; Zhang, H.; Chen, C.; Zhang, H.; Lu, Y. Geochemical characteristics and hydrocarbon generation potential of Permian Pusige formation calcareous mudstone in Tarim basin. Nat. Gas Geosci. 2025, 24, 1–21. [Google Scholar]
- Huang, W.; Pan, C.; Yu, S.; Zhang, H.; Xiao, Z.; Zhang, Z. Source and filling process of crude oil from Fusha 4 well in Kedong structural belt of the southwestern Tarim depression. Nat. Gas Geosci. 2022, 32, 1836–1847. [Google Scholar] [CrossRef]
- Liao, X.; Wang, Z.; Fan, C.; Yu, C. The comprehensive evaluation of source rock in low-exploration area: A case study on the Carboniferous source rock in southwest sag of Tarim Basin. J. Northwest Univ. (Nat. Sci. Ed.) 2018, 48, 261–267. [Google Scholar] [CrossRef]
- Li, X.; Xiao, X.; Tang, Y.; Xiao, Z.; Mi, J.; Tian, H.; Liu, D.; Shen, J.; Liu, J. Using Carbon Isotope Kinetics to Investigate the Origin of Natural Gas in the Ake-1 Gas Reservoir. Geochimica 2005, 5, 525–532. [Google Scholar] [CrossRef]
- Farouk, S.; Ahmed Saada, S.; Arafat, M.; Al-Kahtany, K.; Gentzis, T.; Zaky, A.S.; Jovane, L. Thermal maturity and gas generation in Upper Cretaceous formations of the Beni Suef Basin, Egypt: Insights from stable carbon isotopes and geochemical analysis of the Azhar-E1X well. Front. Earth Sci. 2025, 13, 1552662. [Google Scholar] [CrossRef]
- Han, W.; Tao, S.; Hu, G.; Ma, W.; Liu, D.; Pen, W.; Feng, Z. Geochemical characteristics of natural gas and its genesis in piedmont zone of southwest Tarim basin. J. China Univ. Min. Technol. 2017, 46, 121–130. [Google Scholar] [CrossRef]
- Meng, M.; Kang, Z.; Qiu, H.; Li, S.; Zhang, B. Controlling factors of permian hydrocarbon source rocks in the southwest depression of Tarim Basin. Bull. Mineral. Petrol. Geochem. 2016, 35, 344–352. [Google Scholar] [CrossRef]
- Peters, K.E. Guidelines for evaluating petroleum source rock using programmed pyrolysis. AAPG Bull. 1986, 70, 318–329. [Google Scholar] [CrossRef]
- Yong, S.C.; Jong, Y.K.; Suk, B.Y.; Kyuseok, S.; Young, J.K. Determination of water content in silica nanopowder using wavelength-dispersive X-ray fluorescence spectrometer. Microchem. J. 2011, 99, 332–338. [Google Scholar] [CrossRef]
- Xiao, Q.; Sun, Y.; He, S.; Liu, J.; Zhu, C. Thermal stability of 2-thiadiamondoids determined by pyrolysis experiments in a closed system and its geochemical implications. Org. Geochem. 2019, 130, 14–21. [Google Scholar] [CrossRef]
- Farouk, S.; Saada, S.A.; Fagelnour, M.S.; Arafat, M. Petrophysical and Gas Chromatographic Analysis Integration for Hydrocarbon Identifications in Cretaceous Reservoirs, Azhar Field, Beni Suef Basin, Egypt. Egypt. J. Pet. 2024, 33, 7. [Google Scholar] [CrossRef]
- Connan, J.; Cassou, A.M. Properties of gases and petroleum liquids derived from terrestrial kerogen at various maturation levels. Geochim. Cosmochim. Acta 1980, 44, 1–23. [Google Scholar] [CrossRef]
- Sofer, Z. Stable carbon isotope compositions of crude oils; application to source depositional environments and petroleum alteration. AAPG Bull. 1984, 68, 31–49. [Google Scholar] [CrossRef]
- Shanmugam, G. Significance of Coniferous Rain Forests and Related Organic Matter in Generating Commercial Quantities of Oil, Gippsland Basin, Australia. AAPG Bull. 1985, 69, 1241–1254. [Google Scholar] [CrossRef]
- Xiao, H.; Li, M.; Nettersheim, B.J. Short chain tricyclic terpanes as organic proxies for paleo-depositional conditions. Chem. Geol. 2024, 652, 122023. [Google Scholar] [CrossRef]
- Hughes, W.B.; Holba, A.G.; Dzou, L.I.P. The ratios of dibenzothiophene to phenanthrene and pristane to phytane as indicators of depositional environment and lithology of petroleum source rocks. Geochim. Cosmochim. Acta 1995, 59, 3581–3598. [Google Scholar] [CrossRef]
- Moldowan, J.M.; Dahl, J.; Zinniker, D.; Barbanti, S.M. Underutilized advanced geochemical technologies for oil and gas exploration and production-1. The Diamondoids. J. Pet. Sci. Eng. 2015, 126, 87–96. [Google Scholar] [CrossRef]
- Peters, K.E.; Walters, C.C.; Moldowan, J.M. The Biomarker Guide; Cambridge University Press: Cambridge, UK, 2005; pp. 1–1155. [Google Scholar]
- Moldowan, J.M.; Sundararaman, P.; Schoell, M. Sensitivity of biomarker properties to depositional environment and/or source input in the Lower Toarician of SW-Germany. Org. Geochem. 1986, 10, 915–926. [Google Scholar] [CrossRef]
- Yurchenko, I.A.; Moldowan, J.M.; Peters, K.E.; Magoon, L.B.; Graham, S.A. The role of calcareous and shaly source rocks in the composition of petroleum expelled from the Triassic Shublik Formation, Alaska North Slope. Org. Geochem. 2018, 122, 52–67. [Google Scholar] [CrossRef]
- Atwah, I.; Moldowan, J.M.; Koskella, D.; Dahl, J. Application of higher diamondoids in hydrocarbon mudrock systems. Fuel 2021, 284, 118994. [Google Scholar] [CrossRef]
- Walters, C.C.; Sun, X.; Zhang, T. Geochemistry of oils and condensates from the lower Eagle Ford formation, south Texas. Part 4: Diamondoids. Mar. Pet. Geol. 2023, 154, 106308. [Google Scholar] [CrossRef]
- Fort, R.C.; von Rchleyer, P.R. Adamantane: Consequences of diamondoid structure. Chem. Rev. 1964, 64, 277–300. [Google Scholar] [CrossRef]
- McKervey, M.A. Synthetic approaches to large diamondoid hydrocarbons. Tetrahedron 1980, 36, 971–992. [Google Scholar] [CrossRef]
- Olah, G.A. Carbocation and electrophilic reactions of cage hydrocarbons. Chemlnform 1991, 22, 303. [Google Scholar] [CrossRef]
- Wei, Z.; Moldowan, J.M.; Dahl, J.; Goldstein, T.P.; Jarvie, D.M. The catalytic effects of minerals on the formation of diamondoids from kerogen macromolecules. Org. Geochem. 2006, 37, 1421–1436. [Google Scholar] [CrossRef]
- Lin, R.; Wilk, Z.A. Natural occurrence of tetramantane (C22H28), pentamantanes (C26H32) and hexamantane (C30H36) in a deep petroleum reservoir. Fuel 1995, 74, 1512–1521. [Google Scholar] [CrossRef]
- Farouk, S.; Sen, S.; Ahmed, F.; Qteishat, A.; Al-Kahtany, K.; Moreno, H.M.; Arafat, M. Assessment of the Upper Cretaceous Abu Roash carbonate source rocks from the Beni Suef field, Western Desert, Egypt. J. Afr. Earth Sci. 2024, 215, 105272. [Google Scholar] [CrossRef]
- Radke, M.; Welte, D.H. The Methylphenanthrene Index (MPI): A Maturity Parameter Based on Aromatic Hydrocarbons. In Advances in Organic Geochemistry; Bjoroy, M., Ed.; John Wiley and Sons Limited: Hoboken, NJ, USA, 1981; Volume 1983, pp. 504–512. [Google Scholar]
- Radke, M.; Welte, D.H.; Willsch, H. Geochemical study on a well in the Western Canada Basin: Relation of the aromatic distribution pattern to maturity of organic matter. Geochim. Cosmochim. Acta 1982, 46, 1–10. [Google Scholar] [CrossRef]
- Bao, J.; Wang, T. The relationship between methylphenanthrene ratios and the evolution of organic matter. J. Jianghan Pet. Inst. 1992, 14, 8–13, (In Chinese with English Abstract). [Google Scholar]
- Chen, J.; Fu, J.; Sheng, G.; Liu, D.; Zhang, J. Diamondoid hydrocarbon ratios: Novel maturity indices for highly mature crude oils. Org. Geochem. 1996, 25, 179–190. [Google Scholar] [CrossRef]
- Li, J.; Paul, P.; Cui, M. Methyl diamantane index (MDI) as a maturity parameter for Lower Palaeozoic carbonate rocks at high maturity and overmaturity. Org. Geochem. 2000, 31, 267–272. [Google Scholar] [CrossRef]
- Clark, T.; Knox, T.M.; Mckervey, M.A.; Mackle, H.; Jony, R.J. Thermochemistry of bridged-ring substance. Enthalpies of formation of some diamondoid hydrocarbons and of perhydroquinacene. Comparisons with data from empirical force filed calculations. J. Am. Chem. Soc. 1979, 101, 2404–2410. [Google Scholar] [CrossRef]
- Wingert, S.W. GC-MS analysis of diamondoids hydrocarbons in Smackover petroleums. Fuel 1992, 71, 37–43. [Google Scholar] [CrossRef]
- Zhang, S.; Huang, H.; Xiao, Z.; Liang, D. Geochemistry of palaeozoic marine petroleum from the Tarim Basin, NW China. Part 2: Maturity assessment. Org. Geochem. 2005, 36, 1215–1225. [Google Scholar] [CrossRef]
- Xuan, Y.; Wang, W.; Li, Y.; Xiong, Y.; Jiang, W. Absolute quantitative analysis and thermal evolution of trimantanes and tetramantanes in crude oil and source rock. Geochemistry 2024, 53, 643–654. [Google Scholar] [CrossRef]
Disclaimer/Publisher’s Note: The statements, opinions and data contained in all publications are solely those of the individual author(s) and contributor(s) and not of MDPI and/or the editor(s). MDPI and/or the editor(s) disclaim responsibility for any injury to people or property resulting from any ideas, methods, instructions or products referred to in the content. |
© 2025 by the authors. Licensee MDPI, Basel, Switzerland. This article is an open access article distributed under the terms and conditions of the Creative Commons Attribution (CC BY) license (https://creativecommons.org/licenses/by/4.0/).