Abstract
Fereydounshahr experiences growing electricity shortfalls and an overreliance on polluting diesel generators. This analysis models renewable hybrid systems to electrify a local dairy operation using HOMER Pro 3.11 software. Despite higher upfront costs, adding just 5% solar photovoltaics maintained low net present costs while increasing clean energy penetration versus diesel generators alone. Furthermore, a combined diesel-solar-wind system reduced carbon dioxide and nitrogen oxide emissions by over 1%. Although diesel generators had the shortest payback period at 48 years, the capital recovery factor for a diesel–solar combination reached 62 years. Thus, tailored hybrid renewable systems could provide an affordable, low-emissions electricity solution for the Fereydounshahr livestock facility. With suitable wind and solar resources, the right policy incentives could also unlock substantial local renewable capacity to meet rising demand and mitigate dependence on imported, climate-harming fossil fuels.
1. Introduction
The ever-increasing consumption of energy in the world and reliance on traditional and old methods of energy production have caused many environmental problems and increased greenhouse gas emissions. For this reason, the use of clean energies such as solar, wind, geothermal, hydrogen, etc. instead of energies from fossil fuels, reduces environmental pollution but also prevents energy shortages [1,2]. Although oil-exporting countries have been concerned about the increasing use of renewable energy [3], they are also investing in new energies, including solar, wind, and geothermal energy [4]. Regardless of the place of energy production, among the different forms of energy consumption, electricity is the most important human energy need to meet daily life requirements [5]. In such circumstances, the replacement of renewable energies such as solar and wind energy can greatly help solve the problem of electricity shortages and reduce greenhouse gas emissions. Abbaszadeh et al. [6] examined the current and future renewable energy potential in Iran, finding significant opportunity for solar, wind, and other renewables to meet the rising energy demand. Kansara and Parekh [7] analyzed the feasibility of hybrid solar-wind systems in remote villages in India, demonstrating reduced costs and emissions versus diesel-only systems. Iran has faced electricity shortages in recent years due to rising energy demand and a reliance on fossil fuels. Expanding renewable energy can help bridge this gap while reducing environmental impact. The Iranian government has set ambitious targets for installing renewable capacity, although infrastructure and policies enabling adoption at scale are still developing. Fossil fuels account for 90% of Iran’s energy mix, contributing heavily to carbon emissions. Under the Paris Climate Agreement, Iran committed to reducing greenhouse gas emissions by 4% by 2030. Although renewable resources currently produce a small portion of the world’s energy needs, it is expected that the role of these resources in meeting global energy demands will become more prominent in the future [8]. The global demand for solar power generation has increased due to countries’ efforts to produce renewable energy. Although fossil fuels still account for about 75% of total global energy consumption, it is predicted that by 2035, the non-fossil portion of energy (new energies, nuclear, and hydroelectricity) will cover about half of the increase in energy demand (POURAHMADI). This case study focuses on utilizing renewable energy sources for a livestock unit in Fereydounshahr, located in Isfahan province in central Iran. Fereydounshahr has an arid climate and landscape suitable for solar and wind energy installations. The method of extracting solar energy varies according to the need for heating, lighting, and other required uses. Solar thermal and photovoltaic (PV) can be used to generate electricity from solar energy for various applications [9]. Elavarasan et al. [4] examined the current situation and future trends of solar energy in Uganda and considered the use of solar energies as a reliable alternative source of energy for the world, with an emphasis on the use of photovoltaic cells to provide solar energy. Asghari et al. [10] calculated the amount of solar radiation reaching the ground using Landsat satellite image data and the SEBAL algorithm in Alshtar city in the months of January to November. The results showed that the highest percentage of net radiation was in September at 69.86% and in January, 60.12%. Considering the sensitivity range of photovoltaic cells to radiation and the calculated net radiation in the study area, they concluded that solar radiation in this area has the necessary potential for implementing photovoltaic solar projects [10]. Taghvaei and Saboohi [11] zoned and located optimal points for installing solar panels on a regional scale in Isfahan, and respectively introduced the cities of Naeen, Meymeh, Golpayegan, and Shahreza as the best cities in this province for utilizing solar energy.
2. Materials and Methods
2.1. Research Method and Sampling
This research was conducted in a livestock unit located on the outskirts of Fereydounshahr city. This livestock unit included 70 dairy cows. It is located in Sibak village, 18 km from Fereydounshahr. To obtain the necessary information from the livestock units, questionnaires were prepared based on herd size, number of dairy cows, milk yield per cow per year in liters, average milking duration, and information related to the milking unit, including the type of building and electricity consumption. To complete the required statistics and information in this study, the owners and employees of the livestock unit were interviewed and at various stages of this research, statistics and information regarding the number of sunny days in Fereydounshahr, the direction and average monthly wind speed, and the average monthly solar radiation per day kWh/m2 were extracted from the NASA website using the software itself.
2.2. Software for Analysis and Evaluation
HOMER software was developed by the US National Renewable Energy Laboratory for small power generation systems to help compare the physical behavior, economics, and life cycle cost of different power generation technologies. The software models capital and operating costs. This software allows the modeler to examine a large number of different designs based on technical and economic criteria. The model also helps identify and address the effects of data uncertainties and changes in inputs so that the best technical and economic option can be selected. HOMER performs three key tasks: simulation, optimization, and sensitivity analysis. In the simulation process, HOMER simulates the operation of a micro power system configuration for each hour of the year to determine technical feasibility and the life cycle cost of the model. For each component, HOMER combines the capital, replacement, maintenance, and fuel costs with the salvage value and any other costs or revenues to calculate the annualized cost of the components. HOMER uses Equation (2) to calculate the net present cost of the system. HOMER also uses Equation (3) to calculate the levelized cost of energy. The denominator in Equation (4) is the total useful energy production that the system supplies annually; therefore, the levelized cost of energy is the average cost per kilowatt-hour of the useful electrical energy production by the system. The simulation capability of HOMER includes simulating the operation of a micro power system over the long-term. In all calculations of this study, the exchange rate of 30,000 Tomans per dollar was considered to convert currencies. Also, the interest rate or bank profit for the 25-year system life was assumed to be 18%. For these values, the reference year considered was 2020 [8]
HOMER uses Equation (1) and (Table 1) to calculate the salvage value of each component at the end of the project lifetime.

Table 1.
Governing mathematical relations in HOMER software.
3. Results and Discussion
3.1. Load Consumption
In HOMER, the load refers to the electrical and thermal energy demand. Meeting the loads is the reason for the existence of micro power systems, so modeling a micro power system begins with modeling the load or loads that the system must serve. HOMER models three types of loads. The primary load is the electrical demand that must be met according to a specific schedule, that is, the primary load is an electrical demand that the supplying system must meet at a specific time. The secondary or deferrable load is the electrical demand that can be met at any time within a specific timeframe. The thermal load is also a thermal demand.
The dairy unit under study includes 70 heads of Holstein dairy cows with a 190-day lactation period. This dairy unit uses two 550 W two-unit milking machines. The annual milk production for this unit is 331,830 L of milk (Table 2).
Table 2.
Annual milk production.
Milking operations are performed twice a day, from 6 to 8 a.m. and 6 to 8 p.m. The daily load chart, based on the monthly power consumption, which is an average of 300 kWh for this unit, is as follow Figure 1. The daily load is calculated at 10 kWh.
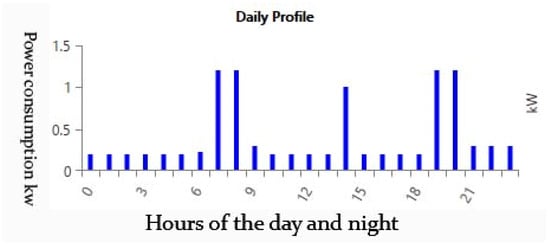
Figure 1.
Load profile of daily consumption of the milking unit.
In other words, we will have 8.10 Wh of electricity consumption for milking each kilo of milk. This estimate helps carry out the feasibility process in similar dairy units by knowing the amount of milk production. The maximum load power for arrays is selected as 3 kW. Based on the Iranian market for renewable resources, related companies such as Modern Afroug Gostaran Energy and Solaraple, which are companies installing and constructing renewable equipment, estimated the installation and commissioning costs and replacement costs in 2022 for each kilowatt of a solar system independently from the network to be $234 and $200, respectively [3]. Therefore, for the installation of a 3 kW solar system, using the HOMER software, the cost chart was obtained, as shown in Figure 2. The proposed batteries by the software for the hybrid wind and solar system were 12 V acid-lead batteries with a capacity of 65 amp-hours and a power output of 780 watt-hours. For the resulting data, a chart was plotted using the HOMER software, as shown in Figure 7. In this chart, it is also clear that the replacement or replacement cost is less than the battery installation cost.
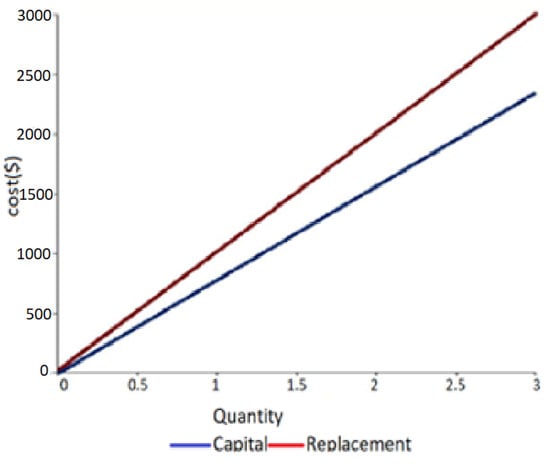
Figure 2.
Cost chart for photovoltaic arrays’ (red) installation and (blue) replacement.
The data on horizontal solar radiation, as a monthly average for 22 consecutive years (Table 3), were extracted from the NASA website by the HOMER software itself [12].
Table 3.
Horizontal solar radiation in Fereydunshahr.
The chart plotted for this data in terms of clarity index is as shown in Figure 3.
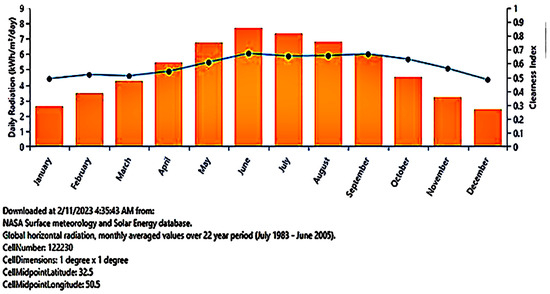
Figure 3.
Monthly average chart of horizontal radiation for 22 years in Fereydounshahr. Reference: [12].
Based on the obtained data, it is clear that the maximum radiation occurs in June. This chart (Figure 3) shows that the maximum radiation occurs in the months of April (May) to August (Aug). For the present study, a wind turbine is also considered. For this small wind turbine, the installation and commissioning cost per kilowatt was estimated at around $500 and the replacement cost at $400 (with the dollar rate of 30,000 Tomans). This cost was taken in 2022 from Bad Afra Energy Co., in the Growth Center of Mohaghegh Ardabili University, Ardabil, Iran a knowledge-based company that supplies, equips, and installs renewable resources (Figure 4). The blue line is the graph of the average monthly horizontal radiation of 22 years in Marjea Fereydounshahr.
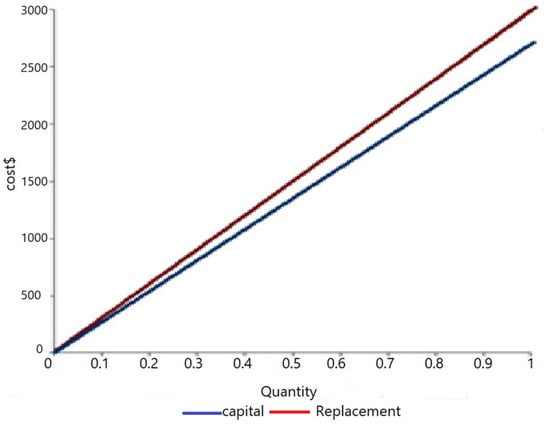
Figure 4.
Installation (red) and replacement (blue) cost curves for wind turbines.
Wind speed data were extracted from the NASA website by the software on a monthly average basis over 22 years, as shown in the Figure 5. Wind speed data were at an elevation of 40 m and were converted to a 10 m elevation speed based on the wind turbine elevation, using the equations stated for the turbine [12] Table 4.
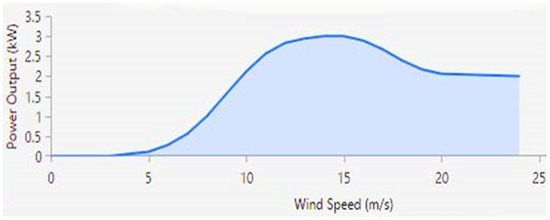
Figure 5.
Power curve–wind speed for the wind turbine proposed by the software.
Table 4.
Wind speed at different heights on a monthly average basis over 22 years in Fereydunshahr.
The main physical properties of the selected diesel generator in this study are:
Maximum electrical power output, fuel type, and generator fuel consumption curve (which depends on the amount of fuel consumed relative to the electrical power generated) and its expected lifetime in hours.
According to the Iranian market, the costs of investment, replacement, and maintenance of a diesel generator, which is automatically sized by the software, were estimated, and the cost charts were obtained using the HOMER software. The fuel consumed is diesel, and the price per liter of diesel is 0.033 dollars, which is its free rate. The cost chart of the intended diesel generator is presented in Figure 6.
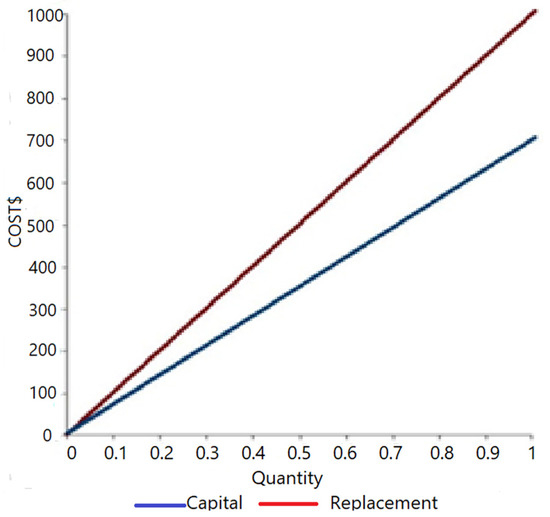
Figure 6.
Installation and replacement cost curves for the diesel generator.
In HOMER, battery details include: batteries, voltage, capacity curve, lifetime curve, minimum state of charge, and roundtrip efficiency. For this set, 12 V acid-lead batteries with a capacity of 65 amp-hours and a power output of 780 watt-hours were considered. For the resulting data, a chart was plotted using the HOMER software, as shown in Figure 7. In this chart, it is also clear that the replacement or replacement cost is less than the battery installation cost. The proposed batteries by the software for the hybrid wind and solar system were of the AES-2/8 type. In this curve, it is also clear that the replacement or substitution cost is less than the battery installation cost.
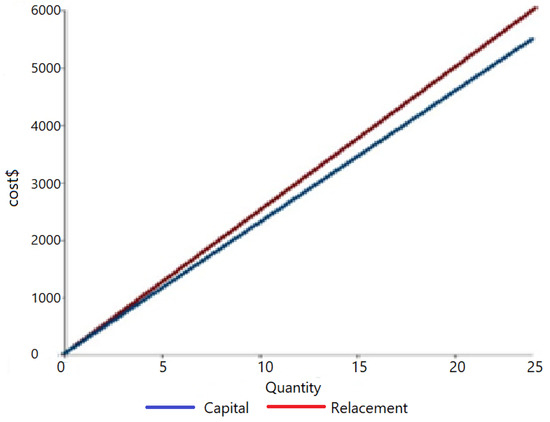
Figure 7.
Cost curves for battery bank (1) installation and (2) replacement.
Since the electricity produced by the photovoltaic array and the wind turbine is DC, a power inverter is used to convert the DC current to AC. The initial cost, replacement cost, and maintenance for this model, which is of the CyboEnergy Grid-Interactive C1-Mini-1000 A type, suitable for systems from 1 kW to 10 kW, which is the only DC-connected inverter for all energy sources, were plotted using the HOMER software, as shown in Figure 8. It should be noted that the efficiency for this device was 90%. Figure 9 shows a comparison of Figure 2, Figure 4 and Figure 6–8 together.
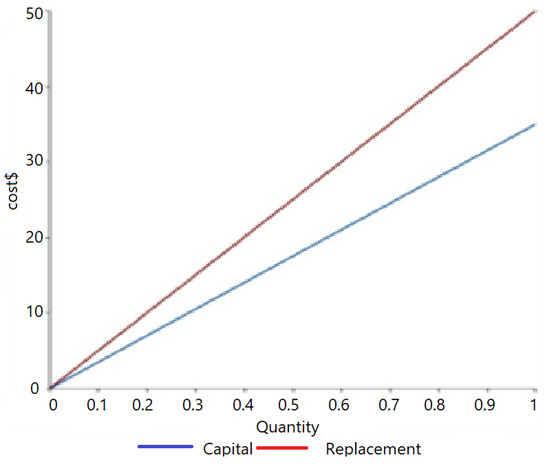
Figure 8.
Power inverter cost curves: (1) installation and (2) replacement.
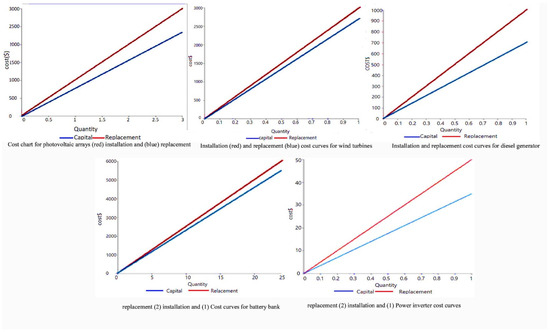
Figure 9.
Cost comparison between installation (red) and replacement (blue) for different parts of the hybrid system used together.
Finally, by adding sensitivity variables, sensitivity values were also considered for the annual average wind speed and fuel price. This sensitivity analysis provides the ability to determine the impact of changes in average monthly wind speed and diesel fuel price on the optimal system design. Analysis and design of micro power systems can be challenging due to the abundance of design options and uncertainty in key parameters such as future fuel prices and sizes. Renewable power sources add more complexity as their output power can be intermittent, seasonal, or non-dispatchable, and the availability of renewable resources can vary. HOMER performs three key tasks of simulation, optimization, and sensitivity analysis. In the simulation process, HOMER simulates the operation of a micro power system configuration for each hour of the year to determine the technical feasibility and life cycle cost of the model.
3.2. Configuration and Sensitivity Analysis
The HOMER software, based on the input data (wind speed and fuel cost, solar radiation intensity and angle, number of sunny days), which it automatically downloads from the NASA website, performs an analysis on each system to optimize and sorts the simulated systems in a table called the Optimization Results, based on increasing total net present cost. In optimization, the best combination fully meets all predefined constraints along with the minimum NPC. The resulting configuration includes 5324 simulation cases and 10,648 sensitivity analysis cases. After investigating different scenarios, the HOMER software suggests the optimum arrangement for the hybrid system, and the results obtained from optimization are summarized in Figure 10. As expected, the optimization results in HOMER show that the most economical method for the studied area is using a diesel generator along with solar panels. In this table, the first row is related to the diesel generator-only configuration, the second row is the diesel generator–photovoltaic configuration, the third row is the diesel generator–wind turbine configuration, and the fourth row is related to the diesel generator–photovoltaic-wind configuration.
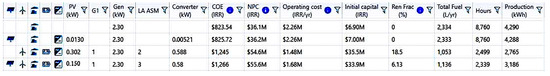
Figure 10.
Inventory trend chart.
To define the price in PV arrays, the initial capital cost, replacement cost, and operation and maintenance (O&M) cost per year in dollars are determined. The replacement cost of PV array is at the end of its useful life. By default, the replacement cost is equal to 90% of the capital cost.
3.2.1. Diesel Generator Configuration
Regarding the use of only a diesel generator for the electricity of the target unit, the software provides charts related to the total costs for the system’s life cycle, which is considered 25 years, where the main part is related to the installation, transportation, and maintenance of the diesel generator. The total NPC for this configuration is estimated to be about 1264 dollars, which will cost about 0.004 dollars per kilowatt-hour of generated electricity. The software has suggested three lead-acid batteries for the system, but to know which part of the costs are allocated over different years, we use the inventory trend chart in Figure 11. This chart shows that the highest cost over time for power generation is related to diesel fuel costs.
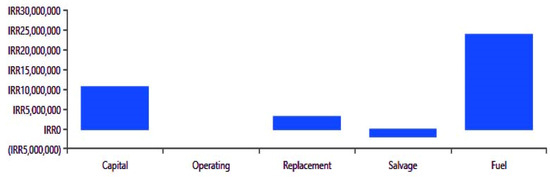
Figure 11.
Total cost chart of diesel generator configuration.
As shown in Figure 11, the highest cost is related to fuel supply, and the second-highest costs are purchasing the diesel generator. One of the most important indicators that can be important in the operation of renewable energy systems is the capital recovery factor, which has been calculated for all configurations.
In this relation, PBT is the capital recovery time, NPC is the total net costs, and INCOME is the total net income.
In this configuration, the daily electricity production is about 10.08 KWh, which given the consumption load of about 0.72 KWh, is a surplus. According to the latest tariff set by the Ministry of Energy for guaranteed purchase of renewable power units below 20 kilowatts, the price per kilowatt-hour is considered 2500 Rials, so the daily income from selling is about 0.06 dollars, which will be about 0.055 dollars for the system’s life cycle. Therefore, the capital recovery time will be 16.48 years. The inventory trend chart in Figure 11 for this configuration shows that, in addition to installation costs, due to the high working hours compared to the low generator life, replacement will constantly be needed. In addition, the costs of fuel supply and maintenance of the device are continuously repeated during the lifetime of the system, as shown in Figure 12. However, the salvage value for the diesel generator system is very low
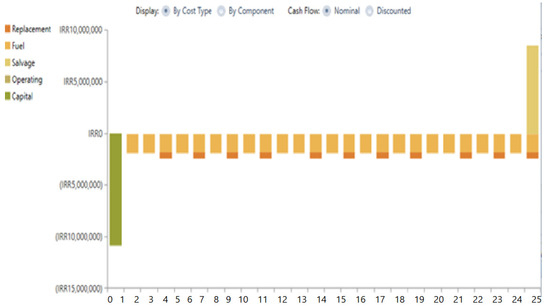
Figure 12.
Inventory trend chart for single diesel generator configuration.
In this configuration, the annual diesel fuel consumption is about 2334 L, which is used for generating 4290 KWh of electricity, and the specific fuel consumption per KWh is 0.54 L. The results obtained from optimization show the amount of pollution from using a diesel generator to supply electricity to the dairy farm under study during the year, according to Table 5, which is logically more pollution compared to using other hybrid systems in this system. Accordingly, by limiting the total electricity consumption of all livestock units in the province to lighting and milking machines, the amount of carbon dioxide emissions to produce 311,830 kg of raw milk will be 4087 kg. In other words, using a single diesel generator configuration for milking each kilogram of raw milk will produce about 13 g of carbon dioxide pollution and a negligible amount of other greenhouse gases.
Table 5.
Pollution results for single diesel generator configuration.
3.2.2. Diesel Generator–Photovoltaic Configuration
According to HOMER, the most economically optimal configuration for power generation for the target unit is to use a diesel–photovoltaic arrangement (Figure 13). It shows the monthly electricity production from each of the diesel generators and photovoltaic arrays. The photovoltaic array used in this system is a Generic Flat PV model of 1 KW. Considering the low cost of generator fuel and the high price of panels compared to generator fuel, the amount of electricity produced in this system by the photovoltaic array is very small, about 0.5%. The amount of electricity produced in this system is high; about 99.5% by the generator.
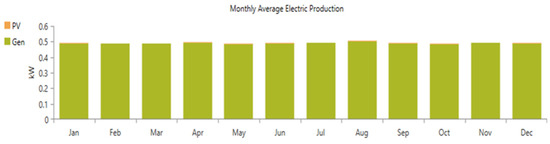
Figure 13.
Chart and results related to average monthly electricity generation in diesel–photovoltaic configuration.
The annual electricity generation shows that we will have 11.08 KWh of daily electricity generation, while the required amount is 10.01 KWh, so the surplus of this amount, which is 1.72 KWh, is stored in the battery. Given the total generated electricity and consumption load, the daily income from selling electricity in the process of using this configuration is about 0.015 dollars. Therefore, the capital recovery time will be 9.61 years. The summary chart of costs in this configuration shows that the total costs over the system life cycle are mostly related to supplying generator fuel and then the cost of purchasing the generator and solar panel (Figure 14).
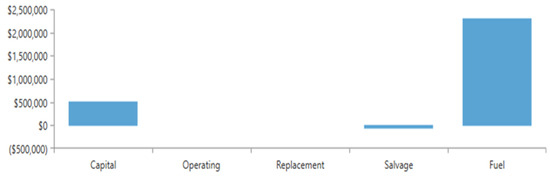
Figure 14.
Cost trend summary chart for diesel generator–photovoltaic configuration.
In this configuration, the amount of diesel fuel consumption is reduced by a very negligible amount of about 3 L per year. In the inventory trend chart for the diesel–photovoltaic configuration, the salvage value is higher than the diesel generator configuration, and the main costs are related to fuel costs and installation and replacement costs of components during the 25-year useful life of the system (Figure 15).
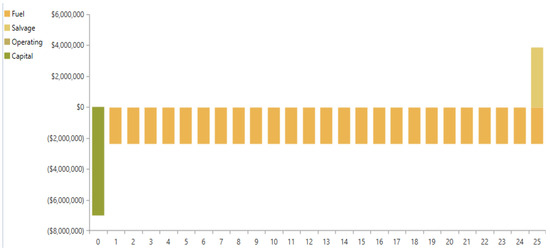
Figure 15.
Inventory trend chart for diesel generator–photovoltaic configuration life cycle.
Table 6 shows the amount of emissions from using the diesel generator–photovoltaic configuration. The use of the photovoltaic system was 0.5% and had a slight effect on reducing greenhouse gas emissions.
Table 6.
Pollution results for diesel generator–photovoltaic configuration.
3.2.3. Diesel Generator–Wind Turbine Configuration
What is clear is that in using the diesel–wind configuration, the amount of electricity produced by the wind turbine is less than that of the diesel generator, so that 1.18% of the total electricity produced is allocated in this configuration. The wind turbine used in this system is of the Generic 3 KW type, and the electricity output from it is AC (Figure 16). Also, a suitable height of 10 m has been chosen for the home wind turbines.
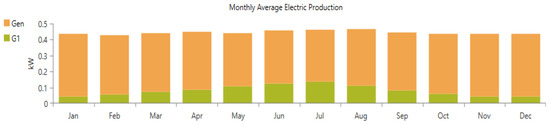
Figure 16.
Chart and results related to average monthly electricity generation in diesel generator–wind turbine configuration.
However, daily electricity production is 10.66 KWh, which is 0.58 KWh more than daily consumption, which is 0.005 dollars per day, with a capital recovery rate of about 9.49 years. For a 10 m height, the annual electricity generation of the wind turbine is about 704 KWh. The contribution of the diesel generator in annual electricity generation is 4090 KWh, and the annual diesel fuel consumption reaches 2242 L. As evident from the results of the summary inventory trend chart, the bulk of the costs that led to the lower economic rating of this diesel–wind turbine configuration are related to the costs of supplying the wind turbine and generator fuel costs (Figure 17).
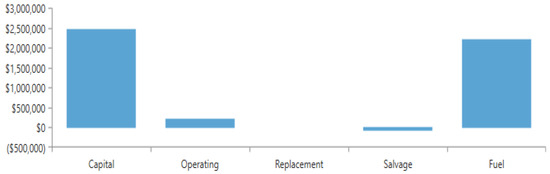
Figure 17.
Summary cost trend chart for diesel generator–wind turbine configuration.
The inventory trend chart effectively illustrates the reasons for the increase in total costs, which results in a decrease in the salvage value of inventories in this configuration compared to the diesel–wind turbine configuration (Figure 18).
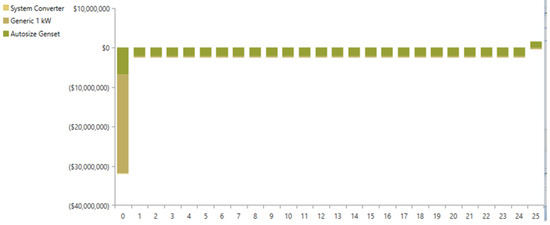
Figure 18.
Inventory trend chart for diesel generator–wind turbine configuration life cycle.
Using this type of diesel–wind configuration generates 71.9% and 1.18% of the annual electricity consumption of the unit. The wind turbine was able to reduce the amount of emissions compared to diesel and therefore, was more environmentally friendly, and the amount of pollutant gases produced per kilogram of milk will be 10 g. The related results are shown in Table 7.
Table 7.
Pollution results for diesel generator–wind turbine configuration.
3.2.4. Diesel Generator–Wind Turbine–Photovoltaic Configuration
In the case of the triple diesel–wind turbine–photovoltaic configuration as well, the diesel generator plays a greater role compared to the wind turbine, and the wind turbine plays a greater role compared to the photovoltaic array. So, for a 10 m high turbine, the diesel generator is 87.5%, the wind turbine is 2.13%, and the photovoltaic array is 11% of the configuration’s electricity generation (Figure 19). The total electrical energy generated in this configuration is 5336 KWh per year, which reaches about 14.61 KWh per day. For this configuration, the surplus production is 4.53 KWh, and the capital recovery rate with the daily sale amount of 0.038 dollars is about 27 years, as the annual sale of this amount reaches more than 76.137 dollars (Figure 20).
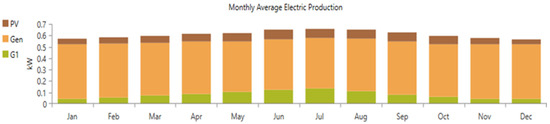
Figure 19.
Chart of results related to average monthly electricity generation in the triple configuration of diesel generator–photovoltaic–wind turbine.
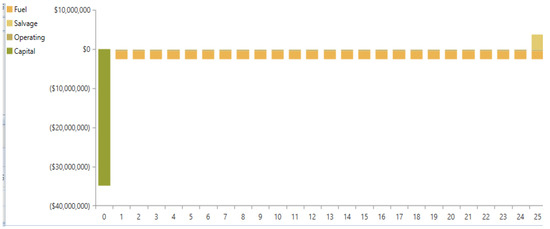
Figure 20.
Inventory trend chart for the triple life cycle of diesel generator–photovoltaic–wind turbine.
The inventory trend chart, as shown in Figure 21, indicates the initial cost of supplying the wind turbine and photovoltaic array and diesel generator, and also, costs for multiple battery and power converter replacements and one-time replacement of photovoltaic arrays and wind turbines during the project’s life, which has increased the NPC. However, due to the use of renewable energies and reducing the use of diesel generators, the amount of emissions from the triple diesel–wind turbine–photovoltaic configuration is much lower than the dual and single configurations, and the diesel generator fuel consumption is 2222 L during a year (Table 8).
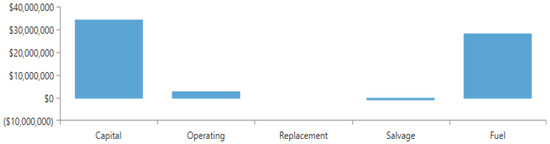
Figure 21.
Summary cost trend results for triple diesel generator–photovoltaic–wind turbine configuration.
Table 8.
Pollution results for triple diesel generator–photovoltaic–wind turbine configuration.
The results show that the lowest pollution occurs when solar panels, a wind turbine, power converter, and battery are present in the circuit along with the generator, which is a logical conclusion because with all components in the circuit, the power drawn from the polluting generator will be lower.
In this configuration, the share of each kilogram of raw milk from the amount of carbon dioxide pollution is reduced to about 9.5 g. In other words, in this configuration for Fereydonshahr County, 9.26% of carbon dioxide emissions will be reduced annually compared to the single diesel generator configuration. For this reason, the use of renewable energies such as solar and wind is increasingly attracting the attention of countries, and their use increases annually. It should be noted that the highest pollution occurs when none of the renewable energy sources are in the circuit, so the presence of only the generator will cause environmental pollution. It is worth mentioning that by determining and approving appropriate amounts for pollution fines, the total net present cost, classified energy cost, and capital recovery index can also be reduced for the triple configuration.
4. Summary and Conclusions
In this research, the possibility of using hybrid energy systems in small sections to supply the electricity consumption of a livestock unit was investigated and for this purpose, three sources: photovoltaic array, diesel generator, and wind turbine, were evaluated from a technical, economic, and environmental point of view. This evaluation was conducted using the HOMER energy analysis software. The net present costs show diesel generators alone to be the most economically viable option for the livestock facility. However, the capital recovery factor indicates a payback period of over 48 years for diesel generators, significantly longer than other configurations. Combining diesel generation (5.99%) with solar photovoltaics (5%) is the next most cost-effective hybrid solution, while in the arrangement of diesel generator–photovoltaics, this index is 61.9. It has been ranked first in this regard for years because the percentage of renewables in this arrangement increases compared to the arrangement of a single diesel generator. Also, in relation to the triple arrangement of diesel 57.8%, wind 13%, and photovoltaic 11.2%, the capital recovery index is about 27 years, which also ranks third.
Author Contributions
Conceptualization, V.R.S. and R.A.; methodology, V.R.S. and R.A.; software, R.A.; validation, S.A.M.; formal analysis, M.T., R.A., and J.D.; investigation, R.A. and S.A.M.; resources, S.A.M.; data curation, M.T. and M.S.; writing—original draft preparation, V.R.S. and R.A.; writing—review and editing, V.R.S., M.S., and J.D.; visualization, S.A.M. and M.T.; supervision, V.R.S. and M.T. All authors have read and agreed to the published version of the manuscript.
Funding
This research received no external funding.
Institutional Review Board Statement
Not applicable.
Informed Consent Statement
Not applicable.
Data Availability Statement
The data presented in this study are available upon request from the corresponding author due to permission restriction.
Conflicts of Interest
The authors declare no conflicts of interest.
References
- Izam, N.S.M.N.; Itam, Z.; Sing, W.L.; Syamsir, A. Sustainable development perspectives of solar energy technologies with focus on solar Photovoltaic—A review. Energies 2022, 15, 2790. [Google Scholar] [CrossRef]
- Arabkoohsar, A.; Andresen, G. Supporting district heating and cooling networks with a bifunctional solar assisted absorption chiller. Energy Convers. Manag. 2017, 148, 184–196. [Google Scholar] [CrossRef]
- Mas’ud, A.A.; Wirba, A.V.; Alshammari, S.J.; Muhammad-Sukki, F.; Abdullahi, M.M.; Albarracín, R.; Hoq, M.Z. Solar energy potentials and benefits in the gulf cooperation council countries: A review of substantial issues. Energies 2018, 11, 372. [Google Scholar] [CrossRef]
- Elavarasan, R.M.; Shafiullah, G.; Padmanaban, S.; Kumar, N.M.; Annam, A.; Vetrichelvan, A.M.; Mihet-Popa, L.; Holm-Nielsen, J.B. A comprehensive review on renewable energy development, challenges, and policies of leading Indian states with an international perspective. IEEE Access 2020, 8, 74432–74457. [Google Scholar] [CrossRef]
- Arabkoohsar, A.; Nami, H. Thermodynamic and economic analyses of a hybrid waste-driven CHP–ORC plant with exhaust heat recovery. Energy Convers. Manag. 2019, 187, 512–522. [Google Scholar] [CrossRef]
- Abbaszadeh, M.A.; Pirkandi, J.; Tarabi, A.; Parhizkar, H. Optimal planning hybrid renewable energy systems based on wind turbine using HOMER in Iran: A review. J. Renew. New Energy 2018, 5, 74–90. [Google Scholar]
- Kansara, B.U.; Parekh, B. Modelling and simulation of distributed generation system using HOMER software. In Proceedings of the 2011 International Conference on Recent Advancements in Electrical, Electronics and Control Engineering, Sivakasi, India, 15–17 December 2011; pp. 328–332. [Google Scholar]
- Akbari, R.; Ajabshirchi, Y.; Haghighat Shoar, F. Environmental analysis and evaluation of energy consumption using hybrid system for industrial unit in Mianeh city. Modares Mech. Eng. 2020, 20, 2363–2375. [Google Scholar]
- Javanmard, S.; Yarahmadi, E.; Khazanedari, L. Feasibility study of solar energy utilization with emphasized on plains of Iran. J. Meteorol. Atmos. Sci. 2020, 2, 335–354. [Google Scholar]
- Asghari Saraskanroud, S.; Belvasi, I. The feasibility of utilizing solar energy using remote sensing and SEBAL algorithm Case study: Alshtar County. Sci. Res. Q. Geogr. Data 2020, 29, 169–184. [Google Scholar]
- Taghvaei, M.; Saboohi, E. Zoning, location, climate, solar power plant, Topsis. Res. Urban Plan. 2017, 8, 61–82. [Google Scholar]
- NASA. Global Horizontal Radiation, June 1983–June 2005. Available online: https://power.larc.nasa.gov (accessed on 11 February 2023).
Disclaimer/Publisher’s Note: The statements, opinions and data contained in all publications are solely those of the individual author(s) and contributor(s) and not of MDPI and/or the editor(s). MDPI and/or the editor(s) disclaim responsibility for any injury to people or property resulting from any ideas, methods, instructions or products referred to in the content. |
© 2024 by the authors. Licensee MDPI, Basel, Switzerland. This article is an open access article distributed under the terms and conditions of the Creative Commons Attribution (CC BY) license (https://creativecommons.org/licenses/by/4.0/).