Abstract
An efficient energy management system (EMS) enhances microgrid performance in terms of stability, safety, and economy. Traditional centralized or decentralized energy management systems are unable to meet the increasing demands for autonomous decision-making, privacy protection, global optimization, and rapid collaboration simultaneously. This paper proposes a hierarchical multi-layer EMS for microgrid, comprising supply layer, demand layer, and neutral scheduling layer. Additionally, common mathematical optimization methods struggle with microgrid scheduling decision problem due to challenges in mechanism modeling, supply–demand uncertainty, and high real-time and autonomy requirements. Therefore, an improved proximal policy optimization (PPO) approach is proposed for the multi-layer EMS. Specifically, in the centrally managed supply layer, a centralized PPO algorithm is utilized to determine the optimal power generation strategy. In the decentralized demand layer, an auction market is established, and multi-agent proximal policy optimization (MAPPO) algorithm with an action-guidance-based mechanism is employed for each consumer, to implement individual auction strategy. The neutral scheduling layer interacts with other layers, manages information, and protects participant privacy. Numerical results validate the effectiveness of the proposed multi-layer EMS framework and the PPO-based optimization methods.
1. Introduction
Due to the continuous growth of energy demand, the shortage of fossil fuels, and the increasing pollution, traditional power systems are encountering significant challenges. This necessitates a transition towards a more environmentally friendly, sustainable, and efficient smart grid framework [1,2]. A microgrid, as a small-scale and independent smart grid system, can mitigate the impact on grid security and stability caused by the high penetration of renewable generation (RG) systems [3,4,5]. Therefore, an effective microgrid energy management system (EMS) is essential to enhance the microgrid performance in terms of stability, safety, and economy [6,7,8,9].
1.1. Train of Thoughts and Literature Review
According to different component compositions and operational requirements, the architecture of microgrid EMSs in current research includes a centralized mode and a decentralized mode. In a study on the centralized mode, the authors in [10] offered a mathematical formulation for an isolated microgrid centralized EMS issue using model predictive control. In [11], considering the high penetration of RG and energy storage systems, a centralized model predictive control approach was proposed for an optimal generation strategy in a microgrid. The authors in [12] proposed an energy management framework based on the energy price tag of connected energy storage systems to cope with potential energy imbalances. In [13], a centralized EMS for a DC microgrid was built to adopt multi-optimization for energy management during the peak and off-peak load demand. In [14], a joint energy management system was proposed to manage electric supply and demand in houses and buildings. The authors of [15] proposed a new seagull-based algorithm, which was combined with a genetic algorithm to solve the issue whereby the central microgrid controller needs a large amount of computation. However, in centralized energy management, microgrid participants passively perform central commands without autonomous participation and decision; meanwhile, the individual privacy information cannot be securely protected due to the need for uploading energy data. A decentralized microgrid EMS can ensure the autonomy of participants and stimulate the vitality of energy market. In [16], the authors presented a decentralized real-time energy management scheme for multiple-source hybrid energy systems to deal with the sudden change in system configuration. Reference [17] adopted a decentralized method to optimize the operation of an intelligent microgrid, which included loads, controllers, and renewable resources. In [18], a decentralized EMS model was utilized to cut system operation costs under uncertainties from RG devices and loads. In [19], a decentralized energy management strategy based on a mode-triggered droop was used for a DC microgrid. In [20], a distributed EMS for community microgrids was developed; based on price signals, it allocated energy resources and residential appliances by iterative interaction between the controller and home EMS. In [21], a microgrid coalition was presented to solve a multi-objective optimization issue via cooperation with neighboring energy systems. Nevertheless, it is difficult to ensure the participants’ high coordination for rapid and real-time decision-making in decentralized mode, and the incomplete information interaction between participants makes it hard to derive optimal dispatch strategies.
To address these challenges in a centralized or decentralized EMS, this paper proposes a hierarchical multi-layer EMS framework for microgrids, comprising three layers: a supply layer, a demand layer, and a scheduling layer. In the supply layer, which is the upper layer, given that the generation side focuses more on overall allocation and collaborative optimization, this layer adopts a centralized mode to obtain the optimal generation strategies to maximize economic and environmental benefits. The demand layer is a lower layer, with diverse requirements and greater emphasis on self-participation; thus, a distributed architecture is utilized for this layer to establish an energy auction market. To ensure efficient information exchange and privacy security between the supply and demand layers, a scheduling layer is constructed, which includes a neutral system operator to interact with the other layers, price various energy sources, and host energy auctions.
On the hierarchical multi-layer EMS skeleton, the strategy optimization for both energy supply and consumption constitutes a pivotal component of a microgrid EMS. Various strategy optimization approaches for energy management have been widely studied [22,23,24,25,26,27,28]. Reference [22] established a microgrid EMS with RG devices as a demand response option, and adopted stochastic, multi-objective, and mixed-integer programming to solve optimal scheduling. The authors in [23] presented an energy trading benefit model for a microgrid EMS using mixed-integer linear programming. In [24], a joint multi-objective mixed-integer linear programming approach was introduced for a microgrid to balance long-term planning and real-time operation. In [25], an approximate dynamic programming method for the economic dispatch for a microgrid with RG devices was adopted. Reference [26] presented a new approach for optimal allocation of RG and energy storage systems in microgrids and considered the problem as non-smooth cost functions with equality and inequality constraints. In [28], a genetic algorithm for a real-time energy management system was applied to achieve the multi-objective optimization of operating costs, carbon emission costs, and transaction profits. These above traditional optimization methods may have some of the following drawbacks: high model dependency that makes it difficult to handle the uncertainties of distributed generation and loads, a low real-time capability and adaptability, and a myopic optimization horizon considering current objectives instead of future cumulative goals. As a solution to address these drawbacks simultaneously, reinforcement learning (RL) has achieved notable results in microgrid strategy optimization [29,30,31,32,33,34]. In [29], an RL-based energy management controller was used to solve the real-time control problem. In [30], a model that integrated RL and model predictive control was presented to achieve advanced building energy management. The authors in [31] developed an energy management method based on a Deep Q Network (DQN) to achieve a low operating cost of an integrated hybrid system. Reference [33] proposed a distributed online multi-agent RL approach to obtain a real-time pricing strategy for a smart grid. In [34], a deep deterministic policy gradient (DDPG) method was used to achieve the optimal economic management of a microgrid.
Classic deep RL-based algorithms, such as DQN and DDPG, suffer from issues like poor stability and slow convergence [35,36]; in contrast, the proximal policy optimization (PPO) algorithm, with its unique clip-optimization mechanism, effectively avoids the volatility caused by excessive policy updates, exhibiting prominent stability and rapid convergence [37]. In this paper, to accomplish our needs for a strategy optimization in different layers, PPO algorithms with different ameliorations are adopted in the proposed multi-layer EMS.
1.2. Contributions
In summary, the following items are the contributions and novelties of this paper:
- Novelty in system architecture: A novel hierarchical multi-layer EMS is proposed for a microgrid containing wind turbines, photovoltaics, pumped storage, battery storage, and regional users. A supply layer adopts a centralized generation management scheme to fully consume renewable energy and prevent overcapacity; a demand layer adopts distributed consumption autonomous decision-making to participate in the energy auction; a scheduling layer, as a neutral operator, implements the upper- and lower-layer deployment and information exchange.
- Novelty in optimization methodology: The centralized PPO is applied in the supply layer to efficiently obtain the optimal generation strategy. In the energy auction market of the demand layer, a multi-agent PPO is utilized to develop an independent energy usage strategy for each user, which is the first combination of PPO, multi-agent reinforcement learning (MARL), and market auction mechanism.
- Novelty in multi-agent learning: In the distributed multi-agent learning for the auction decision, an action-guidance-based method is proposed to promote the equilibrium selection of the MAPPO algorithm.
1.3. Organization
The rest of this paper is organized as follows. In Section 2, the hierarchical three-layer microgrid EMS model is described. In Section 3, the PPO theory and its algorithm implementation process is described for the supply layer. In Section 4, the MAPPO algorithm formulation for the demand layer auction market is introduced. In Section 5, the simulation results and analyses are presented. We conclude this paper in Section 6.
2. System Model
In this paper, we consider a hierarchical microgrid structure, which is depicted in Figure 1. This microgrid comprises three parts: the supply side, demand side, and system operator. The supply side functions as the power generation source and consists of a thermal power plant (i.e., a micro-turbine (MT)), RG, a pumped storage plant (PSP), and an energy storage system (ESS). The demand side encompasses all energy consumers, with each user represented by a regional agent. The system operator is responsible for processing and transmitting information; moreover, the operator sets the prices for energy provided by the supply layer and oversees energy competition as an auctioneer.

Figure 1.
System model of the microgrid.
Correspondingly, the hierarchical multi-layer microgrid EMS comprises three levels: a supply layer, a demand layer and a neutral scheduling layer, shown in Figure 2.

Figure 2.
Hierarchical multi-layer microgrid energy management system framework.
As illustrated in Figure 2, the proposed hierarchical EMS constructs appropriate models for supply and demand layers according to the specific roles and requirements of power suppliers and consumers, instead of using a unified centralized or decentralized framework for the entire microgrid system. A centralized mode provides a comprehensive view for the overall optimization. At the supply layer, power supply units need a unified dispatch to prioritize consuming renewable sources and maximize economic benefits; therefore, a centralized generation optimization model is used. At the demand layer, individual consumers with different objectives prefer to participate in energy management independently; accordingly, an auction market-based multi-agent strategy optimization model is adopted. Crucially, a scheduling layer with a neutral non-profit operator is added to interact with supply and demand layers and perform generation management and market auctions.
Compared with simple centralized or decentralized optimization, this multi-layer EMS introduces an innovative underlying operation framework. In this framework, consumers’ decision autonomy is better than in the centralized mode, and the coordination and balance among participants are superior to the decentralized mode. Moreover, operation efficiency and privacy protection during information exchange can be guaranteed.
2.1. Supply Layer
The supply layer is under centralized management, leveraging the regulation capabilities of the pumped storage plant and energy storage system to fully utilize renewable energy and supplement the shortfall with thermal power generation to prevent excess power generation. After receiving total power consumption data from all users and energy prices from the scheduling layer, the supply layer formulates the optimal strategy to determine the power generation of each plant to maximize economic benefits and carbon emission reduction.
2.1.1. Renewable Generation
RG includes photovoltaic (PV) and wind turbine (WT) units. The power outputs of RG can be described as [38]:
where is the conversion efficiency, is the total area of PV panels, is the average solar irradiance, T is the average temperature, and are the cut-in and the cut-off wind velocity, and is the rated power of the WT.
The power generation cost of RG is expressed as:
where and are cost parameters.
2.1.2. Pumped Storage Plant
When , the PSP is pumping and charging; when , the PSP is discharging. The PSP’s operation constraints are written as:
where are the PSP’s charging and discharging power; is the energy in the PSP at t; is the capacity of the ESS; are the efficiency of the PSP’s charging and discharging process, respectively.
The PSP operation cost is written as:
where is the equipment start-up, operation, and maintenance cost of the PSP.
2.1.3. Energy Storage System
The ESS plays the same role as the PSP and maintains the same charge/discharge state as the PSP. The ESS’s operation constraints are written as:
where are the ESS’s charging and discharging power; is the energy in the ESS at time slot t; is the capacity of the ESS; are the efficiency of the ESS’s charging and discharging process, respectively; is the ESS’s state of charge, considering the lifespan of battery equipment, with generally maintained within a certain range. The ESS’s operation cost is written as:
where is the cost coefficient of the ESS.
2.1.4. Microturbine Group
Only when does the MT group generate power to satisfy all users’ power consumption. The power outputs of the MTs can be described as:
In this study, the MTs consume natural gas for power generation. The MT’s cost function is expressed as [39]:
where is the price of natural gas, is the efficiency of the MT, and is the operation cost.
2.2. Demand Layer
2.2.1. User Loads
The demand layer is under decentralized management. In this study, a city is divided into several areas and all users in an area are regarded as a regional agent. is the total loads of regional agent i at time slot t. The objective of each regional agent is to maximize their own benefits by participating in the auction of the energy market and purchasing energy.
2.2.2. Utility Function
The utility function is used to describe a user’s consumption satisfaction, which is non-decreasing and concave. It can be denoted as:
where is a parameter that represents the user’s preference; is a predetermined parameter.
2.3. Scheduling Layer
Considering the privacy of each agent and the incomplete flow of information, we set a system operator in the scheduling layer and assume that it is absolutely neutral. The operator exchanges information with each agent and provides them with services, as shown in Figure 2. The operator collects the consumption information of each agent from the demand layer and sends the total load and energy prices to the supply layer. The supply layer optimizes the generation strategy based on the information. Then, the operator hosts the energy auction on the demand layer as an auctioneer according to the optimal generation strategy. As the party with complete information, it also provides a guidance quotation to each regional agent participating in the auction. After the auction, if there is a shortage or surplus of energy in the energy market, the operator trades with the main grid.
2.3.1. Energy Pricing
The energy price set by the operator is not the final price of the energy market, but the base price of the auction. When determining energy prices, in addition to the generation cost, we also introduce a load fluctuation cost. The load fluctuation cost refers to the additional operating costs when the power demand deviates from the average level. Energy prices per unit are denoted as:
where is the average load; is the unit load fluctuation cost; is the load fluctuation cost parameter; is the unit energy price of the RG, ESS, PSP, and MTs; represents the extra costs of the RG, PSP, and ESS.
2.3.2. Mechanism of Energy Auction Market
In this paper, an auction market where consumers compete with each other is adopted [40]. At time slot t, the operating agency provides the base price and amount of various energy sources, and buyers provide the bid price and demand load. Both parties keep matching until the conditions are no longer met. In the kth round of auction, the energy list and buyers’ quotes can be aggregated as:
where indicates the remaining quantity of energy i in the kth round; indicates the bid price of regional agent j; indicates the demand load of regional agent j in the kth round; indicates the sales volume of energy i in the hth round; and indicates the purchase volume of regional agent j in the hth round.
In the kth round, if , the corresponding energy i/regional agent j do not participate in the round. Then, the minimum energy price is = , and the maximum bid is . If , this round of match trading is performed, and the matched parties are the energy source that offers and the buyer that bids . If multiple buyers offer the same bid price, they purchase energy in proportion to their respective demand load. The auction process ends until all energy is sold out, the demand load of all buyers is met, or until . The final transaction price in the kth round is:
3. Centralized PPO-Based Generation Optimization for Supply Layer
3.1. Markov Decision Process
In this paper, a centralized PPO algorithm is adopted to determine the optimal energy strategy for the supply layer. To find the optimal policy through PPO, a Markov decision process (MDP) should be established first. Define a discrete-time MDP with a finite range. At each time slot t, the agent observes the environment to obtain the current state , then executes the action according to the policy to obtain the immediate reward and transfer to the next state . In order to obtain the optimal policy , it is necessary to calculate the cumulative reward , which is denoted as:
3.2. Proximal Policy Optimization
PPO is an policy-based deep RL method which can be used to solve continuous action problems [37]. It is necessary to build a deep neural network (DNN) for action generation in PPO. The output of the DNN is the probability of all actions; then, we select the action according to the probability.
In PPO, the policy is directly optimized with respect to the policy parameter by using gradient ascent to increase the probability of optimal action to achieve optimal return. It can be written as:
where is a trajectory which contains all states, actions, and rewards within an episode, is the probability of the trajectory , is the total reward of the trajectory , and is the discount factor. The agent updates by exploring different trajectories and collecting data.
PPO adopts an actor–critic architecture which consists of the actor network with parameters and the critic network with parameters . The actor network is used to estimate the policy function , and the critic network is used to estimate the value function . In this way, the advantage function is defined as:
where and are the action-value function and the state-value function, respectively. Moreover, PPO uses the importance sampling method. After the old parameter is updated to , the data sampled with can still be used to update , which requires multiplying by an importance weight in the calculation. It can be denoted as:
In addition, PPO also uses a clipping loss function to prevent the gradient of each update from being too large and guarantee the algorithm stability. The actor network of PPO is updated as follows:
where is the generalized advantage estimation. The critic network of the PPO is updated as follows:
The training process is shown in Figure 3.

Figure 3.
The training process of centralized PPO.
3.3. Problem Formulation
The supply layer fully utilizes renewable energy by controlling the pumped storage plant and energy storage system, and its objective function can be expressed as:
where is the total revenue from controlling the pumped storage plant and energy storage system; is the total cost.
We map the supply layer model to an MDP formulation, which is shown as follows:
:
where is the energy price given by the operating agency of the ESS and the PSP.
:
where is the charging/discharging power of the PSP and the ESS.
:
where is the total power generation cost of the pumped storage plant and energy storage system, is the penalty of the wind power and photovoltaic curtailment. Because of the purpose to reduce carbon emissions, it only takes the income of the ESS and the PSP as reward to maximize the use of clean energy stored in the ESS and the PSP.
3.4. Algorithm Implementation Process
The detailed steps of the PPO algorithm are shown in Algorithm 1. First, we initialize network parameters and . In each episode, the agent interacts with the environment, and the information obtained is stored in the memory D. Then, a random sampling trajectory is selected from memory D and the parameters and are updated by calculating the loss function.
| Algorithm 1 Centralized PPO procedure for supply layer |
|
4. MAPPO-Based Distributed Auction Decision for Demand Layer
4.1. Multi-Agent Reinforcement Learning with PPO
Notably, the demand layer employs a decentralized architecture, meaning regional consumers operate without centralized management. However, the algorithm proposed in this section is different from traditional decentralized or distributed methods, in which nodes achieve common goals through communication and coordination. In contrast, in MARL, each consumer agent operates autonomously with individual goals, and there is competition among these goals. The purpose of interactive learning is to promote the equilibrium of benefits for consumer agents.
In MARL, each agent should not only consider its own state when selecting actions, but also consider the states and possible actions of other agents. Therefore, the framework of MARL is known as a Markov game.
In MARL, the reward function and state transition for agents are based on the joint action . In general, the agents’ joint action is defined as . When is utilized and the state changes from to , an action evaluation Q-function for agent i, , is defined as:
The goal of agents in MARL is to find an optimal joint action to coordinate all the Q-functions towards global equilibrium. It can be understood as the combination of the optimal choices made by all agents under the influence of other agents.
Then, introducing the PPO mechanism into MARL converts it to the MAPPO algorithm. In MAPPO, to find an optimal joint action, the critic network of each agent estimates the value function by observing the overall situation. The framework of the MAPPO algorithm is shown in Figure 4. In this case, each critic network provides the same advantage function estimation for each agent. Therefore, it is difficult to determine whether the action of each agent is good or bad.

Figure 4.
The framework of the MAPPO algorithm.
To solve the problem, the counterfactual baseline proposed by [41] is adopted. defines a joint action other than that of the agent i, i.e., . Then, the advantage function for each agent i is calculated by comparing the Q-value estimated by the critic network for the executed action to a counterfactual baseline that marginalizes out , while keeping the actions of other agents fixed:
where is the counterfactual baseline, and is the action-value function. Therefore, a separate advantage function is calculated for each agent by Equation (45).
4.2. Action-Guidance-Based MAPPO
To improve the convergence efficiency of the training process for multi-agent interactive learning, an action-guidance-based learning algorithm is proposed in this paper. The operator that obtains all users’ information remains completely neutral and calculates an optimal joint action regarding regional agents’ quotations as the guiding price. This can be viewed as the optimal quotation for all agents’ cooperative situations, and it does not exceed the optimal quotation when all agents are in competition. The operator then sends guidance prices to all regional agents as a reference. This approach helps reduce the exploratory space of the deep learning network for multiple agents during training, leading to a faster rate of convergence without degrading the effectiveness of the convergence.
The objective function of the operator can be expressed as:
where is the total revenue for all users; is the total cost for all users. Thus, the MDP formulation of the operator is shown as follows:
:
where is the set of all energy-generated electricity; is the set of all basic energy prices.
:
where is the unified guiding price for all agents.
:
where is the sum of the consumption costs and utility functions of all agents. The algorithm steps for solving this process are shown in Algorithm 1.
4.3. Problem Formulation
The goal of each user in the demand layer is to maximize their own benefits, so their objective function can be expressed as:
where is the revenue of regional agent i; is the cost of regional agent i.
We map the demand layer model to an MDP formulation, which is shown as follows:
:
:
where is the bid price of regional agent i at time slot t.
:
where is the amount that regional agent i spends on the market auction at time slot t; is the utility function of regional agent i.
4.4. Algorithm Implementation Process
The improved action-guidance-based MARL algorithm is shown in Algorithm 2. First, we train the PPO neural network of the operating agency well in advance. Then, at the beginning of each episode, the operator calculates the guiding prices and sends them to regional agents. Each regional agent updates its own parameter according to the global status information and action.
| Algorithm 2 MAPPO procedures for demand layer |
|
5. Case Studies
5.1. Modeling Settings
The adopted microgrid structure is shown in Figure 1. The parameters of the microgrid devices are shown in Table 1. The neural network parameters are shown in Table 2. All experiments were conducted using PyCharm Community Edition (Python 3.8) on a personal computer.

Table 1.
Parameters of the microgrid components.
Table 2.
Deep neural network parameters.
5.2. Data Sources
The case studies data used in the paper were actual data and were from California ISO OASIS [42]. The time period of the data was from 1 July 2017 to 30 June 2019. We used the data from the last 5 days of each month as testing data, and the rest as training data. The data profiles of that time period, with typical features for wind power, photovoltaic generation, and power loads, were representative for simulation verification. Figure 5 shows the daily average of the data used.
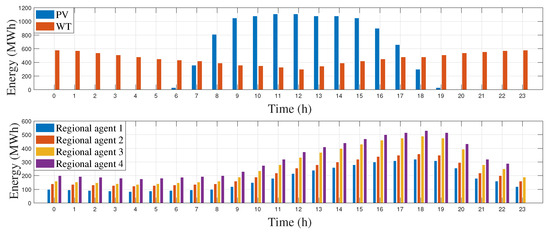
Figure 5.
The daily average values of PV and WT production; the daily average energy consumption of four regional agents.
5.3. Scenario Verification
In this section, scenario tests of a one-day microgrid market operation were conducted. Based on the differences in different seasons, three scenarios were selected for comparison: 30 April 2018 (scenario 1); 31 August 2018 (scenario 2); and 31 January 2017 (scenario 3). The hourly values of input variables, status of storages, and regional agents’ quote prices of scenario 1, scenario 2, and scenario 3 are shown in Figure 6, Figure 7, Figure 8, Figure 9, Figure 10, Figure 11, Figure 12, Figure 13, Figure 14. The hourly power generation values of the MT in scenario 1, 2, and 3 are shown in Table 3, Table 4 and Table 5.
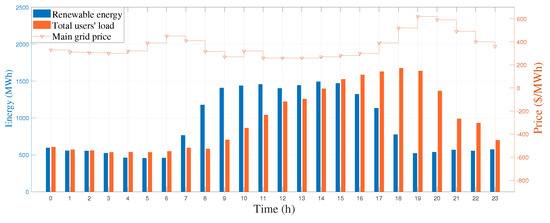
Figure 6.
Hourly values of input variables in scenario 1.

Figure 7.
Hourly values of the status of the PSP and ESS in scenario 1.

Figure 8.
Quote prices of regional agents in scenario 1.
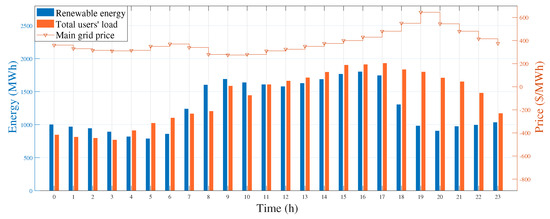
Figure 9.
Hourly values of input variables in scenario 2.

Figure 10.
Hourly values of the status of the PSP and ESS in scenario 2.

Figure 11.
Quote prices of regional agents in scenario 2.

Figure 12.
Hourly values of input variables in scenario 3.

Figure 13.
Hourly values of the status of the PSP and ESS data in scenario 3.

Figure 14.
Quote prices of regional agents in scenario 3.
Table 3.
Hourly power generation values of the MT in scenario 1.
Table 4.
Hourly power generation values of the MT in scenario 2.
Table 5.
Hourly power generation values of the MT in scenario 3.
Figure 6 illustrates the hourly values of input variables in scenario 1. The orange curve in the upper part of Figure 6 represents the main grid price, while the bar chart at the bottom depicts the total users’ load and renewable energy generation. Figure 7 displays the changes in energy storage status of the PSP and ESS during the energy scheduling process for one-day test data in scenario 1. Figure 8, which consists of four subgraphs, shows quotations from all agents and energy trading volume for one-day test data in scenario 1. In Figure 8, the curve at the top of each subgraph represents the quotation of each consumer; the bar chart at the bottom of each subgraph represents the energy purchased by consumers, and different colored bar charts represent different energy trading volumes. Table 3 shows the hourly power generation values of the MT in scenario 1. Overall, in scenario 1, renewable energy sources are abundant from 7:00 to 18:00, while total load demand is high from 9:00 to 22:00. When renewable generation exceeds total load demand, the PSP and ESS store energy, the MT remains idle, the main grid price drops, and consumers’ quotations are much lower than the main grid price. When renewable generation is less than total load demand, the PSP and ESS release energy during periods of higher electricity prices, the MT generates power to supplement electricity demand, the main grid price is higher, and consumers’ quotations are close to the main grid price. The quotation curves of the four consumer agents are generally consistent in scenario 1.
Figure 9 presents the hourly values of input variables in scenario 2. Figure 10 illustrates the changes in energy storage status of the PSP and ESS during the energy scheduling process for one-day test data in scenario 2. Figure 11 details quotations of all agents and energy trading volume for one-day test data in scenario 2. Table 4 shows the hourly power generation values of the MT in scenario 2. In scenario 2, renewable sources are sufficient from 7:00 to 19:00, and the total demand load is high from 5:00 to 23:00. Both renewable energy generation and total users’ load are significantly higher in scenario 2 compared to scenario 1. Moreover, there are fewer periods when renewable generation exceeds demand load in scenario 2. The PSP, ESS, and MT operate similarly in scenario 2 as in scenario 1. The main grid price and user quotations fluctuate with renewable energy generation and total demand load. When the renewable generation is more than demand load, the main grid price is lower, and the user quotation is much lower than the main grid price; when the renewable energy generation is less than the total users load, the main grid price is higher, and the user quotation is close to the main grid price.
Figure 12 depicts the hourly values of input variables in scenario 3. Figure 13 demonstrates the changes in energy storage status of the PSP and ESS during the energy scheduling process for one-day test data in scenario 3. Figure 14 shows quotations of all agents and energy trading volume for one-day test data in scenario 3. Table 5 displays the hourly power generation values of the MT in scenario 3. In scenario 3, renewable sources are adequate from 7:00 to 16:00, and the total demand load is high from 0:00 to 23:00. Renewable energy generation and total user load in scenario 3 are significantly lower compared to scenario 1 and scenario 2. Additionally, there are fewer periods when renewable energy generation exceeds total user load in scenario 3. The PSP, ESS, and MT operate similarly in scenario 3 as in scenario 1. The main grid price and the user quotations vary with the renewable energy generation and the total demand load.
These results clearly demonstrate that across various operating scenarios, the proposed energy management system and method ensures a supply–demand balance in the microgrid and prioritizes consuming renewable energy. Under this framework, microgrid participants operate according to energy scheduling principles, and the consumers’ bidding market mechanism is effective.
5.4. Comparison of Supply Layer’s Benefits
In the supply layer, we compared the total benefits obtained from Q-learning, DQN, and PPO (proposed method). To reduce carbon emissions, the total benefits were defined as the income of the PSP and ESS power generation units minus the total cost and penalty for wind and light abandonment. In the training process, the PPO algorithm updated its policy every 10 training episodes (one day’s sample data), Q-learning and DQN updated their value-functions every 10 training episodes. The benefits of the supply layer during training with the three methods are depicted as Figure 15. The training time and convergence results are shown in Table 6.

Figure 15.
Total benefits of the supply layer with different algorithms.
Table 6.
Training time and convergence performance with different algorithms for the supply layer.
As shown in Figure 15, the benefit value on the vertical axis with PPO (blue curve) is always higher than that with DQN (red curve) and Q-learning (pink curve), indicating that the PPO algorithm obtains a better total electricity sales revenue in the supply layer. Combining Figure 15 and Table 6, it is obvious that the convergence step size of for the PPO training is minimal. The single update time of the PPO training is longer than that of Q-learning and DQN, resulting in a longer overall convergence time.
This is due to the fact that the PPO algorithm is a kind of policy-based deep RL approach, requiring a large quantity of environmental interaction data to stably update its policy; moreover, since PPO limits the magnitude of policy updates by introducing the clipped function and performs multiple steps during each policy update to ensure that the new policy does not deviate too far from the old policy, it requires more computing time; moreover, PPO uses more complex neural network structures, requiring simultaneous training of the actor network and critic network, which requires a longer computation time. In contrast, DQN is a kind of value function-based method that evaluates the value of each action by learning a Q-function. Only one Q value update is required at each step, making training relatively simplified; and Q-learning is a Q-table-based RL method that does not need to build a deep network and that has a shorter training time.
Nonetheless, considering that the PPO algorithm has greater reward function benefits, namely, better optimization performance, the increase in training time is acceptable. In addition, all the RL-based methods used in this work adopted the offline training mode and online applications, and the offline training time does not affect the operation of actual microgrid systems.
5.5. Comparison of Demand Layer’s Costs
In the demand layer, multiple agents decide their own power consumption strategy by participating in a market auction. The net cost of each agent is the consumption cost minus the utility function. The MAPPO algorithm was proposed, and the action-guidance-based mechanism was used to reduce the exploration space, thereby accelerating the convergence speed. For comparison, four approaches were used: (1) MADQN; (2) MAPPO; (3) MADQN with AGB; (4) MAPPO with AGB (ultimate algorithm in this paper). In the training process, PPO updated the policy and Q-learning/DQN updated the value function every 10 training episodes. The net costs of th demand layer during the training process with the four algorithms are depicted as Figure 16. The training time and convergence results are shown in Table 7.

Figure 16.
Total net costs of the demand layer with different algorithms.
Table 7.
Training time and convergence performance with different algorithms for the demand layer.
From Figure 16, all consumer agents’ one-day total net costs for electricity purchase with different algorithms are clearly shown, where lower net costs indicate that the PPO obtained better performance on the equilibrium of consumers’ benefits. From Table 7, it can be first seen that the AGB mechanism is effective at improving the convergence speed of the training process. In addition, similar to the results in the previous section, the PPO has a longer overall training time but fewer convergence steps and better operation economy.
6. Conclusions and Discussion
6.1. Conclusions
In this work, a hierarchical three-layer EMS framework and PPO-based strategy optimization approaches were proposed for a microgrid system. The hierarchical EMS comprised a supply layer, demand layer, and scheduling layer. According to the different roles of energy suppliers and consumers, the supply layer used a centralized generation unit commitment model, while the demand layer employed a distributed electricity auction market model; and at the scheduling layer, a non-profit neutral operator was arranged to interact with other layers and manage energy. Moreover, various improved PPO algorithms for the supply layer and demand layer were presented for the strategy optimization. A scenario analysis and method comparisons verified the effectiveness of the proposed scheme. The following conclusions can be drawn:
- The hierarchical EMS framework achieves unified management for the supply layer, decision autonomy for the demand layer, and privacy protection for all users by employing a neutral operator.
- The centralized PPO method used at the supply layer makes full use of renewable energy and increases the economic and environmental benefits for the microgrid.
- In the auction market of the demand layer, the multi-agent PPO method enables consumers to independently generate pricing strategies, ensuring an equilibrium of benefits for all participants.
- The action-guidance-based mechanism embedded in MAPPO accelerates the convergence speed of the training process for multi-agent interactive learning.
6.2. Discussion
The hierarchical multi-layer EMS offers an innovative architecture for managing the complexities and dynamics of a modern microgrid. However, several research points can be further explored in future studies. First, enhancing connections between supply and demand layers is meaningful; for example, demand response management can be incorporated, which would affect the strategies of both supply and demand sides. Second, the hierarchical EMS framework can be integrated with more complicated systems, such as electric vehicles, smart homes, and integrated energy systems. Third, while the PPO algorithm has shown promising results in experiments, its performance is influenced by various factors. Applying this algorithm in practical scenarios requires further optimization of the network structure and training process.
Author Contributions
Conceptualization, X.F. and S.H.; methodology, X.F., P.H. and S.H.; software, P.H. and Y.Z.; validation, P.H. and D.T.; writing—original draft preparation, X.F., P.H. and S.H. All authors have read and agreed to the published version of the manuscript.
Funding
This work was supported by the National Natural Science Foundation of China (62203008), the Natural Science Research Project of Universities in Anhui Province (KJ2021A0012), Opening Foundation of Key Laboratory of Intelligent Computing and Signal Processing (Anhui University), Ministry of Education (2020B002).
Data Availability Statement
http://oasis.caiso.com/mrioasis/logon.do (accessed on 12 November 2023).
Acknowledgments
The authors gratefully acknowledge the National Key Research and Development Program of China.
Conflicts of Interest
The authors declare no conflicts of interest.
References
- Zheng, Z.; Shafique, M.; Luo, X.; Wang, S. A systematic review towards integrative energy management of smart grids and urban energy systems. Renew. Sustain. Energy Rev. 2024, 189, 114023. [Google Scholar] [CrossRef]
- Hsu, C.C.; Jiang, B.H.; Lin, C.C. A survey on recent applications of artificial intelligence and optimization for smart grids in smart manufacturing. Energies 2023, 16, 7660. [Google Scholar] [CrossRef]
- Che, L.; Shahidehpour, M.; Alabdulwahab, A.; Al-Turki, Y. Hierarchical coordination of a community microgrid with ac and dc microgrids. IEEE Trans. Smart Grid 2015, 6, 3042–3051. [Google Scholar] [CrossRef]
- Shuai, Z.; Sun, Y.; Shen, Z.J.; Tian, W.; Tu, C.; Li, Y.; Yin, X. Microgrid stability: Classification and a review. Renew. Sustain. Energy Rev. 2016, 58, 167–179. [Google Scholar] [CrossRef]
- She, B.; Li, F.; Cui, H.; Zhang, J.; Bo, R. Fusion of microgrid control with model-free reinforcement learning: Review and vision. IEEE Trans. Smart Grid 2023, 14, 3232–3245. [Google Scholar] [CrossRef]
- Pannala, S.; Patari, N.; Srivastava, A.K.; Padhy, N.P. Effective control and management scheme for isolated and grid connected dc microgrid. IEEE Trans. Ind. Appl. 2020, 56, 6767–6780. [Google Scholar] [CrossRef]
- Tian, J.; Liu, Z.; Shu, J.; Liu, J.; Tang, J. Base on the ultra-short term power prediction and feed-forward control of energy management for microgrid system applied in industrial park. IET Gener. Transm. Distrib. 2016, 10, 2259–2266. [Google Scholar] [CrossRef]
- Yassim, H.M.; Abdullah, M.N.; Gan, C.K.; Ahmed, A. A review of hierarchical energy management system in networked microgrids for optimal inter-microgrid power exchange. Electr. Power Syst. Res. 2024, 231, 110329. [Google Scholar] [CrossRef]
- Al Sumarmad, K.A.; Sulaiman, N.; Wahab, N.I.A.; Hizam, H. Energy management and voltage control in microgrids using artificial neural networks, pid, and fuzzy logic controllers. Energies 2022, 15, 303. [Google Scholar] [CrossRef]
- Olivares, D.E.; Canizares, C.A.; Kazerani, M. A centralized energy management system for isolated microgrids. IEEE Trans. Smart Grid 2014, 5, 1864–1875. [Google Scholar] [CrossRef]
- Petrollese, M.; Valverde, L.; Cocco, D.; Cau, G.; Guerra, J. Real-time integration of optimal generation scheduling with MPC for the energy management of a renewable hydrogen-based microgrid. Appl. Energy 2016, 166, 96–106. [Google Scholar] [CrossRef]
- Aznavi, S.; Fajri, P.; Sabzehgar, R.; Asrari, A. Optimal management of residential energy storage systems in presence of intermittencies. J. Build. Eng. 2020, 29, 101149. [Google Scholar] [CrossRef]
- Bhattar, C.L.; Chaudhari, M.A. Centralized energy management scheme for grid connected dc microgrid. IEEE Syst. J. 2023, 17, 3741–3751. [Google Scholar] [CrossRef]
- Lee, S.; Kwon, B.; Lee, S. Joint energy management system of electric supply and demand in houses and buildings. IEEE Trans. Power Syst. 2014, 29, 2804–2812. [Google Scholar] [CrossRef]
- Song, B.; Jin, W.; Li, C.; Aroos, K. Economic management and planning based on a probabilistic model in a multi-energy market in the presence of renewable energy sources with a demand-side management program. Energy 2023, 269, 126549. [Google Scholar]
- Yin, H.; Zhao, C.; Ma, C. Decentralized real-Time energy management for a reconfigurable multiple-source energy system. IEEE Trans. Ind. Inform. 2018, 14, 4128–4137. [Google Scholar] [CrossRef]
- Afsari, F.; Jirdehi, M.A. Smart grid optimization considering decentralized power distribution and demand side management. IET Gener. Transm. Distrib. 2024, 18, 1663–1671. [Google Scholar] [CrossRef]
- Wynn, S.L.L.; Boonraksa, T.; Boonraksa, P.; Pinthurat, W.; Marungsri, B. Decentralized energy management system in microgrid considering uncertainty and demand response. Electronics 2023, 12, 237. [Google Scholar] [CrossRef]
- Han, Y.; Yang, H.; Li, Q.; Chen, W.; Zare, F.; Guerrero, J.M. Mode-triggered droop method for the decentralized energy management of an islanded hybrid PV/hydrogen/battery DC microgrid. Electronics 2020, 199, 117441. [Google Scholar] [CrossRef]
- Liu, G.; Jiang, T.; Ollis, T.B.; Zhang, X.; Tomsovic, K. Distributed energy management for community microgrids considering network operational constraints and building thermal dynamics. Appl. Energy 2019, 239, 83–95. [Google Scholar] [CrossRef]
- Babaei, M.A.; Hasanzadeh, S.; Karimi, H. Cooperative energy scheduling of interconnected microgrid system considering renewable energy resources and electric vehicles. Electr. Power Syst. Res. 2024, 229. [Google Scholar] [CrossRef]
- Tabar, V.S.; Jirdehi, M.A.; Hemmati, R. Energy management in microgrid based on the multi objective stochastic programming incorporating portable renewable energy resource as demand response option. Energy 2017, 118, 827–839. [Google Scholar] [CrossRef]
- Comodi, G.; Giantomassi, A.; Severini, M.; Squartini, S.; Ferracuti, F.; Fonti, A.; Cesarini, D.N.; Morodo, M.; Polonara, F. Multi-apartment residential microgrid with electrical and thermal storage devices: Experimental analysis and simulation of energy management strategies. Appl. Energy 2015, 137, 854–866. [Google Scholar] [CrossRef]
- Kassab, F.A.; Celik, B.; Locment, F.; Sechilariu, M.; Liaqua, S.; Hansen, T.M. Optimal sizing and energy management of a microgrid: A joint MILPapproach for minimization of energy cost and carbon emission. Renew. Energy 2024, 224, 120186. [Google Scholar] [CrossRef]
- Shuai, H.; Fang, J.; Ai, X.; Tang, Y.; Wen, J.; He, H. Stochastic optimization of economic dispatch for microgrid based on approximate dynamic programming. IEEE Trans. Smart Grid 2019, 10, 2440–2452. [Google Scholar] [CrossRef]
- Khaloie, H.; Mollahassani-Pour, M.; Anvari-Moghaddam, A. Optimal allocation of distributed generation and energy storage system in microgrids. IEEE Trans. Sustain. Energy 2021, 12, 931–943. [Google Scholar] [CrossRef]
- Velasquez, M.A.; Barreiro-Gomez, J.; Quijano, N.; Cadena, A.I.; Shahidehpour, M. Intra-Hour microgrid economic dispatch based on model predictive control. IEEE Trans. Smart Grid 2020, 11, 1968–1979. [Google Scholar] [CrossRef]
- Elsied, M.; Oukaour, A.; Youssef, T.; Gualous, H.; Mohammed, O. An advanced real time energy management system for microgrids. Energy 2016, 114, 742–752. [Google Scholar] [CrossRef]
- Zhu, Q.; Wang, Q. Real-time energy management controller design for a hybrid excavator using reinforcement learning. J. Zhejiang Univ.-Sci. A 2017, 18, 855–870. [Google Scholar] [CrossRef]
- Arroyo, J.; Manna, C.; Spiessens, F.; Helsen, L. Reinforced model predictive control (RL-MPC) for building energy management. Appl. Energy 2022, 309, 118346. [Google Scholar] [CrossRef]
- Sanaye, S.; Sarrafi, A. A novel energy management method based on Deep Q network algorithm for low operating cost of an integrated hybrid system. Energy Rep. 2021, 7, 2647–2663. [Google Scholar] [CrossRef]
- Fang, X.; Zhao, Q.; Wang, J.; Han, Y.; Li, Y. Multi-agent deep reinforcement learning for distributed energy management and strategy optimization of microgrid market. Sustain. Cities Soc. 2021, 74, 103163. [Google Scholar] [CrossRef]
- Zhang, L.; Gao, Y.; Zhu, H.; Tao, L. Bi-level stochastic real-time pricing model in multi-energy generation system: A reinforcement learning approach. Energy 2022, 239, 121926. [Google Scholar] [CrossRef]
- Liu, D.; Zang, C.; Zeng, P.; Li, W.; Wang, X.; Liu, Y.; Xu, S. Deep reinforcement learning for real-time economic energy management of microgrid system considering uncertainties. Front. Energy Res. 2023, 11, 1163053. [Google Scholar] [CrossRef]
- Zhu, Z.; Hu, Z.; Chan, K.W.; Bu, S.; Zhou, B.; Xia, S. Reinforcement learning in deregulated energy market: A comprehensive review. Appl. Energy 2023, 329, 12–25. [Google Scholar] [CrossRef]
- Mei, P.; Karimi, H.R.; Xie, H.; Chen, F.; Huang, C.; Yang, S. A deep reinforcement learning approach to energy management control with connected information for hybrid electric vehicles. Eng. Appl. Artif. Intell. 2023, 123, 106239. [Google Scholar] [CrossRef]
- Schulman, J.; Wolski, F.; Dhariwal, P.; Radford, A.; Klimov, O. Proximal policy optimization algorithms. arXiv 2017, arXiv:1707.06347. [Google Scholar]
- Honarm, M.; Zakariazadeh, A.; Jadid, S. Integrated scheduling of renewable generation and electric vehicles parking lot in a smart microgrid. Energy Convers. Manag. 2014, 86, 745–755. [Google Scholar] [CrossRef]
- Tichi, S.G.; Ardehali, M.M.; Nazari, M.E. Examination of energy price policies in Iran for optimal configuration of CHP and CCHP systems based on particle swarm optimization algorithm. Energy Plicy 2010, 30, 6240–6250. [Google Scholar] [CrossRef]
- Khaloie, H.; Anvari-Moghaddam, A.; Hatziargyriou, N.; Contreras, J. Risk-constrained self-scheduling of a hybrid power plant considering interval-based intraday demand response exchange market prices. J. Clean. Prod. 2021, 282, 125344. [Google Scholar] [CrossRef]
- Jakob, F.; Gregory, F.; Triantafyllos, A.; Nantas, N.; Shimon, W. Counterfactual multi-agent policy gradients. In Proceedings of the AAAI Conference on Artificial Intelligence, New Orleans, LO, USA, 2–7 February 2018; AAAI Press: Palo Alto, CA, USA, 2017; pp. 2974–2983. [Google Scholar]
- California Independent System Operator Open Access Same-Time Information System. Available online: http://oasis.caiso.com/mrioasis/logon.do (accessed on 12 November 2023).
Disclaimer/Publisher’s Note: The statements, opinions and data contained in all publications are solely those of the individual author(s) and contributor(s) and not of MDPI and/or the editor(s). MDPI and/or the editor(s) disclaim responsibility for any injury to people or property resulting from any ideas, methods, instructions or products referred to in the content. |
© 2024 by the authors. Licensee MDPI, Basel, Switzerland. This article is an open access article distributed under the terms and conditions of the Creative Commons Attribution (CC BY) license (https://creativecommons.org/licenses/by/4.0/).