Abstract
Within microgrids (MGs), the integration of renewable energy resources (RERs), plug-in hybrid electric vehicles (PHEVs), combined heat and power (CHP) systems, demand response (DR) initiatives, and energy storage solutions poses intricate scheduling challenges. Coordinating these diverse components is pivotal for optimizing MG performance. This study presents an innovative stochastic framework to streamline energy management in MGs, covering proton exchange membrane fuel cell–CHP (PEMFC-CHP) units, RERs, PHEVs, and various storage methods. To tackle uncertainties in PHEV and RER models, we employ the robust Monte Carlo Simulation (MCS) technique. Challenges related to hydrogen storage strategies in PEMFC-CHP units are addressed through a customized mixed-integer nonlinear programming (MINLP) approach. The integration of intelligent charging protocols governing PHEV charging dynamics is emphasized. Our primary goal centers on maximizing market profits, serving as the foundation for our optimization endeavors. At the heart of our approach is the Meerkat Optimization Algorithm (MOA), unraveling optimal MG operation amidst the intermittent nature of uncertain parameters. To amplify its exploratory capabilities and expedite global optima discovery, we enhance the MOA algorithm. The revised summary commences by outlining the overall goal and core algorithm, followed by a detailed explanation of optimization points for each MG component. Rigorous validation is executed using a conventional test system across diverse planning horizons. A comprehensive comparative analysis spanning varied scenarios establishes our proposed method as a benchmark against existing alternatives.
1. Introduction
In the contemporary landscape, much of the power system literature delves into multifaceted dimensions, encompassing economics, environmental impact, power quality, energy efficiency, and power loss. The focus primarily centers on distribution networks [1,2,3]. To realize these objectives and usher in enhanced efficiency, the integration of renewable energy resources (RERs), including photovoltaics (PVs), wind turbines (WTs), and distributed generation (DG) technologies like fuel cells (FCs) and microturbines (MTs), becomes imperative [4,5]. The pivotal role of a microgrid (MG), encompassing diverse power sources, comes to fruition as a means of establishing an efficient, resilient, and secure distribution network.
Comprising an assemblage of loads and small-scale power sources, the MG effectively caters to local demand in a meticulously managed manner [6]. The MG emerges as a pivotal force within the dynamic landscape of the liberalized electricity market, owed to its capacity for optimum operation. As the demand surges, the integration DGs coupled with RERs gains remarkable traction, ushering in a potent avenue for electricity and heat generation [7]. In essence, the MG materializes as a network interweaving PVs, WTs, PEMFC-CHPs, and diverse RERs, effectively fulfilling the demand [7]. Positioned as a cornerstone within the power system framework, MGs seamlessly toggle between two operational states: grid-connected and grid-disconnected (islanded) modes [8]. The orchestration of DGs can be meticulously planned to amplify their contribution within MGs [8]. Notably, the behavior of DGs, exemplified by PVs and WTs, exhibits intermittent patterns arising from their reliance on irradiation and wind speed, respectively. This inherent variability renders the scheduling of these resources a formidable challenge. A robust scheduling paradigm must inherently account for these dynamic attributes of RERs, coupled with the unpredictable load profiles [9].
Extensive exploration of RER scheduling is well-documented within the existing literature [10,11,12,13,14,15,16,17,18,19]. Reference [10] delves into the realm of stochastic energy management and scheduling strategies for MGs, which addresses the on-grid scenarios. In a similar case, the investigation undertaken by authors in [11] illuminates the optimum operation of MGs bolstered by Distributed Energy Resources (DERs), encompassing the simultaneous scheduling of active, reactive, and heat power. This methodology ingeniously encourages DERs to actively partake in catering to reactive power needs. The orchestration of MG optimization entails the harmonization of heat and active power generation through combined heat and power (CHP) units, in conjunction with the dynamic interplay of active-reactive generated power via DERs. A distinctive approach surfaces within the discourse of [12], where the modified shuffled from leaping (MSFL) algorithm takes center stage, steering the economic planning of MGs featuring plug-in hybrid electric vehicles (PHEVs). Notably, the bedrock of supply within this narrative rests upon RERs, endowed with emission-free energy generation. An innovative stride is made in [13], where a novel day-ahead optimal scheduling framework gains prominence. This paradigm introduces a top-to-bottom interaction mechanism, orchestrating the optimization of active distribution networks (ADNs). The crux of this scheme lies in the dual endeavor of minimizing distribution network power loss while concurrently optimizing MG performance. Engineers have embraced the utilization of Hydrogen Fueling Stations (HFSs) to convert electricity into hydrogen, fueling Hydrogen Vehicles (HVs) in a symbiotic energy cycle. Notably, MGs assume a pivotal role in HFSs, ensuring a secure and uninterrupted energy supply [14]. A pioneering approach intertwining stochastic and robust optimization emerges within a bid strategy tailored for MGs actively participating in day-ahead electricity markets [15]. The deployment of FCs to serve CHP units is a hallmark of this study. However, the study overlooks the pivotal influence of hydrogen storage on FC operation. Exploration expands in [16] to encompass the coordinated fulfillment of MG demands through integrated power, cooling, and heating systems, navigated via a two-step scheduling scheme. The economic implications of a grid-connected MG housing PVs and Energy Storage Systems (ESSs) are meticulously scrutinized in [17]. Introducing a planning model, this study aims to maximize MG net profit within the operational horizon. In tandem, [18] proposes a decision-making model, furnishing a mathematical framework for optimal bidding within the day-ahead electricity market. Intriguingly, this model extends its purview to include risk management within a low-voltage grid-connected residential MG context. Reference [19] unveils a cutting-edge exploration into the optimum stochastic scheduling of an MG amalgamating CHP-PEMFCs, WTs, PVs, and hydrogen storage, all strategically orchestrated to elevate system reliability. Notably, the paper undertakes a comprehensive modeling of the MG, intricately deciphering the optimum coordination of diverse power generation sources while diligently accounting for the inherent uncertainty stemming from RERs. Reference [20] addresses the critical challenge of optimal coordination and scheduling within micro energy grids that incorporate intermittent RERs. The authors recognize the rising integration of RERs, such as solar and wind, into micro energy grids as a means to enhance sustainability and reduce reliance on fossil fuels. However, the intermittent nature of these sources poses significant operational and stability challenges for grid management. Reference [21] delves into the intricate optimization challenges associated with CHP-MGs, considering the integration of various Energy Storage Systems, renewable resources, and hydrogen storage while accounting for the presence of PHEVs and their charging demands. CHP-MGs are becoming increasingly relevant because of their potential to enhance energy efficiency and facilitate the integration of DERs. In [22], a novel model for fractured underground gas storage (UGS) is presented, optimizing stability and efficiency. The integrated approach addresses depleted oil/gas reservoir challenges, determining maximum gas storage capacity and analyzing wellbore and reservoir conditions. In reference [23], a covering liquid method is explored for enhancing the self-preservation effect in methane storage. Experiments show a significant reduction in CH4 hydrate decomposition with various covering liquids, particularly below the freezing point of water.
Despite the extensive exploration of MG optimization techniques, RER integration, and various optimization algorithms, there appears to be a lack of emphasis on the integration and optimization of hydrogen storage systems within MGs. The text mentions the deployment of FCs as CHP units and their integration into MGs, but it overlooks the significant influence of hydrogen storage on FC operation and overall MG performance. Given the growing importance of hydrogen as an energy carrier and storage solution, this gap represents an opportunity for further research. Future studies could investigate the integration of hydrogen storage systems within MGs, exploring their potential benefits in terms of system resilience, energy management, and overall efficiency. This could involve optimizing the operation of hydrogen storage systems alongside other energy sources, considering factors such as hydrogen production, storage capacity, and utilization strategies. By addressing this study gap, researchers could contribute to a more comprehensive understanding of how hydrogen storage can enhance MG operation and facilitate the effective integration of RERs and other distributed energy technologies. This would also align with the broader trend toward sustainable and resilient energy systems.
The main motivation of the study is to address the intricate challenges posed by the rapid integration of diverse components such as RERs, PHEVs, CHP systems, demand response (DR) program, and energy storage units within MGs. The central focus is on optimizing the orchestration of these complex elements to achieve peak performance in MG operation. This study introduces an innovative stochastic framework to streamline energy management within MGs, encompassing various technologies including proton exchange membrane fuel cell-CHP (PEMFC-CHP) units, RERs, PHEVs, and diverse storage solutions. The study aims to tackle the uncertainties inherent in PHEV and RER models by employing the robustness of the Monte Carlo Simulation (MCS) technique. The intricacies surrounding hydrogen storage strategies in PEMFC-CHP units are resolved through a custom-tailored mixed-integer nonlinear programming (MINLP) approach. Furthermore, the integration of intelligent charging protocols governs PHEV charging dynamics. The overarching objective revolves around maximizing market profits, serving as the foundational basis for the optimization endeavor. At the core of this pursuit lies the deployment of the Meerkat optimization algorithm (MOA), which uncovers the optimal operation of MGs amidst the intermittent nature of uncertain parameters. The study enhances the MOA algorithm to amplify its capacity for exploration and the identification of global optima. Rigorous validation across diverse planning horizons is conducted using a conventional test system. Through a comprehensive comparative analysis spanning various scenarios and conditions, the proposed method is established as a benchmark against existing alternatives, underscoring its potential to revolutionize MG energy management.
The innovation and main ideas of this paper revolve around the optimization of MG operation by addressing the complexities introduced by the rapid integration of various RERs, PHEVs, CHP systems, and energy storage solutions. The study pioneers a novel stochastic framework that effectively manages energy within MGs, optimizing their performance and efficiency. The following key innovations and main ideas are detailed within the text:
- Comprehensive Energy Management: The paper aims to optimize the operation of MGs by efficiently managing the interplay between various components, including PEMFC-CHP units, DR, RERs, PHEVs, and different storage technologies. This comprehensive approach encompasses a wide array of MG elements to achieve optimal performance.
- Uncertainty Handling: Acknowledging the uncertainties inherent in PHEV and RER models, the paper employs the robust MCS technique. This ensures that the optimization framework can account for the variability and unpredictability of these models, enhancing the accuracy and reliability of the resulting MG operation.
- Hydrogen Storage Strategies: The study addresses the intricate challenges posed by hydrogen storage strategies within PEMFC-CHP units through a custom-tailored MINLP approach. This innovation ensures that the optimization process accounts for the complexities of hydrogen storage, contributing to more effective MG operation.
- Intelligent Charging Protocols: The integration of intelligent charging protocols for PHEVs is seamlessly incorporated into the optimization framework. This inclusion allows for the optimization of PHEV charging dynamics, further enhancing the overall efficiency of MG operation.
- The study introduces the MOA as a key tool for analyzing and optimizing MG operation. MOA is specifically designed to handle the intermittent nature of uncertain parameters, ensuring the robust and effective exploration of optimal solutions.
- Algorithmic Refinements: The paper goes beyond the introduction of MOA and enhances its search capabilities to expedite the discovery of global optima. These algorithmic refinements bolster the efficiency and efficacy of the optimization process.
In summary, the paper’s innovation lies in its development of a sophisticated stochastic framework that optimizes MG operation by addressing the intricate challenges introduced by the integration of diverse energy sources and storage technologies. The study’s focus on uncertainty handling, hydrogen storage, intelligent charging, profit maximization, and the deployment of the MOA collectively contributes to a holistic and practical approach for enhancing MG performance and efficiency.
The second part introduces the suggested optimization framework. The third section delineates the proposed problem-solving algorithm. Subsequently, the fourth part delves into the analysis of simulation outcomes and comparisons. Finally, the concluding section encapsulates insights, along with recommendations for prospective endeavors.
2. Proposed Method
The objective Function (1) is designed to address the dual objectives of profit maximization and the assurance of energy resource availability, considering reliability factors. The first term aims to maximize profit by subtracting the total cost from the revenue generated. Operational costs include those associated with generators, storage units, and the grid, while revenue is obtained from tariff charges and power sales. The second term ensures energy resource availability with a reliability consideration. The availability of generated power from generators and storage units, considering the reliability factor and penalizing deviations in unit voltage levels from the previous time step. The availability of power from the grid incorporates the product of grid power and the corresponding availability factor. The third term imposes a penalty for generators falling below a predefined reliability threshold. The penalty is proportional to the deviation of the generator’s reliability from the established threshold. This objective function provides a comprehensive framework for optimizing MG operations, balancing economic considerations with the reliability of energy resources. The weighting factors offer flexibility in prioritizing objectives based on specific system requirements or goals. Equation (2) illustrates the constraint of power balance in the MG. In (3) the limitation of the use of power generation resources in the MG is demonstrated. Limitation (4) displays the limit of operation and purchase of power from the upstream grid. Equation (5) shows the energy level in the battery. Equation (6) illustrates the limitation of battery capacity. Relations (7) and (8) demonstrate the limit of charging and discharging power, respectively. Equation (9) guarantees that there is no load shedding after the execution of the DR program (DRP) in the MG. Equation (10) shows the load changes in the DRP at any time, which should be between percent. Equation (11) demonstrates the capacity for the simultaneous production of electricity and thermal energy for an FC. Also, the inequalities (12) and (13) are the considered limits for hydrogen and power used in PEMFC, respectively. Equations (14) and (15) are used to compute the efficiency and the ratio between electricity and heat, which both depend on the Part Load Ratio (PLR). Equations (16) and (17) illustrate the interdependence between heat power generation and electrical power generation. These equations provide insight into how changes in one form of power generation can impact the other, shedding light on the intricate relationship between the two processes.
In this context, the MCS strategy has been integrated to model and address the inherent uncertainties. By incorporating the MCS approach, the complex and uncertain nature of the system is effectively captured, allowing for a comprehensive exploration of possible outcomes and a more robust analysis of the situation at hand. The commencement time of PHEV charging is indicated in Equation (18). This equation provides insight into the specific parameter governing when the charging process for PHEVs begins, offering a fundamental aspect in understanding the dynamics of the charging infrastructure.
This study employs Monte Carlo simulation to estimate both the PV power and the aggregate charging load of electric vehicles (EVs) [24,25]. The charging load profile for each individual EV is derived based on the commencement time and travel distance of the vehicle. Subsequently, the overall charging load profile is synthesized by overlaying the load profiles of all participating electric vehicles. A visual representation of the charging load calculation process is illustrated in Figure 1, depicted in the accompanying flowchart.
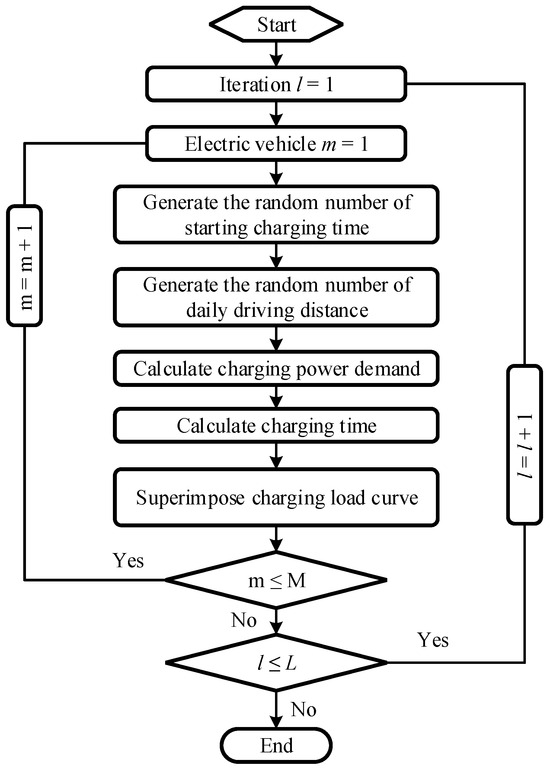
Figure 1.
Diagram for calculating the charging load of electric vehicles.
The initiation of the charging process can be elegantly represented through Equation (19). This equation serves as a modeling framework that captures the intricate mechanics and factors influencing the startup phase of the charging operation, contributing to a more comprehensive comprehension of this essential aspect within the context being examined. The concept of Equivalent State of Charge (SOC) serves as a pivotal criterion for assessing battery performance. It is specified as the ratio of stored energy within the battery to its total volume, as expounded in Equation (20). This equation provides a mathematical representation that enables a quantitative evaluation of the battery’s SOC, thereby facilitating a deeper understanding of its energy storage capabilities. The distance covered by a vehicle in miles is represented through a model employing a normal logarithmic Probability Density Function (PDF), elucidated in Equation (21). This equation offers a structured framework for understanding the distribution of distances traveled, incorporating the probabilistic aspects that underlie the vehicle’s journey patterns. Equation (22) quantifies the comprehensive availability of resources, encompassing all contributing factors. Meanwhile, Equations (23) through (25) delineate the distinct parameters characterizing the availability, failure, and repair rates of these resources. Collectively, these equations provide a comprehensive framework for evaluating and managing the operational dynamics and reliability of the resources within the system.
3. Meerkat Optimization Algorithm
3.1. Inspiration
The meerkat, a small mammal with a distinct brown striped coat, inhabits deserts and varied terrains. As a diurnal species, it has a slender physique with a supportive tail for an upright stance. Notably, dark spots around its eyes function like sunglasses, enabling clear vision in intense sunlight. This adaptation aids in countering aerial predators exploiting sun glare. Leveraging these behavioral patterns, we introduce the Meerkat Optimization Algorithm (MOA), with the subsequent mathematical framework explaining its essence.
3.2. Establishment of Initial Populations
Meerkats inherently thrive within a collective, exhibiting a herd-based disposition. Correspondingly, the initial population denoted as in the MOA is initiated through the utilization of Equation (27). This equation orchestrates the creation of the initial population by harnessing a normal distribution that spans among the upper boundary () and the lower boundary (). In this manner, the population distribution within the search space mirrors the spatial arrangement observed among meerkat communities.
In this context, the symbol pertains to the existing candidate solution, encapsulating the essence of the current iteration. denotes the aggregate count of individuals within the population, while signifies the dimensionality of the problem at hand. Collectively, these variables converge to form a pivotal foundation for comprehending and formulating the MOA.
In this context, the term signifies a random number that adheres to a normal distribution, encompassing inherent variability. This distribution is characterized by a default standard deviation of 0.3, which intricately governs the extent of dispersion and diversity exhibited by these random values. Such stochastic elements play a pivotal role in shaping the dynamics and unpredictability embedded within the MOA.
3.3. Hunting Activities and Vigilance
Initially, meerkats make behavioral decisions grounded in the presence or absence of potential threats, namely predators and alarms. In conditions deemed secure, characterized by a randomized value (rand) falling below the predetermined threshold of sentry (default set at 0.3), individual meerkats embark on activities such as hunting or foraging for sustenance. These activities manifest with equal likelihood, facilitating a balanced exploration of the environment. This collective effort unfolds in distinct forms, each tailored to facilitate a comprehensive global search for resources.
When (representing a parameter) is less than , meerkats adopt a strategy of outward diffusion during their search, beginning from their initial position, which is referred to as Direct. During this phase, their primary focus encompasses foraging for food resources and vigilant observation of potential natural adversaries. By default, is assigned a value of 0.5, thus ensuring a harmonious equilibrium between these two distinctive behavioral modes. The parameter denotes the step size, a dynamic variable that decreases as the number of iterations advances. This step size, intimately intertwined with the algorithm’s progression, exerts a pivotal influence during both the expansive global search phase and the eventual convergence, thereby significantly shaping the trajectory of the algorithm’s exploratory and convergent behavior.
In an alternative scenario, a meerkat engages in a search that involves chance encounters with fellow companions. During this process, the meerkat identifies and approaches other individuals for the purpose of coordinated hunting. In this context, represents a meerkat that is randomly chosen from the population, distinct from the meerkat itself. This collaborative endeavor underscores the social dynamics within the meerkat group, highlighting how cooperative interactions play a role in their pursuit of sustenance.
3.4. Flee or Fight against the Enemy
When the value of exceeds a certain threshold denoted as , meerkats respond to critical emergencies. In such circumstances, these vigilant creatures assume the role of scouts, diligently surveying the surroundings for potential natural predators or impending disasters. Upon identifying imminent threats, meerkats take proactive measures, initiating warnings to their fellow individuals. These warnings serve as prompts for individual meerkats to swiftly make decisions, choosing either to seek refuge from the danger or to bravely confront the threat by engaging in defensive actions.
During critical emergencies, a specific fitness function, denoted as , is evaluated for each meerkat. If this fitness function yields a value lower than another fitness function, , it signifies a superior fitness level for the meerkats to collectively gravitate toward a designated leader. This leader’s position can also be termed as the historical global optimal position, embodying a reference point of exceptional significance. In response, individual meerkats adjust their positions, aligning themselves in the direction of this leader, as outlined in Equation (33). This strategic movement is analogous to meerkats adopting the guise of a larger, more formidable animal to deter potential intruders and adversaries, effectively leveraging the psychology of intimidation to safeguard their collective security.
Conversely, if the evaluation of the fitness function, , yields a value greater than or equal to another fitness function, , it signifies a diminished suitability for meerkats to align with the leader. This scenario implies that meerkats perceive a low fitness compatibility with the leader’s direction. This situation is particularly relevant when meerkats encounter obstacles or adversaries that obstruct their path, or when they encounter adversaries of overwhelming strength. In response, meerkats exhibit a survival-oriented behavior, fleeing in the direction opposite to the leader, seeking refuge and protection, as detailed in Equation (35). The parameter div, featured in Equation (32), introduces a random bias that serves to broaden the search range of individual meerkats. This element enhances exploration and adaptability within the search space. Notably, the update to the leader direction is undertaken without the inclusion of the parameter div, a design choice aimed at facilitating a more expedited convergence process.
3.5. Random Direction Exploration
To optimize their food acquisition, the meerkat collective incorporates an element of chance by occasionally embarking on exploratory journeys in random directions during each iteration. This deliberate randomness serves as a strategic mechanism, aiding in the escape from potential local optima, which could otherwise hinder the discovery of superior food resources. By introducing these occasional random explorations, the meerkat group enhances its capacity to venture beyond immediate confines, increasing the likelihood of uncovering more favorable and abundant sources of sustenance.
In Equation (36), the symbol denotes the flight step as described by the levy distribution. The specific formula for calculating is given by , where is set to 3/2. Here, u and v represent normally distributed random numbers, each characterized by standard deviations and , respectively. The values of and are determined by the following formulas:
In essence, this intricate mathematical formulation, rooted in the levy distribution, governs the flight step taken by the system, incorporating random elements to introduce a degree of stochasticity while adhering to the defined distributions and parameters.
3.6. Death and Rebirth
When an individual surpasses the established boundary, it is deemed to have reached an unviable state and is consequently marked as deceased and removed from consideration. To sustain the designated population size, a mechanism is implemented wherein new individuals are regenerated utilizing Equation (39). This approach ensures that the population remains consistent and representative, counteracting the loss of individuals that breach the boundary by replacing them with newly generated candidates. The implementation of this regenerative process contributes to the robustness and persistence of the population within the context of the broader algorithmic framework.
The validation, satisfaction, and empirical validation of the proposed algorithm across various mathematical functions are comprehensively detailed in reference [26]. This source provides a comprehensive account of how the algorithm’s performance was rigorously assessed, its effectiveness in meeting specified criteria, and its empirical substantiation through experimentation on a diverse set of mathematical functions. The findings presented in reference [26] serve to affirm the algorithm’s viability and its ability to fulfill the intended objectives across a range of scenarios and mathematical contexts.
In our proposed modeling approach, the entire optimization process is exclusively executed using the Meerkat Optimization Algorithm (MOA). This algorithm serves as the sole optimization engine for the MG system, addressing multiple objectives and constraints simultaneously. The framework involves a structured procedure to harness the capabilities of MOA for comprehensive MG management:
- The optimization process commences with the initialization of MG parameters. The multi-objective optimization problem is decomposed into sub-problems, each corresponding to specific facets of the MG operation targeted by MOA. For instance, MOA is adept at maximizing market profits, ensuring reliability, and optimizing various energy resources.
- MOA operates iteratively, dynamically exploring the vast solution space to discover configurations that optimize objectives. Its unique exploration–exploitation balance allows it to effectively navigate uncertainties and complexities inherent in MG management. MOA’s contributions extend to optimizing generator and storage unit reliability, intelligent charging protocols for electric vehicles, and addressing hydrogen storage challenges in FC systems.
- The integration framework includes mechanisms for adaptive adjustments within MOA, allowing the algorithm to dynamically adapt its strategies based on the evolving solution landscape. This adaptability ensures robustness in optimizing the MG under changing conditions and requirements.
- The solutions obtained through MOA are harmonized to form a comprehensive solution set that optimally balances conflicting objectives. This process ensures that each solution contributes positively to the overall performance of the MG.
- By detailing the optimization process exclusively driven by MOA, we aim to provide a clear understanding of how this algorithm autonomously and comprehensively addresses the objectives of MG management. The integration strategy leverages MOA’s strengths, creating a holistic approach that maximizes the synergies between various facets of MG operation, all achieved through the proposed algorithm.
4. Numerical Results
In this pivotal section, we embark on a comprehensive exploration of the simulation results obtained from our MG analysis. Also, MATLAB software package 2019b has been used to consider the suggested method and compare with other algorithms. The intricate structure of the MG, as illustrated in Figure 2, unveils a sophisticated network integrating diverse distributed energy production sources. Among these sources are PV panels, a WT, an MT, energy storage batteries, and a proton exchange membrane fuel cell–combined heat and power system (PEMFC-CHP). The visual representation in Figure 2 provides a holistic view of the MG’s complexity, elucidating its various components and their interconnectedness. The temporal scope of our analysis spans a complete 24-h cycle, allowing us to capture the dynamics and fluctuations in energy production and consumption throughout a day. This duration ensures a thorough examination of the MG’s performance under diverse conditions, facilitating a nuanced understanding of its operational intricacies. To maintain consistency and facilitate contextual comparison with prior works, the MG data and resource information conform to the specifications outlined in reference [21]. This alignment ensures that our findings are situated within the broader context of related research, establishing a basis for comparative analysis. To bolster the credibility and robustness of our findings, an exhaustive series of 20 simulations were meticulously executed. This rigorous validation process serves to verify the accuracy and reliability of our results. Each simulation was conducted with precision, considering various parameters and scenarios to comprehensively assess the MG’s behavior. This multiplicity of simulations enhances the statistical significance of our findings, fortifying the validity of the conclusions drawn from the analysis. The culmination of our efforts is encapsulated in the bold results derived from these 20 simulations. Through this extensive process, we have not only scrutinized the MG’s performance but also established a solid foundation for our conclusions. The robustness of our findings is underscored by the meticulous validation steps undertaken, ensuring that our analysis withstands scrutiny and stands as a reliable contribution to the field.
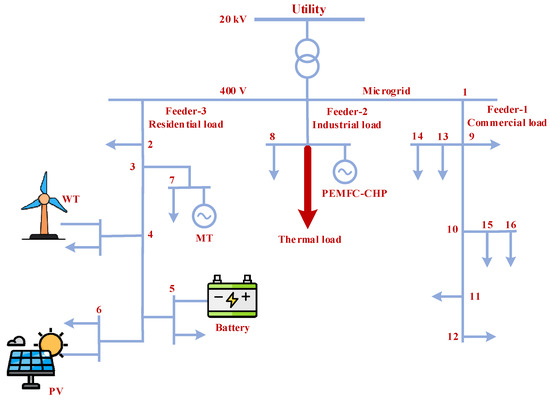
Figure 2.
Proposed MG.
The tabulated outcomes in Table 1 unfold a detailed chronicle of the optimal MG operation over a 24-h period, shedding light on the dynamic interplay of diverse energy sources and storage components throughout the day. This comprehensive dataset meticulously captures the nuanced performance of each element within the MG, offering valuable insights into its operational intricacies. The initial hour serves as a microcosm of the MG’s adaptive nature. The PV system exhibits dormancy, contributing no power, while the WT takes the lead with a commendable 40 kW generation. Simultaneously, the PEMFC-CHP system and the MT contribute 16 kW and 40 kW, respectively. Noteworthy is the charging of the battery with 9.1 kilowatt hours, coupled with the utilization of 4.1 kW from the hydrogen storage facility, which draws from the initial stored energy of 10 kilowatts. Advancing to the 10th hour, a noticeable evolution in energy production unfolds. The PV system now comes to life, generating 46 kW, complemented by the WT injecting 47.5 kW into the MG. The PEMFC-CHP system steps up, supplying 52.6 kW, while the MT’s output surges to 86 kW. Significantly, the battery reciprocates, delivering 33 kW back into the network. This detailed temporal breakdown unveils the dynamic nature of the MG, highlighting the adaptability of its energy sources and storage elements. The intricacies encapsulated in Table 1 exemplify an optimal MG energy management strategy that thrives on dynamism and adaptability. It skillfully harnesses renewable sources, showcasing a seamless integration of the PV system, WT, PEMFC-CHP, and MT. Notably, the efficient management of energy storage is apparent through the strategic charging and discharging of the battery, coupled with the judicious utilization of the hydrogen storage facility. In summary, the tabulated results underscore the operational excellence of the MG’s energy management strategy. The bold values in Table 1 signify the tangible impact of intelligent decision-making on the MG’s overall performance. This dynamic and adaptive system not only maximizes the utilization of renewable sources but also optimizes energy storage, contributing to sustained reliability and sustainability. The time-specific values unravel the temporal dynamics of the MG, emphasizing the pivotal role of intelligent energy management in fostering a resilient and efficient energy ecosystem.

Table 1.
Optimal MG energy management.
In Table 2, we present a meticulous examination of the outcomes obtained from our proposed scheme against those of various references, particularly focusing on methodologies outlined in [21]. This comparative analysis involves benchmarking our approach against a spectrum of optimization algorithms, including Genetic Algorithm (GA), Teaching–Learning-Based Optimization (TLBO), Particle Swarm Optimization (PSO), Differential Evolution (DE), and modified adaptive differential evolution (MADE). To facilitate a comprehensive comparison, a diverse array of optimization algorithms has been considered. The inclusion of GA, TLBO, PSO, DE, and MADE ensures a thorough evaluation across different optimization paradigms. Each algorithm brings its unique set of principles and strategies to the table, allowing for a holistic assessment of their performance. Upon scrutiny of the data outlined in Table 2, a conspicuous pattern emerges, illustrating the clear preponderance of our suggested scheme over the other established algorithms. This superiority is discernible not only in terms of the objective function’s amount but also in the efficiency of problem-solving duration. Specifically, the proposed method showcases an optimal solution with an impressive value of EUR 37.11. This marks a noteworthy 7.5% enhancement compared to the GA method, a substantial 7.2% improvement over the PSO method, a commendable 7% advancement relative to the TLBO method, a significant 5.6% refinement compared to the DE method, and, finally, a substantial 4.6% enhancement over the MADE method. These results collectively underscore the remarkable capacity of our proposed algorithm to attain optimal solutions when juxtaposed with existing approaches. The higher performance across multiple metrics, encompassing both objective function values and problem-solving efficiency, demonstrates the potential for more efficient and effective solution finding within complex optimization problems. In essence, the bold values in Table 2 solidify the competitive edge of our proposed method in achieving optimal outcomes. The discernible superiority across a spectrum of optimization algorithms not only validates the robustness of our approach but also implies its potential applicability in addressing a wide range of complex optimization challenges. The bold results presented here thus contribute to advancing the state-of-the-art in optimization methodologies, paving the way for more effective problem-solving in diverse domains.
Table 2.
The proficiency comparison of the proposed algorithm and other algorithms.
A compelling insight drawn from the wealth of data in Table 2 revolves around the notably shorter average solution time associated with our proposed method, setting it apart from other established methodologies. In essence, the efficiency of the proposed approach is vividly showcased as it emerges 53%, 52%, 50%, 42%, and 33% faster than the Genetic Algorithm (GA), Particle Swarm Optimization (PSO), Teaching–Learning-Based Optimization (TLBO), Differential Evolution (DE), and modified adaptive differential evolution (MADE) methods, respectively. To put these efficiency gains into bold perspective, consider that the proposed method achieves an impressive 53% reduction in solution time compared to the GA method, a substantial 52% acceleration over the PSO method, a significant 50% improvement relative to the TLBO method, a commendable 42% advancement compared to the DE method, and finally, a notable 33% enhancement over the MADE method. These bold metrics underscore the rapid problem-solving capacity intrinsic to the proposed method, signifying its efficiency as a paramount strength. The accelerated problem-solving capacity holds substantial significance, particularly in the context of larger and more complex MG scenarios. The proposed method’s efficiency positions it as an optimal choice for applications that demand swift optimization in settings with intricate configurations and diverse parameters. The bold efficiency gains pave the way for the proposed approach to excel in scenarios where time-sensitive decision-making is imperative, ensuring that it remains versatile and adaptive across a spectrum of MG applications. In summary, the proposed model for MG optimization establishes itself as a standout solution, primarily due to its superior performance and efficiency in comparison to existing methods. The bold improvement in objective function values and the remarkable acceleration in solution times reinforce its robustness and effectiveness. These compelling attributes position the proposed method as a formidable choice for optimizing operations within various MG settings, especially those characterized by larger scales and intricate configurations. The bold outcomes underscore its potential to revolutionize the landscape of MG optimization, offering a reliable and swift solution to the evolving challenges in the realm of sustainable energy systems.
In Figure 3, a visual narrative unfolds, showcasing the distinct contrast between the load variation induced by the Demand Response Program (DRP) and the initial load profile of the MG. The dynamic representation involves the blue curve, symbolizing the altered load under the influence of the DRP, juxtaposed with the orange curve, which corresponds to the original load profile of the MG. The most striking observation lies in the discernible reduction in the peak load, descending from 262 kW to 250 kW. This significant decline serves as a visual testament to the tangible influence wielded by the DRP on the intricate load dynamics of the MG. To augment the clarity of this transformative visual, it is imperative to delve into the concept of a Demand Response Program (DRP) and unravel its overarching significance. DRPs are strategic initiatives aimed at dynamically adjusting energy consumption patterns in direct response to supply constraints or market conditions. The primary goal is to optimize energy usage efficiently, particularly during peak demand periods, thereby contributing to enhanced grid stability and substantial cost savings. In the specific context of Figure 3, a deeper exploration of how the DRP facilitated this load reduction can illuminate the intricacies of its mechanisms. DRPs typically involve a series of proactive measures such as load shifting, curtailing noncritical loads, and optimizing energy storage utilization. By strategically redistributing energy consumption in response to real-time conditions, the DRP successfully mitigates peak load demands, as evidenced by the evident reduction from 262 kW to 250 kW. This pronounced reduction in peak load carries far-reaching implications for the overall efficiency and resilience of the MG. By effectively managing and curtailing peak loads, the DRP not only contributes to immediate energy cost savings but also fortifies the MG against potential disruptions. The enhanced efficiency ensures optimal utilization of resources, and the heightened resilience positions the MG to navigate fluctuations in demand and supply with increased agility. The bold numerical representation of the peak load reduction, from 262 kW to 250 kW, serves as a quantitative reinforcement of the DRP’s impact. This reduction not only signifies a direct response to immediate demand constraints but also hints at the broader implications for sustainable energy management. The visual evidence encapsulated in Figure 3, coupled with a nuanced understanding of DRP mechanisms, paints a comprehensive picture of how these programs significantly contribute to the efficiency and resilience of MGs. In conclusion, Figure 3 stands as a visual testament to the transformative power of Demand Response Programs in shaping MG operations. The vivid reduction in peak load, accompanied by a detailed exploration of DRP mechanisms, illuminates the strategic role these programs play in optimizing energy use, ensuring grid stability, and fortifying the MG against operational challenges. The bold results underscore the real-world impact of DRPs, offering a valuable insight into their potential to revolutionize the landscape of sustainable energy systems.
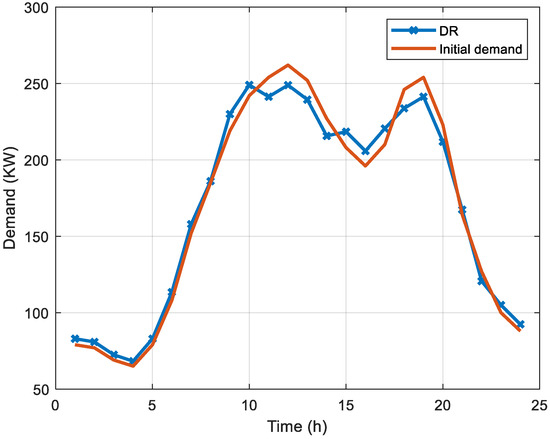
Figure 3.
Comparison of the changed load with the initial load of the MG.
In Figure 4, a visual journey unfolds, elucidating the intricate charging and discharging patterns of the MG’s battery across a 24-h timeframe. The graph employs a dual-axis representation, where the negative y-axis graph delineates battery charging events, while the positive y-axis graph mirrors battery discharging occurrences. To deepen comprehension, it is pivotal to delve into the nuanced significance of these charging and discharging patterns, providing readers with a holistic understanding of the battery’s pivotal role in load balancing, energy storage, and overall MG optimization. To provide a more comprehensive understanding, let us unravel the layers of significance encapsulated in the charging and discharging patterns of the MG’s battery. Charging events, graphically represented along the negative y-axis, typically occur during periods of low energy demand or when there is an excess of RER production. This strategic charging aligns with the broader goal of harnessing surplus energy during favorable conditions, ensuring optimal utilization and storage for future use. Conversely, discharging events, portrayed along the positive y-axis, unfold during peak energy demand periods or when the availability of RERs is relatively low. The discharge process involves releasing stored energy back into the MG, acting as a crucial mechanism for load balancing and addressing energy demands during high-consumption phases. This dynamic interplay between charging and discharging is instrumental in maintaining grid stability, optimizing energy consumption, and ensuring the MG’s resilience in the face of fluctuating energy scenarios. To amplify reader appreciation, it is essential to contextualize these charging and discharging patterns within specific scenarios. For instance, detailing how the battery strategically charges during periods of low demand or abundant RER production reinforces its role as an energy buffer, capturing surplus energy when it is abundant. On the flip side, elucidating the discharge process during peak demand or low RER availability underscores the battery’s crucial function in meeting immediate energy requirements and averting grid strain. In a broader context, effective battery management transcends the mere ebb and flow of charging and discharging patterns. It directly contributes to a spectrum of benefits that enhance MG performance. Boldly, these benefits include:
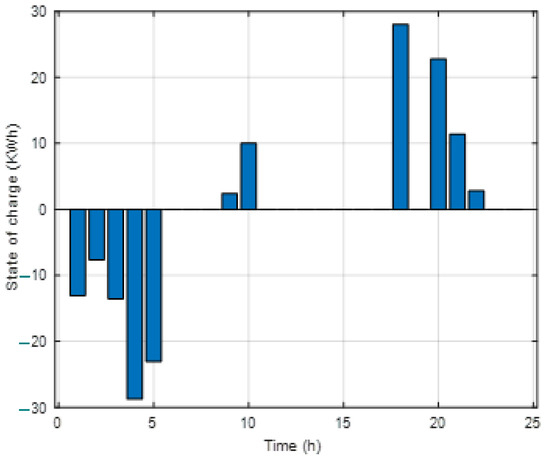
Figure 4.
State of battery charging and discharging.
- Grid Stability Enhancement: By judiciously managing the battery’s charge and discharge cycles, the MG contributes to grid stability, mitigating fluctuations, and ensuring a consistent and reliable energy supply.
- Energy Cost Reduction: Optimized battery usage aids in reducing energy costs by strategically drawing from stored energy during peak demand, minimizing the reliance on costlier energy sources.
- Maximized Utilization of RERs: The battery’s role in capturing excess energy during periods of high RER production ensures the maximal utilization of renewable resources, aligning with sustainability goals and minimizing reliance on conventional energy sources.
Figure 4’s graphical representation becomes even more impactful when coupled with an appreciation of these nuanced charging and discharging dynamics. The bold takeaway is the visualization of the MG’s efficient energy management, exemplified by the strategic interplay of the battery in balancing loads, storing energy, and optimizing the overall performance of the MG. In summary, Figure 4 serves as a visual portal into the heart of the MG’s energy dynamics, showcasing the instrumental role played by the battery in charging and discharging processes. The contextualized understanding of these patterns, coupled with the bold benefits of effective battery management, solidifies the battery’s crucial role in optimizing MG operations. This nuanced exploration invites readers to appreciate not only the visual representation, but also the strategic foresight embedded in the MG’s energy storage and utilization mechanisms.
In Figure 5, a visual narrative unfolds, presenting the optimal power output profiles of the MT and proton exchange membrane fuel cell (PEMFC) over the course of a 24-h timeframe. A distinctive feature of these energy sources is their heightened power production during peak demand hours, as vividly illustrated in the graph. To enrich the understanding of this visual representation, let us delve into the intricacies of why MTs and PEMFCs exhibit increased power production during peak hours. Unveiling the rapid response capabilities of these sources, their role in load balancing, and the correlation between their optimal power profiles and the broader energy supply and demand dynamics within the MG will provide readers with a more profound insight into the implications of Figure 5. The distinctive surge in power production by MTs and PEMFCs during peak demand hours is not coincidental but rather a strategic response embedded in their operational characteristics. MTs and PEMFCs are endowed with rapid start-up times and load-following capabilities, making them particularly adept at swiftly adapting to shifts in energy demand. Delving into the reasons behind this heightened production during peak hours involves understanding their capacity to respond promptly to increased electricity consumption. The nimbleness of MTs and PEMFCs in responding to fluctuations in demand positions them as key players in the MG’s energy management strategy, especially during periods of heightened consumption. Unlike some energy sources that may require extended start-up times, MTs and PEMFCs can swiftly adjust their power output to match the dynamic nature of peak demand, ensuring a seamless response to the MG’s energy requirements. A crucial aspect to explore is how MTs and PEMFCs actively contribute to load balancing during peak hours. Their ability to ramp up power production aligns with the imperative of matching supply with demand in real-time. By injecting increased power into the grid precisely when it is most needed, these sources play a pivotal role in maintaining equilibrium, preventing potential grid strain, and ensuring a steady and reliable energy supply during periods of elevated consumption. To render Figure 5 even more insightful, it is imperative to correlate the optimal power profiles of MTs and PEMFCs with the broader energy supply and demand dynamics within the MG. Understanding how these profiles synchronize with the MG’s overall operational requirements offers readers a more comprehensive view of the figure’s implications. The bold outcome depicted in Figure 5, showcasing the elevated power production by MTs and PEMFCs during peak demand, underscores the strategic energy management within the MG. The rapid response capabilities of these sources, coupled with their role in load balancing, contribute to the overall resilience and efficiency of the MG during periods of dynamic energy demand. In conclusion, Figure 5 serves as a visual testament to the pivotal role played by MTs and PEMFCs in shaping the MG’s energy landscape. The optimal power output profiles, characterized by heightened production during peak demand, highlight the strategic significance of these sources. Their rapid response capabilities and contribution to load balancing underscore their status as cornerstones in the MG’s energy strategy. This nuanced exploration invites readers to appreciate not only the visual representation but also the dynamic orchestration of energy sources within the MG, ensuring a resilient and responsive energy ecosystem.
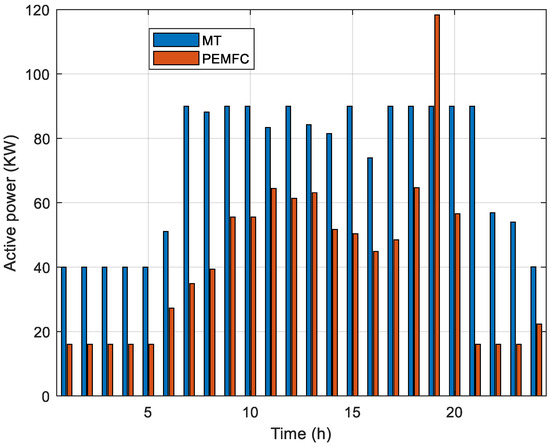
Figure 5.
Optimum power of MT and PEMFC in 24 h.
In Figure 6 and Figure 7, the intricate power generation profiles of PV and WT sources are visually portrayed, offering a nuanced glimpse into the dynamic generation patterns of RERs within the MG. Figure 8, on the other hand, delves into the hydrogen storage status over a 24-h period, acting as a visual testament to the strategic role of hydrogen storage as an energy reservoir. Lastly, Figure 9 encapsulates the MG’s optimal energy management strategy, orchestrating the coordination of various energy sources and storage systems. This comprehensive depiction unravels the seamless integration of resources, ensuring efficient energy distribution, cost savings, and a reduced environmental impact. To amplify the richness of the explanation, let us delve into the intricacies of monitoring power generation profiles for PV and WT sources, elucidate the role of hydrogen storage in energy reservoirs, and explore key takeaways from the holistic energy management strategy depicted in Figure 9. Figure 6 and Figure 7 serve as visual windows into the dynamic generation patterns of RERs within the MG, specifically PV and WT sources. Beyond their visual appeal, the importance of monitoring power generation profiles for these sources lies in understanding how these patterns align with variations in solar irradiance and wind speed. The PV source, dependent on sunlight, exhibits distinctive peaks during periods of high solar irradiance, while the WT source, responsive to wind speed, showcases elevated generation during windy intervals. Recognizing and deciphering these patterns enables informed decision-making, facilitating optimal utilization of these renewable sources based on environmental conditions. In Figure 8, the hydrogen storage status unfolds as a pivotal element in the MG’s energy reservoir strategy. This graph acts as a window into the utilization of hydrogen storage, showcasing how it contributes to load balancing and energy supply when needed. Elaborating on the role of hydrogen storage involves understanding its interaction with other resources. During periods of excess RER generation, hydrogen storage acts as a means of storing surplus energy. Conversely, during high demand or low RER availability, the stored hydrogen is released, ensuring a continuous and reliable energy supply. This dynamic interplay positions hydrogen storage as a flexible and essential component in the MG’s energy management arsenal. Figure 9 encapsulates the MG’s optimal energy management strategy, presenting a holistic view of how various resources are seamlessly integrated. This comprehensive depiction not only underscores the orchestrated coordination of energy sources but also emphasizes their collective contribution to efficient energy distribution, cost savings, and reduced environmental impact. Exploring key takeaways from this strategy involves recognizing the symbiotic relationship between diverse resources. The MG, by intelligently combining PV, WT, hydrogen storage, and other elements, ensures a resilient and sustainable operation. The strategic utilization of RERs, coupled with the flexibility of hydrogen storage, allows the MG to adapt to dynamic energy demands, contributing to grid stability and minimizing reliance on conventional energy sources. The bold results embedded in Figure 6, Figure 7, Figure 8 and Figure 9 are not merely graphical representations but visualizations of a synergistic energy management approach. The monitored generation profiles, the strategic role of hydrogen storage, and the overarching energy management strategy collectively contribute to a resilient and sustainable MG operation. The dynamic interplay of these elements, when understood in depth, unveils the MG’s capacity to navigate the complexities of energy demand, optimize resource utilization, and uphold environmental sustainability. In summary, Figure 6, Figure 7, Figure 8 and Figure 9 guide us through a visual odyssey of sustainable MG operation. The visual representations go beyond aesthetics, offering profound insights into the dynamics of renewable energy generation, the strategic utilization of hydrogen storage, and the orchestrated coordination of diverse resources. The bold outcomes not only celebrate the MG’s resilience in the face of dynamic energy demands but also serve as a testament to the transformative potential of holistic and sustainable energy management strategies.
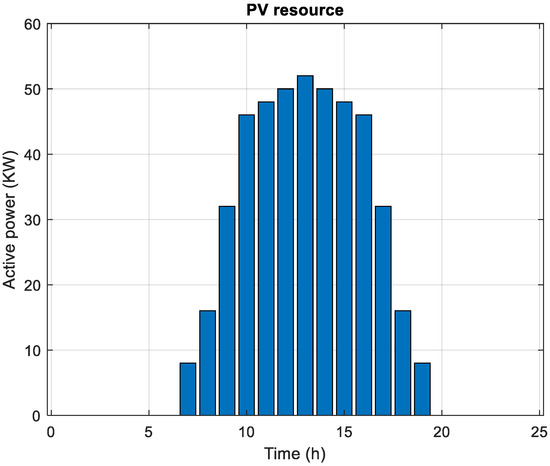
Figure 6.
Power of PV sources.
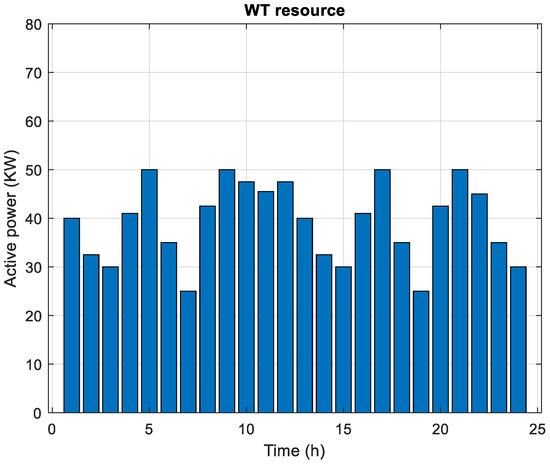
Figure 7.
Power of WT resources.
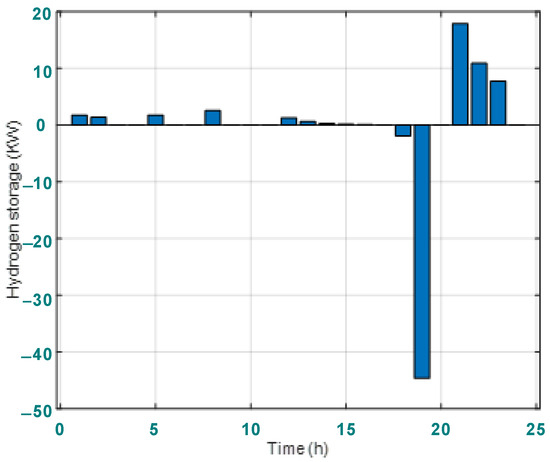
Figure 8.
The state of the hydrogen storage.
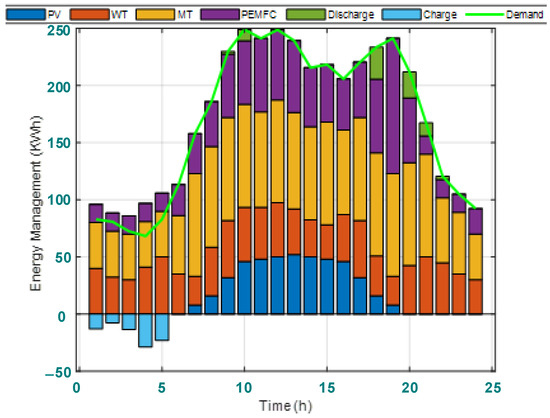
Figure 9.
Energy management in MG.
5. Conclusions
The study’s results unveil a pioneering approach to MG optimization, addressing the intricate challenges posed by the convergence of diverse components like RERs, PHEVs, CHP systems, DRPs, and energy storage solutions. The stochastic framework adeptly orchestrates these elements to maximize MG performance. The integration of the MCS technique effectively handles uncertainties related to PHEV and RER models, while the tailored MINLP approach navigates the complexities of hydrogen storage strategies within PEMFC-CHP units. Furthermore, the incorporation of intelligent charging protocols optimizes PHEV charging dynamics. The MOA, fortified for enhanced exploration, emerges as a cornerstone of this study. It adeptly navigates the MG’s intricate operation amidst variable parameters and maximizes market profits. Through exhaustive validation and comprehensive comparative analysis, the proposed method stands out as a superior benchmark in the MG optimization domain. The method’s superiority is underscored by consistently achieving better objective function values and faster solution times compared to established algorithms like GA, TLBO, PSO, DE, and MADE. Not only does the proposed method offer improved optimization results, but it also presents a faster and more efficient approach, particularly advantageous for larger MG applications. In essence, this study advances the state of MG optimization by pioneering a holistic approach that not only overcomes complexities but also outperforms existing methods, thereby contributing to the advancement and effectiveness of MG energy management.
Author Contributions
Conceptualization, data curation, formal analysis, software, investigation, resources and writing—original draft carried out by H.J., M.D. and M.P.; project administration, supervision carried out by T.N.; validation performed by T.N. and E.S.; writing—review and editing, visualization, methodology, and funding acquisition carried out by T.N., E.S. and G.J. All authors contributed equally to this paper. This research paper is contributed by the authors mentioned above. All authors have read and agreed to the published version of the manuscript.
Funding
This research received no external funding.
Informed Consent Statement
Not applicable.
Data Availability Statement
Data is contained within the article.
Acknowledgments
This research is funded by the Research Office at the University of South Florida, Sarasota-Manatee Campus, from the Pioneer and IRG Interdisciplinary Research Grants awarded to Ehsan Sheybani.
Conflicts of Interest
The authors declare no conflict of interest.
Abbreviations
| Nomenclature | |
| Set and index of time. | |
| Set and index of resources. | |
| Set and index of storage devices. | |
| Set and index of PHEV devices. | |
| State vector representing OFF/ON statuses of resources and storage devices, respectively. | |
| Power vector of resources and storage systems, respectively. | |
| , respectively. | |
| storage system, respectively. | |
| , respectively. | |
| Tariff of selling electrical energy to customers. | |
| Tariff of selling electrical energy to the market. | |
| . | |
| . | |
| Electrical power sold to the market. | |
| resource. | |
| The repair rate of committed resource. | |
| The failure rate of committed resource. | |
| Average repair time of committed resource. | |
| Average failure time of committed resource. | |
| The weighting coefficients of the cost and reliability function, respectively. | |
| . | |
| resource, respectively. | |
| Minimum and maximum generated power of the grid, respectively. | |
| Charge and discharge power of the storage system, respectively. | |
| Upper limit of charging and discharging rates of the battery, respectively. | |
| . | |
| Minimum and maximum stored energy amount of the battery, respectively. | |
| Heat generated via PEMFC. | |
| Heat generated via boiler. | |
| Thermal load demand. | |
| Equivalent electric power for hydrogen usage. | |
| Equivalent electric power for hydrogen production at time t. | |
| . | |
| Maximum power of PEMFC. | |
| PLR | Part load ratio of PEMFC that is equal to the maximum electrical power or produced electrical power. |
| Efficiency of PEMFC. | |
| The ratio of thermal energy to electrical energy. | |
| The charging start time of PHEV. | |
| Variables of Log-normal PDF for smart charging of PHEV. | |
| Charging duration of PHEV. | |
| PHEV battery capacity. | |
| State of the charge in PHEV battery. | |
| Maximum depth of discharge in PHEV battery. | |
| Efficiency of PHEV charger. | |
| Rate of PHEV charger. | |
| The maximum distance a PHEV is able to travel on battery only. | |
| Distance traveled by a vehicle. | |
| PDF of PHEV diurnal distance driven. | |
| Variables of Log-normal pdf for diurnal mileage of PHEV. | |
| Abbreviations | |
| ACC | Applying colonial competitive |
| AMPSO | Adaptive Modified Particle Swarm Optimization |
| CHP | Combined heat and power |
| C2–PSO | Chaotic cell membrane-particle swarm optimization |
| DR | Demand response |
| EA | Evolutionary algorithm |
| FC | Fuel cell |
| HCS | Hierarchical control strategy |
| KMA | K-means algorithm |
| MA | Mathematical approach |
| MADE | Modified adaptive differential evolution |
| MCS | Monte Carlo Simulation |
| MFA | Modified Firefly Algorithm |
| MG | Microgrid |
| MINLP | Mixed-integer nonlinear programming |
| MOA | Meerkat optimization algorithm |
| MSFL | Modified shuffled frog leaping |
| Probability density function | |
| PEMFC | Proton exchange membrane fuel cell |
| RES | Renewable energy resource |
| PHEV | Plug-in hybrid electric vehicle |
| PV | Photovoltaic |
| WT | Wind turbine |
References
- Bornapour, M.; Hooshmand, R.A.; Khodabakhshian, A.; Parastegari, M. Optimal stochastic scheduling of CHP-PEMFC, WT, PV units and hydrogen storage in reconfigurable micro grids considering reliability enhancement. Energy Convers. Manag. 2017, 150, 725–741. [Google Scholar] [CrossRef]
- Emrani-Rahaghi, P.; Hashemi-Dezaki, H. Optimal scenario-based operation and scheduling of residential energy hubs including plug-in hybrid electric vehicle and heat storage system considering the uncertainties of electricity price and renewable distributed generations. J. Energy Storage 2021, 33, 102038. [Google Scholar] [CrossRef]
- Shojaeiyan, S.; Dehghani, M.; Siano, P. Microgrids Resiliency Enhancement against Natural Catastrophes Based Multiple Cooperation of Water and Energy Hubs. Smart Cities 2023, 6, 1765–1785. [Google Scholar] [CrossRef]
- Huang, Y.; Xu, J.; Gao, S.; Lee, K.Y.; Wang, D.; Wang, B. Incomplete information oriented optimal scheduling of multi-energy hub systems with thermal energy storage. J. Energy Storage 2021, 42, 103062. [Google Scholar] [CrossRef]
- Gao, C.; Lin, J.; Zeng, J.; Han, F. Wind-photovoltaic co-generation prediction and energy scheduling of low-carbon complex regional integrated energy system with hydrogen industry chain based on copula-MILP. Appl. Energy 2022, 328, 120205. [Google Scholar] [CrossRef]
- Cui, Q.; Du, S.; Liu, C.; Zhang, L.; Wei, G. A stochastic optimal energy management strategy considering battery health for hybrid electric bus. Proc. Inst. Mech. Eng. Part D J. Automob. Eng. 2020, 234, 3112–3127. [Google Scholar] [CrossRef]
- Cheng, T.; Zhu, X.; Gu, X.; Yang, F.; Mohammadi, M. Stochastic energy management and scheduling of microgrids in correlated environment: A deep learning-oriented approach. Sustain. Cities Soc. 2021, 69, 102856. [Google Scholar] [CrossRef]
- Mokaramian, E.; Shayeghi, H.; Sedaghati, F.; Safari, A. Four-objective optimal scheduling of energy hub using a novel energy storage, considering reliability and risk indices. J. Energy Storage 2021, 40, 102731. [Google Scholar] [CrossRef]
- Samimi, A.; Shateri, H. Network constrained optimal performance of DER and CHP based micro-grids within an integrated active-reactive and heat powers scheduling. Ain Shams Eng. J. 2021, 12, 3819–3834. [Google Scholar] [CrossRef]
- Fan, S.; Ai, Q.; Piao, L. Hierarchical energy management of microgrids including storage and demand response. Energies 2018, 11, 1111. [Google Scholar] [CrossRef]
- Ferruzzi, G.; Cervone, G.; Delle Monache, L.; Graditi, G.; Jacobone, F. Optimal bidding in a Day-Ahead energy market for Micro Grid under uncertainty in renewable energy production. Energy 2016, 106, 194–202. [Google Scholar] [CrossRef]
- MansourLakouraj, M.; Niaz, H.; Liu, J.J.; Siano, P.; Anvari-Moghaddam, A. Optimal risk-constrained stochastic scheduling of microgrids with hydrogen vehicles in real-time and day-ahead markets. J. Clean. Prod. 2021, 318, 128452. [Google Scholar] [CrossRef]
- Karami, H.; Sanjari, M.J.; Gooi, H.B.; Gharehpetian, G.B.; Guerrero, J.M. Stochastic analysis of residential micro combined heat and power system. Energy Convers. Manag. 2017, 138, 190–198. [Google Scholar] [CrossRef]
- Bornapour, M.; Hooshmand, R.A. An efficient scenario-based stochastic programming for optimal planning of combined heat, power, and hydrogen production of molten carbonate fuel cell power plants. Energy 2015, 83, 734–748. [Google Scholar] [CrossRef]
- Zeng, X.; Nazir, M.S.; Khaksar, M.; Nishihara, K.; Tao, H. A day-ahead economic scheduling of microgrids equipped with plug-in hybrid electric vehicles using modified shuffled frog leaping algorithm. J. Energy Storage 2021, 33, 102021. [Google Scholar] [CrossRef]
- Han, X.; Zhang, H.; Yu, X.; Wang, L. Economic evaluation of grid-connected micro-grid system with photovoltaic and energy storage under different investment and financing models. Appl. Energy 2016, 184, 103–118. [Google Scholar] [CrossRef]
- Wang, C.; Liu, Y.; Li, X.; Guo, L.; Qiao, L.; Lu, H. Energy management system for stand-alone diesel-wind-biomass microgrid with energy storage system. Energy 2016, 97, 90–104. [Google Scholar] [CrossRef]
- Kamel, R.M. Effect of wind generation system types on Micro-Grid (MG) fault performance during both standalone and grid connected modes. Energy Convers. Manag. 2014, 79, 232–245. [Google Scholar] [CrossRef]
- Cong, P.; Tang, W.; Zhang, L.; Zhang, B.; Cai, Y. Day-ahead active power scheduling in active distribution network considering renewable energy generation forecast errors. Energies 2017, 10, 1291. [Google Scholar] [CrossRef]
- Ju, L.; Tan, Q.; Lin, H.; Mei, S.; Li, N.; Lu, Y.; Wang, Y. A two-stage optimal coordinated scheduling strategy for micro energy grid integrating intermittent renewable energy sources considering multi-energy flexible conversion. Energy 2020, 196, 117078. [Google Scholar] [CrossRef]
- Eskandari, H.; Kiani, M.; Zadehbagheri, M.; Niknam, T. Optimal scheduling of storage device, renewable resources and hydrogen storage in combined heat and power microgrids in the presence plug-in hybrid electric vehicles and their charging demand. J. Energy Storage 2022, 50, 104558. [Google Scholar] [CrossRef]
- Xue, W.; Wang, Y.; Chen, Z.; Liu, H. An integrated model with stable numerical methods for fractured underground gas storage. J. Clean. Prod. 2023, 393, 136268. [Google Scholar] [CrossRef]
- Chen, J.; Zeng, Y.-S.; Yu, X.-Y.; Yuan, Q.; Wang, T.; Deng, B.; Yan, K.-L.; Jiang, J.-H.; Tao, L.-M.; Chen, C.-Z. A covering liquid method to intensify self-preservation effect for safety of methane hydrate storage and transportation. Pet. Sci. 2022, 19, 1411–1419. [Google Scholar] [CrossRef]
- Shaabani, Y.A.; Seifi, A.R.; Kouhanjani, M.J. Stochastic multi-objective optimization of combined heat and power economic/emission dispatch. Energy 2017, 141, 1892–1904. [Google Scholar] [CrossRef]
- Liu, Z.; Wen, F.; Ledwich, G. Optimal Siting and Sizing of Distributed Generators in Distribution Systems Considering Uncertainties. IEEE Trans. Power Deliv. 2011, 26, 2541–2551. [Google Scholar] [CrossRef]
- Xian, S.; Feng, X. Meerkat optimization algorithm: A new meta-heuristic optimization algorithm for solving constrained engineering problems. Expert Syst. Appl. 2023, 231, 120482. [Google Scholar] [CrossRef]
Disclaimer/Publisher’s Note: The statements, opinions and data contained in all publications are solely those of the individual author(s) and contributor(s) and not of MDPI and/or the editor(s). MDPI and/or the editor(s) disclaim responsibility for any injury to people or property resulting from any ideas, methods, instructions or products referred to in the content. |
© 2023 by the authors. Licensee MDPI, Basel, Switzerland. This article is an open access article distributed under the terms and conditions of the Creative Commons Attribution (CC BY) license (https://creativecommons.org/licenses/by/4.0/).