Abstract
Statistical characteristics of the wind speed in the Samaria region of Israel have been analyzed by processing 11 years of wind data provided by the Israeli Meteorological Service, recorded at a 10 m height above the ground. The cumulative mean wind speed at a measurement height was shown to be 4.53 m/s with a standard deviation of 2.32 m/s. The prevailing wind direction was shown to be characterized by a cumulative mean azimuth of 226° with a standard deviation of 79.76°. The results were extrapolated to a 70 m height in order to estimate wind characteristics at the hub height of a medium-scale wind turbine. Moreover, Weibull distribution parameters were calculated annually, monthly, and seasonally, demonstrating a good match with histogram-based statistical representations. The shape parameter of the Weibull distribution was shown to reside within a narrow range of 1.93 to 2.15, allowing us to assume a Rayleigh distribution, thus simplifying wind turbine energy yield calculations. The novelty of the current paper is related to gathering wind statistics for a certain area (Samaria), and we are not aware of any published statistics regarding wind velocity and direction in this area. These data may be interesting for potential regional wind energy development in which the obtained Weibull distribution could be used in calculations for the expected power generation of particular turbines with a known power dependence on velocity. We have given an example of these calculations for three different types of turbines and obtained their yield in terms of electric power and economic value. We also point out that the fact that realistic wind velocity statistics can be described well by an analytic formula (Weibull distribution) is not trivial, and in fact, the fit may have been poor.
1. Introduction
During the last decade, wind characteristics and wind power potential have been studied in many countries worldwide [1,2,3,4,5,6,7,8,9,10,11,12,13,14,15,16,17,18,19,20,21,22,23,24,25,26,27,28,29,30,31,32,33,34,35,36,37,38,39,40,41,42,43,44,45,46,47,48,49,50,51,52,53,54,55,56,57,58] demonstrating that despite the prolonged global economic crisis, the worldwide wind power ascent continues. The world’s wind power capacity reached 273 TWh (93.6 GW new wind power capacity) in 2021, growing by 17%/year current total installations, which were 837 GW. A new capacity of 557 GW is expected to be added in the next five years under current policies. That is more than 110 GW of new installations each year until 2026.
A huge part of this capacity was installed in China, with 50.91% of the world’s wind energy new installations (about a third of the world year’s additions), and the USA with 13.58%, while the rest of the world was responsible for any additional new installations [59].
Wind energy has become a significant player in the world’s energy market. The global market worth of wind turbine installations in 2020 was around 98.63 billion USD [60]. About 1.371 million people are now employed by the wind industry around the world [61].
Considering the Israeli energy market, the desire to add to the natural gases found, which is a nonrenewable local energy resource, has also motivated the state to devote various efforts to ‘green’ energy research and development, primarily in the area of solar energy. Recently, wind energy has drawn the attention of energy initiatives as well. Yet, the wind power amount produced in Israel was diminutive (27 MW in 2019) compared to the continuously growing global market; however, the steps undertaken by the state were destined to improve the situation.
Israel currently operates a single wind farm in Asanyia Hill in Golan Heights, with a total installed capacity of 6 MW (consisting of ten 600 kW turbines), which satisfies the consumption of about five thousand families. The wind farm operated around 97% of the time and yielded a revenue of ~1 million $ USD a year. Indeed, the wind energy potential of Israel is restricted because of surplus moderate-to-poor wind velocity areas and is limited to areas with sufficiently constant wind, some of which are opposed by green groups on landscape conservation grounds. Nevertheless, the state continues efforts to bring into operation two more farms with a 50 MW capacity [62].
It is emphasized in the Israel Knesset document that an improved estimate, based on the wind turbines’ technological development, gives a value of much more than 500 MW of the Israeli potential wind energy capacity [63]. One of the perspective areas for efficient wind technology development, considering its climatic characteristics, is the Samaria region.
It is well known that the energy yield of a wind turbine mainly depends on wind energy characteristics and the turbine power curve [64,65]. In this paper, statistical characteristics of the wind speed behavior in Ariel (located in Samaria) were derived and investigated, relying on data collected by the meteorological station located on the Ariel University campus.
2. Materials and Methods
Eleven years of meteorological data (2001–2011) acquired by the Ariel Meteorological Station and supplied by the Israeli Meteorological Service were processed. Measurement samples were taken at a 10 m height above the ground and were available at 10 min intervals. The city of Ariel is located at 32°6′21.6″ N, 35°11′16.43″ E, in the center of Israel (Figure 1). The Ariel Meteorological Station is located inside the Ariel University campus in the eastern part of the city (Figure 2), residing at 700 m above sea level.
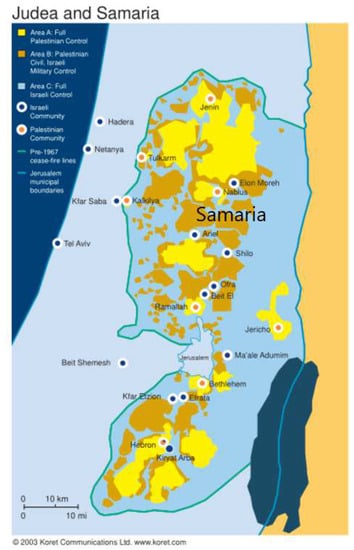
Figure 1.
The city of Ariel (© 2003 Koret Communications Ltd.).
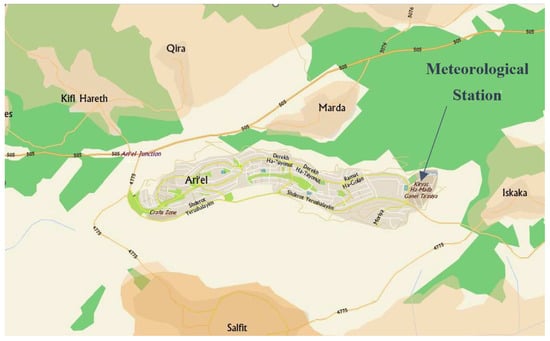
Figure 2.
Meteorological station location (Google maps).
The wind speed data were provided by the meteorological station as a raw matrix of wind speed and azimuth versus time at a 10 m height, sampled at 10 min. In reality, the sample time was much higher than stated, and the available data sample actually produced an average of tens to thousands of faster samples. An example of the monthly wind speed raw data in Ariel represented by 10 min samples is shown in Figure 3.
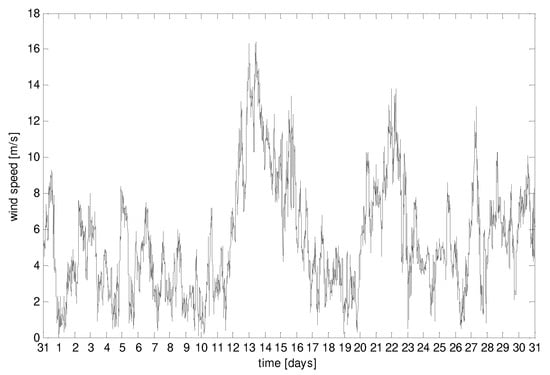
Figure 3.
Typical monthly wind speed raw data.
The raw vector was used to extract the mean and standard deviation parameters and then could be either transformed into a histogram (with a discrete probability distribution function—PDF) or fitted to a known PDF, typically of the Weibull type, as shown in Figure 4. When creating a histogram, the bins were typically chosen to be 1 m∙s−1 wide to match the resolution of the manufacturer-provided turbine power curve data, resulting in the following discrete PDF:
where is the magnitude of the histogram bin, centered at .
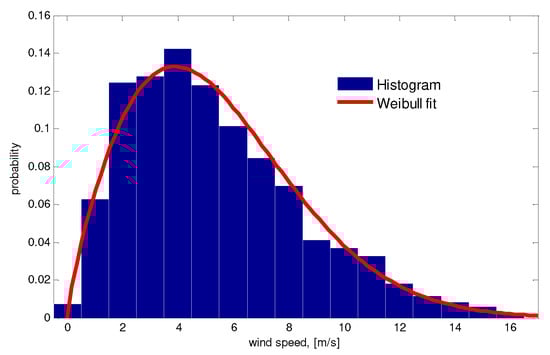
Figure 4.
Histogram and Weibull PDF fit of wind speed raw data of Figure 3.
The Weibull PDF is defined by two parameters: the shape or Weibull modulus (k, dimensionless) and scale (c, m/s for wind speed). The general form of the Weibull PDF is given by [54]:
for positive wind speeds (v > 0) with parameters c and k = related to the site wind speed mean μv and standard deviation σv, which can be calculated as [66]:
and
where:
Is the complete Gamma function. In case the wind raw data of a site are unavailable, but the mean and standard deviation of the wind speed are given, Weibull PDF is usually assumed, and its parameters are extracted from (4) and (5). In general, several ways to extract Weibull parameters from raw data exist [67], including the MATLAB function wblfit, which was used in this work.
A particular (and very common) case of the Weibull PDF is the case where k = 2. It is called the Rayleigh PDF and is given by [54]:
for positive wind speeds (v > 0) with scale parameter c related to the site mean wind speed as [66]:
resulting in (6) bring dependent on the average wind speed as [68]:
It is worth noting that the wind energy resource can be typically classified according to average wind speeds at a 10 m height, as shown in Table 1 [68].

Table 1.
Wind power classification.
Since power in the wind increases with height [69,70], the turbine hub of medium and large-scale wind turbines is usually located between 50 and 150 m in height. Therefore, statistical wind parameters must be either measured at the hub height or extrapolated from measurements available at smaller heights. In case single height measurements only are available, the power law is usually employed to estimate the wind speed at height as shown [71]:
where is the wind speed measurement available at height and is the surface roughness-dependent friction coefficient [60,71]. The friction coefficient dependence on terrain characteristics can be typically determined from Table 2 [68].
Table 2.
Friction coefficient dependence in terrain type.
According to the above, a software simulator was created that received meteorological data (excel format) as input and calculated the following output. Using the wind speed raw data, the mean and standard deviation (STD) values were calculated, followed by Weibull parameters extraction and plotting respective histograms along with the resulting Weibull PDFs. The process was repeated after extrapolating the samples to a 70 m height using the friction coefficient of 0.3, according to Table 2. All the results were calculated monthly, annually, and seasonally. As for wind directions, annual Rose diagrams were created for both 10 and 70-m heights.
3. Results
3.1. Annual Wind Statistical Parameters
Table 3 and Table 4 summarize the yearly and cumulative mean and STD of wind speed and azimuth at 10 and 70 m heights, respectively. It may be concluded that the wind belongs to class 2, according to Table 1.
Table 3.
Yearly and cumulative wind speed statistics at 10 m height.
Table 4.
Yearly and cumulative wind speed statistics at 70 m height.
3.2. Monthly Wind Weibull Parameters
Table 5 and Table 6 summarize the monthly, yearly, and cumulative Weibull parameters of wind speed at 10 and 70 m heights, respectively. It may be concluded that winds in Ariel may be accurately assumed by Rayleigh since the cumulative k is very close to two.
Table 5.
Monthly, yearly, and cumulative Weibull parameters at 10 m height.
Table 6.
Monthly, yearly, and cumulative Weibull parameters at 70 m height.
3.3. Annual Wind Weibull Fits
In order to validate the applicability of the Weibull PDF to wind statistics in Ariel, Figure 5 gives a 2001 annual wind speed raw data histograms and Weibull PDFs at both 10 and 70 m heights. Good matching is evident in Figure 5 and in similar Figure 6, Figure 7, Figure 8, Figure 9, Figure 10, Figure 11, Figure 12, Figure 13, Figure 14 and Figure 15, which are associated with the years 2002–2011.
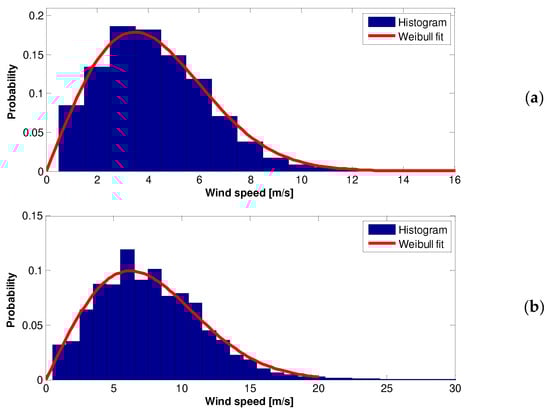
Figure 5.
The 2001 wind speed raw data Histogram and Weilbull PDF. Top (a)—10 m height, Bottom (b)—70 m height.
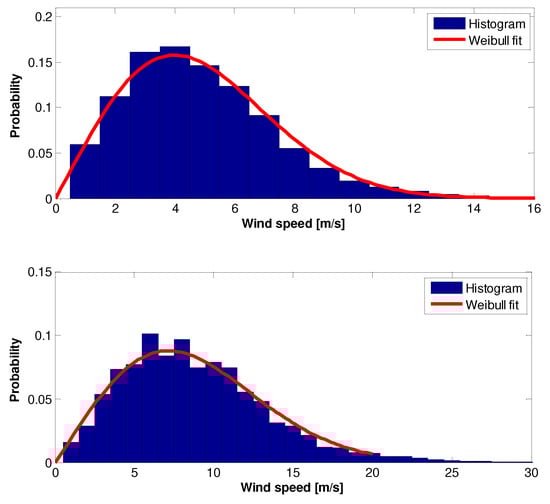
Figure 6.
The 2002 wind speed raw data Histogram and Weilbull PDF: (top)—10 m height, (bottom)—70 m height.
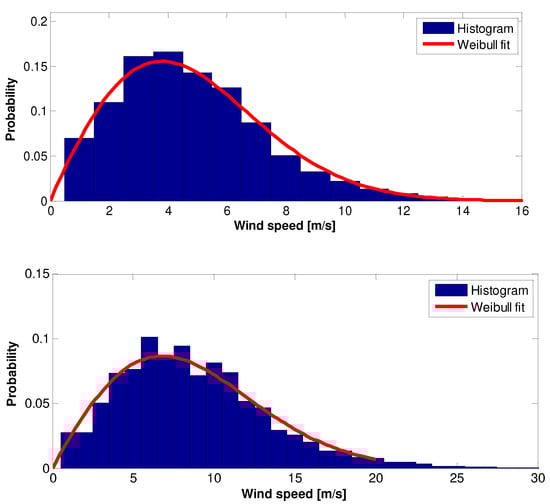
Figure 7.
The 2003 wind speed raw data Histogram and Weilbull PDF: (top)—10 m height, (bottom)—70 m height.
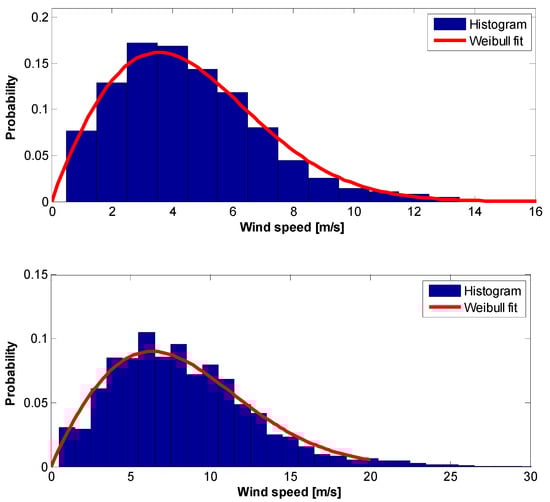
Figure 8.
The 2004 wind speed raw data Histogram and Weilbull PDF: (top)—10 m height, (bottom)—70 m height.
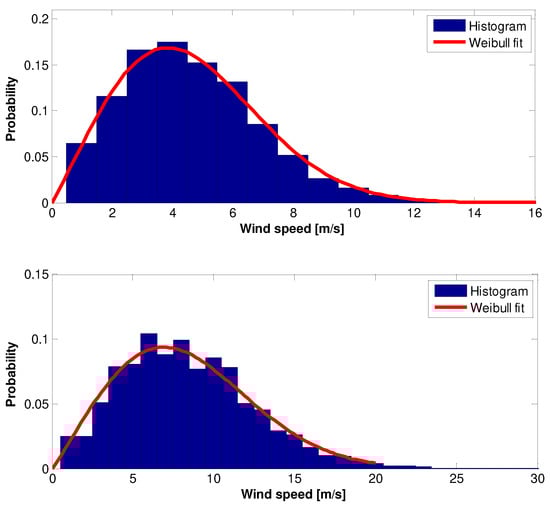
Figure 9.
The 2005 wind speed raw data Histogram and Weilbull PDF: (top)—10 m height, (bottom)—70 m height.
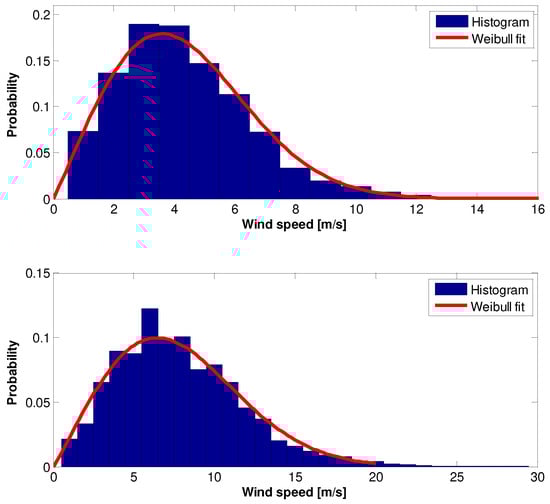
Figure 10.
The 2006 wind speed data Histogram and Weilbull PDF: (top)—10 m height, (bottom)—70 m height.
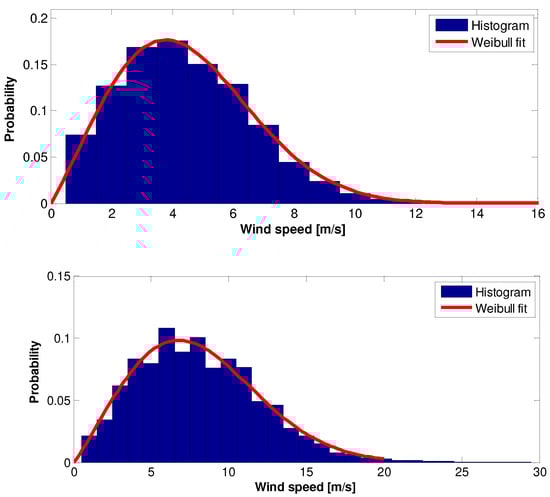
Figure 11.
The 2007 wind speed data Histogram and Weilbull PDF: (top)—10 m height, (bottom)—70 m height.

Figure 12.
The 2008 wind speed data Histogram and Weilbull PDF: (top)—10 m height, (bottom)—70 m height.
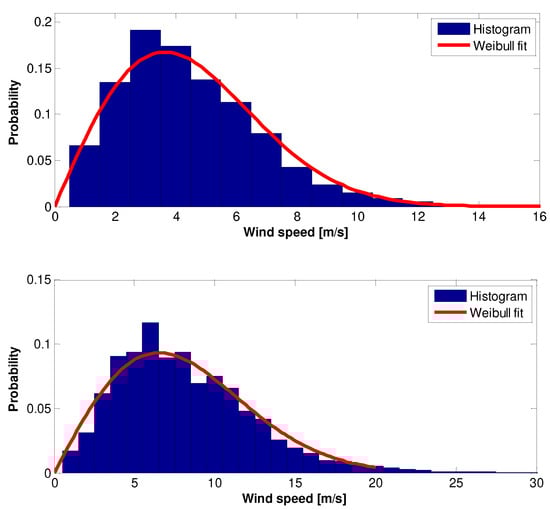
Figure 13.
The 2009 wind speed data Histogram and Weilbull PDF: (top)—10 m height, (bottom)—70 m height.
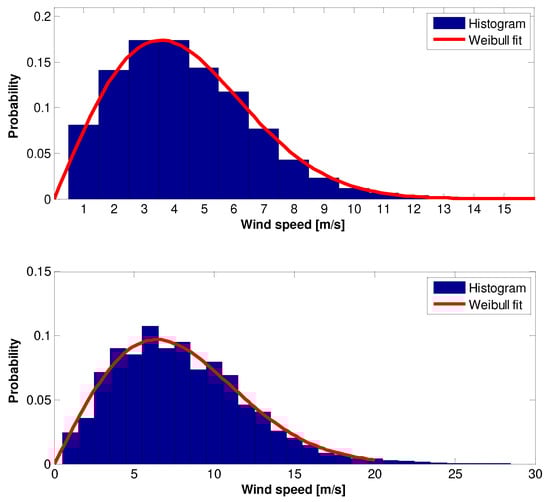
Figure 14.
The 2010 wind speed raw data Histogram and Weilbull PDF: (top)—10 m height, (bottom)—70 m height.
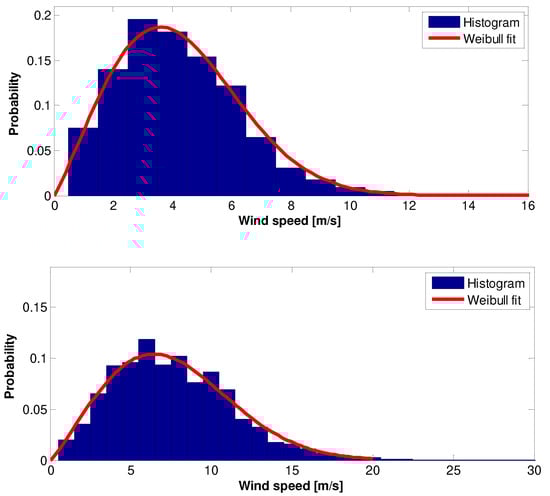
Figure 15.
The 2011 wind speed raw data Histogram and Weilbull PDF: (top)—10 m height, (bottom)—70 m height.
3.4. Annual Comparison of Weibull Wind Curves
All annual Weibull PDFs were plotted together in Figure 16 for 10 and 70 m heights, respectively. It may be concluded that the wind regime was relatively stable and, hence, predictable. This is supported by Figure 17, which presents statistical as well as Weibull parameter variations throughout the years at a 10 m height.
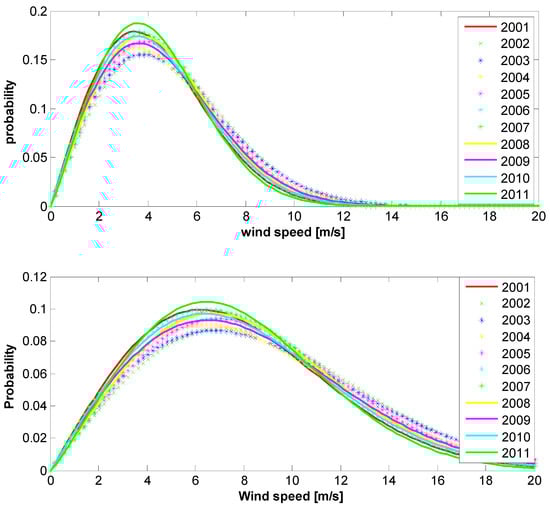
Figure 16.
The 2001–2011 Weilbull PDFs: (top)—10 m height, (bottom)—70 m height.
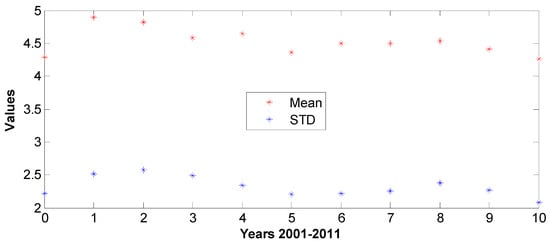
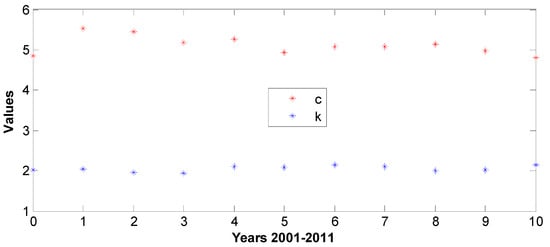
Figure 17.
The 2001–2011 parameter variations at 10 m: (top)—statistical, (bottom)—Weibull.
3.5. Seasonal Comparison of Wind Weibull Parameters & Curves
Weibull parameters were estimated seasonally as well. The winter season in Israel generally takes place from November to January, the autumn season from August to October, the spring season from February and April and the summer season from May to July. The results are summarized in Table 7 and Table 8 for the 10 and 70 m heights, respectively. Cumulative seasonal PDF plots are given in Figure 18, Figure 19, Figure 20 and Figure 21, respectively.
Table 7.
Seasonal variation in Weibull parameters at 10 m height.
Table 8.
Seasonal variation in Weibull parameters at 70 m height.
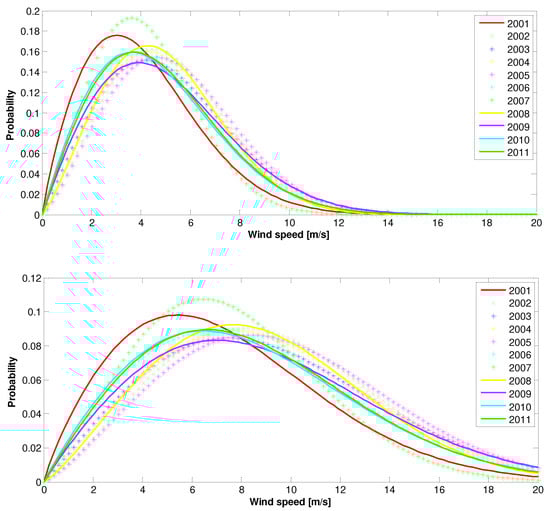
Figure 18.
The 2001–2011 spring Weilbull PDFs: (top)—10 m height, (bottom)—70 m height.
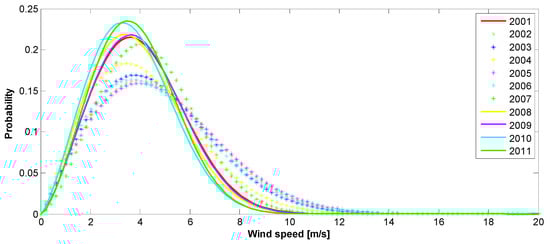
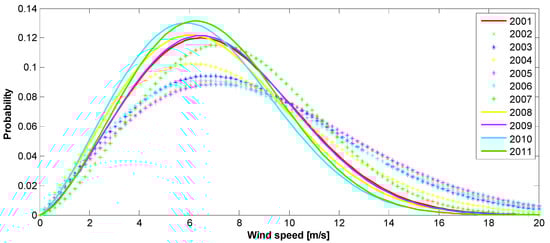
Figure 19.
The 2001–2011 autumn Weilbull PDFs: (top)—10 m height, (bottom)—70 m height.
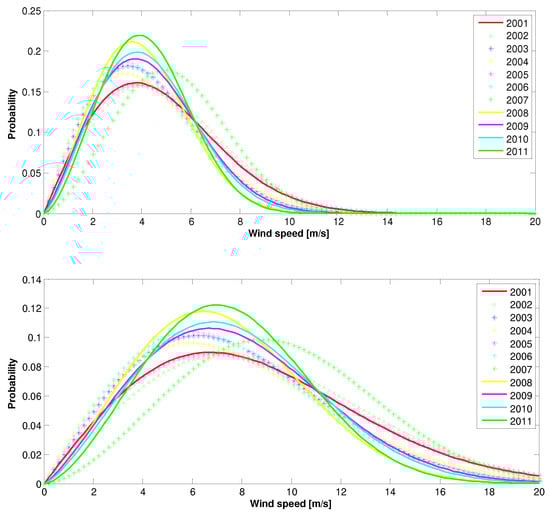
Figure 20.
The 2001–2011 summer Weilbull PDFs: (top)—10 m height, (bottom)—70 m height.
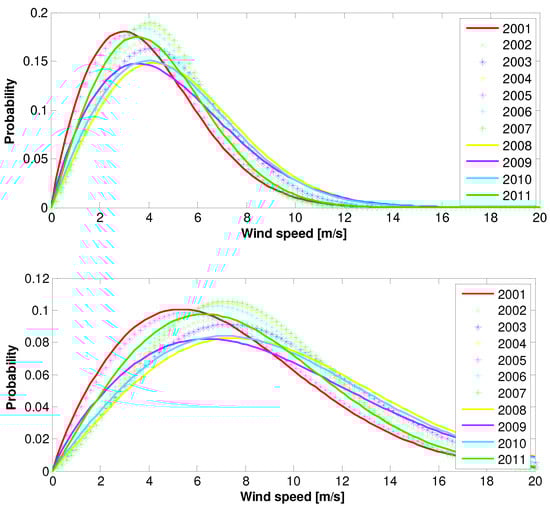
Figure 21.
The 2001–2011 winter Weilbull PDFs: (top)—10 m height, (bottom)—70 m height.
3.6. Statistical Analysis of Wind Direction
Another important aspect of wind analysis is the prevailing wind direction (azimuth). Eleven years of wind direction polar histograms (Rose diagrams) are shown as they rose in the diagram in Figure 22 for the year 2001 (additional Figure 23, Figure 24, Figure 25, Figure 26, Figure 27, Figure 28, Figure 29, Figure 30, Figure 31 and Figure 32 for the years 2002–2011 are given below) for both 10 and 70 m heights. The cumulative wind rose diagrams are shown in Figure 33. It may be concluded that the prevailing wind direction remained relatively stable throughout the years.
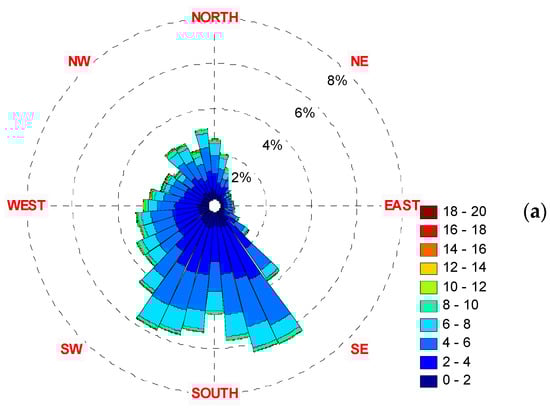
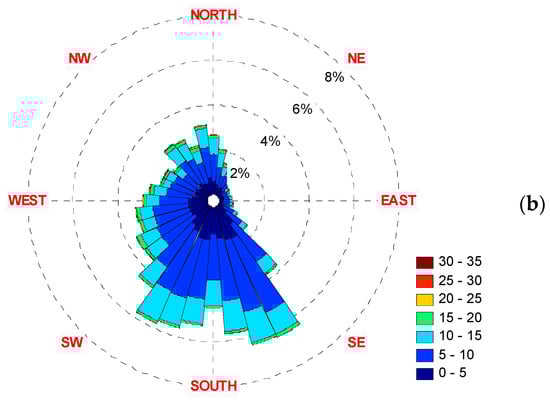
Figure 22.
The 2001 wind rose diagrams. Top (a)—10 m height, Bottom (b)—70 m height.
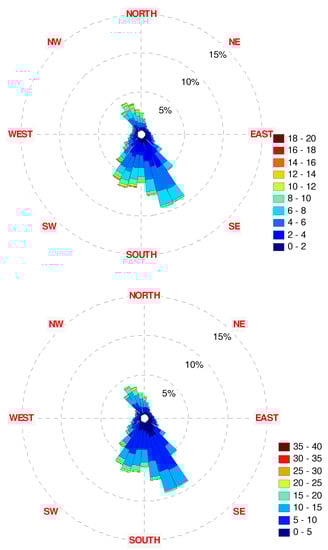
Figure 23.
The 2002 wind rose diagrams: (top)—10 m height, (bottom)—70 m height.
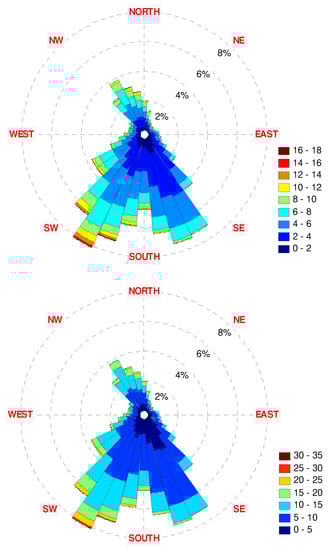
Figure 24.
The 2003 wind rose diagrams: (top)—10 m height, (bottom)—70 m height.
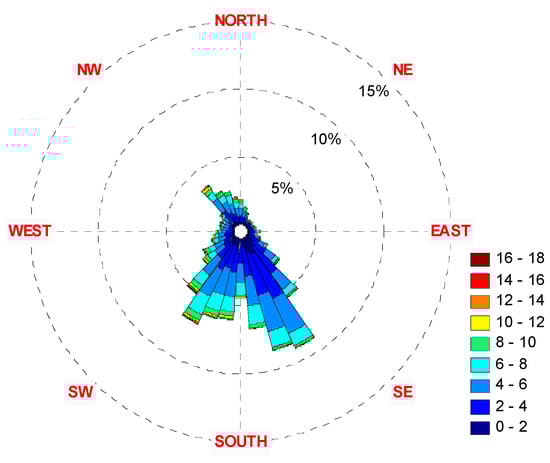
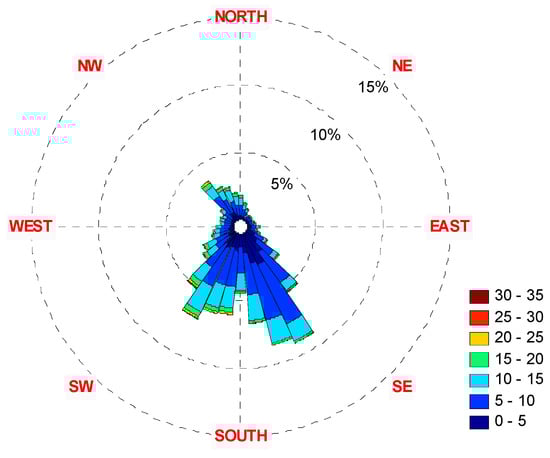
Figure 25.
The 2004 wind rose diagrams: (top)—10 m height, (bottom)—70 m height.
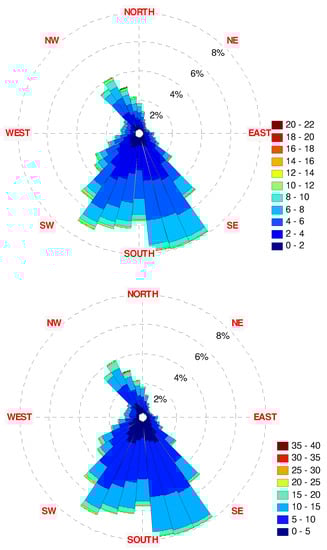
Figure 26.
The 2005 wind rose diagrams: (top)—10 m height, (bottom)—70 m height.
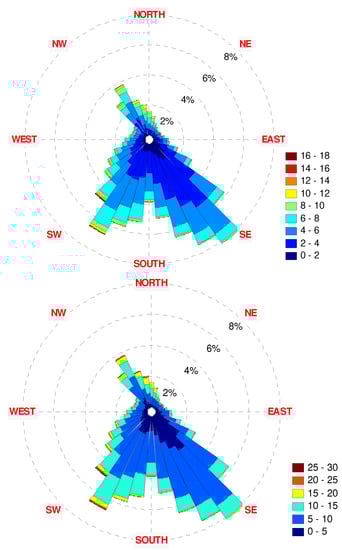
Figure 27.
The 2006 wind rose diagrams: (top)—10 m height, (bottom)—70 m height.
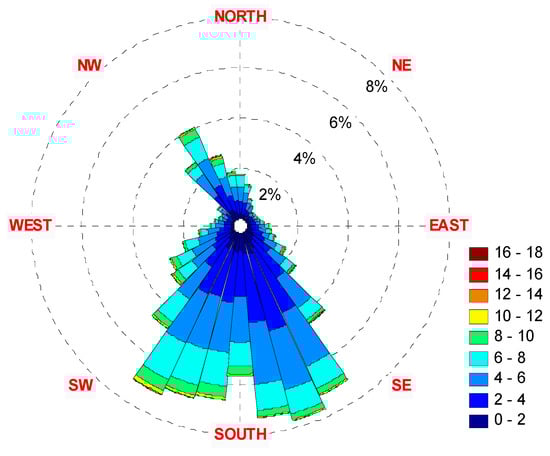
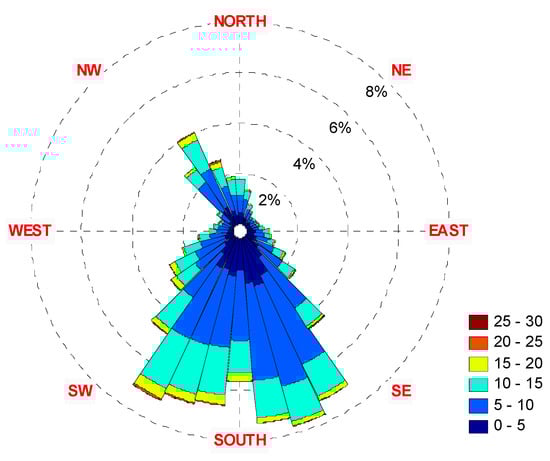
Figure 28.
The 2007 wind rose diagrams: (top)—10 m height, (bottom)—70 m height.
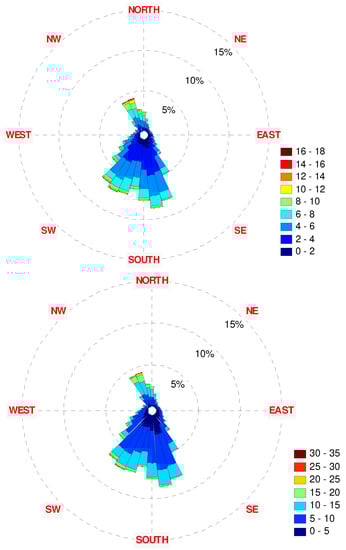
Figure 29.
The 2008 wind rose diagrams: (top)—10 m height, (bottom)—70 m height.
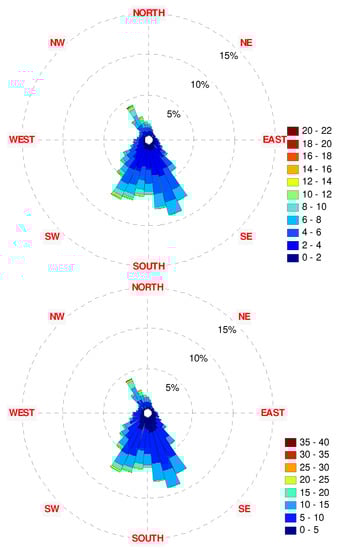
Figure 30.
The 2009 wind rose diagrams: (top)—10 m height, (bottom)—70 m height.
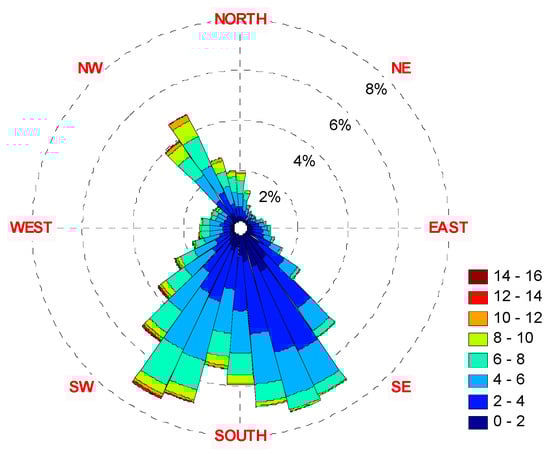
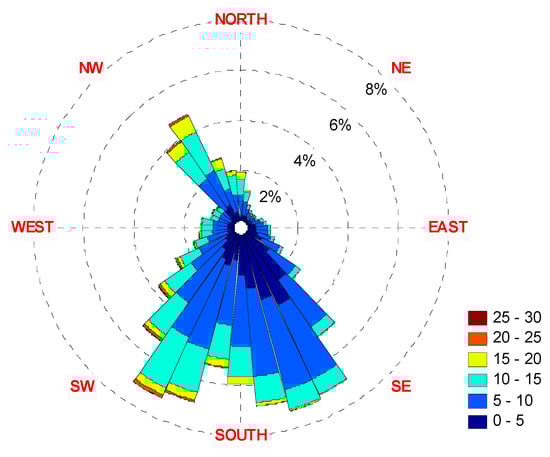
Figure 31.
The 2010 wind rose diagrams: (top)—10 m height, (bottom)—70 m height.
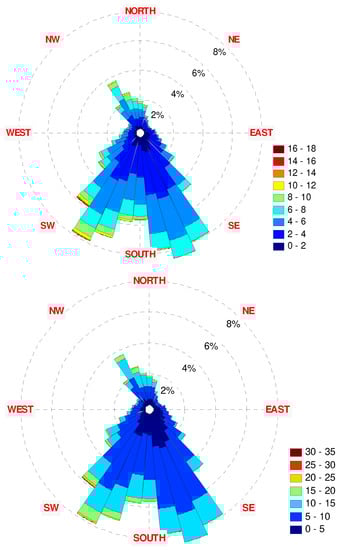
Figure 32.
The 2011 wind rose diagrams: (top)—10 m height, (bottom)—70 m height.
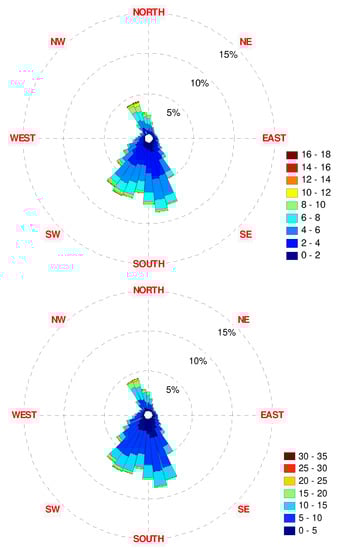
Figure 33.
The 2001–2011 wind rose diagrams: (top)—10 m height, (bottom)—70 m height.
4. Wind Power Generation
The power curves of available turbines are described in [52,53], from which three examples were analyzed in this paper and are depicted in Figure 34.
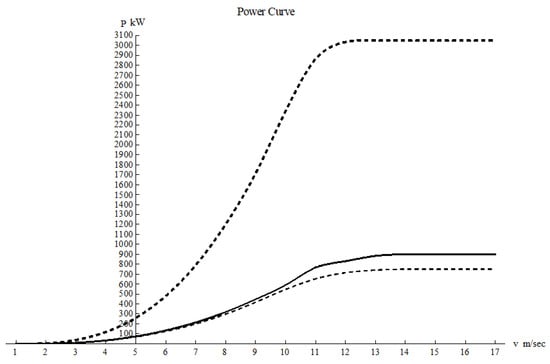
Figure 34.
Power curves of wind turbines [66]. The dashed thick curve is the power curve of Enercon‘s model E101/3000 turbine, the thick line is the power curve of AWE’s model 54–900 turbine and the dashed curve is the power curve of EWT’s model Direct wind 52/750 turbine.
Among the turbines analyzed, the largest was Enercon‘s model E101/3000 turbine with a radius of 50.5 m. Hence, we assume from now on that the hub of the turbine is 70 m. Table 9 summarizes the area and radii of the turbines under study:
Table 9.
Wind turbine geometric parameters.
For this height, we obtained an average speed of 8.8 m/s. The average of the power and the standard deviation obtained for each turbine is depicted in Table 10, and we used the Weibull distribution to calculate the average power and the power standard deviation.
Table 10.
Wind turbine power and economic yield.
Table 10 contains the annual economic value of the turbine based on the current price of energy for household consumers in Israel, which is 0.5342 SH per kW hour on 1 January 2023 (before tax), and the exchange rate for the same date is 3.5190 SH for one $ USD. In Israel, the price was determined by governmental authorities who attempted to strike a balance between the interest of other producers, the cost of transmission and distribution, and the public interest in clean energy.
5. Conclusions
In this work (see Figure 35 for a workflow diagram), statistical characteristics and Weibull parameters of the wind speed in the Samaria region were extracted from 11 years of wind data provided by the Israeli Meteorological Service and acquired at 10 m height above the ground.
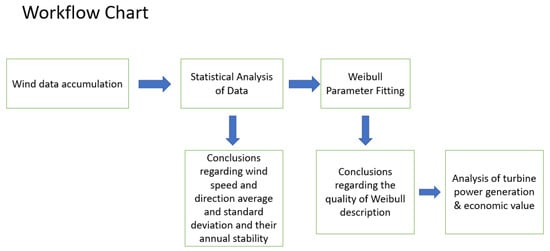
Figure 35.
Workflow diagram.
The cumulative mean wind speed at measurement height was found to be 4.53 m/s with a standard deviation of 2.32 m/s. The prevailing wind direction was shown to be characterized by a cumulative mean azimuth of 226° with a standard deviation of 79.76°. The Weibull distribution parameters were calculated yearly, monthly, and seasonally, demonstrating a good match with histogram-based statistical representations. The shape parameter of Weibull distribution was shown to reside within a narrow range of around two, allowing Rayleigh statistics to be assumed. The results were extrapolated to a 70 m height in order to estimate the wind characteristics at the hub height of a medium-scale wind turbine. It was shown that both statistical parameters and wind direction distribution remained relatively constant throughout the years, indicating good prediction potential. The novelty of the current paper is related to gathering wind statistics for a certain area (Samaria), and we are not aware of any published statistics regarding wind velocity and direction in this area. These data may be interesting for potential regional wind energy development in which the obtained Weibull distribution can be used in calculations of the expected power generation of particular turbines with a known power dependence on velocity. The current work contains an analysis of three different turbines in terms of power generation and economic value. We also point out that the fact that realistic wind velocity statistics are well described by an analytic formula (Weibull distribution) is not trivial, and in fact, the fit may have been poor.
Author Contributions
A.Y. and A.K.; methodology, A.K.; software, Y.R.; validation, S.K.; formal analysis, M.B.; investigation, M.B.; resources, A.K.; data curation, A.Y.; writing—original draft preparation, Y.R.; writing—review and editing, A.Y.; visualization, Y.R.; supervision, A.Y. and A.K.; project administration, A.Y. and A.K. All authors have read and agreed to the published version of the manuscript.
Funding
This research received no external funding.
Data Availability Statement
Not applicable.
Acknowledgments
The authors would like to thank the Israeli Meteorological Service for providing the Ariel wind raw data.
Conflicts of Interest
The authors declare no conflict of interest.
References
- Himri, Y.; Rehman, S.; Draoui, B.; Himri, S. Wind power potential assessment for three locations in Algeria. Renew. Sustain. Energy Rev. 2008, 12, 2495–2504. [Google Scholar] [CrossRef]
- Ackera, T.L.; Williamsb, S.K.; Duquea, E.P.N.; Brummels, G.; Buechler, J. Wind resource assessment in the state of Arizona: Inventory, capacity factor, and cost. Renew. Energy 2007, 32, 1453–1466. [Google Scholar] [CrossRef]
- de Araujo Lima, L.; Bezerra Filho, C.R. Wind energy assessment and wind farm simulation in Triunfo—Pernambuco, Brazil. Renew. Energy 2010, 35, 2705–2713. [Google Scholar] [CrossRef]
- Li, M.; Li, X. Investigation of wind characteristics and assessment of wind energy potential for Waterloo region, Canada. Energy Convers. Manag. 2005, 46, 3014–3033. [Google Scholar] [CrossRef]
- Ilinca, A.; McCarthy, E.; Chaumel, J.-L.; Rétiveau, J.-L. Wind potential assessment of Quebec Province. Renew. Energy 2003, 28, 1881–1897. [Google Scholar] [CrossRef]
- Zhou, Y.; Wu, W.X.; Liu, G.X. Assessment of Onshore Wind Energy Resource and Wind-Generated Electricity Potential in Jiangsu, China. Energy Procedia 2011, 5, 418–422. [Google Scholar] [CrossRef]
- Ahmed, A.S.; Hanitsch, R. Electricity generation and wind potential assessment at Hurghada, Egypt. Renew. Energy 2008, 33, 141–148. [Google Scholar] [CrossRef]
- Ahmed, A.S. Wind energy as a potential generation source at Ras Benas, Egypt. Renew. Sustain. Energy Rev. 2010, 14, 2167–2173. [Google Scholar] [CrossRef]
- Bekele, G.; Palm, B. Wind energy potential assessment at four typical locations in Ethiopia. Appl. Energy 2009, 86, 388–396. [Google Scholar] [CrossRef]
- Prasad, R.D.; Bansal, R.C.; Sauturaga, M. Wind Energy Analysis for Vadravadra Site in Fiji Islands: A Case Study. Ieee Trans. Energy Convers. 2009, 24, 750–757. [Google Scholar] [CrossRef]
- Fyrippis, I.; Axaopoulos, P.J.; Panayiotou, G. Wind energy potential assessment in Naxos Island, Greece. Appl. Energy 2010, 87, 577–586. [Google Scholar] [CrossRef]
- Vogiatzis, N.; Kotti, K.; Spanomitsios, S.; Stoukides, M. Analysis of wind potential and characteristics in North Aegean, Greece. Renew. Energy 2004, 29, 1193–1208. [Google Scholar] [CrossRef]
- Lu, L.; Yang, H.; Burnett, J. Investigation on wind power potential on Hong Kong islands—An analysis of wind power and wind turbine characteristics. Renew. Energy 2002, 27, 1–12. [Google Scholar] [CrossRef]
- Daoo, V.J.; Panchal, N.S.; Faby, S.; Sitaraman, V.; Krlshnamoorthy, T.M. Assessment of wind energy potential of Trombay, Mumbai (19.18N; 72.88E), India. Energy Convers 1998, 13, 1351–1356. [Google Scholar] [CrossRef]
- Mirhosseini, M.; Sharifi, F.; Sedaghat, A. Assessing the wind energy potential locations in province of Semnan in Iran. Renew. Sustain. Energy Rev. 2011, 15, 449–459. [Google Scholar] [CrossRef]
- Mostafaeipour, A. Feasibility study of harnessing wind energy for turbine installation in province of Yazd in Iran. Renew. Sustain. Energy Rev. 2010, 14, 93–111. [Google Scholar] [CrossRef]
- Mostafaeipour, A.; Sedaghat, A.; Dehghan-Niri, A.A.; Kalantar, V. Wind energy feasibility study for city of Shahrbabak in Iran. Renew. Sustain. Energy Rev. 2011, 15, 2545–2556. [Google Scholar] [CrossRef]
- Keyhani, A.; Ghasemi-Varnamkhasti, M.; Khanali, M.; Abbaszadeh, R. An assessment of wind energy potential as a power generation source in the capital of Iran, Tehran. Energy 2010, 35, 188–201. [Google Scholar] [CrossRef]
- Ouammi, A.; Dagdougui, H.; Sacile, R.; Abdelaziz, M. Monthly and seasonal assessment of wind energy characteristics at four monitored locations in Liguria region (Italy). Renew. Sustain. Energy Rev. 2010, 14, 1959–1968. [Google Scholar] [CrossRef]
- Bivona, S.; Burlon, R.; Leone, C. Hourly wind speed analysis in Sicily. Renew. Energy 2003, 28, 1371–1385. [Google Scholar] [CrossRef]
- Alghoul, M.A.; Sulaiman, M.Y.; Azmi, B.Z.; Wahab, M.A. Wind Energy Potential of Jordan. Int. Energy J. 2007, 8, 71–78. [Google Scholar]
- Kamau, J.N.; Kinyua, R.; Gathua, J.K. 6 years of wind data for Marsabit, Kenya average over 14 m/s at 100 m hub height: An analysis of the wind energy potential. Renew. Energy 2010, 35, 1298–1302. [Google Scholar] [CrossRef]
- Islam, M.R.; Saidur, R.; Rahim, N.A. Assessment of wind energy potentiality at Kudat and Labuan, Malaysia using Weibull distribution function. Energy 2011, 36, 985–992. [Google Scholar] [CrossRef]
- Muzathik, A.M.; Wan, N.W.B.; Ibrahim, M.Z.; Samo, K.B. Wind Resource Investigation of Terengganu in the West Malaysia. Wind. Eng. 2009, 33, 389–402. [Google Scholar] [CrossRef]
- Mpholo, M.; Mathaba, T.; Letuma, M. Wind profile assessment at Masitise and Sani in Lesotho for potential off-grid electricity generation. Energy Convers. Manag. 2012, 53, 118–127. [Google Scholar] [CrossRef]
- Jaramillo, O.A.; Borja, M.A. Bimodal versus Weibull Wind Speed Distributions: An Analysis of Wind Energy Potential in La Venta, Mexico. Wind. Eng. 2004, 28, 225–234. [Google Scholar] [CrossRef]
- Jaramillo, O.A.; Saldan, R.; Miranda, U. Wind power potential of Baja California Sur, Mexico. Renew. Energy 2004, 29, 2087–2100. [Google Scholar] [CrossRef]
- Jaramillo, O.A.; Borja, M.A. Wind speed analysis in La Ventosa, Mexico: A bimodal probability distribution case. Renew. Energy 2004, 29, 1613–1630. [Google Scholar] [CrossRef]
- Fagbenle, R.O.; Katende, J.; Ajayi, O.O.; Okeniyi, J.O. Assessment of wind energy potential of two sites in North-East, Nigeria. Renew. Energy 2011, 36, 1277–1283. [Google Scholar] [CrossRef]
- Ohunakin, O.S.; Adaramola, M.S.; Oyewola, O.M. Wind energy evaluation for electricity generation using WECS in seven selected locations in Nigeria. Appl. Energy 2011, 88, 3197–3206. [Google Scholar] [CrossRef]
- Adaramola, M.S.; Paul, S.S.; Oyedepo, S.O. Assessment of electricity generation and energy cost of wind energy conversion systems in north-central Nigeria. Energy Convers. Manag. 2011, 52, 3363–3368. [Google Scholar] [CrossRef]
- Ohunakin, O.S.; Akinnawonu, O.O. Assessment of wind energy potential and the economics of wind power generation in Jos, Plateau State, Nigeria. Energy Sustain. Dev. 2012, 16, 78–83. [Google Scholar] [CrossRef]
- AL-Yahyai, S.; Charabi, Y.; Gastli, A.; Al-Alawi, S. Assessment of wind energy potential locations in Oman using data from existing weather stations. Renew. Sustain. Energy Rev. 2010, 14, 1428–1436. [Google Scholar] [CrossRef]
- Ullah, I.; Chaudhry, Q.; Chipperfield, A.J. An evaluation of wind energy potential at Kati Bandar, Pakistan. Renew. Sustain. Energy Rev. 2010, 14, 856–861. [Google Scholar] [CrossRef]
- Safari, B. Modeling wind speed and wind power distributions in Rwanda. Renew. Sustain. Energy Rev. 2011, 15, 925–935. [Google Scholar] [CrossRef]
- Cabello, M.; Orza, J.A.G. Wind speed analysis in the province of Alicante, Spain. Potential for small-scale wind turbines. Renew. Sustain. Energy Rev. 2010, 14, 3185–3191. [Google Scholar] [CrossRef]
- Carta, J.A.; Ramı’rez, P.; Vela’zquez, S. A review of wind speed probability distributions used in wind energy analysis Case studies in the Canary Islands. Renew. Sustain. Energy Rev. 2009, 13, 933–955. [Google Scholar] [CrossRef]
- Abdeen, M.O. On the wind energy resources of Sudan. Renew. Sustain. Energy Rev. 2008, 12, 2117–2139. [Google Scholar]
- Chang, T.-J.; Wu, Y.-T.; Hsu, H.-Y.; Chu, C.-R.; Liao, C.-M. Assessment of wind characteristics and wind turbine characteristics in Taiwan. Renew. Energy 2003, 28, 851–871. [Google Scholar] [CrossRef]
- Dahmouni, A.W.; Salah, B.M.; Askri, F.; Kerkeni, C.; Nasrallah, B.S. Assessment of wind energy potential and optimal electricity generation in Borj-Cedria, Tunisia. Renew. Sustain. Energy Rev. 2011, 15, 815–820. [Google Scholar] [CrossRef]
- Ali, N.C. Review of Turkey’s current energy status: A case study for wind energy potential of Canakkale province. Renew. Sustain. Energy Rev. 2011, 15, 2743–2749. [Google Scholar]
- Onat, N.; Ersoz, S. Analysis of wind climate and wind energy potential of regions in Turkey. Energy 2011, 36, 148–156. [Google Scholar] [CrossRef]
- Eskin, N.; Artar, H.; Tolun, S. Wind energy potential of Gokceada Island in Turkey. Renew. Sustain. Energy Rev. 2008, 12, 839–851. [Google Scholar] [CrossRef]
- Ucar, A.; Balo, F. Evaluation of wind energy potential and electricity generation at six locations in Turkey. Appl. Energy 2009, 86, 1864–1872. [Google Scholar] [CrossRef]
- Ozgurm, A.; Arslan, O.; Kose, R.; Peker, K.O. Statistical Evaluation of Wind Characteristics in Kutahya, Turkey. Energy Sources 2009, 31, 1450–1463. [Google Scholar] [CrossRef]
- Arslan, O. Technoeconomic analysis of electricity generation from wind energy in Kutahya, Turkey. Energy 2010, 35, 120–131. [Google Scholar] [CrossRef]
- Nguyen, K.Q. Wind energy in Vietnam: Resource assessment, development status and future implications. Energy Policy 2007, 35, 1405–1413. [Google Scholar] [CrossRef]
- Gualtieri, G.; Secci, S. Methods to extrapolate wind resource to the turbine hub height based on power law: A 1-h wind speed vs. Weibull distribution extrapolation comparison. Renew. Energy 2013, 43, 183–200. [Google Scholar] [CrossRef]
- Malik, H.; Fatema, N.; Iqbal, A. Intelligent Data Analytics for Wind Speed Forecasting for Wind Power Production Using Long Short-Term Memory (LSTM) Network. In Intelligent Data-Analytics for Condition Monitoring; Chapter 8; Malik, H., Fatema, N., Iqbal, A., Eds.; Academic Press: Cambridge, MA, USA, 2021; pp. 165–192. ISBN 9780323855105. [Google Scholar] [CrossRef]
- Triantafyllou, P.; Kaldellis, J.K. 2.16—Wind Power Industry and Markets. In Comprehensive Renewable Energy, 2nd ed.; Trevor, M., Ed.; Elsevier: Amsterdam, The Netherlands, 2022; pp. 497–566. ISBN 9780128197349. [Google Scholar] [CrossRef]
- Kaldellis, J.K. 2.01—Introduction to Wind Energy. In Comprehensive Renewable Energy, 2nd ed.; Trevor, M., Ed.; Elsevier: Amsterdam, The Netherlands, 2022; pp. 1–12. ISBN 9780128197349. [Google Scholar] [CrossRef]
- Carrillo, C.; Montaño, A.F.O.; Cidrás, J.; Díaz-Dorado, E. Review of power curve modelling for wind turbines. Renew. Sustain. Energy Rev. 2013, 21, 572–581. Available online: http://grupo_ene.webs.uvigo.es/ (accessed on 17 September 2015). [CrossRef]
- Greenberg, D.; Byalsky, M.; Yahalom, A. Valuation of Wind Energy Turbines Using Volatility of Wind and Price. Electronics 2021, 10, 1098. [Google Scholar] [CrossRef]
- Mohamadi, H.; Saeedi, A.; Firoozi, Z.; Zangabadi, S.; Veisi, S. Assessment of wind energy potential and economic evaluation of four wind turbine models for the east of Iran. Heliyon 2021, 7, e07234. [Google Scholar] [CrossRef]
- Wang, Z.; Liu, W. Wind energy potential assessment based on wind speed, its direction and power data. Sci. Rep. 2021, 11, 16879. [Google Scholar] [CrossRef] [PubMed]
- Paraschiv, S.; Paraschiv, L.S.; Serban, A. Cristea, A.G. Assessment of onshore wind energy potential under temperate continental climate conditions. Energy Rep. 2022, 8 (Suppl. S5), 251–258. [Google Scholar] [CrossRef]
- Tran, V.T.; Chen, T.H. Assessing the wind energy for rural areas of Vietnam. Int. J. Renew. Energy Res. 2013, 3, 423–528. [Google Scholar]
- Kolesnik, S.; Sitbon, M.; Yahalom, A.; Kuperman, A. Assessment of Wind Resource Statistics in Samaria Region. In Proceedings of the 16th International Scientific Conference on Engineering for Rural Development, Jelgava, Latvia, 24–26 May 2017; pp. 1409–1416. [Google Scholar]
- Global Wind Report 2022. Available online: https://gwec.net/global-wind-report-2022/ (accessed on 4 April 2023).
- Global Wind Turbine Market-Forecasts from 2022 to 2027. Available online: https://finance.yahoo.com/news/global-direct-drive-wind-turbine-171800513.html?guccounter=1&guce_referrer=aHR0cHM6Ly93d3cuZ29vZ2xlLmNvbS8&guce_referrer_sig=AQAAAHgHsm_J9RbsDr-j2AQnCrgaqNo9-EezKiNNqmapeThwiOYLlBmkki5JlAEWinEvXFiO9lvideFzekv7Z00cNVNLs2cJk47PoaElN4j1CNKKOE3bDHtQgzoC_gjTQ_uB9yOmZgj28MompoN3PXRo9M7jOiF8NG3oD1_S_LOljHbL#:~:text=GlobeNewswire-,The%20Global%20Direct%20Drive%20Wind%20Turbine%20Market%20is%20forecast%20to,15.63%25%20during%20the%20forecast%20period (accessed on 4 April 2023).
- Wind Energy Industry Employment Worldwide 2009–2021. Available online: https://www.statista.com/statistics/268400/jobs-in-the-wind-energy-industry-worldwide-since-2005/ (accessed on 4 April 2023).
- EWEA—European Wind Energy Association. Available online: https://www.ewea.org/index.php?id=1487 (accessed on 14 May 2011).
- Israel Ministry of Environmental Protection, Renewable Energy. Available online: https://www.sviva.gov.il (accessed on 31 July 2014).
- Wind Energy Power Generation; Background Paper Written by Orli Lotan, 21.09.05. Knesset; Research and Information Center: Jerusalem, Israel, 2005; p. 3. (In Hebrew)
- Ditkovich, Y.; Kuperman, A.; Yahalom, A.; Byalsky, M. A generalized approach to estimating capacity factor of fixed speed wind turbines. IEEE Trans. Sustain. Energy 2013, 3, 607–608. [Google Scholar] [CrossRef]
- Ditkovich, Y.; Kuperman, A.; Yahalom, A.; Byalsky, M. Site-dependent wind turbine performance index. Int. J. Renew. Energy Res. 2013, 3, 592–594. [Google Scholar]
- Ditkovich, Y.; Kuperman, A. Comparison of three methods for wind turbine capacity factor estimation. Sci. World J. 2014, 2014, 805238. [Google Scholar] [CrossRef] [PubMed]
- Chang, T.P. Performance comparison of six numerical methods in estimating Weibull parameters for wind energy application. Appl. Energy 2011, 88, 272–282. [Google Scholar] [CrossRef]
- Masters, G. Renewable and Efficient Electric Power Systems; John Wiley & Sons: New York, NY, USA, 2004. [Google Scholar]
- Kuperman, A.; Rabinovici, R.; Weiss, G. Torque, and power limitations of a shunt connected inverter based WECS. WSEAS Trans. Circuits Syst. 2005, 7, 684–690. [Google Scholar]
- Kuperman, A.; Rabinovici, R.; Weiss, G. A shunt connected inverter based variable speed wind turbine generation. Int. J. Electromotion 2006, 13, 67–72. [Google Scholar]
Disclaimer/Publisher’s Note: The statements, opinions and data contained in all publications are solely those of the individual author(s) and contributor(s) and not of MDPI and/or the editor(s). MDPI and/or the editor(s) disclaim responsibility for any injury to people or property resulting from any ideas, methods, instructions or products referred to in the content. |
© 2023 by the authors. Licensee MDPI, Basel, Switzerland. This article is an open access article distributed under the terms and conditions of the Creative Commons Attribution (CC BY) license (https://creativecommons.org/licenses/by/4.0/).