Abstract
There has been growing interest in applying the DEM (discrete element method) to study the charging and burden distribution in a BF (blast furnace). In practice, the real particles in a BF are non-spherical. However, spherical particles have mostly been used in previous DEM investigations. Furthermore, various particle models have been developed to describe non-spherical particles. However, the effects of using different particle models on particle behavior in a BF are still unclear. Therefore, a comparative study of how the particle shape model impacts the burden charging in a BF was conducted. Specifically, the DEM using a multi-sphere model, polyhedral model, and super-ellipsoid model was first established. Then, experiments and DEM simulations of the charging and burden distribution of non-spherical quartz sand particles in a lab-scale bell-less top BF were performed. The results indicated that the number of sub-spheres, the principle of creating the particle for multi-spheres, the number of planes for polyhedrons, and the shape indices for super-ellipsoids could all affect the accuracy and efficiency. Moreover, applying the super-ellipsoid model and multi-sphere model could achieve reasonable accuracy and efficiency, with the highest simulation accuracy for the polyhedral model but at the cost of a rather heavy computational burden.
1. Introduction
The BF (blast furnace) is the most important smelting reactor involving complex mass transfer, momentum transfer, heat transfer, and chemical reactions between gas and granular materials in the ironmaking industry [1]. There is a general awareness that the burden distribution is vital to the operation of a BF. To be specific, the burden distribution determines the gas flow distribution, gas permeability, and CO utilization, thus significantly impacting the emission reduction, energy saving, efficiency, yield and quality of molten iron, and stability, safety, and durability of the blast furnace [2]. In general, the burden distribution in a BF is largely determined by the charging process of coke and iron ore involving complicated particle dynamics. Therefore, investigating the charging process and obtaining a preferred burden distribution within the BF should be not only of academic interest, but also of significance for practical applications.
The charging process is a typical particulate system. Just as in the investigation of particulate systems, both experimental studies and numerical simulations are the frequently used methods for studying the charging process and burden distribution. In the published experimental investigations, both full-scale and reduced-scale blast furnaces have been studied, and different detection means (e.g., horizontal bar measurement, material box method, mechanical sounding method, image processing technique, metal grid measurement, and laser measurement technology) have been introduced for extracting the information of the charging process and burden distribution (e.g., the burden profile, charging trajectory, and filling point) [3]. For example, Kajiwara et al. [4] experimentally investigated the charging behaviors, burden distribution, and mixing of charging material in a full-scale apparatus Kashima No. 2 BF using the mechanical sounding method, sampling box method, and a magnetometer. Lu et al. [5] studied the descending behavior of solid flow in a laboratory-scale experimental BF. Using an industrial BF at a one-tenth scale, Hattori et al. [6] experimentally explored the effect of throat diameter on the burden distribution and particle size distribution. Then, a simulation model for predicting the burden distribution in the BF was proposed on the basis of the experimental results. Jimenez et al. [7] also carried out a charging process experiment in an industrial BF at a one-tenth scale to study a particular charging pattern and the gas flow effect.
With the great effort made in the corresponding experimental investigations, many interesting findings have been yielded, contributing greatly to a better comprehension of the rules of the charging process and burden distribution. In addition, various empirical correlations have also been developed for predicting the burden movement on the basis of the experimental results [3,8]. However, the ability of experimental studies to investigate the charging process should be quite constrained. Specifically, the BF could be viewed as a “black box”, whereby the interior behaviors of burden materials should be quite difficult to be measured by experiment, resulting from the opaque nature of a BF. Moreover, the proposed empirical correlations generally lack universality. With the proliferation of computing power and technology, on the other hand, numerical simulations have become a powerful alternative for exploring discrete granular systems. Among the various numerical methods, the DEM (discrete element method), first proposed by Cundall and Strack [9], has received extensive attention due to its ability to directly track individual particles and its potential for obtaining abundant particle-level information, which can be of significant importance for better understanding the burden behaviors in a BF.
Due to the superiority of DEM in processing particulate systems, there has been growing interest in applying DEM to investigate the charging process and burden distribution in a BF. For instance, Wei et al. [10] used two different DEM packages (EDEM and LIGGGHTS) to demonstrate the ability of DEM in simulating the charging system by comparing the mass fraction distribution and burden distribution between the simulation and experiment results. The capability of DEM was also validated in the investigation of Mio et al. [11] by comparing the velocity and trajectory of particles through a rotating chute between simulations and experiments, in which the particle velocity and particle trajectory in the experiments were extracted using a high-speed camera and pressure-sensitive sheet. By means of DEM, Ho et al. [12] emphatically analyzed the force structures of granular materials for deeply understanding the fundamentals of the formation of burden piles. In the study of Zhang et al. [13], the impact of the chute inclination angle on the size segregation and burden profile was numerically explored during the charging process in a BF using the serial-hopper-type bell-less charging system. A similar investigation was also conducted by Mio et al. [14], in which the effect of the chute angle on the flow behavior and particle segregation was presented. Xu et al. [15] further evaluated the effect of the cross-section shape (including semicircular and rectangular types) of the rotating chute on burden distribution and granular flow during the charging process of a bell-less top BF using DEM. Using DEM, Zhou et al. [16] focused on the movement trend and velocity distribution law of coke in the chute. In the research of Mio et al. [17], the melting behavior and combustion of the burden material were modeled by introducing a shrinking particle model into DEM, and then they observed the particle pulsating flow and collapse of the coke layer at the top of a BF. Kou et al. [18] further numerically investigated the influences of sinter amount, rotation speed, and chute angle on the size segregation and coke collapse. Kurosawa et al. [19] also simulated particle shrinking in a BF but using a different method, where a large overlap between particles was allowed by introducing a quite small Young’s modulus in the DEM. Using an experiment and DEM, Yu et al. [20] thoroughly investigated the interparticle percolation segregation during burden descent in a BF.
In the past, spherical particles were the most frequently used in DEM investigations of charging processes and burden distribution, e.g., the above-cited literature, because the spheres possess perfect symmetry, which can greatly reduce the difficulty in establishing the DEM model and bring excellent calculation efficiency. Nevertheless, most particles encountered in practical applications are non-spherical, and the particle shape can significantly impact the burden behavior in the BF [21]. To utilize the advantage of spherical particles, a rolling friction model was devised for simulating non-spherical particles using the DEM, where the effects of particle shape were quantified using spherical particles with suitable rolling friction [22,23]. This approach has been used in the DEM investigations of burden movement in the BF [21,24]. The simulation results indicated that spherical particles with a reasonable rolling friction can properly reproduce the burden behavior in some cases [24]. However, the rolling friction model would be more suitable for quite small particles considering the importance of the actual shape for larger particles; hence, using the rolling friction model remains insufficient to fully describe the influence of particle shape in the BF [21]. Furthermore, this model also lacks a solid theoretical foundation in determining the value of rolling friction, whereby it can be viewed as a “tunable parameter” [22,25].
Due to the aforementioned limitations of the rolling friction model, the non-spherical particle model (e.g., the multi-sphere model [26,27,28,29], polyhedral model [30,31,32,33], and super-ellipsoid model [34,35,36,37]) should be the most used in the DEM to describe the irregular shape of particles [25,38,39]. To the best of our knowledge, the multi-sphere model should be adopted most frequently to approximate the non-spherical particles in DEM studies of a BF. Specifically, coke particles have generally been constructed using a multi-sphere model, whereas iron ore pellets have mostly been represented by spheres in DEM investigations of burden behaviors in a BF [40,41,42,43,44,45]. Some of these investigations also examined the effect of particle shape on the charging behavior and burden distribution [40,44,45], and the apparent shape effects could be observed. In addition, the multi-sphere DEM model has also often been combined with computational fluid dynamics to study a BF involving fluid flow and heat transfer [1,46,47,48,49]. In the investigations of Xia et al. [24] and Govender et al. [21], the polyhedral model was applied to construct non-spherical particles, and the different effects of spheres and polyhedrons on the charging behavior and burden topography were effortlessly observed. The ability of the super-ellipsoid model to reasonably reproduce the burden charging was demonstrated by Xia et al. [50].
These non-spherical particle shape models indisputably have their own flaws and admirable points in terms of modeling difficulty, simulation accuracy, and computational efficiency [25,38,39,51]. Furthermore, the influence of adopting different particle shape models on the flow dynamics of particle systems generally cannot be ignored [28,29]. According to the above discussion, the corresponding published investigations mainly focused on directly using the particle shape model to simulate the flow of non-spherical particles in the BF so as to suitably match the actual application, while the effect of particle shape was also explored in some studies. However, how the particle shape model affects the burden behavior was rarely investigated, and the influence of particle shape model on the particle behavior in a BF remains poorly understood. Accordingly, the goal of this study was to evaluate the impact of applying different particle shape models on the DEM simulations of charging processes and burden distribution in a BF. For this purpose, the DEM using a multi-sphere model, polyhedral model, and super-ellipsoid model was first developed. Experiments involving the charging of non-spherical particles in a lab-scale bell-less top BF were subsequently conducted, and DEM simulations using different particle models corresponding to the experimental conditions were also performed. Lastly, the simulation accuracy and computational efficiency of different particle models were examined on the basis of the experimental and simulation results.
2. Mathematical Model
2.1. Particle Motion Equations
Within the DEM framework, the motion for each individual particle (including translational and rotational motions) obeys Newton’s laws of motion:
where m, I, v, and ω are the mass, inertia tensor, translational velocity, and angular velocity of the particle, respectively. Fc is the contact force, g denotes the gravitational acceleration, and Tc is the contact torque. The determination of contact detection between particles is related to the shape representation method. In this paper, the shape of the non-spherical particle was approximated using the multi-sphere model, polyhedral model, and super-ellipsoid model. Determining the contact for these particle models is quite complicated, and they were thoroughly introduced in our previous studies; interested readers can refer to [28,29] for the multi-sphere model, [29,32,33] for the polyhedral model, and [25,52,53,54,55] for the super-ellipsoid model. Therefore, these particle models are only briefly introduced in the next section. Upon completion of the contact detection procedure, the contact force and torque, along with the subsequent motion of every individual particle, can be solved by incorporating the determined contact parameters (contact point, contact normal, overlap, etc.) obtained from the contact detection process into the standard soft sphere linear spring–dashpot model [9].
2.2. Particle Shape Models
2.2.1. Multi-Sphere Model
A multi-sphere particle is generated by combining a set number of small spheres (referred to below as “sub-spheres”), where a change in parameters of the sub-spheres (e.g., the number, size, and position) is allowed. Therefore, a particle with an arbitrary shape can be expressed by adjusting these parameters, and the shape of the multi-sphere particle can more closely approach that of a real particle by using more sub-spheres at the cost of reducing computational efficiency. A multi-sphere particle behaves like a rigid object, where the variation of the relative position between sub-spheres is not permitted in the DEM simulation. The sum of the forces and torques imposed on each sub-sphere constitutes the resultant force and torque acting on the multi-sphere particle when contact occurs between multi-sphere particles. Subsequently, the resultant force and torque are accumulated at the mass center of the multi-sphere particle to calculate the particle movement. Consequently, the contact detection for multi-sphere particles can be converted to the determination of contact for sub-spheres. Accordingly, the well-developed contact detection algorithm devised for spherical particles can be effortlessly applied to multi-sphere particles, and its superiorities in terms of robustness and efficiency are also inherited by the multi-sphere DEM model.
When approximating a multi-sphere particle, there are two modes used to arrange the sub-spheres, as shown in Figure 1 and Figure 2. For the first mode (see Figure 1), all sub-spheres (colored light blue in this figure) are inside the particle geometry (the semitransparent area in this figure). The second mode (see Figure 2) guarantees that the multi-sphere particle and the corresponding real particle have a comparable volume. Therefore, part of the sub-spheres (colored by light blue in this figure) may fall outside of the particle geometry (the semitransparent area in this figure). For simplicity, the first and second modes are hereafter referred to as the control geometry mode and control volume mode, respectively, depending on their characteristics. In this study, both modes were adopted to create non-spherical particles, and their effects were evaluated.
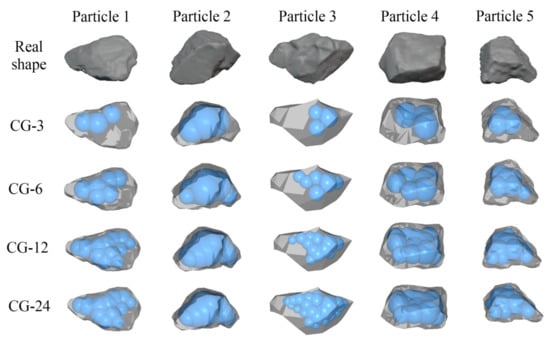
Figure 1.
Particles described by the multi-sphere model adopting the control geometry principle.
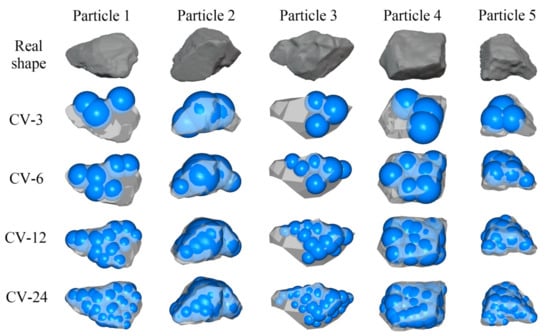
Figure 2.
Particles described by the multi-sphere model adopting the control volume principle.
2.2.2. Polyhedral Model
A polyhedral particle is composed of a number of vertices, edges, and planes. It is, therefore, rather suitable to use the polyhedral model to express the discontinuity of the particle surface (e.g., the coke particles). Generally, the geometric primitive used to construct the polyhedral particles is the triangular plane, as shown in Figure 3. Just like the multi-sphere model, the shape approximation accuracy of the polyhedral model can be improved by using more triangular planes at the expense of decreasing computational efficiency.
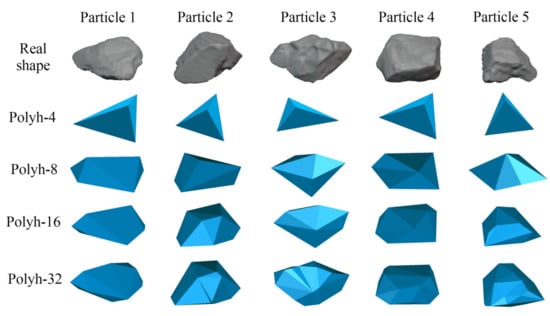
Figure 3.
Particles described by the polyhedral model.
In this study, a theory based on the overlapping volume, which satisfies the energy-conservation principle for elastic interparticle collisions [31], was used for the contact detection between polyhedrons. To be specific, a polyhedral block can be generated from the overlap between two contacting polyhedrons. Then, the contact normal n can be expressed as
where Ai and ni are the area and the corresponding outward unit normal vector of the plane belonging to the aforementioned polyhedron block, respectively. Taking vertex–vertex contact as an example, the polyhedral block V2P1P2P3 is formed between particles, as illustrated in Figure 4. According to the plane areas of A1, A2, and A3 and the corresponding outward unit normal vectors of n1, n2, and n3, Equation (3) can be rewritten as
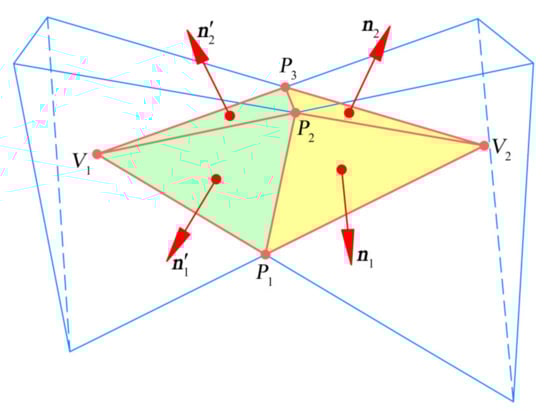
Figure 4.
Sketch map of vertex–vertex contact between two polyhedrons.
Using the same procedure as above, the unit normal vector n′ for polyhedron V1P1P2P3 can also be determined. The relation of n = −n′ is satisfied in this contact scenario. The contact point is the center of the block composed of polyhedrons V1P1P2P3 and V2P1P2P3. The contact plane is vertical to the contact normal and passes through the contact point. The overlap between polyhedrons is defined as the distance between the two deepest points along the direction of the contact normal, where the deepest point is the vertex of the corresponding polyhedral particle farthest from the contact plane. Additionally, the wall was also approximated by triangular planes in this study. Therefore, the contact between the polyhedron and wall could be transformed into a contact between two polyhedrons.
2.2.3. Super-Ellipsoid Model
The super-ellipsoid model is derived from the superquadric method introduced in computer graphics and extended from the quadric equation. The standard mathematical equation for the super-ellipsoid model is formulated as follows [25,35,37,56,57]:
where a, b, and c are the semimajor axis lengths of a particle along its principal axes, respectively. The curvature of the particle edges is dictated by the shape indices s1 and s2, where larger shape indices can lead to a sharper curvature. Using Equation (5), various particle shapes can be expressed by varying the two shape indices (s1 and s2) and three semimajor axis lengths (a, b, and c), as shown in Figure 5.
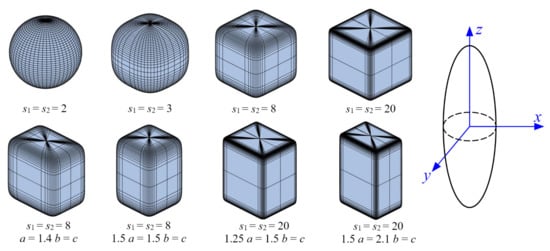
Figure 5.
Particles described by the super-ellipsoid model (a = b = c unless stated otherwise).
In this study, the contact detection for super-ellipsoids was achieved via the so-called “deepest point method” [25,39]. Figure 6a presents a schematic of the contact between super-ellipsoid particles, where there are two contacting super-ellipsoid particles, Particle 1 (F1(x, y, z) = 0) and Particle 2 (F2(x, y, z) = 0). The key in using the deepest point method is to determine the point P1(x1, y1, z1) on the surface of Particle 1 that can minimize F2 (x1, y1, and z1) and vice versa. This minimum is <0 when Particles 1 and 2 are in contact; otherwise, there is no contact. To be specific, the deepest point method is mainly used to determine the two deepest points of P1 inside Particle 2 and P2 inside Particle 1 so that F2(x1, y1, z1) and F1(x2, y2, z2) are minimized. Therefore, the contact detection between super-ellipsoids can be determined by resolving the following formula:
in which the target function is to search the deepest point, and the constraint condition guarantees that the deepest point is on the particle surface. Then, Equation (6) can be solved using the Lagrange multiplier method. The contact between the particle and wall (see Figure 6b) can be solved similarly to that between super-ellipsoids, whereby Equation (6) can be rewritten as
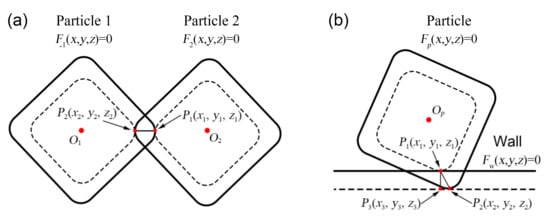
Figure 6.
Schematic of the contact for super-ellipsoid particles: (a) the contact between super-ellipsoids; (b) the contact between super-ellipsoid and wall.
Once the deepest points are obtained, the other contact parameters can be determined as follows (see Figure 6a): the overlap is equal to the length of the line segment P1P2 joining the two deepest points, the contact point is defined as the midpoint of the line segment P1P2, and the contact normal is parallel to the line segment P1P2. For the contact between the super-ellipsoid and wall (see Figure 6b), the direction of the contact normal is parallel to the line P1P3 that is perpendicular to the wall, the overlap is defined as the length of line P1P3, and the point P1 is the contact point.
3. Experiment and Simulation Conditions
3.1. Experiment of BF Charging
In general, the burden distribution in the furnace throat can reflect the packing characteristics of the entire BF. Therefore, an experimental apparatus consisting of a hopper, drop tube, rotating chute, cylindrical container, and motor was built to imitate the top part of a real BF, in which the hopper, drop tube, and cylinder container correspond to the charge bucket, central throat, and furnace throat, respectively. The corresponding schematic illustration of the experimental setup of the charging system is displayed in Figure 7. As shown in Figure 7, the diameter of the hopper outlet was 60 mm, and the diameter of the drop tube was 80 mm. The cross-sectional shape of the rotating chute was semicircular with a diameter of 90 mm, the chute length was 240 mm, and the chute inclination angle was 40°. The diameter and height of the cylinder container were 600 mm and 400 mm, respectively. The cylindrical container was made from transparent plexiglass to observe the final packing state, and the material used for the hopper, drop tube, and chute was aluminum alloy.
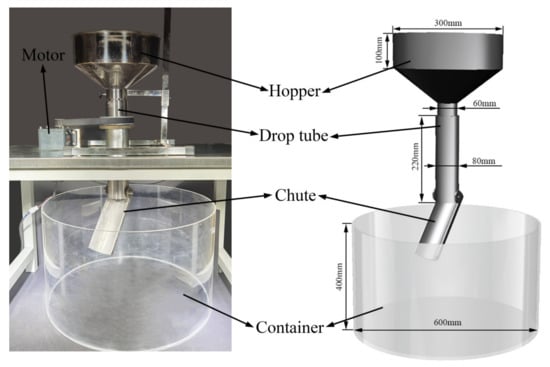
Figure 7.
Schematic illustration of the experimental setup of BF charging system.
Before the experiment, the particles were first loaded into the hopper, and the upper surface of the particle pile was subsequently leveled. A baffle was placed at the outlet of the hopper to prevent the particles from falling out of the hopper. Then, the stepper motor was turned on with a rotation speed of 8 rpm. Subsequently, the experiment began when the baffle at the hopper outlet was rapidly removed, whereby the particles fell freely under the action of gravity. The falling particles sequentially flowed through the drop tube, rotating chute, and cylindrical container. According to the purpose of this paper, the particle shape and its approximation were more important than other particle properties. Therefore, the particles used in the experiment were quartz sands with a shape similar to the coke and ores used in a real BF, as illustrated in Figure 8.
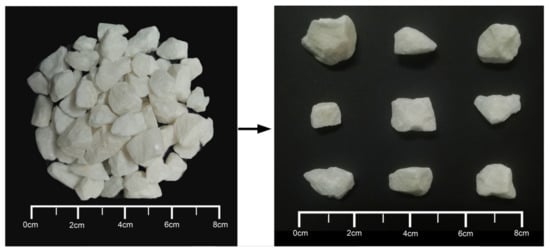
Figure 8.
Quartz sand particles used in the charging experiment.
According to the measurement results, the average equivalent radius of quartz sand particles was 4.9 mm, the equivalent particle size ranged from 6 to 14 mm, and the density was 2750 kg/m3. In the experiment, a fixed filling mass of particles was poured into the hopper, and the number of particles was controlled to be approximately 15,000. Additionally, several sets of pre-experiments were conducted to adjust the hopper outlet diameter and the angle between the hopper wall and vertical direction so that the mass flow rate of particles could fall at a constant rate. In this study, the measurements indicated that the falling rate was approximately 581 g/s, roughly corresponding to an average of 468 particles per second falling from the hopper.
Figure 9 presents the burden morphology of the pile after the charging of quartz sands in the experiment. To extract the surface profile of the experimental burden pile, the vertical line method was used in this study. To be specific, a horizontal bar perforated every 20 mm, some long fine lines, and some perforated steel balls with a diameter of 5 mm were required. One end of the fine line was bolted to a small steel ball, while the other end was passed through the hole of the horizontal bar. Subsequently, the horizontal bar was placed on top of the cylinder container, and the fine line was slowly relaxed until the steel ball slightly touched the surface of the particle packing. Thereafter, this fine line was knotted on the horizontal bar. This process was repeated for the other holes of the horizontal bar. Once these processes were completed, the vertical distance between the steel ball and horizontal bar could be obtained. Lastly, the height of the burden pile corresponding to each hole of the horizontal bar was determined by subtracting the aforementioned vertical distance from the height of the cylindrical container. The above procedure was repeated six times after rotating the horizontal bar 60° on each occasion to avoid systematic and random error. According to these averaged heights, the surface profile versus the radius (R) of the cylindrical contained is illustrated in Figure 9c, where the coordinate of R = 0 cm denotes the center of the cylindrical container.
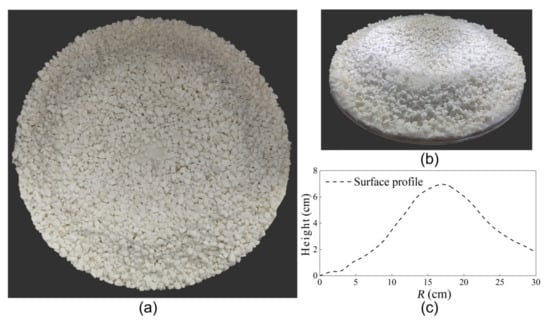
Figure 9.
Burden morphology obtained from the experiment: (a) top view of burden pile; (b) side view of burden pile; (c) surface profile of pile along the container radius.
3.2. DEM Simulations
Due to the shape and size polydispersity of quartz sands, it is easy to imagine that a significant amount of work is required to obtain the shape for every sand particle used in the above experiment. Therefore, a reasonable simplification was carried out, whereby only five particle types with different shapes and sizes were selected to represent the particulate system of the quartz sands in the DEM simulations; the geometries of the sand particles were extracted using a 3D scanner. In addition, some properties used in quantifying the geometry of these selected particles are listed in Table 1, and their geometries are presented in Figure 1, Figure 2 and Figure 3.

Table 1.
Particle dimensions used in the DEM simulations.
As mentioned above, non-spherical particles were approximated using the multi-sphere model, polyhedral model, and super-ellipsoid model in DEM simulations. For the multi-sphere model, the aforementioned control geometry (abbreviated as CG hereafter) principle and control volume (abbreviated as CV hereafter) principle were applied. Figure 1 and Figure 2 present the multi-sphere particles using the control geometry mode and the control volume mode, respectively. The multi-sphere particles were constructed using three, six, 12, and 24 sub-spheres corresponding to particles CG-3, CG-6, CG-12, and CG-24 in Figure 1 and particles CV-3, CV-6, CV-12, and CV-24 in Figure 2, respectively. Figure 3 presents the particles described by the polyhedral model, where the particles consist of four, eight, 16, and 32 planes corresponding to particles Polyh-4, Polyh-8, Polyh-16, and Polyh-32, respectively. Using the super-ellipsoid model, it is quite difficult to approximate the irregular shape of sands. Therefore, the principle of the mass of super-ellipsoid particles being comparable with the mass of experimental sand particles was adopted, i.e., a comparable volume between the super-ellipsoids and sands. Furthermore, the aspect ratios of a/b and c/a were varied within the ranges 1.00–1.43 and 1.00–1.51, respectively, to ensure a similar particle size distribution to the experimental particles. The parameters used to describe the super-ellipsoids are listed in Table 2; four particle types varying the shape indices of s1 and s2 in Equation (5) were used, where particles SE-3, SE-5, SE-8, and SE-20 correspond to the cases of s1 = s2 = 3, s1 = s2 = 5, s1 = s2 = 8, and s1 = s2 = 20, respectively.
Table 2.
Parameters used for describing the super-ellipsoid particles.
Considering that the particle shape can affect the particle packing and, thus, the flowability of particles discharged from the hopper, different particle feed rates might exist when using different particle models. Unlike the aforementioned BF charging experiment, there was no hopper, and the particles were dynamically generated in the inlet of the drop tube at a constant feed rate with the experiment to avoid the influence of particle feed rate in the DEM simulations. In addition, this treatment reduced the calculation complexity. The other simulation conditions were identical to the above experiment; more details regarding the parameters used in the DEM simulations are listed in Table 3. In addition, the five different particle types (Particles 1, 2, 3, 4, and 5) shown in Figure 1, Figure 2 and Figure 3 were randomly generated with equal probability during the DEM simulations using the multi-sphere model and polyhedral model, while super-ellipsoid particles with different sizes (see Table 2) were also randomly produced with equal probability. Note that every simulation case was repeated five times. A self-developed DEM code (DEMSLab) was adopted in this study to simulate particle movement.
Table 3.
Parameters used in the DEM simulations.
4. Results and Discussion
4.1. Simulation Accuracy Using the Multi-Sphere Model
Figure 10 presents the packing states of burden charging of the multi-sphere particles using different numbers of sub-spheres and adopting the control geometry mode. Figure 11 further presents the comparisons of surface profiles of burden piles between the experiment and simulations, in which the surface profiles in the simulations were extracted using the image processing technique. According to these two figures, the heap top position of the burden surface moved toward the furnace center, the heap top height (i.e., the highest point of the surface profile presented in Figure 11) increased, and the surface profile became steeper as the number of sub-spheres increased. Moreover, the simulated burden profiles were apparently lower than the experiment, especially for particles constructed using a smaller number of sub-spheres. This could be largely attributed to the principle of the CG model mentioned above, which led to a smaller particle volume when using fewer sub-spheres. Therefore, there was a lower simulated burden profile upon decreasing the number of sub-spheres. Overall, however, there was a higher simulation accuracy, with the simulation results of surface piles more closely approaching the experimental results for particles constructed using more sub-spheres. For example, Table 4 lists the heap top height for the experiment and simulations. As shown in Table 4, the value of heap top height for CG-3 relative to the experiment deviated by as much as 45.9%, whereas the error was reduced to only 6.3% for CG-24; error E was calculated as follows:
where Hsim and Hexp are the heap top heights obtained from the simulation and experiment, respectively.

Figure 10.
Packing states of the burden pile when using the multi-sphere model adopting the control geometry principle: (a) CG-3; (b) CG-6; (c) CG-12; (d) CG-24.
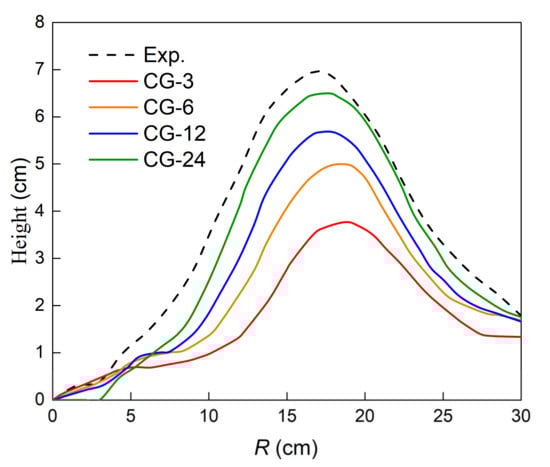
Figure 11.
Comparisons of the surface profiles between the experiment and multi-sphere DEM simulations adopting the control geometry principle.
Table 4.
Comparisons of the heap top height and average voidage fraction between the experiment and multi-sphere DEM simulations adopting the control geometry principle.
However, increasing the number of sub-spheres for the control geometry mode may not reproduce all characteristics of the burden pile more accurately. For example, the average voidage fraction of the burden pile is listed in Table 4. According to Table 4, the error between the experiment and simulations first decreased and then increased, whereby CG-6 possessed the lowest error of 1.3% and CG-24 exhibited the largest error of 8.3%. This implies that the use of more sub-spheres deteriorated the prediction of voidage fraction of burden profile, disagreeing with the above conclusion obtained from Figure 10 and Figure 11.
Figure 12 and Figure 13 further display the packing states and surface profiles of burden piles, respectively, for multi-sphere particles adopting the control volume principle. As shown in these two figures, similar phenomena to those in Figure 10 and Figure 11 can be observed, whereby the heap top position of the burden surface was closer to the furnace center, the surface profile was steeper (the inner repose angles were 29.5°, 30.6°, 31.3°, and 32.2° for CV-3, CV-6, CV-12, and CV-24, respectively, according to further measurements), and the heap top height was increased upon increasing the number of sub-spheres. Table 5 further lists the heap top height and average voidage fraction for the experiment and simulations. The measurement results of the average voidage fraction indicate that using more sub-spheres resulted in a larger error between the experiment and simulations, similar to the variation observed for the control geometry mode. Moreover, these two modes had a comparable voidage fraction when using the same number of sub-spheres.
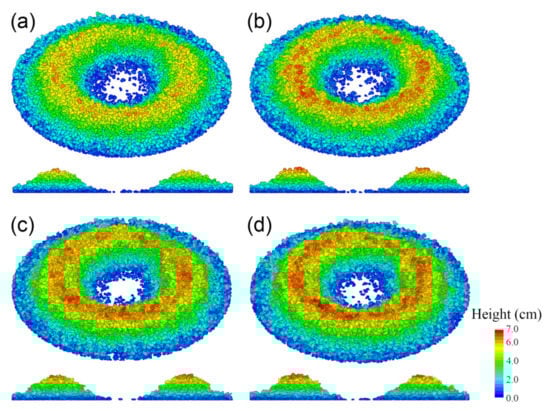
Figure 12.
Packing states of the burden pile when using the multi-sphere model adopting the control volume principle: (a) CV-3; (b) CV-6; (c) CV-12; (d) CV-24.
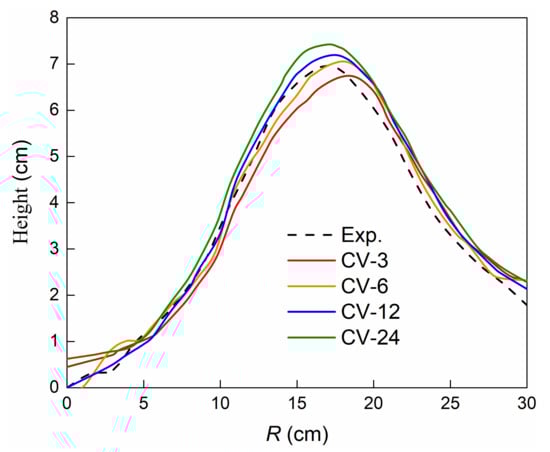
Figure 13.
Comparisons of the surface profiles between the experiment and multi-sphere DEM simulations adopting the control volume principle.
Table 5.
Comparisons of the heap top height and average voidage fraction between the experiment and multi-sphere DEM simulations adopting the control volume principle.
Unlike the results in Figure 10 and Figure 11, however, the variations presented in Figure 12 and Figure 13 were quite small for the control volume mode except for the average voidage fraction, which was comparable. In comparing the performances of the control geometry mode and control volume mode, it can be further concluded that using the control volume mode could replicate the burden surface profile more accurately. As shown in Figure 11 and Figure 13, the prediction accuracies of surface profiles for all types of multi-sphere particles adopting the control volume principle were rather favorable and apparently higher than obtained using the control geometry mode. This phenomenon also indicates that the differences in mass and volume of particles had a very important effect, wherein the control geometry model could not accurately reproduce the real particles because of the aforementioned constraints.
Moreover, the heap top position for CV-24 possessing the highest number of sub-spheres in this paper was most consistent with the experiment, as illustrated in Figure 13. Nevertheless, the surface profile of CV-6 agreed best with the experiment. This could be attributed to the principle of the control volume mode, wherein the sub-spheres could guarantee a comparable volume between the multi-sphere and real particle. This phenomenon became more prominent with the increase in the number of sub-spheres. Therefore, the contour of the multi-sphere particles was larger than that of the real particles, leading to a higher surface pile height for multi-sphere particles formed by more sub-spheres.
4.2. Simulation Accuracy Using the Polyhedral Model
In this section, the simulation results using the polyhedral DEM model are compared with the experimental results. The burden piles for polyhedral particles approximated by four, eight, 16, and 32 planes are shown in Figure 14, and their surface piles are plotted in Figure 15. According to these two figures, the heap top height decreased when using more planes, and the heap top position approached the furnace center upon increasing the number of planes from eight to 32. Overall, using more planes could improve the simulation accuracy, whereby the burden morphology for Polyh-32 was most consistent with the experiment. The measurement results of the heap top height are listed in Table 6. It can be found that there was an error of 19.8% between the experiment and simulation for Polyh-4, whereas the error was only 1.4% for Polyh-32.
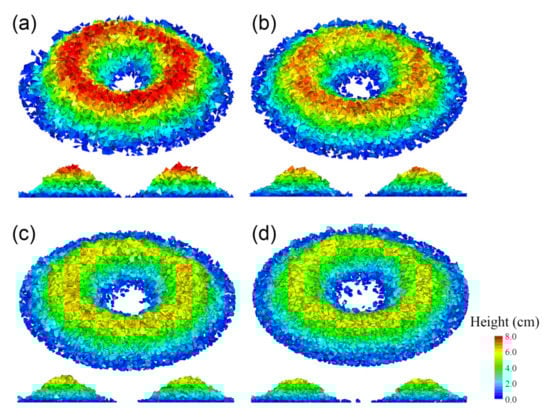
Figure 14.
Packing states of the burden pile when using the polyhedral model: (a) Polyh-4; (b) Polyh-8; (c) Polyh-16; (d) Polyh-32.
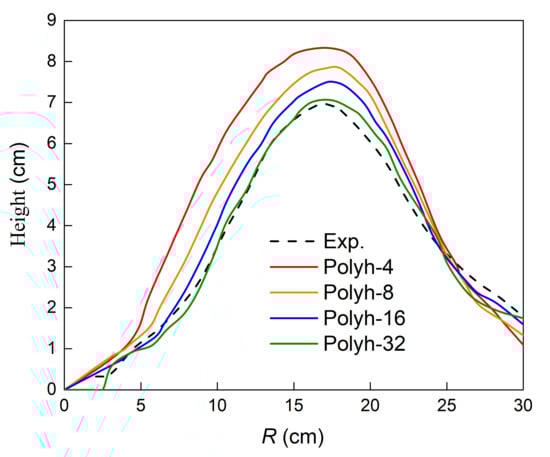
Figure 15.
Comparisons of the surface profiles between the experiment and polyhedral DEM simulations.
Table 6.
Comparisons of the heap top height and average voidage fraction between the experiment and polyhedral DEM simulations.
In terms of the average voidage fraction of the burden pile (listed in Table 6), the polyhedral DEM simulations could more accurately predict its magnitude when using more planes, unlike the multi-sphere model, where using more sub-spheres could not always obtain a higher prediction accuracy of voidage fraction. In addition, the voidage fraction decreased with the number of planes. This means that the burden pile became denser with the number of planes, leading to a lower burden height for polyhedrons constructed using more planes (see Figure 15).
4.3. Simulation Accuracy of Using Super-Ellipsoid Model
The packing structures of the burden particles and the corresponding surface profiles are illustrated in Figure 16 and Figure 17, respectively, demonstrating the ability of the super-ellipsoid DEM in replicating the burden behaviors in a BF. According to these two figures, increasing the shape indices of the super-ellipsoid particles led to the heap top position more closely approaching the furnace center, the heap top height increasing, and the surface profile becoming steeper, similar to the variations observed as a function of the number of sup-spheres for the multi-sphere model and the number of planes for the polyhedral model. Moreover, these variations were intermediate between the multi-sphere model adopting the control volume principle (see Figure 13) and the polyhedral model (see Figure 15).
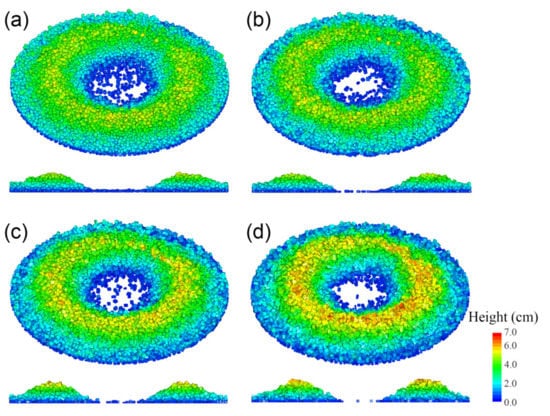
Figure 16.
Packing states of the burden pile when using the super-ellipsoid model: (a) SE-3; (b) SE-5; (c) SE-8; (d) SE-20.
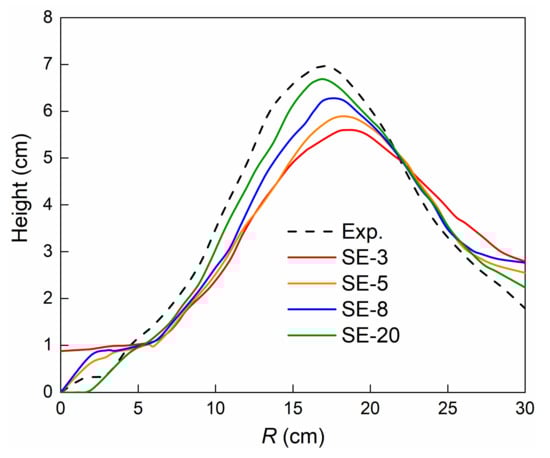
Figure 17.
Comparisons of the surface profiles between the experiment and super-ellipsoid DEM simulations.
The comparisons shown in Figure 17 imply that the simulation accuracy was improved with the shape indices, and the difference in surface profile between the experiment and SE-20 was minimal. Taking the heap top height (see measurement results in Table 7) as an example, the error between the experiment and simulations was reduced from 19.8% to 4.2% upon increasing the shape indices from three to 20. In addition, there was a wider particle distribution ranging from the center to the circumference of the furnace for smaller shape indices. This could be ascribed to the smoother edges for super-ellipsoids with smaller shape indices. Hence, the particles tended to roll down the heap top, resulting in a wider distribution range. Table 7 also lists the average voidage fraction of the burden pile. It can be found that the simulated voidage fraction was closer to the experiment upon increasing the shape indices, whereby the error for SE-20 was only 7.0% compared with the largest error of 19.2% for SE-3.
Table 7.
Comparisons of the heap top height and average voidage fraction between the experiment and super-ellipsoid DEM simulations.
As discussed above, the difference between the experiment and SE-20 was fairly small. This indicates that using the super-ellipsoid particles could reasonably reproduce the burden distribution, despite the shape of the super-ellipsoid being quite different from the particles used in a real BF. This might be due to the chaos of particulate systems, whereby the influence of particle shape can be suppressed in some cases, especially for super-ellipsoid particles with larger shape indices, in which the sharper edges of super-ellipsoids can better mimic the characteristics of real particles. In comparison with the multi-sphere model and polyhedral model, nevertheless, the optimal prediction results of the super-ellipsoid model (i.e., SE-20) were inferior (e.g., the surface profiles for CV-6 (see Figure 13) and Polyh-32 (see Figure 15)).
The coordinate number (CN), defined as the number of particles in contact with the target particle, was also investigated in this paper, as the CN can be used to characterize the structure of the burden pile and evaluate the heat conduction between particles, which are important parameters for BF operation. According to our statistical results, the CNs were 4.72, 4.59, 4.54, and 4.45 for SE-3, SE-5, SE-8, and SE-20, respectively. It can be found that the CN decreased with the shape indices. The reason for this variation may be that there were sharper edges for super-ellipsoids with larger shape indices, such that the particles tended to be more cuboid. This led to a more ordered arrangement of the burden pile. In general, an ordered arrangement of granular packing could reduce the contact between particles. As such, there was a smaller CN for larger shape indices. Furthermore, the variation trend of CN for super-ellipsoid particles differed from that of the multi-spheres and polyhedrons. Specifically, there was generally a higher probability of contact when more sub-elements (sub-spheres or triangular planes) were used for multi-spheres and polyhedrons. As a consequence, the CN increased. In contrast, the super-ellipsoid model possessed the smallest CNs among the three particle models, being <5 for super-ellipsoids and in the range of 5–6.5 for the other particle models. Moreover, the change in CN for super-ellipsoid particles upon varying the shape indices was minimal, whereas the polyhedral model possessed the biggest change.
4.4. Computational Efficiency
In this section, the computational efficiencies for the DEM simulations of the BF charging process using the multi-sphere model, polyhedral model, and super-ellipsoid model are evaluated, as shown in Figure 18. All simulations were carried out on a workstation using an Intel(R) Xeon (R) CPU E5-2650 v3 processor. The charging process of spherical particles was also simulated, and the physical time consumed by the simulation case of spherical particles was set to 1 (see Figure 18a–d). The nondimensionalized physical time used for simulating the non-spherical particles was obtained on the basis of the spherical case, i.e., the time ratio presented in Figure 18.
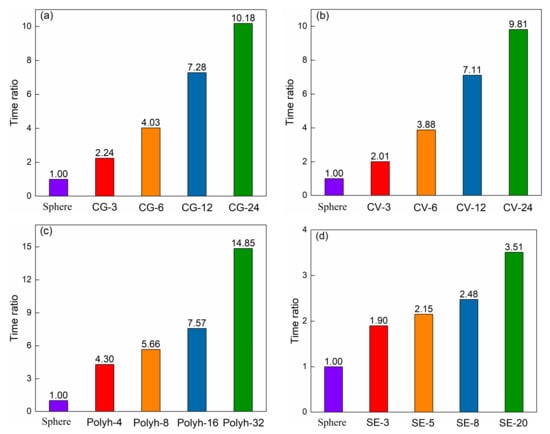
Figure 18.
Evaluation of the computation efficiency for different particle models: (a) multi-sphere model adopting the control geometry principle; (b) multi-sphere model adopting the control volume principle; (c) polyhedral model; (d) super-ellipsoid model.
As presented in Figure 18, the calculation amount increased upon increasing the number of sub-elements (i.e., the sub-spheres for the multi-sphere model and the planes for the polyhedral model) and the shape indices of the super-ellipsoid model. For the multi-sphere model, slightly more computation time was required for the control geometry mode (see Figure 18a) in comparison with the control volume mode (see Figure 18b). There was acceptable efficiency when the number of sub-spheres was less than 6. However, the computational efficiency decreased significantly when the multi-sphere particles consisted of more than 12 sub-spheres. For the polyhedral model, the computation time increased slowly with the number of planes from four to 16, whereas it increased substantially when using more than 16 planes. For the super-ellipsoid model, the computational efficiency remained quite high, even for super-ellipsoids with relatively large shape indices. For example, the computation time for SE-20 was 3.5 times faster than the spherical DEM simulation case.
5. Conclusions and Outlook
In this paper, experiments and corresponding DEM simulations of the charging and burden distributions of non-spherical quartz sand particles in a lab-scale bell-less top BF were carried out, in which three different particle models (multi-sphere model, polyhedral model, and super-ellipsoid model) were used to describe the non-spherical particles within the framework of the DEM. On the basis of the experiment and simulation results, a comparative study of the simulation accuracy and computational efficiency for different particle models was conducted. The primary conclusions are summarized as follows:
- (1)
- Two modes (control geometry principle and control volume principle) were used to create the non-spherical multi-sphere particles. For the control geometry mode, the simulation accuracy generally increased with the number of sub-spheres. However, there was a threshold for the control volume mode at which using more sub-spheres no longer led to a higher accuracy. Overall, the control volume mode had a higher simulation accuracy compared with the control geometry mode. In terms of computational efficiency, using more sub-spheres reduced the computation speed for both modes, and the computing burden of the control geometry mode was slightly heavier than that of the control volume mode. Accordingly, the control volume mode is more promising than the control geometry mode for the numerical investigation of BFs.
- (2)
- For the polyhedral model, increasing the number of planes in the polyhedral particles improved the simulation accuracy. Applying the polyhedral model reproduced the burden charging in the BF with the highest accuracy among the three particle models used in this study. For example, the polyhedral particles constructed using the highest number (32) of planes in this paper were most consistent with the experiment. However, the computational efficiency decreased when using more planes, especially for a relatively large number of planes.
- (3)
- With the increase in shape indices, super-ellipsoid particles simulated the burden behavior more accurately. The behavior of particulate systems in the BF was still reasonably replicated by the super-ellipsoid DEM with relatively large shape indices, despite their rather different shape from the real particles used in a BF. Moreover, adopting larger shape indices led to a lower computational efficiency, although the simulation remained quite efficient even for super-ellipsoids with relatively large shape indices.
In summary, the choice of particle shape model plays an important role in simulation accuracy and computational efficiency, with reasonable values obtained when using the super-ellipsoid model and multi-sphere model constructed using a suitable number of sub-spheres, whereas the polyhedral model achieved the highest simulation accuracy at the expense of a rather heavy computing load. In the future, scholars can select the appropriate particle model to simulate particle behavior in the BF depending on the performance of the different particle models reported in this work and their research purposes.
Author Contributions
Conceptualization, H.M., X.X. and Y.Z.; methodology, H.M., X.X. and Y.Z.; software, Y.Z.; validation, X.X. and L.Z.; formal analysis, H.M., X.X. and L.Z.; investigation, H.M. and X.X.; resources, X.X., C.X. and Z.L.; data curation, H.M., X.X. and L.Z.; writing—original draft preparation, H.M. and X.X.; writing—review and editing, H.M., T.S., G.Z., Y.L., Z.H., X.L. and Y.Z.; visualization, H.M., X.X., L.Z., C.X., Z.L., T.S. and Y.L.; supervision, Y.Z.; project administration, T.S., Y.L. and Y.Z.; funding acquisition, H.M., T.S., G.Z., Y.L., Z.H., X.L. and Y.Z. All authors have read and agreed to the published version of the manuscript.
Funding
This research was funded by the China Postdoctoral Science Foundation (No. 2021M702792), the State Key Laboratory of Process Automation in Mining and Metallurgy and the Beijing Key Laboratory of Process Automation in Mining (No. BGRIMM-KZSKL-2022-3), the National Natural Science Foundation of China (No. 22078283), and the Foundation of State Market Regulatory Administration (No. 2019MK154).
Data Availability Statement
Not applicable.
Conflicts of Interest
The authors declare no conflict of interest.
References
- Wei, G.; Zhang, H.; An, X.; Hou, Q. Effect of particle shape on raceway size and pressure drop in a blast furnace: Experimental, numerical and theoretical analyses. Adv. Powder Technol. 2022, 33, 103455. [Google Scholar] [CrossRef]
- Shi, L.; Zhao, G.; Li, M.; Ma, X. A model for burden distribution and gas flow distribution of bell-less top blast furnace with parallel hoppers. Appl. Math. Model. 2016, 40, 10254–10273. [Google Scholar] [CrossRef]
- Chen, J.; Zuo, H.; Xue, Q.; Wang, J. A review of burden distribution models of blast furnace. Powder Technol. 2022, 398, 117055. [Google Scholar] [CrossRef]
- Kajiwara, Y.; Jimbo, T.; Joko, T.; Aminaga, Y.; Inada, T. Investigation of bell-less charging based on full scale model experiments. Trans. Iron Steel Inst. Jpn. 1984, 24, 799–807. [Google Scholar] [CrossRef]
- Lu, Y.; Jiang, Z.; Zhang, X.; Wang, J.; Zhang, X. Vertical section observation of the solid flow in a blast furnace with a cutting method. Metals 2019, 9, 127. [Google Scholar] [CrossRef]
- Hattori, M.; Iino, B.; Shimomura, A.; Tsukiji, H.; Ariyama, T. Development of burden distribution simulation model for bell-less top in a large blast furnace and its application. ISIJ Int. 1993, 33, 1070–1077. [Google Scholar] [CrossRef]
- Jimenez, J.; Mochón, J.; Formoso, A.; de Ayala, J.S. Burden distribution analysis by digital image processing in a scale model of a blast furnace shaft. ISIJ Int. 2000, 40, 114–120. [Google Scholar] [CrossRef]
- Liang, D.; Yu, Y.W.; Bai, C.G.; Qiu, G.B.; Zhang, S.F. Effect of burden material size on blast furnace stockline profile of bell-less blast furnace. Ironmak. Steelmak. 2009, 36, 217–221. [Google Scholar] [CrossRef]
- Cundall, P.A.; Strack, O.D. A discrete numerical model for granular assemblies. Geotechnique 1979, 29, 47–65. [Google Scholar] [CrossRef]
- Wei, H.; Zhao, Y.; Zhang, J.; Saxén, H.; Yu, Y. LIGGGHTS and EDEM application on charging system of ironmaking blast furnace. Adv. Powder Technol. 2017, 28, 2482–2487. [Google Scholar] [CrossRef]
- Mio, H.; Narita, Y.; Matsuzaki, S.; Nishioka, K.; Nomura, S. Measurement of particle charging trajectory via rotating chute of 1/3-scale blast furnace and its comparing with numerical analysis using Discrete Element Method. Powder Technol. 2019, 344, 797–803. [Google Scholar] [CrossRef]
- Ho, C.K.; Wu, S.M.; Zhu, H.P.; Yu, A.B.; Tsai, S.T. Experimental and numerical investigations of gouge formation related to blast furnace burden distribution. Miner. Eng. 2009, 22, 986–994. [Google Scholar] [CrossRef]
- Zhang, J.; Qiu, J.; Guo, H.; Ren, S.; Sun, H.; Wang, G.; Gao, Z. Simulation of particle flow in a bell-less type charging system of a blast furnace using the discrete element method. Particuology 2014, 16, 167–177. [Google Scholar] [CrossRef]
- Mio, H.; Komatsuki, S.; Akashi, M.; Shimosaka, A.; Shirakawa, Y.; Hidaka, J.; Kadowaki, M.; Matsuzaki, S.; Kunitomo, K. Effect of chute angle on charging behavior of sintered ore particles at bell-less type charging system of blast furnace by discrete element method. ISIJ Int. 2009, 49, 479–486. [Google Scholar] [CrossRef]
- Xu, W.; Cheng, S.; Niu, Q.; Zhao, G. Effect of the cross-section shape of rotating chute on particle flow and burden distribution during the charging process of bell-less top blast furnace with two parallel hoppers. Ironmak. Steelmak. 2019, 46, 105–112. [Google Scholar] [CrossRef]
- Zhou, K.; Jiang, Z.; Pan, D.; Gui, W.; Huang, J.; Xu, C. Research on the velocity distribution law of the coke in the chute of blast furnace based on discrete element method. Comput. Part. Mech. 2023, 10, 303–311. [Google Scholar] [CrossRef]
- Mio, H.; Yamamoto, K.; Shimosaka, A.; Shirakawa, Y.; Hidaka, J. Modeling of solid particle flow in blast furnace considering actual operation by large-scale discrete element method. ISIJ Int. 2007, 47, 1745–1752. [Google Scholar] [CrossRef]
- Kou, M.; Wu, S.; Zhou, H.; Yu, Y.; Xu, J. Numerical investigation of coke collapse and size segregation in the bell-less top blast furnace. ISIJ Int. 2018, 58, 2018–2024. [Google Scholar] [CrossRef]
- Kurosawa, H.; Matsuhashi, S.; Natsui, S.; Kon, T.; Ueda, S.; Inoue, R.; Ariyama, T. DEM-CFD model considering softening behavior of ore particles in cohesive zone and gas flowa analysis at low coke rate in blast furnace. ISIJ Int. 2012, 52, 1010–1017. [Google Scholar] [CrossRef]
- Yu, Y.; Westerlund, A.; Paananen, T.; Saxén, H. Inter-particle percolation segregation during burden descent in the blast furnace. ISIJ Int. 2011, 51, 1050–1056. [Google Scholar] [CrossRef]
- Govender, N.; Wilke, D.N.; Wu, C.-Y.; Tuzun, U.; Kureck, H. A numerical investigation into the effect of angular particle shape on blast furnace burden topography and percolation using a GPU solved discrete element model. Chem. Eng. Sci. 2019, 204, 9–26. [Google Scholar] [CrossRef]
- Wensrich, C.M.; Katterfeld, A. Rolling friction as a technique for modelling particle shape in DEM. Powder Technol. 2012, 217, 409–417. [Google Scholar] [CrossRef]
- Xie, C.; Ma, H.; Zhao, Y. Investigation of modeling non-spherical particles by using spherical discrete element model with rolling friction. Eng. Anal. Bound. Elem. 2019, 105, 207–220. [Google Scholar] [CrossRef]
- Xia, X.; Zhou, L.; Ma, H.; Zhao, Y. Effect of particle shape model on DEM simulation of charging process in blast furnace. J. Iron Steel Res. 2021, 33, 1228–1236. [Google Scholar]
- Ma, H.; Zhou, L.; Liu, Z.; Chen, M.; Xia, X.; Zhao, Y. A review of recent development for the CFD-DEM investigations of non-spherical particles. Powder Technol. 2022, 412, 117972. [Google Scholar] [CrossRef]
- Ning, Z.; Boerefijn, R.; Ghadiri, M.; Thornton, C. Distinct element simulation of impact breakage of lactose agglomerates. Adv. Powder Technol. 1997, 8, 15–37. [Google Scholar] [CrossRef]
- Kruggel-Emden, H.; Elskamp, F. Modeling of screening processes with the discrete element method involving non-spherical particles. Chem. Eng. Technol. 2014, 37, 847–856. [Google Scholar] [CrossRef]
- You, Y.; Zhao, Y. Discrete element modelling of ellipsoidal particles using super-ellipsoids and multi-spheres: A comparative study. Powder Technol. 2018, 331, 179–191. [Google Scholar] [CrossRef]
- Liu, Z.; Ma, H.; Zhao, Y. Comparative study of discrete element modeling of tablets using multi-spheres, multi-super-ellipsoids, and polyhedrons. Powder Technol. 2021, 390, 34–49. [Google Scholar] [CrossRef]
- Hopkins, M.A. Polyhedra faster than spheres? Eng. Comput. 2014, 31, 567–583. [Google Scholar] [CrossRef]
- Feng, Y.T.; Han, K.; Owen, D.R.J. Energy-conserving contact interaction models for arbitrarily shaped discrete elements. Comput. Methods Appl. Mech. Eng. 2012, 205–208, 169–177. [Google Scholar] [CrossRef]
- Liu, Z.; Ma, H.; Zhao, Y. CFD-DEM simulation of fluidization of polyhedral particles in a fluidized bed. Energies 2021, 14, 4939. [Google Scholar] [CrossRef]
- Xie, C.; Song, T.; Zhao, Y. Discrete element modeling and simulation of non-spherical particles using polyhedrons and super-ellipsoids. Powder Technol. 2020, 368, 253–267. [Google Scholar] [CrossRef]
- Hilton, J.; Mason, L.; Cleary, P. Dynamics of gas-solid fluidised beds with non-spherical particle geometry. Chem. Eng. Sci. 2010, 65, 1584–1596. [Google Scholar] [CrossRef]
- Ma, H.; Zhao, Y. Modelling of the flow of ellipsoidal particles in a horizontal rotating drum based on DEM simulation. Chem. Eng. Sci. 2017, 172, 636–651. [Google Scholar] [CrossRef]
- Ma, H.; Zhao, Y. Investigating the fluidization of disk-like particles in a fluidized bed using CFD-DEM simulation. Adv. Powder Technol. 2018, 29, 2380–2393. [Google Scholar] [CrossRef]
- Sun, H.; Ma, H.; Zhao, Y. DEM investigation on conveying of non-spherical particles in a screw conveyor. Particuology 2022, 65, 17–31. [Google Scholar] [CrossRef]
- Lu, G.; Third, J.; Müller, C. Discrete element models for non-spherical particle systems: From theoretical developments to applications. Chem. Eng. Sci. 2015, 127, 425–465. [Google Scholar] [CrossRef]
- Zhong, W.; Yu, A.; Liu, X.; Tong, Z.; Zhang, H. DEM/CFD-DEM modelling of non-spherical particulate systems: Theoretical developments and applications. Powder Technol. 2016, 302, 108–152. [Google Scholar] [CrossRef]
- Mitra, T.; Saxén, H. Simulation of burden distribution and charging in an ironmaking blast furnace. IFAC-PapersOnLine 2015, 48, 183–188. [Google Scholar] [CrossRef]
- Mitra, T.; Saxén, H. Discrete element simulation of charging and mixed layer formation in the ironmaking blast furnace. Comput. Part. Mech. 2016, 3, 541–555. [Google Scholar] [CrossRef]
- Yu, Y.; Saxén, H. Particle flow and behavior at bell-Less charging of the blast furnace. Steel Res. Int. 2013, 84, 1018–1033. [Google Scholar] [CrossRef]
- Mitra, T.; Saxén, H. Investigation of coke collapse in the blast furnace using mathematical modeling and small scale experiments. ISIJ Int. 2016, 56, 1570–1579. [Google Scholar] [CrossRef]
- Yu, Y.; Saxén, H. Effect of DEM parameters on the simulated inter-particle percolation of pellets into coke during burden descent in the blast furnace. ISIJ Int. 2012, 52, 788–796. [Google Scholar] [CrossRef]
- Yu, Y.; Saxén, H. Flow of pellet and coke particles in and from a fixed chute. Ind. Eng. Chem. Res. 2012, 51, 7383–7397. [Google Scholar] [CrossRef]
- Wei, G.; Zhang, H.; An, X.; Jiang, S. Influence of particle shape on microstructure and heat transfer characteristics in blast furnace raceway with CFD-DEM approach. Powder Technol. 2020, 361, 283–296. [Google Scholar] [CrossRef]
- Wei, G.; Zhang, H.; An, X.; Dianyu, E. Numerical investigation on the mutual interaction between heat transfer and non-spherical particle dynamics in the blast furnace raceway. Int. J. Heat Mass Transf. 2020, 153, 119577. [Google Scholar] [CrossRef]
- Wei, G.; Zhang, H.; An, X.; Xiong, B.; Jiang, S. CFD-DEM study on heat transfer characteristics and microstructure of the blast furnace raceway with ellipsoidal particles. Powder Technol. 2019, 346, 350–362. [Google Scholar] [CrossRef]
- You, Y.; Li, Y.; Luo, Z.; Li, H.; Zou, Z.; Yang, R. Investigating the effect of particle shape on the charging process in melter gasifiers in COREX. Powder Technol. 2019, 351, 305–313. [Google Scholar] [CrossRef]
- Xia, X.; Zhou, L.; Ma, H.; Xie, C.; Zhao, Y. Reliability study of super-ellipsoid DEM in representing the packing structure of blast furnace. Particuology 2022, 70, 72–81. [Google Scholar] [CrossRef]
- Zhou, C.; Zhao, Y. Discrete element method and its applications in fluidization. CIESC J. 2014, 65, 2520–2534. [Google Scholar]
- Ma, H.; Zhao, Y. CFD-DEM investigation of the fluidization of binary mixtures containing rod-like particles and spherical particles in a fluidized bed. Powder Technol. 2018, 336, 533–545. [Google Scholar] [CrossRef]
- Ma, H.; Zhao, Y.; Cheng, Y. CFD-DEM modeling of rod-like particles in a fluidized bed with complex geometry. Powder Technol. 2019, 344, 673–683. [Google Scholar] [CrossRef]
- Ma, H.; Zhao, Y. Investigating the flow of rod-like particles in a horizontal rotating drum using DEM simulation. Granul. Matter 2018, 20, 41. [Google Scholar] [CrossRef]
- Zhao, Y.; Xu, L.; Umbanhowar, P.B.; Lueptow, R.M. Discrete element simulation of cylindrical particles using super-ellipsoids. Particuology. 2019, 46, 55–66. [Google Scholar] [CrossRef]
- Barr, A.H. Superquadrics and angle-preserving transformations. IEEE Comput. Graph. Appl. 1981, 1, 11–23. [Google Scholar] [CrossRef]
- Ma, H.; Zhao, Y. An approach to distribute the marker points on non-spherical particle/boundary surface within the IBM-LBM framework. Eng. Anal. Bound. Elem. 2019, 108, 254–266. [Google Scholar] [CrossRef]
Disclaimer/Publisher’s Note: The statements, opinions and data contained in all publications are solely those of the individual author(s) and contributor(s) and not of MDPI and/or the editor(s). MDPI and/or the editor(s) disclaim responsibility for any injury to people or property resulting from any ideas, methods, instructions or products referred to in the content. |
© 2023 by the authors. Licensee MDPI, Basel, Switzerland. This article is an open access article distributed under the terms and conditions of the Creative Commons Attribution (CC BY) license (https://creativecommons.org/licenses/by/4.0/).