Abstract
Injecting power plant flue gas into a goaf stores CO2 in the flue gas and effectively prevents the spontaneous combustion of the coal remaining in the goaf. Here, we investigated the adsorption behavior of three types of coal at normal temperature and pressure using a self-developed adsorption experimental device. We used a specific surface area and porosity analyzer to study the effects of pore structure, mineral content, and moisture content on CO2 adsorption in coal. Based on the experimental data, we designed a multifactor CO2 adsorption prediction model based on a backpropagation (BP) neural network. The results indicated that the pore size of most micropores in coal was in the range of 0.5–0.7 and 0.8–0.9 nm. The specific surface area and pore volume were positively correlated with the CO2-saturated adsorption capacity, whereas the mean pore diameter, mineral content, and moisture content were inversely associated with the CO2-saturated adsorption amount. The accuracy of the multifactor BP neural network prediction model was satisfactory: the determination coefficients (R2) of the training and test sets were both above 0.98, the root mean square error (RMSE) and mean absolute error (MAE) of the test set were both less than 0.1, and the prediction results satisfied the requirements. To optimize the prediction performance of the model, we used the random forest algorithm to calculate the importance of each factor. The sum of the importance weights of the specific surface area, moisture content, and pore volume was 91.6%, which was much higher than that of the other two factors. Therefore, we constructed an optimization model with specific surface area, moisture content, and pore volume as input variables. The R2 values of the training and test sets in the simplified model were improved compared with those of the multifactor model, the RMSE and MAE were reduced, and the fitting effect was ideal. The prediction model of CO2 adsorption in coal based on the BP neural network can predict the CO2 adsorption capacity of coal under different physical and chemical conditions, thereby providing theoretical support for the application of CO2 storage technology in goafs.
1. Introduction
In 2020, the Chinese government set the goals of carbon peaking by 2030 and carbon neutrality by 2060. Carbon capture and storage (CCS) is a technology used to collect and store CO2 to reduce carbon emissions [1]. China has faced limitations in CCS development due to the high cost, large amounts of energy consumed for CO2 capture, and high leakage risk posed by CO2 storage [2,3,4]. Deng et al. [5] proposed injecting the flue gas of a power plant, with CO2 as the main component, into goafs and storing CO2 by using the CO2-adsorption characteristics of the coal in goafs. This would not only reduce the expense of capturing and separating CO2 from flue gas, but also effectively prevent the spontaneous combustion of coal left in the goaf, which is essential for the effective implementation of the national double carbon goals. However, the physical and chemical environments of the goaf are challenging, and many factors affect the adsorption of CO2 by coal seams. These include external factors such as pressure and temperature, as well as internal factors such as the coal pore structure, moisture, and minerals [6,7,8,9]. Chen et al. [10] studied the effect of CH4 replacement with CO2 in aquiferous coal and determined that as the moisture content increased, the adsorption capacity of coal for methane and carbon dioxide gradually weakened. Xie et al. [11] used MATLAB software to comprehensively discuss the influencing factors of CO2 adsorption capacity of shale and determined that the total organic carbon (TOC) content was dominant, playing a major positive role. Quartz quality also had a positive impact. Abunowara et al. [12] reported that coal and rock exhibited temperature sensitivity to CO2 adsorption, and their CO2 adsorption capacity significantly decreased under high temperature conditions. Zhou et al. [13] analyzed the combined effects of temperature, particle size, and moisture content on CO2 adsorption using a response surface model and discovered that particle size and moisture content had the strongest combined effect, followed by temperature and particle size, while temperature and moisture content had the weakest combined effect.
For many years, traditional adsorption models, including the Langmuir, D-A, D-R, and BET models, have been used to fit the experimental data of CO2 adsorption [14,15,16]. Han et al. [17] conducted CO2 isothermal adsorption experiments on coal and rock under different temperature conditions and established an improved evaluation model for coal seam CO2 storage capacity. Although the traditional isothermal adsorption models can accurately explain the experimental data, these mechanism models are limited to specific temperatures, assumptions, and types of coal, and the experimental process is complex. Using existing adsorption data, Yu et al. [18] established a multiple linear regression equation of CO2 adsorption amount and coal quality index parameters using SPSS software, and analyzed the influence of the coal quality index on CO2 adsorption characteristics. In 2019, Meng et al. [19] proposed an innovative adsorption model based on a machine learning method that overcame the limitations imposed by coal type and could predict the adsorption behavior of coal according to basic coal physical and chemical parameters. Therefore, it is necessary to conduct research on prediction models for CO2 adsorption capacity of coal, obtain the optimal conditions for CO2 storage in goaf coal seams, and predict the CO2 storage capacity under different physical and chemical conditions in goaf.
However, neither the traditional isothermal adsorption model nor the temperature–pressure comprehensive adsorption model can be used to analyze simultaneous changes in moisture content, pore structure, and mineral content [20]. In machine learning models, the prediction of the amount of CO2 adsorbed by coal seams is a multiple regression problem [21]. With sufficient data, models based on machine learning can include all relevant variables. Therefore, in this study, we selected five influencing factors: specific surface area, pore volume, mean pore diameter, mineral content, and moisture content. We used a self-developed experimental device to perform CO2 adsorption experiments with coal at normal temperature and pressure. Based on a large amount of experimental data, we designed a multifactor coupling influencing the CO2 adsorption model based on a backpropagation (BP) neural network, and calculated the importance weight of each factor using a random forest algorithm to obtain the optimization model. The study results provide theoretical support for the application of CO2 sequestration technology in goafs and are of practical value for reducing greenhouse gas emissions.
2. Materials and Methods
2.1. Coal Preparation
We extracted three types of coal samples, lignite, 1/3 coking coal, and gaseous coal, from the goaf of the Dananhu (DNH), Junde (JD), and Tongxin (TX) coal mines in Xinjiang, Heilongjiang, and Shanxi, respectively. The industrial and elemental analyses are shown in Table 1.
Table 1.
Industrial analysis and elemental analysis of three coal samples.
We used a crusher to crush the raw coal to a particle size of <60 mesh (0.18 mm). In accordance with the national standard GB/T 7560-2001, we soaked the samples in aqueous HCl (5 mol/L) and HF (40%). After filtration, washing, and vacuum drying for 4 h, we obtained demineralized dry coal samples, which were marked as DNH-daf, JD-daf, and TX-daf and stored in a vacuum box.
To obtain dry coal samples with different mineral contents, we weighed six 200 g of DNH-daf, JD-daf, and TX-daf coal samples and subsequently added a certain amount of dry minerals with a particle size below 200 mesh (0.074 mm) [22]. We successively prepared coal samples with mineral contents of 0%, 3%, 6%, 9%, 12%, and 15%, which were labeled as DNH-M%, JD-M%, and TX-M%, where M% is the mineral content percentage. To simulate the actual mineral composition of coal [23], the mass ratio of each component in the mineral was millite:mkaolinite:mcalcium carbonate:mhematite:msilica powder = 2.5:22.5:1.7:0.7:2.6.
To produce demineralized coal samples with different moisture contents, we weighed seven 200 g DNH-daf, JD-daf, and TX-daf coal samples. We used a spray device to spray a certain amount of distilled water in the coal samples, which we then sealed and let stand for 12 h. The percentage of moisture quality and coal sample mass after water spraying was the actual moisture content of the coal sample. We successively prepared coal samples with water contents of 0%, 2%, 5%, 7%, 9%, 12%, and 15%, which were labeled as DNH-W%, JD-W%, and TX-W%, where W% is the moisture content.
2.2. Measurement of Pore Structure of Coal Samples
Micropores are the main adsorption pores of coal [24]. Therefore, we used an ASAP2020 specific surface area and porosity analyzer (Micromeritics Company, Norcross, GA, USA) to conduct isothermal adsorption experiments on the DNH-daf, JD-daf, and TX-daf coal samples using CO2 as the probe. We used nonlocal density functional theory to calculate the micropore diameter (D), specific surface area (S), and pore volume (V) of the three coal samples. The results are presented in Table 2. It can be seen that DNH coal samples have the largest specific surface area and pore volume followed by JD coal, and TX coal has the smallest, while the average pore size is exactly the opposite.
Table 2.
Pore structure parameters of three demineralized dry coal samples.
2.3. Adsorption Experiment
We used a self-developed coal adsorption device in the adsorption experiment, as shown in Figure 1. To simulate the concentration of CO2 in the flue gas of a power plant, the CO2 concentration in the adsorbed gas was set to approximately 16%. To eliminate any interference from other gases in the flue gas, we used Ar as the mixed background gas.
Figure 1.
CO2 adsorption experimental system under normal temperature and pressure.
The experimental process involved placing the treated coal sample into the adsorption cylinder and degassing the adsorption cylinder using a vacuum pump after sealing to achieve a pressure of approximately −0.09 MPa. After degassing, we injected the experimental gas into the adsorption cylinder using a gas supply device; the pressure in the cylinder was slightly higher than 0.1 MPa. We determined the volume fraction of CO2 in the cylinder every 30 min using a gas chromatograph, and we simultaneously recorded the pressure in the cylinder and ambient temperature for 6 h. Furthermore, we calculated the CO2 content in the free phase of the cylinder before and after adsorption using the ideal gas state equation. The difference was the amount of CO2 adsorbed by the coal sample, as shown in Equation (1).
where Vi is the gas adsorption volume per gram of coal at a certain time point (cm3·g−1); Vm is the molar volume of gas under normal temperature (25 °C) and pressure, 24.5 L/mol; n0 is the amount of CO2 injected into the adsorption cylinder before adsorption (mol); ni is the amount of CO2 in the adsorption cylinder at the ith recording time (mol); and m is the mass of coal (g).
3. Results
3.1. Effect of Pore Structure on CO2 Adsorption
Figure 2 shows the curve of the change in CO2 adsorption capacity of the demineralized dry coal samples with time. We determined that the coal samples rapidly adsorbed CO2 within the first hour at the beginning of adsorption, after which the CO2 adsorption rate on the coal samples slowed and was stabilized after 4–6 h. We considered the average value of the adsorption amount during this period as the saturated adsorption amount Q of the coal samples for CO2. The difference in CO2-saturated adsorption capacity among the three coal samples was substantial. DNH coal had the highest saturated adsorption capacity, followed by JD and then TX coal. Because we demineralized and dried the coal samples, minerals and moisture had no influence on the adsorption of CO2 by the coal. The difference in pore structure was the reason for the difference in saturated CO2 adsorption.
Figure 2.
The adsorption capacity curve of demineralized dry coal samples.
Figure 3 shows the specific surface area, pore volume, and curve of the coal samples in the microporous range. In the figure, the cumulative specific surface area and pore volume curves of the three coal samples exhibit the same trend. The cumulative specific surface area and pore volume gradually increased with increasing pore size, indicating the presence of micropores <1 nm in the coal. The cumulative specific surface area and pore volume of DNH coal were the largest, followed by those of JD and TX coals, which was consistent with the order of the saturated CO2 adsorption amount of the three coal samples.
Figure 3.
Specific surface area, pore volume and its increment curve of coal samples in microporous range. (a) Specific surface area and its increment curve. (b) Pore volume and its increment curve.
The curves of the specific surface area and pore volume increase in the coal samples reached maximum values in the pore diameter range of 0.5–0.7 and 0.8–0.9 nm, respectively, indicating the existence of many pores in these ranges. The curves of the specific surface area and pore volume increase reached their minimum values in the range of 0.7–0.8 nm, indicating that few pores were present in this size range. The pore size distribution laws of the three coal samples were similar, but the curves of the specific surface area and pore volume increase in DNH coal within the same pore size range were considerably higher than those of the other two coal samples. This was because DNH coal had more micropores within the same pore size range, which could provide more adsorption sites for CO2 adsorption, resulting in its saturated adsorption capacity being higher than that of the other two coal samples.
To explore the influence of pore structure on the CO2-saturated adsorption capacity, we plotted the relationship between the total specific surface area, total pore volume, and mean pore diameter of the coal samples measured in the experiment with CO2-saturated adsorption, as shown in Figure 4. The specific surface area and pore volume of DNH coal sample are significantly higher than those of the other two coal samples, while the average pore size of TX coal sample is the largest, indicating that the micropores of DNH coal samples are more developed. The determination coefficient (R2) of total specific surface area and CO2-saturated adsorption capacity was the highest, at 0.955, indicating that the specific surface area was the main factor affecting CO2-saturated adsorption capacity. Both the specific surface area and pore volume were positively correlated with the saturated adsorption capacity of CO2 due to the larger total specific surface area and total pore volume of coal, which provided more adsorption sites and thus facilitated the adsorption of CO2 by coal [25]. However, the mean pore diameter negatively correlated with the CO2-saturated adsorption capacity. This may be because intermolecular forces were the main factor affecting the CO2 adsorption effect. The smaller the pore diameter of each micropore, the higher the adsorption potential energy between the pore walls (due to the overlap of van der Waals force fields), and the higher the CO2 adsorption capacity [26]. Additionally, the smaller the average pore diameter and the larger the number of micropores, the larger was the total specific surface area. As the specific surface area more strongly affected the CO2-saturated adsorption capacity, the saturated adsorption capacity of CO2 by coal decreased with increasing pore diameter.
Figure 4.
Relationship between (a) specific surface area, (b) pore volume and (c) pore size and CO2 saturated adsorption capacity.
3.2. Influence of Mineral Content on CO2 Adsorption
Figure 5 shows the CO2 adsorption curves of dry coal samples with different mineral contents. Similar to the demineralized dry coal samples, the variation in the CO2 adsorption amount for each coal sample over time was consistent. With an increase in the mineral content, the CO2 adsorption capacity of coal showed a decreasing trend because the minerals occupied the pore space in the coal, leading to a reduction in the number of coal adsorption sites and thus reducing the CO2 adsorption capacity of coal. The CO2 adsorption capacity of the three coal samples decreased with increasing mineral content to varying degrees, among which the saturated adsorption capacity of DNH coal decreased the most and that of TX coal decreased the least with increasing mineral content. This may have occurred because among the three coal samples with the same mineral contents, DNH coal had the largest number of micropores, which led to more minerals filling the micropores of coal in the form of bands and lumps [27]. Accordingly, we determined that the mineral content more strongly impacted the CO2 adsorption capacity of DNH coal.
Figure 5.
CO2 adsorption curves of coal samples with different mineral contents.
3.3. Effect of Moisture Content on CO2 Adsorption
Figure 6 shows the CO2 adsorption curves of the coal samples with different moisture contents. When the water content was less than 9%, the CO2-saturated adsorption capacity of the coal sample decreased with the increase in the moisture content. However, the saturated adsorption capacity of the three coal samples differed with the degree of water content reduction: the capacity of DNH coal was highest followed by those of JD coal and then TX coal. This occurred because the water molecules entered the coal body and occupied the pores [28]. The number of micropores in the DNH coal sample was the largest, leading to a higher reduction in the number of effective adsorption sites, and thus the adsorption capacity of DNH coal decreased. As the moisture content gradually increased, its influence on the adsorption capacity gradually decreased. When the moisture content was higher than 9%, the adsorption curves of coal with different moisture contents tended to overlap. This occurred because with the increase in moisture content, water molecules gradually filled the cracks of coal, thereby blocking the diffusion channel of CO2 molecules and preventing the entry of CO2 molecules into the pores of the coal.
Figure 6.
CO2 adsorption curves of coal samples at different moisture contents.
4. BP Neural Network Prediction Model
4.1. Sample Data
Based on the previous experimental studies, we determined that the mean pore diameter, specific surface area, pore volume, moisture content, and mineral content affected CO2 adsorption by coal. Therefore, to establish a model for predicting the CO2-saturated adsorption capacity of goaf residual coal under the influence of multiple factors, we designed 126 groups of experiments using the control variable method to test the CO2-saturated adsorption capacity of the three types of coal under various mineral and moisture contents. The experimental results are listed in Table A1; the statistical results for each variable in the experiment are presented in Table 3.
Table 3.
The data of each characteristic parameter of the experiment.
Owing to the large difference in the order of magnitude of each variable, the prediction model would have large errors. To ensure that the BP neural network would converge well and map the relationship, and to weaken the influence of data of different magnitudes for various factors on the network model training and prediction values, we used Equation (2) to normalize the experimental data. Subsequently, we converted all data of the training samples to the interval [0, 1].
where Xi is the independent variable in the sample data; Xmax and Xmin are the maximum and minimum values of the independent variables in the sample data, respectively; and Xin is the normalized independent variable.
4.2. Model Structure
A BP neural network is a multilayer feedforward network with forward signal transmission and back error transmission [29], which is applicable to scenarios where multiple structural characteristic parameters, complex influencing factors, and nonlinear relationships are being studied. The BP neural network comprises input, hidden, and output layers. The algorithm compares the expected output with the network output to obtain the error value, backpropagates the error value, modifies the weight value and threshold value layer by layer until the error value reaches the preset error range, and completes the learning and memorization of information.
In this study, we selected five neurons in the input layer and one in the output layer. Increasing the number of hidden layer neurons can improve the mapping ability of BP neural networks, but when the number of neurons exceeds a certain value, the network performance deteriorates [30]. Therefore, the mean square error (MSE) and correlation coefficient® are generally used to determine the number of hidden layer neurons. Figure 7 shows the MSE and R values for different numbers of neurons.
Figure 7.
MSE and R values under different numbers of neurons.
Figure 7 shows that when the number of neurons was 12, the BP neural network performance was the best in terms of overall trend: the MSE was the lowest, the R value was the highest, the network convergence speed was faster, and the network was more stable. Therefore, we determined that the appropriate structure of the BP neural network was 5-12-1. We constructed a network structure, as shown in Figure 8, and used five factors (S, V, D, mineral content [M], and moisture content [W]) as the inputs of the BP neural network. Additionally, we used the saturated adsorption capacity of CO2 (Q) as the output of the network.
Figure 8.
Structure diagram of BP neural network.
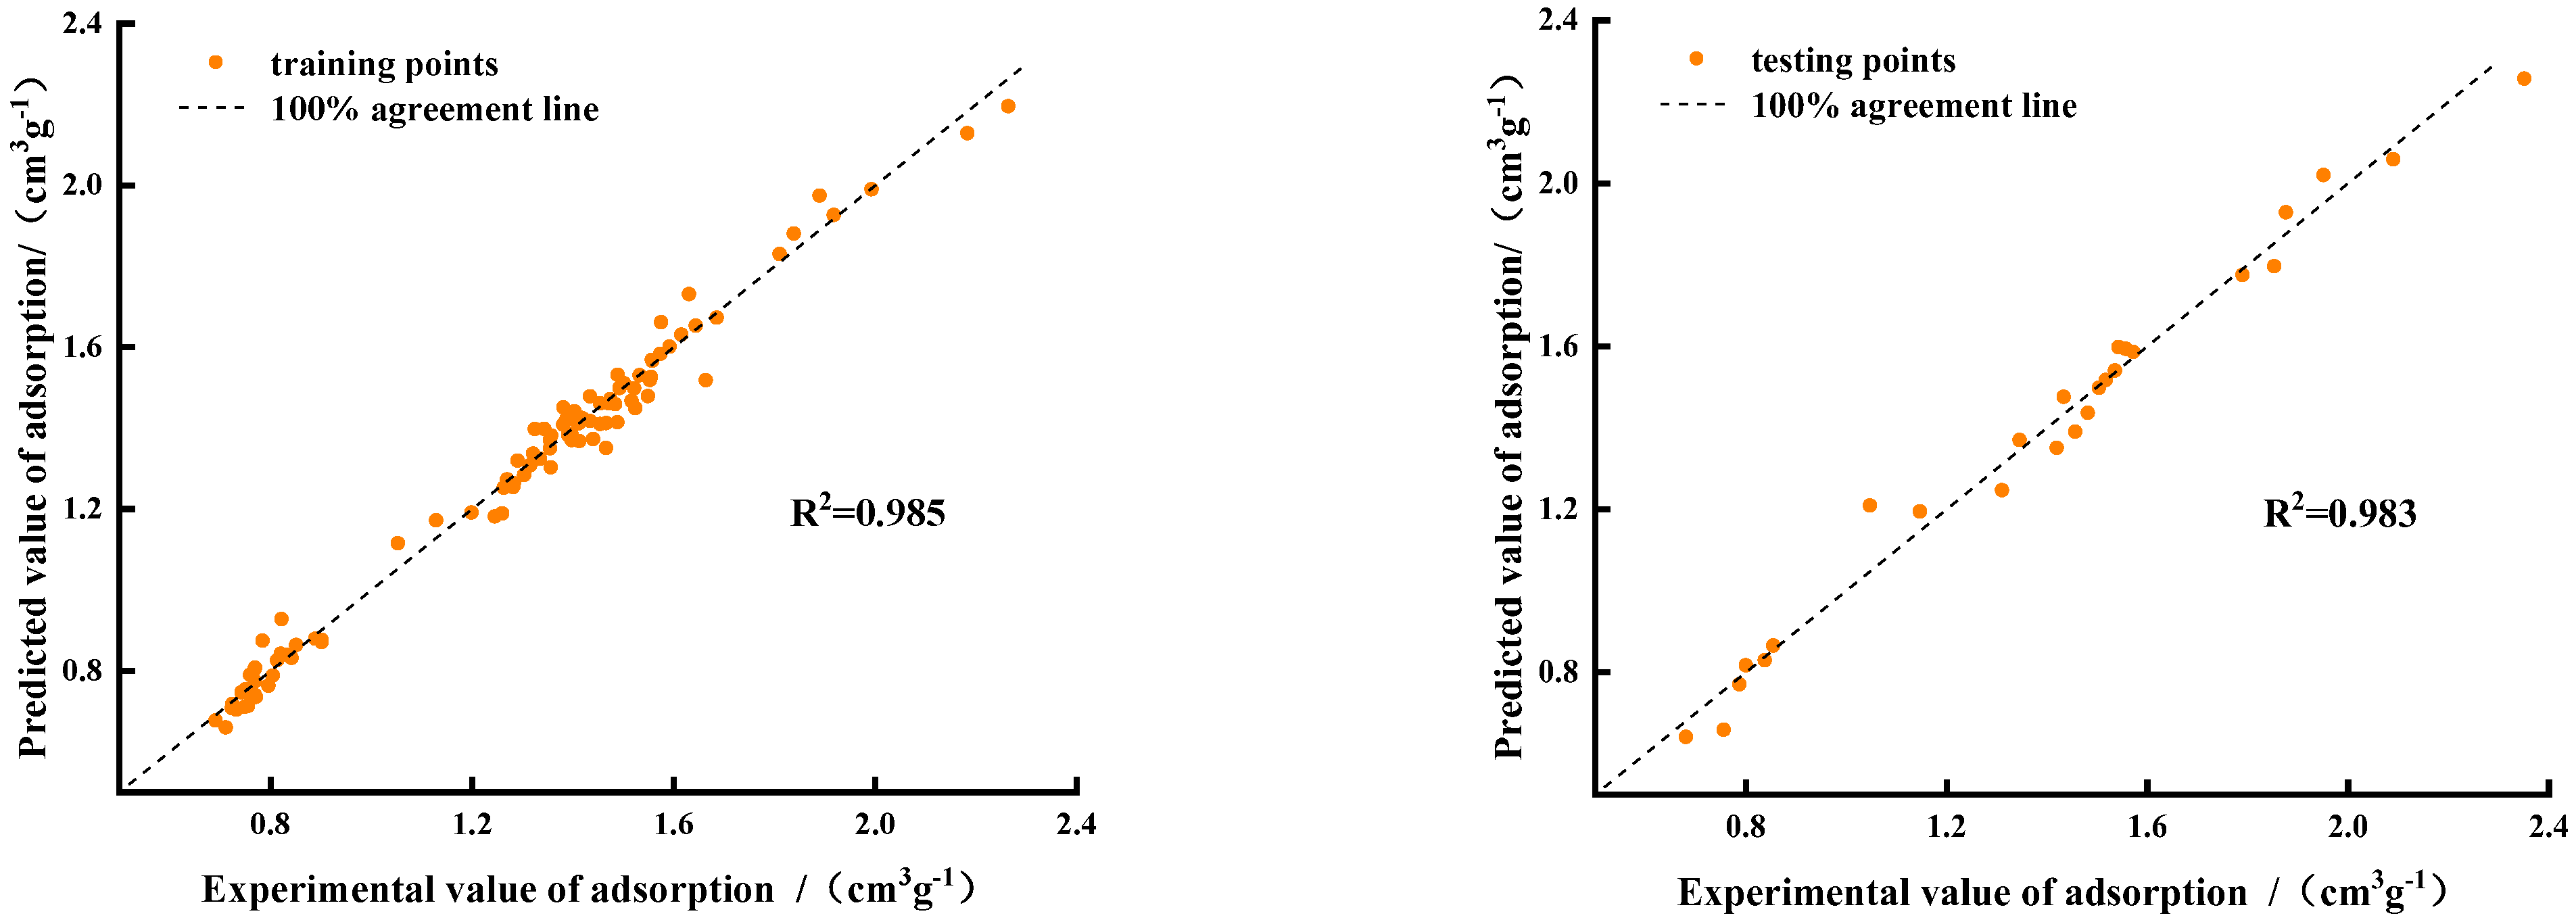
4.3. Model Training and Result Analysis
We randomly selected 80% (100 groups of data) of the experimental data as training samples, and used the remaining 20% (26 groups of data) as test samples. We continuously adjusted the learning rate as the number of iterations changes, determined the learning rate corresponding to the fastest decrease in loss, and ultimately set the initial learning rate to 0.4. In order to obtain the minimum value of the loss function, we set the minimum expected error to 0.0001, and the maximum number of iterations to 7000. Because the order of magnitude of the variables differed considerably, and the tanh function has the best effect when the features are remarkably different, we used tanh as the excitation function between the input and hidden layers. To maintain the numerical scaling of any previous range and facilitate comparison with the sample values, we used purelin as the activation function between the hidden and output layers [31].
where M is the mineral content, %; W is the moisture content, %; V is the pore volume, cm3 g−1; D is the mean pore diameter, nm; S is the specific surface area, m2 g−1; w1,i, w2,i, w3,i, w4,i, and w5,i are the connection weights of each neuron from the input layer to the hidden layer; w6,i is the connection weight of each neuron from the hidden layer to the output layer; bi is the bias between the neurons in the input and hidden layers; b0 is the bias between the hidden- and output-layer neurons. Table 4 shows the optimal fitting results for all parameters.
Table 4.
Optimal fitting parameters of BP neural network.
Figure 9 shows a joint scatter plot of the predicted CO2-saturated adsorption amount calculated using the BP neural network model and the experimental value. In the figure, the x-axis represents the actual adsorption amount measured in the experiment, and the y-axis represents the adsorption amount predicted by the neural network. The black dotted line represents the 100% regression line. The closer the scatter is to the black dotted line, the more accurate the prediction of the neural network algorithm. Figure 8 shows that the data points of the training and test sets are distributed near the regression line, indicating that the trained model had high prediction accuracy.
Figure 9.
Performance of BP neural network training set and test set.
We evaluated the model to verify its accuracy. From a statistical point of view, we could not use a single performance index for the evaluation. Therefore, we selected three performance indicators, namely determination coefficient (R2), root mean square error (RMSE), and mean absolute error (MAE) to comprehensively evaluate the model. The calculation methods are shown in Equations (4)–(6), respectively.
where , , and are the predicted, actual, and average values of the target characteristics, respectively; and n is the total number of data.
Table 5 presents the results of the evaluation indices. The R2 of the model for the training and test data was 0.985 and 0.983, respectively, which proved that the proposed adsorption model could accurately predict the saturated CO2 adsorption amount from coal seams in the goaf under multifactor conditions. The R2 difference between the training and test set was 0.002, which is small, indicating that the model was not overfit and had a certain generalization ability. Overfitting means that the model accurately reflects the noise and random fluctuation in the training data, but performs poorly in the test set, thus reducing the generalizability of the model [32]. In the test set, the RMSE and MAE were 0.055 and 0.045, respectively, which are both less than 0.1, indicating that the dispersion and deviation between the real and predicted values were small. The prediction results satisfy the requirements for predicting the saturated CO2 adsorption by coal.
Table 5.
Evaluation indexes of BP neural network model.
5. Optimization Model
According to Equation (3), the model could predict the CO2-saturated adsorption capacity of coal samples with certain mineral and moisture contents, mean pore diameter, pore volume, and specific surface area. However, Equation (3) is complex with too many input parameters, and researchers may not always be able to provide all these basic parameters. Predicting the CO2-saturated adsorption capacity with fewer parameters would be more practical and helpful, and could improve the performance of the prediction model. To explore the importance of various factors on CO2 adsorption by coal, we used scikit-learn with a random forest algorithm to calculate the importance of each feature [33]. Scikit-learn automatically calculates the score of each feature after training and then normalizes the results so that the sum of the importance of all features equals one. Figure 9 shows the calculated results for the importance of mineral content, moisture content, mean pore diameter, pore volume, and specific surface area.
Figure 10 shows the overall influence of the five input characteristics on the target variable. The specific surface area was the most influential factor among the five factors, and water content was more influential than pore volume. Moreover, the sum of the importance weights of the specific surface area, moisture content, and hole volume was 91.6%, which was much higher than those of the other two factors. However, the mean pore diameter and mineral content had little effect on the adsorption capacity.
Figure 10.
Importance weight of each factor.
Based on the above analysis and to simplify the input parameters of the model, we used the specific surface area, moisture content, and pore volume as the input units, and the BP neural network model parameter settings were the same as above. We established the functional expression of CO2-saturated adsorption capacity as the output unit as follows:
The optimal fitting results of all parameters are shown in Table 6.
Table 6.
Optimal fitting parameters of optimization model.
Figure 11 shows that the data points of the three-variable model are distributed near the regression line; the R2 of the training set was 0.991 and that of the test set was 0.988, which also showed that the model prediction accuracy was high. Compared with the multifactor prediction model (3), the prediction results of the simplified model (7) were closer to the verified data. To test the accuracy of the simplified model, we compared the real and predicted values of the training and test sets, and we calculated the evaluation indicators, which are listed in Table 7.
Figure 11.
Performance of optimized BP neural network model training and testing sets.
Table 7.
Evaluation indexes of optimized BP neural network model.
Table 7 shows that the RMSE and MAE of model (7) were lower than those of Model (3) by 0.6% and 1.5%, respectively. The RMSE and MAE on the test set were lower by 0.1% and 1.6%, respectively, and the fitting effect was more ideal. The simplified model not only provides more accurate prediction results, but also has a more direct expression. The proposed CO2 saturation adsorption prediction model breaks the limitation of coal types. By measuring the basic parameters of coal samples from different goaf areas, the adsorption capacity of CO2 by coal can be predicted.
6. Conclusions
The article analyzes the effects of pore structure, mineral content, and water content on the adsorption of CO2 by coal based on a large amount of experiment, and a multi-factor CO2 adsorption prediction model based on BP neural network is proposed, which is of great significance for evaluating the capacity of CO2 storage in abandoned coal mines. The conclusions are summarized as follows:
- (1)
- The pore size distributions of the three coal samples were largely similar, DNH coal had the most micropores in each pore size range, and TX coal had the fewest. The CO2-saturated adsorption capacity of coal was positively correlated with the specific surface area and pore volume, and negatively correlated with the mean pore diameter, mineral content, and moisture content. When the moisture content was higher than 9%, the influence of water content on the saturated adsorption tended to be stable because water molecules hindered the CO2 diffusion channels.
- (2)
- The BP neural network prediction model with mineral content, moisture content, mean pore diameter, pore volume, and specific surface area as input variables had high accuracy: the R2 values on the training and test sets were both higher than 0.98, and the RMSE and MAE on the test set were both less than 0.1. The prediction results met the expected requirements.
- (3)
- To optimize the prediction performance of the model, we used a random forest algorithm to calculate the importance of each factor. We determined that the sum of the importance weights of the specific surface area, moisture content, and pore volume was 91.6%, which was much higher than that of the other two factors. Therefore, we constructed a simplified model with the specific surface area, moisture content, and pore volume as the input variables. Compared with the multifactor model, the R2 of the training and test sets of the simplified model was higher, whereas the RMSE and MAE were lower, and the fitting effect was more accurate.
Author Contributions
F.G.: Supervision, Resources, Writing—review and editing, Validation; P.W.: Conceptualization, Methodology, Writing—original draft; D.W.: Project administration, Data curation; Y.Y.: Funding acquisition; X.Z.: Software; G.B.: Visualization. All authors have read and agreed to the published version of the manuscript.
Funding
This work was financially supported by the National Natural Science Foundation of China (51874161, 52074147, 52274204).
Data Availability Statement
The [CO2 adsorption capacity] data used to support the results of this study is included in Appendix A; The remaining data used to support the findings of this study are available from the corresponding author upon request.
Conflicts of Interest
The authors declare that they have no known competing financial interests or personal relationships that could have appeared to influence the work reported in this paper.
Appendix A
Table A1.
Test results of control variable method.
Table A1.
Test results of control variable method.
| No. | Mineral Content (%) | Moisture Content (%) | Pore Volume (cm3 g−1) | Pore Width (nm) | Specific Surface Area (m2 g−1) | Adsorption Amount (cm3 g−1) |
|---|---|---|---|---|---|---|
| 1 | 0 | 0 | 0.03851 | 0.568 | 132.38 | 2.351122912 |
| 2 | 3 | 0 | 0.03851 | 0.568 | 132.38 | 2.263786921 |
| 3 | 6 | 0 | 0.03851 | 0.568 | 132.38 | 2.182949968 |
| 4 | 9 | 0 | 0.03851 | 0.568 | 132.38 | 2.090050028 |
| 5 | 12 | 0 | 0.03851 | 0.568 | 132.38 | 1.992612003 |
| 6 | 15 | 0 | 0.03851 | 0.568 | 132.38 | 1.917846123 |
| 7 | 0 | 2 | 0.03851 | 0.568 | 132.38 | 1.85279631 |
| 8 | 0 | 5 | 0.03851 | 0.568 | 132.38 | 1.685271318 |
| 9 | 0 | 7 | 0.03851 | 0.568 | 132.38 | 1.643701437 |
| 10 | 0 | 9 | 0.03851 | 0.568 | 132.38 | 1.615139692 |
| 11 | 0 | 12 | 0.03851 | 0.568 | 132.38 | 1.571735379 |
| 12 | 0 | 15 | 0.03851 | 0.568 | 132.38 | 1.55467822 |
| 13 | 3 | 2 | 0.03851 | 0.568 | 132.38 | 1.630202661 |
| 14 | 3 | 5 | 0.03851 | 0.568 | 132.38 | 1.591743463 |
| 15 | 3 | 7 | 0.03851 | 0.568 | 132.38 | 1.573359782 |
| 16 | 3 | 9 | 0.03851 | 0.568 | 132.38 | 1.556722672 |
| 17 | 3 | 12 | 0.03851 | 0.568 | 132.38 | 1.535297912 |
| 18 | 3 | 15 | 0.03851 | 0.568 | 132.38 | 1.521458693 |
| 19 | 6 | 2 | 0.03851 | 0.568 | 132.38 | 1.575013315 |
| 20 | 6 | 5 | 0.03851 | 0.568 | 132.38 | 1.532489236 |
| 21 | 6 | 7 | 0.03851 | 0.568 | 132.38 | 1.517203444 |
| 22 | 6 | 9 | 0.03851 | 0.568 | 132.38 | 1.501267535 |
| 23 | 6 | 12 | 0.03851 | 0.568 | 132.38 | 1.492639572 |
| 24 | 6 | 15 | 0.03851 | 0.568 | 132.38 | 1.474250565 |
| 25 | 9 | 2 | 0.03851 | 0.568 | 132.38 | 1.556956357 |
| 26 | 9 | 5 | 0.03851 | 0.568 | 132.38 | 1.51609469 |
| 27 | 9 | 7 | 0.03851 | 0.568 | 132.38 | 1.483624762 |
| 28 | 9 | 9 | 0.03851 | 0.568 | 132.38 | 1.471496057 |
| 29 | 9 | 12 | 0.03851 | 0.568 | 132.38 | 1.453800003 |
| 30 | 9 | 15 | 0.03851 | 0.568 | 132.38 | 1.433440237 |
| 31 | 12 | 2 | 0.03851 | 0.568 | 132.38 | 1.488459061 |
| 32 | 12 | 5 | 0.03851 | 0.568 | 132.38 | 1.466026662 |
| 33 | 12 | 7 | 0.03851 | 0.568 | 132.38 | 1.454078559 |
| 34 | 12 | 9 | 0.03851 | 0.568 | 132.38 | 1.433651718 |
| 35 | 12 | 12 | 0.03851 | 0.568 | 132.38 | 1.410745839 |
| 36 | 12 | 15 | 0.03851 | 0.568 | 132.38 | 1.401701778 |
| 37 | 15 | 2 | 0.03851 | 0.568 | 132.38 | 1.434080668 |
| 38 | 15 | 5 | 0.03851 | 0.568 | 132.38 | 1.412549898 |
| 39 | 15 | 7 | 0.03851 | 0.568 | 132.38 | 1.397531683 |
| 40 | 15 | 9 | 0.03851 | 0.568 | 132.38 | 1.356791458 |
| 41 | 15 | 12 | 0.03851 | 0.568 | 132.38 | 1.342959591 |
| 42 | 15 | 15 | 0.03851 | 0.568 | 132.38 | 1.324337967 |
| 43 | 0 | 0 | 0.02091 | 0.85 | 93.198 | 1.951122912 |
| 44 | 3 | 0 | 0.02091 | 0.85 | 93.198 | 1.889568493 |
| 45 | 6 | 0 | 0.02091 | 0.85 | 93.198 | 1.876259611 |
| 46 | 9 | 0 | 0.02091 | 0.85 | 93.198 | 1.838473984 |
| 47 | 12 | 0 | 0.02091 | 0.85 | 93.198 | 1.810181965 |
| 48 | 15 | 0 | 0.02091 | 0.85 | 93.198 | 1.789616843 |
| 49 | 0 | 2 | 0.02091 | 0.85 | 93.198 | 1.66378542 |
| 50 | 0 | 5 | 0.02091 | 0.85 | 93.198 | 1.419339798 |
| 51 | 0 | 7 | 0.02091 | 0.85 | 93.198 | 1.402840159 |
| 52 | 0 | 9 | 0.02091 | 0.85 | 93.198 | 1.381119521 |
| 53 | 0 | 12 | 0.02091 | 0.85 | 93.198 | 1.395036416 |
| 54 | 0 | 15 | 0.02091 | 0.85 | 93.198 | 1.390437306 |
| 55 | 3 | 2 | 0.02091 | 0.85 | 93.198 | 1.548979178 |
| 56 | 3 | 5 | 0.02091 | 0.85 | 93.198 | 1.456424261 |
| 57 | 3 | 7 | 0.02091 | 0.85 | 93.198 | 1.411376369 |
| 58 | 3 | 9 | 0.02091 | 0.85 | 93.198 | 1.387666795 |
| 59 | 3 | 12 | 0.02091 | 0.85 | 93.198 | 1.380848091 |
| 60 | 3 | 15 | 0.02091 | 0.85 | 93.198 | 1.35472688 |
| 61 | 6 | 2 | 0.02091 | 0.85 | 93.198 | 1.481463143 |
| 62 | 6 | 5 | 0.02091 | 0.85 | 93.198 | 1.465782153 |
| 63 | 6 | 7 | 0.02091 | 0.85 | 93.198 | 1.440040993 |
| 64 | 6 | 9 | 0.02091 | 0.85 | 93.198 | 1.396502878 |
| 65 | 6 | 12 | 0.02091 | 0.85 | 93.198 | 1.354245284 |
| 66 | 6 | 15 | 0.02091 | 0.85 | 93.198 | 1.31527864 |
| 67 | 9 | 2 | 0.02091 | 0.85 | 93.198 | 1.419456467 |
| 68 | 9 | 5 | 0.02091 | 0.85 | 93.198 | 1.356062195 |
| 69 | 9 | 7 | 0.02091 | 0.85 | 93.198 | 1.334571319 |
| 70 | 9 | 9 | 0.02091 | 0.85 | 93.198 | 1.321037039 |
| 71 | 9 | 12 | 0.02091 | 0.85 | 93.198 | 1.290009358 |
| 72 | 9 | 15 | 0.02091 | 0.85 | 93.198 | 1.28157462 |
| 73 | 12 | 2 | 0.02091 | 0.85 | 93.198 | 1.34542688 |
| 74 | 12 | 5 | 0.02091 | 0.85 | 93.198 | 1.310368091 |
| 75 | 12 | 7 | 0.02091 | 0.85 | 93.198 | 1.282575827 |
| 76 | 12 | 9 | 0.02091 | 0.85 | 93.198 | 1.269113512 |
| 77 | 12 | 12 | 0.02091 | 0.85 | 93.198 | 1.262636166 |
| 78 | 12 | 15 | 0.02091 | 0.85 | 93.198 | 1.259852608 |
| 79 | 15 | 2 | 0.02091 | 0.85 | 93.198 | 1.30294852 |
| 80 | 15 | 5 | 0.02091 | 0.85 | 93.198 | 1.24487263 |
| 81 | 15 | 7 | 0.02091 | 0.85 | 93.198 | 1.198464723 |
| 82 | 15 | 9 | 0.02091 | 0.85 | 93.198 | 1.146836779 |
| 83 | 15 | 12 | 0.02091 | 0.85 | 93.198 | 1.12854191 |
| 84 | 15 | 15 | 0.02091 | 0.85 | 93.198 | 1.052667414 |
| 85 | 0 | 0 | 0.01544 | 0.97 | 75.843 | 1.557429647 |
| 86 | 3 | 0 | 0.01544 | 0.97 | 75.843 | 1.552752651 |
| 87 | 6 | 0 | 0.01544 | 0.97 | 75.843 | 1.542438976 |
| 88 | 9 | 0 | 0.01544 | 0.97 | 75.843 | 1.523701004 |
| 89 | 12 | 0 | 0.01544 | 0.97 | 75.843 | 1.503427565 |
| 90 | 15 | 0 | 0.01544 | 0.97 | 75.843 | 1.48793197 |
| 91 | 0 | 2 | 0.01544 | 0.97 | 75.843 | 1.047077437 |
| 92 | 0 | 5 | 0.01544 | 0.97 | 75.843 | 0.901155248 |
| 93 | 0 | 7 | 0.01544 | 0.97 | 75.843 | 0.901154164 |
| 94 | 0 | 9 | 0.01544 | 0.97 | 75.843 | 0.888796492 |
| 95 | 0 | 12 | 0.01544 | 0.97 | 75.843 | 0.850413237 |
| 96 | 0 | 15 | 0.01544 | 0.97 | 75.843 | 0.837536417 |
| 97 | 3 | 2 | 0.01544 | 0.97 | 75.843 | 0.854357295 |
| 98 | 3 | 5 | 0.01544 | 0.97 | 75.843 | 0.841515153 |
| 99 | 3 | 7 | 0.01544 | 0.97 | 75.843 | 0.83332657 |
| 100 | 3 | 9 | 0.01544 | 0.97 | 75.843 | 0.820373017 |
| 101 | 3 | 12 | 0.01544 | 0.97 | 75.843 | 0.812911451 |
| 102 | 3 | 15 | 0.01544 | 0.97 | 75.843 | 0.80442598 |
| 103 | 6 | 2 | 0.01544 | 0.97 | 75.843 | 0.82152556 |
| 104 | 6 | 5 | 0.01544 | 0.97 | 75.843 | 0.76488891 |
| 105 | 6 | 7 | 0.01544 | 0.97 | 75.843 | 0.767667102 |
| 106 | 6 | 9 | 0.01544 | 0.97 | 75.843 | 0.769085643 |
| 107 | 6 | 12 | 0.01544 | 0.97 | 75.843 | 0.759046084 |
| 108 | 6 | 15 | 0.01544 | 0.97 | 75.843 | 0.74239855 |
| 109 | 9 | 2 | 0.01544 | 0.97 | 75.843 | 0.80019876 |
| 110 | 9 | 5 | 0.01544 | 0.97 | 75.843 | 0.795644082 |
| 111 | 9 | 7 | 0.01544 | 0.97 | 75.843 | 0.786988804 |
| 112 | 9 | 9 | 0.01544 | 0.97 | 75.843 | 0.769035918 |
| 113 | 9 | 12 | 0.01544 | 0.97 | 75.843 | 0.750216039 |
| 114 | 9 | 15 | 0.01544 | 0.97 | 75.843 | 0.731744114 |
| 115 | 12 | 2 | 0.01544 | 0.97 | 75.843 | 0.783710237 |
| 116 | 12 | 5 | 0.01544 | 0.97 | 75.843 | 0.770930791 |
| 117 | 12 | 7 | 0.01544 | 0.97 | 75.843 | 0.768939099 |
| 118 | 12 | 9 | 0.01544 | 0.97 | 75.843 | 0.758702093 |
| 119 | 12 | 12 | 0.01544 | 0.97 | 75.843 | 0.724040182 |
| 120 | 12 | 15 | 0.01544 | 0.97 | 75.843 | 0.711191055 |
| 121 | 15 | 2 | 0.01544 | 0.97 | 75.843 | 0.755654242 |
| 122 | 15 | 5 | 0.01544 | 0.97 | 75.843 | 0.754867438 |
| 123 | 15 | 7 | 0.01544 | 0.97 | 75.843 | 0.749298693 |
| 124 | 15 | 9 | 0.01544 | 0.97 | 75.843 | 0.723388924 |
| 125 | 15 | 12 | 0.01544 | 0.97 | 75.843 | 0.690732757 |
| 126 | 15 | 15 | 0.01544 | 0.97 | 75.843 | 0.680732757 |
References
- Pigeon, J. What Carbon Capture and Storage (CCS) is Expected to? Describing Potential Future of a CO2 Mitigation Technological System in the Seine Waterway Axis. Energy Procedia 2017, 114, 7333–7342. [Google Scholar] [CrossRef]
- Zeng, R.S.; Vincent, C.J.; Tian, X.Y.; Stephenson, M.H.; Wang, S.; Xu, W.D. New potential carbon emission reduction enterprises in China: Deep geological storage of CO2 emitted through industrial usage of coal in China. Greenh. Gases Sci. Technol. 2013, 3, 106–115. [Google Scholar] [CrossRef]
- Minchener, A.J. Gasification based CCS challenges and opportunities for China. Fuel 2014, 116, 904–909. [Google Scholar] [CrossRef]
- Zhang, X.; Fan, J.L.; Wei, Y.M. Technology roadmap study on carbon capture, utilization and storage in China. Energy Policy 2013, 59, 536–550. [Google Scholar] [CrossRef]
- Gao, F.; Deng, C.B.; Wang, X.F.; Wu, S.W. Analysis on feasibility and safety in sealing of smoke injected into goaf. J. Saf. Sci. Technol. 2016, 12, 60–64. [Google Scholar]
- Qu, S.J.; Yang, J.L.; Liu, Z.Y. CO2 Sorption on Coals: Contribution of Minerals and Influence of Supercritical CO2 Pre-exposure. Energy Fuels 2012, 26, 3928–3934. [Google Scholar] [CrossRef]
- Wang, X.F.; Deng, C.B.; Qiao, L.; Chu, G.; Jing, R.; Kang, Y.L. A study on factors influencing CO2 adsorption by coal. AIP Adv. 2021, 11, 035238. [Google Scholar] [CrossRef]
- Guan, C.; Liu, S.M.; Li, C.W.; Wang, Y.; Zhao, Y.X. The temperature effect on the methane and CO2 adsorption capacities of Illinois coal. Fuel 2018, 211, 241–250. [Google Scholar] [CrossRef]
- Zhu, H.Q.; Guo, S.; Xie, Y.Y.; Zhao, H.R. Molecular simulation and experimental studies on CO2 and N2 adsorption to bituminous coal. Environ. Sci. Pollut. Res. 2021, 28, 15673–15686. [Google Scholar] [CrossRef]
- Chen, L.; Zhao, M.; Li, X.; Liu, Y. Impact research of CH4 replacement with CO2 in hydrous coal under high pressure injection. Min. Miner. Depos. 2022, 16, 121–126. [Google Scholar] [CrossRef]
- Xie, W.D.; Wang, M.; Dai, X.G. CO2 adsorption characteristics and its affecting factors of lower Silurian, Longmaxi formation shale in southeast Chongqing. J. Henan Polytech. Univ. (Nat. Sci.) 2018, 37, 80–88. [Google Scholar]
- Abunowara, M.; Sufian, S.; Bustam, M.A. Experimental measurements of carbon dioxide, methane and nitrogen high-pressure adsorption properties onto Malaysian coals under various conditions. Energy 2020, 210. [Google Scholar] [CrossRef]
- Zhou, X.H.; Niu, Y.P.; Bai, G.; Zhang, X.W. Experimental study on factors affecting volume of CO2 adsorbed by coal. China Saf. Sci. J. 2019, 29, 85–90. [Google Scholar]
- Zhang, R.; Liu, S.M. Experimental and theoretical characterization of methane and CO2 sorption hysteresis in coals based on Langmuir desorption. Int. J. Coal Geol. 2017, 171, 49–60. [Google Scholar] [CrossRef]
- Zhou, J.P.; Liu, M.H.; Xian, X.F.; Jiang, Y.D.; Liu, Q.L.; Wang, X.C. Measurements and modelling of CH4 and CO2 adsorption behaviors on shales: Implication for CO2 enhanced shale gas recovery. Fuel 2019, 251, 293–306. [Google Scholar] [CrossRef]
- Gao, T.; Deng, C.B.; Han, Q. Experimental Research on the Law of Energy Conversion during CO2 Sequestration in Coal. Energies 2021, 14, 8079. [Google Scholar] [CrossRef]
- Han, S.; Sang, S.; Zhang, J.; Xiang, W.; Xu, A. Assessment of CO2 geological storage capacity based on adsorption isothermal experiments at various temperatures: A case study of No. 3 coal in the Qinshui Basin. Petroleum, 2022; in press. [Google Scholar] [CrossRef]
- Yu, H.G.; Fan, W.T.; Sun, M.Y.; Ye, J.P. Characteristi cs and prediction for adsorption iso-therms of carbon dioxide binary gas on coals. J. China Coal Soc. 2005, 30, 618. [Google Scholar]
- Meng, M.; Qiu, Z.S.; Zhong, R.Z.; Liu, Z.G.; Liu, Y.F.; Chen, P.J. Adsorption characteristics of supercritical CO2/CH4 on different types of coal and a machine learning approach. Chem. Eng. J. 2019, 368, 847–864. [Google Scholar] [CrossRef]
- Zhong, L.W.; Zheng, Y.Z.; Yuan, Z.R.; Lei, C.L.; Zhang, H. Adsorption performance of coal under the combined influence of temperature and pressure and prediction of gas content. J. Coal Ind. 2002, 6, 581–585. [Google Scholar]
- Chattaraj, S.; Mohanty, D.; Kumar, T.; Halder, G.; Mishra, K. Comparative study on sorption characteristics of coal seams from Barakar and Raniganj formations of Damodar Valley Basin, India. Int. J. Coal Geol. 2019, 212, 103202. [Google Scholar] [CrossRef]
- Li, M.Q.; Zhang, Z.X.; Wu, X.J.; Fan, J.J. Experiment and Mechanism Study on the Effect of Kaolin on Melting Characteristics of Zhundong Coal Ash. Energy Fuels 2016, 30, 7763–7769. [Google Scholar] [CrossRef]
- Du, Q.H.; Liu, X.L.; Wang, E.Z.; Zuo, J.P.; Wang, W.M.; Zhu, Y.J. Effects of CO2–water interaction with coal on mineral content and pore characteristics. J. Rock Mech. Geotech. Eng. 2020, 12, 326–337. [Google Scholar] [CrossRef]
- Gao, F.; Xia, J.; Sun, R.J.; Shan, Y.F.; Jia, Z. Effects of inhibitors on the sequestration of flue gas in goaf and pore structures of coal. Fuel 2022, 310, 122354. [Google Scholar] [CrossRef]
- Zhu, Y.M.; Wang, Y.; Chen, S.B.; Zhang, H.; Fu, C.Q. Qualitative-quantitative multiscale characterization of pore structures in shale reservoirs: A case study of longmaxi formation in the upper yangtze area. Earth Sci. Front. 2016, 23, 154–163. [Google Scholar] [CrossRef]
- Liu, J.; Xie, H.; Wang, Q.; Chen, S.Y.; Hu, Z.M. The Effect of Pore Size on Shale Gas Recovery with CO2 Sequestration: Insight into Molecular Mechanisms. Energy Fuels 2019, 33, 2897–2907. [Google Scholar] [CrossRef]
- Fu, X.X.; Zhang, D.F.; Jiang, W.P.; Lun, J.Z.; Zhao, C.P.; Wang, H.T.; Li, Y.H. Influence of physicochemical properties of coals on pore morphology and methane adsorption:a perspective. Chem. Ind. Eng. Prog. 2019, 38, 2714–2725. [Google Scholar] [CrossRef]
- Švábová, M.; Weishauptová, Z.; Přibyl, O. The effect of moisture on the sorption process of CO2 on coal. Fuel 2012, 92, 187–196. [Google Scholar] [CrossRef]
- Zhang, Y.Z. Application of improved BP neural network based on e-commerce supply chain network data in the forecast of aquatic product export volume. Cogn. Syst. Res. 2019, 57, 228–235. [Google Scholar] [CrossRef]
- Jiang, Z.Y.; Gyurova, L.; Zhang, Z.; Friedrich, K.; Schlarb, A.K. Neural network based prediction on mechanical and wear properties of short fibers reinforced polyamide composites. Mater. Des. 2008, 29, 628–637. [Google Scholar] [CrossRef]
- Li, B.Y.; Li, Y.X.; Wang, H.T.; Ma, Y.M.; Hu, Q.; Ge, F.L. Compensation of automatic weighing error of belt weigher based on BP neural network. Measurement 2018, 129, 625–632. [Google Scholar] [CrossRef]
- Colaresi, M.; Mahmood, Z. Do the robot: Lessons from machine learning to improve conflict forecasting. J. Peace Res. 2017, 54, 193–214. [Google Scholar] [CrossRef]
- Fan, W.; Liu, K.; Liu, H.; Wang, P.; Ge, Y.; Fu, Y. AutoFS: Automated Feature Selection via Diversity-Aware Interactive Reinforcement Learning. In Proceedings of the 2020 IEEE International Conference on Data Mining (ICDM), Sorrento, Italy, 17–20 November 2020; pp. 1008–1013. [Google Scholar] [CrossRef]
Disclaimer/Publisher’s Note: The statements, opinions and data contained in all publications are solely those of the individual author(s) and contributor(s) and not of MDPI and/or the editor(s). MDPI and/or the editor(s) disclaim responsibility for any injury to people or property resulting from any ideas, methods, instructions or products referred to in the content. |
© 2023 by the authors. Licensee MDPI, Basel, Switzerland. This article is an open access article distributed under the terms and conditions of the Creative Commons Attribution (CC BY) license (https://creativecommons.org/licenses/by/4.0/).