Abstract
Under a two-part tariff, the user-side installation of photovoltaic and energy storage systems can simultaneously lower the electricity charge and demand charge. How to plan the energy storage capacity and location against the backdrop of a fully installed photovoltaic system is a critical element in determining the economic benefits of users. In view of this, we propose an optimal configuration of user-side energy storage for a multi-transformer-integrated industrial park microgrid. First, the objective function of user-side energy storage planning is built with the income and cost of energy storage in the whole life cycle as the core elements. This is conducted by taking into consideration the time-of-use electricity price, demand price, on-grid electricity price, and energy storage operation and maintenance costs. Then, considering the load characteristics and bidirectional energy interaction of different nodes, a user-side decentralized energy storage configuration model is developed for a multi-transformer-integrated industrial park microgrid. Finally, combined with the engineering practice constraints, the configuration model is solved by mixed integer linear programming. The simulation test demonstrates how the proposed model can successfully increase the economic benefits of an industrial park. Electricity and demand costs are reduced by 11.90% and 19.35%, respectively, and the photovoltaic accommodation level is increased by 4.2%, compared to those without the installation of energy storage system.
1. Introduction
In the context of global green development and efforts to achieve “carbon neutrality and carbon peak”, renewable energy generation and energy storage will promote a revolutionary change in power technology [1,2]. Photovoltaic (PV) and energy storage systems (ESSs) are installed in terminal users, such as commercial and industrial parks, big data centers, and 5G base stations, to achieve spontaneous self-use and surplus electricity to the grid, which can not only lower user electricity costs and increase the reliability of the power supply but also lower carbon emissions [3]. In fact, many countries also encourage businesses and industrial parks to build green low-carbon microgrids [4]. In this regard, it is certain that a PV- and ESS-integrated user-side park microgrid will play a significant role in the new power system. Additionally, it actively contributes to energy structure optimization and emission reduction. Therefore, a PV- and ESS-integrated user-side microgrid is the key to promoting green, low-carbon, and high-quality development.
The user-side PV and ESS microgrid is mainly composed of ESS, PV station, and power load. ESS can be used to lower electricity costs and raise the share of local PV power consumption, thereby increasing users’ economic benefits [5]. At present, the cost of PV power generation is lower than the on-grid price of thermal power [6]. The user side configures PV in accordance with the full installation concept to reduce electricity costs, but ESS still faces the challenges of high initial installation costs and other issues including a protracted cost recovery cycle and challenging profitability. Therefore, a major issue that has to be resolved is how to plan ESS capacity to maximize the revenue of user-side PV- and ESS-integrated park microgrids. Reference [7] proposed an effective method for the performance evaluation of large PV power stations with annual operating data, realized automatic analysis of the optimal size determination of energy storage systems for PV power stations, and verified the rationality of the principle for configuring energy storage for PV power stations in some regions of China. The authors in Reference [8] used the grey target decision method based on the entropy weight method (EWM) to obtain the optimal compromise solution from the Pareto non-dominated set. Reference [9] proposed a multiobjective optimization model to co-optimize the sizes of renewable generation and energy storage in stand-alone microgrids, which minimizes the load-shedding risk and the total investment cost. Reference [10] proposed a bi-level model and formulated it through the Epsilon-constraint method; the results showed that the coordinated operation of storage systems and demand response (DR) programs reduces operating costs. The authors in Reference [11] proposed a framework to demonstrate resilience enhancement through the utilization of multi-microgrids (MMGs) and mobile energy storage in extreme operating conditions.
In the last few years, numerous studies on the planning and configuration of user-side ESS capacity have been conducted by domestic and foreign academics, with positive outcomes. For instance, Reference [12] proposed a user-side battery ESS planning configuration and rolling optimization method and studied the function of ESS in lowering electricity costs and demand defense under a two-part tariff. However, they neglected to take into account aspects such as the life cycle cost and discount rate of ESS, and the overall value evaluation of ESS was, therefore, insufficient. The ESS life cycle cost model is defined in [13,14], and the ideal ESS user-side investment strategy is provided. The charging and discharging strategy of ESS is only based on the TOU price, and the contribution of ESS to lowering peak demand is not taken into account. References [15,16] addressed the planning problem of a PV-ESS microgrid under a two-part electricity tariff based on the cost–benefit analysis approach, but did not take into account the load characteristics and bidirectional energy interaction of different nodes. The existing ESS paradigm is also imperfect, making it challenging to portray the usefulness of ESS from the user’s perspective. A bi-level optimization approach for ESS system planning with demand management is suggested in [17,18]. An analysis of the impact of ESS installation costs and load curve characteristics on user economic advantages offers recommendations for ESS planning and configuration on the user side. However, without a thorough analysis of the power system structure, the peculiarities of the user-side power system’s multi-node network layout are disregarded, and the single-node centralized planning of the user-side ESS is only analyzed for a single-transformer scenario.
In other words, the ESS planning model in the aforementioned literature is unable to satisfy the requirements of a user-side ESS planning practice because it lacks a thorough understanding of the user-side power system structure and has not yet studied the capacity planning configuration of the user-side sub-ESS system in a multi-transformer-integrated microgrid from the engineering practice. Currently, the rated power and capacity of ESS are often established based on load characteristics and peak clipping needs in engineering when ESS engages in user-side energy management [19,20]. The economic benefit of this kind of approach has not been theoretically studied. The literature on how the user side should configure ESS does not, however, provide a strategy for the case of many transformer-integrated microgrids.
In view of the above discussions, this paper mainly studies (1) the impact of the TOU electricity tariff, demand tariff, on-grid electricity tariff, and energy storage operation and maintenance costs; (2) the configuration of user-side ESS for an industrial park microgrid integrated with a multi-transformer; and (3) the load characteristics and bidirectional energy interaction between different transformers. In the proposed configuration, the TOU electricity tariff, demand tariff, on-grid electricity tariff, and energy storage operation and maintenance costs are fully taken into account. Moreover, we also consider load characteristics and bidirectional energy interaction of different nodes and design a user-side decentralized ESS configuration model for a multi-transformer-integrated industrial park microgrid. The planned configuration model is solved using mixed integer linear programming in a multi-transformer example of a microgrid in an industrial park in Zibo city, China. The simulation results demonstrate how the proposed model can successfully increase the financial advantages of users:
(1) To achieve the optimal configuration of ESS from a cost-effective perspective, the TOU electricity tariff, demand tariff, on-grid electricity tariff, and energy storage operation and maintenance costs are fully taken into account.
(2) The optimal configuration of user-side-distributed ESS for a multi-transformer-integrated industrial park microgrid is studied. It provides a technical reference for the ESS planning of a microgrid with multi-transformer topology.
(3) The load characteristics and bidirectional energy interaction of different nodes throughout workdays, rainy days, Saturdays, and Sundays are considered.
The rest of this paper is structured as follows: The structure of the multi-transformer-integrated microgrid is described in Section 2. Section 3 presents a mathematical description of the proposed optimization model. In Section 4, detailed parameters are provided. Simulation studies of the suggested model are covered in Section 5. Finally, Section 6 summarizes the results.
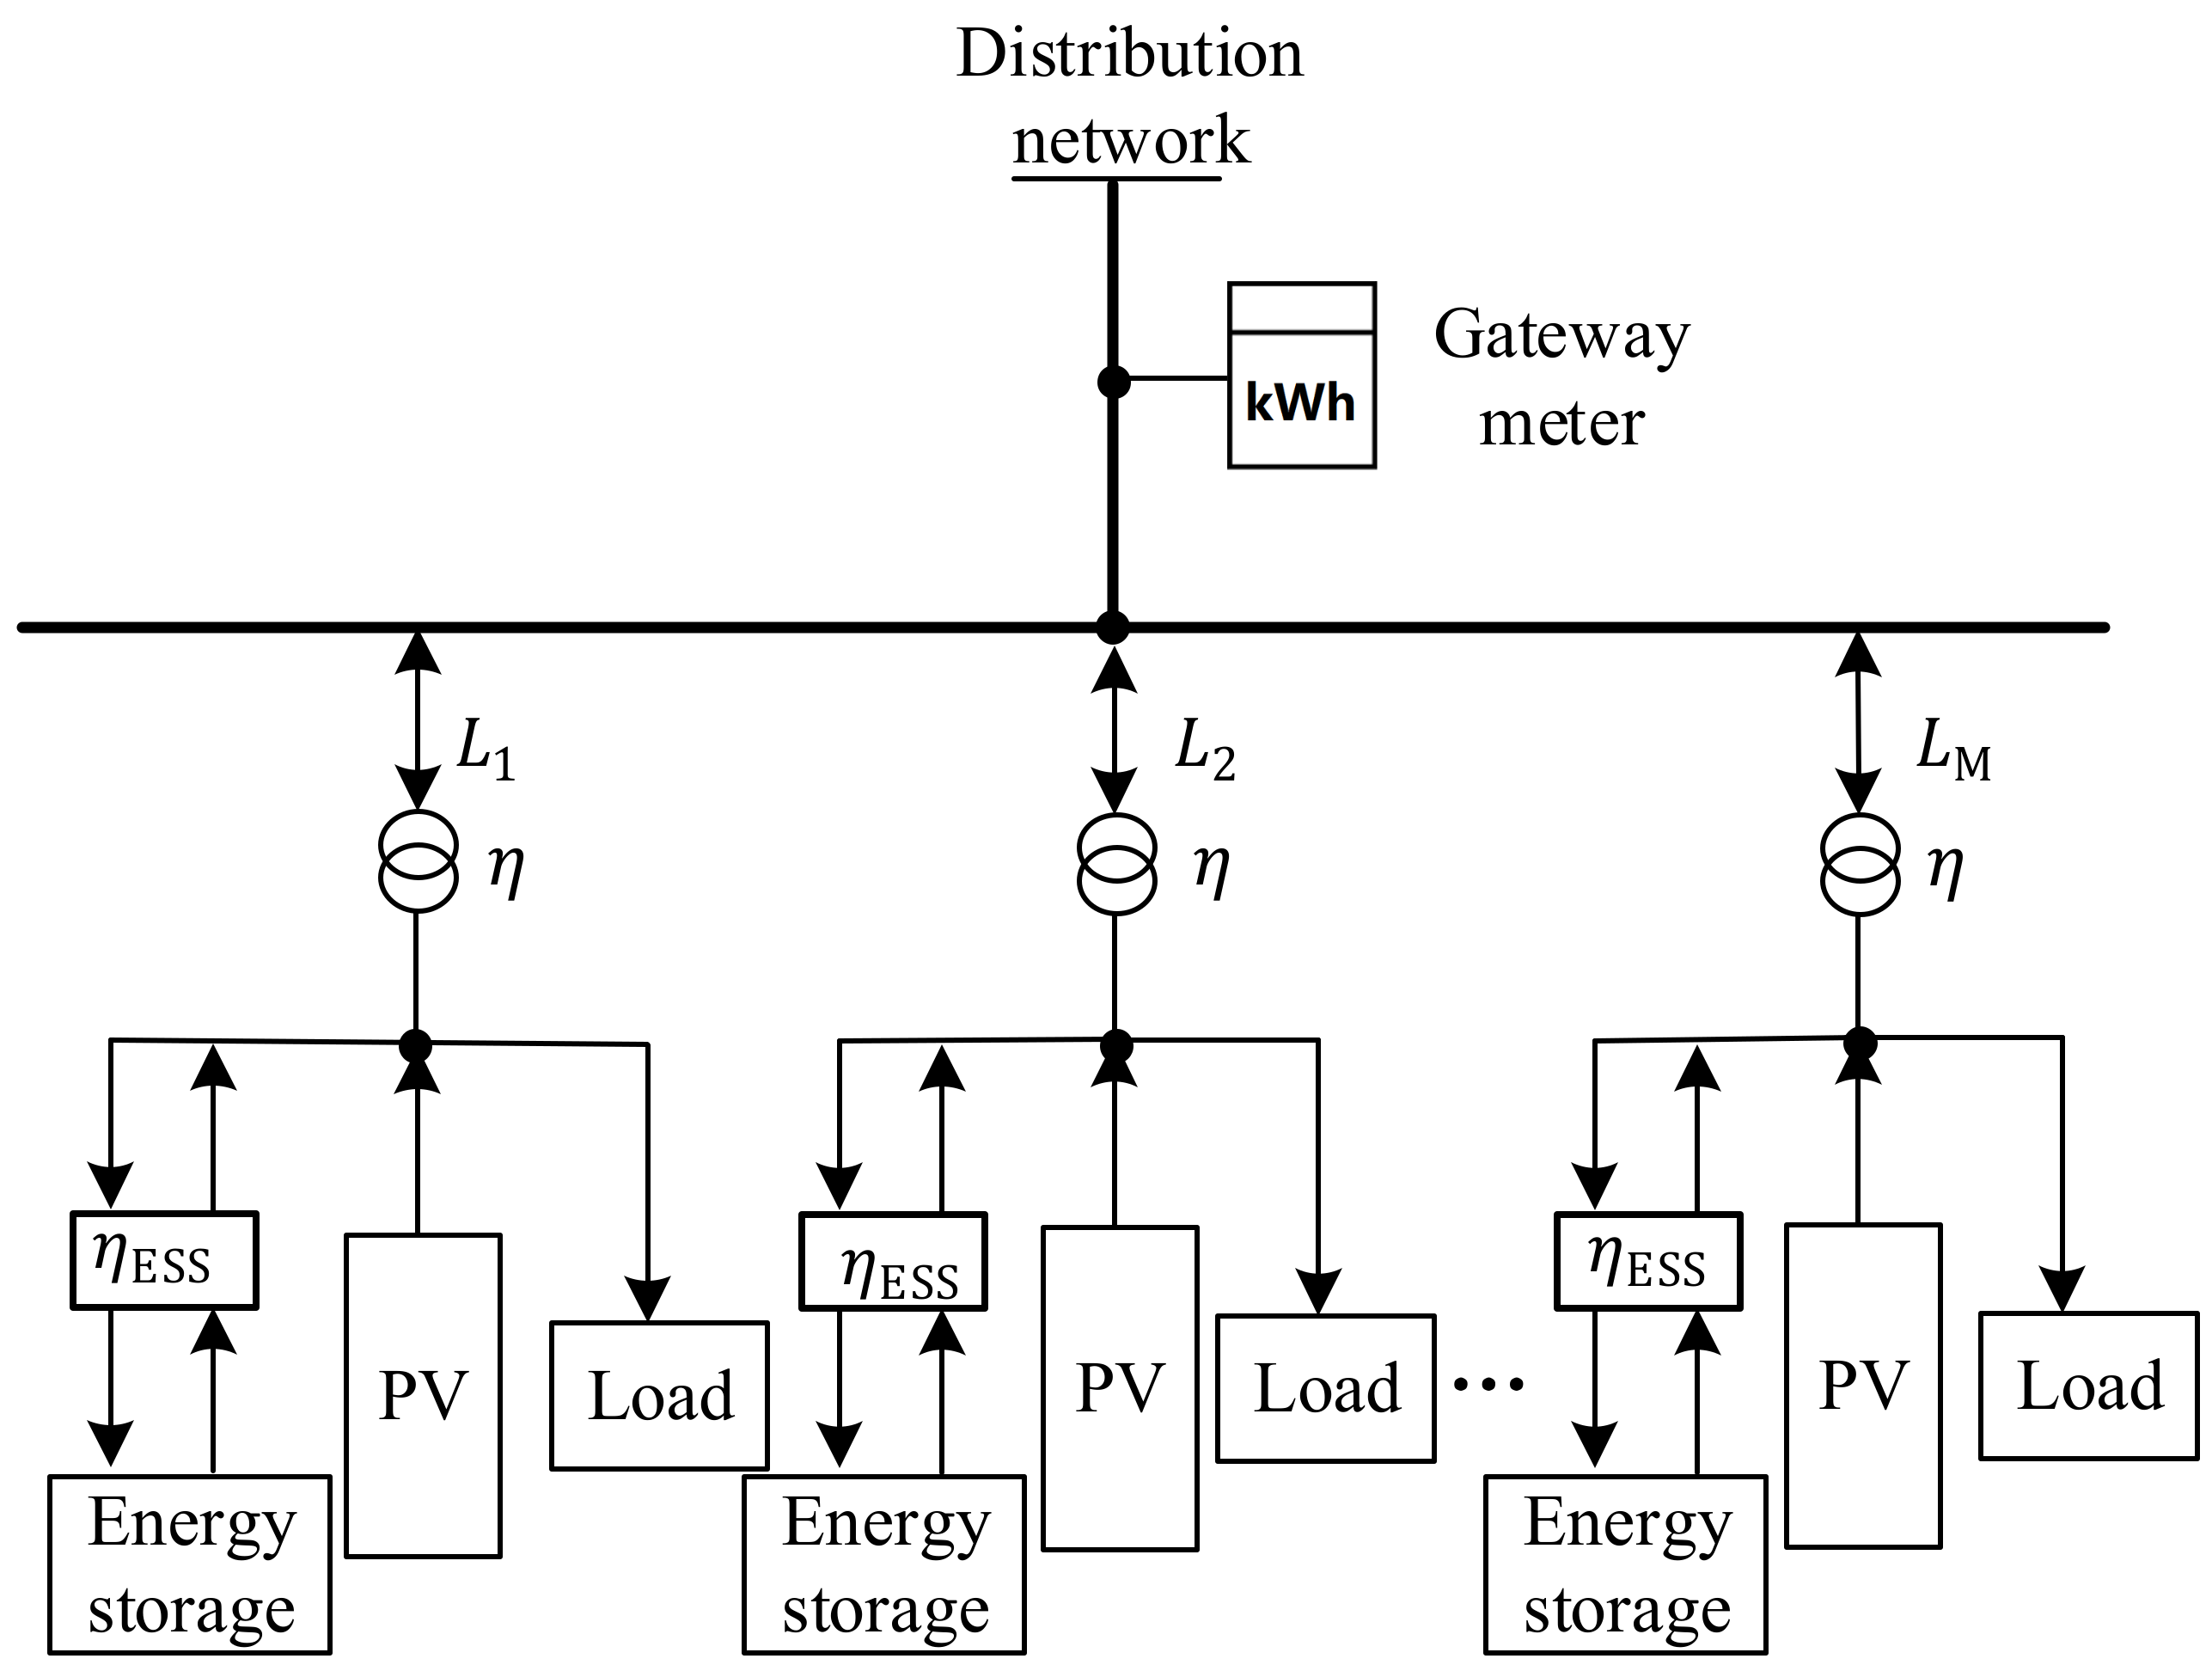
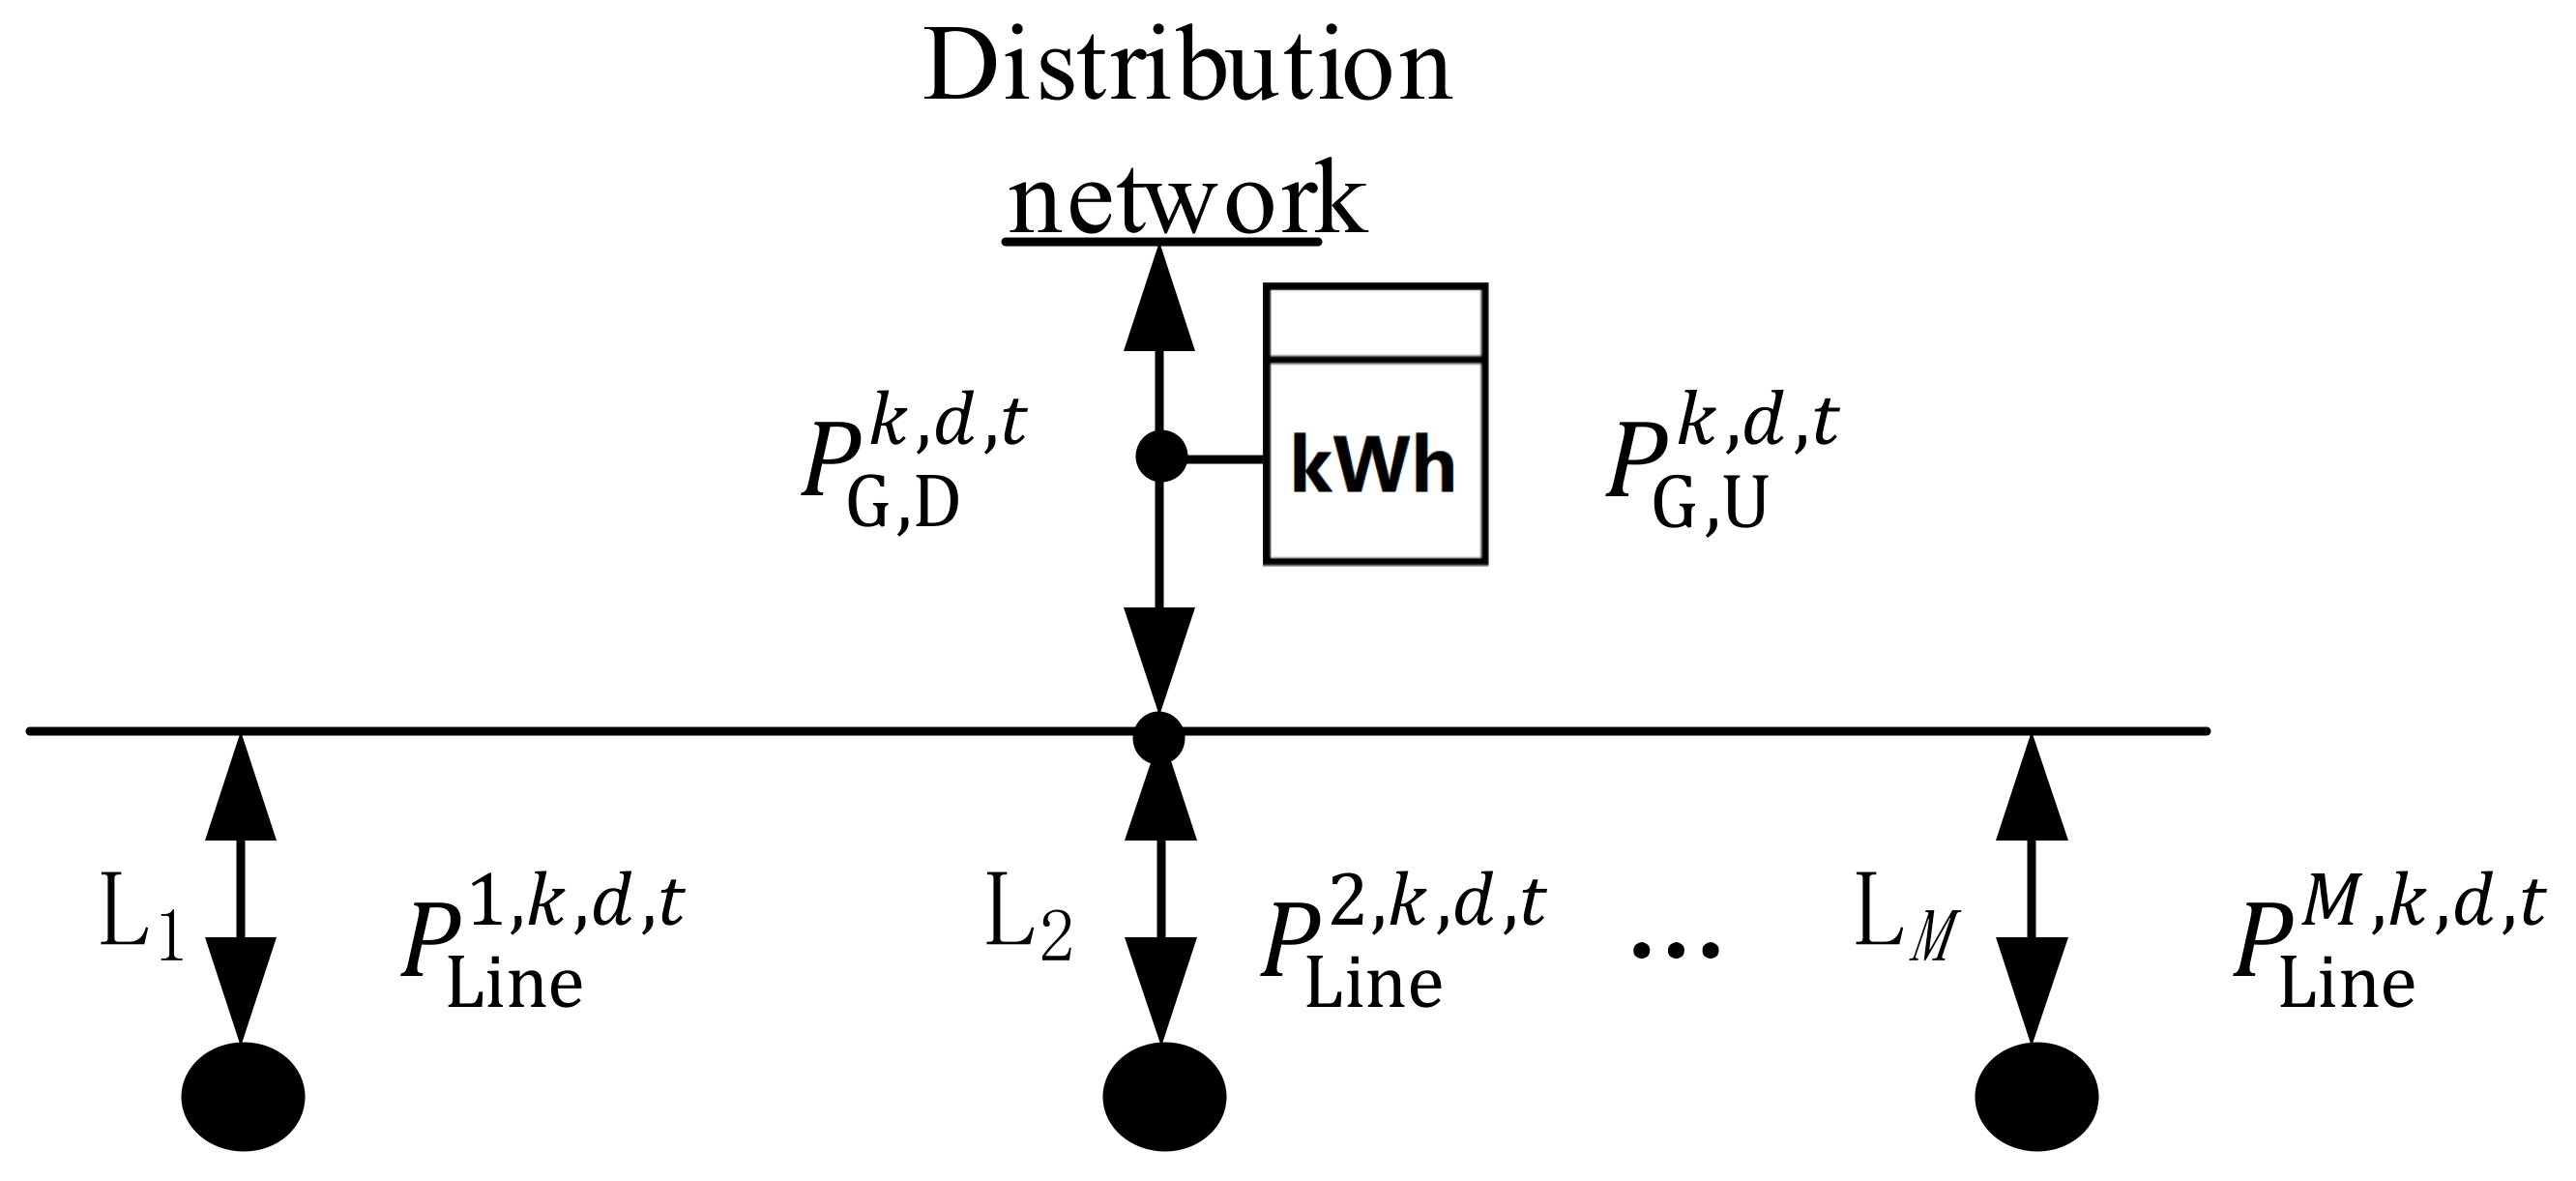
2. The Structure of User-Side Multi-Transformer-Integrated Microgrid
Currently, industrial parks typically install many transformers to suit the electricity needs of businesses due to the park’s growing electricity consumption as well as improving power supply reliability. A user-side multi-transformer-integrated microgrid structure is formed when all transformers complete the electricity metering through a two-way gateway meter, as shown in Figure 1. All PV and ESS property rights and advantages are owned by users of the multi-transformer system behind the meter, and they are all managed by users in a unified and coordinated manner. The PV and ESS are installed beneath the transformer to create a new energy power supply node, with PV and ESS participating in the energy supply. The transformer is situated behind the gateway meter. To enable the sharing of ESS and PV across each node, the tie lines, L1, L2, …, and LM, connect each power supply node to the gateway.
Figure 1.
Structure of user-side multi-transformer-integrated microgrid.
The multi-transformer construction behind the meter can generally suppress load fluctuation, minimize the impact of load randomization and PV output uncertainty on electricity bills, and is more suited to demand defense than the conventional single-transformer layout [21]. The power loss brought on by the transformer efficiency and the power limitations on the tie line must be taken into account throughout the optimization process. This study demonstrates how user-side ESS planning and scheduling can reduce the electricity charge and demand charge. The link between income and net income rate is properly adjusted to fulfill the goal of energy saving and carbon reduction with the aim of maximizing the income of the park microgrid after installing ESS.
Currently, most industrial and commercial users are under a two-part tariff [22,23]. That is, the demand (or capacity) tariff and electricity tariff are both included in the electricity fee that users need to pay. The demand charge is based on the enterprise’s maximum monthly demand (the maximum average load every 15 or 30 or 60 min in the month) or the transformer capacity, and the electricity charge is based on the user’s actual electricity consumption and the TOU electricity tariff. In an industrial park, the time slot for users to operate high-power equipment is generally very short [24,25], but the expense of this transient peak load will be passed on to users in the form of a high-demand charge. The demand tariff is charged monthly according to the product of demand price and maximum power purchased from the upper grid in each month. Additionally, the monthly maximum purchased power is defined as the monthly demand defense value. As a result, how to plan the ESS against the backdrop of a fully installed PV is a critical element in determining the economic benefits of industrial parks.
3. Optimal Configuration of User-Side Decentralized ESS under Multi-Transformer
The configuration model used in this study takes into account the profit and cost of the user-side ESS throughout its entire life cycle, as well as the TOU electricity tariff, demand tariff, on-grid electricity tariff, and ESS operation and maintenance costs, to construct the park microgrid system’s annual profit maximization objective function, as shown in Equation (1). The decision variables are separated into planning variables and operating variables, where planning variables include ESS location (0/1 variable) and ESS capacity (continuous variable), and operating variables include the charging and discharging power of ESS, the transactive power of different nodes, and the transactive power with the upper power grid.
where represents the annual cost savings realized by the industrial park after the installation of ESS, equivalent to the net income of the park. is the annual electricity consumption expenditure of the park with the installation of PV, is the annual electricity consumption expenditure of the park after the installation of PV and ESS, and are the annual demand costs of the park before and after installation of ESS, respectively, is the annual investment cost of ESS, and is the annual operation and maintenance costs of ESS. indicates the difference in annual electricity cost of the park before and after the installation of ESS; denotes the difference in annual demand costs of the park before and after ESS installation.
As for the industrial park, the demand charge is collected monthly according to the maximum monthly electricity purchase from the upper gird, and electricity charges are collected according to the actual electricity consumption of the park and the TOU electricity tariff. According to the maximum value of the experience or historical power consumption, the park determines the demand charge per month as:
where represents the demand cost of the park with the PV station, , D, and T are the number of months in a year, the days in a month, and the hours in a day, respectively, indicate the load demand and PV generation of the park during hour t of dth day in month k. denotes the demand tariff, which is set to 38 in this paper.
The spatial and temporal distribution of energy can be altered through ESS [26]. Industrial users can, thus, reduce their electricity costs by storing electricity during the low electricity tariff period in accordance with the TOU electricity pricing and releasing electricity during the peak electricity tariff period to accomplish peak–valley arbitrage. The maximum demand value of the park user load can be reduced when PV and ESS are configured on the user side simultaneously.
where represents the electricity purchase cost from the upper grid, and represents the PV system’s on-grid revenue.
To measure the purchased power and on-grid power, a two-way gateway energy meter is required since the on-grid price is different from the TOU price of the power grid. and , which are the purchased power from the upper grid and sold power to the upper grid, respectively, of the park hour t of dth day in month k, should be collected by the two-way gateway meter. That is, if the park purchases power from the upper grid, then ; if the park sells power to the upper grid, then ; and if the park power can be self-sufficient, then . Thus, we have:
Figure 2 depicts the relationship between the power of each line and the power of gateway meter. , are monitored and collected by the gateway meter, which is connected to the node at each transformer through the tie line branch. The power of the gateway meter equals the sum of the power of each line. At time t, the power of each tie line and gateway meter has the following relationship:
where M is the total number of transformers, and
denotes the power flowing through line i to the load associated with the ith transformer.
Figure 2.
Topology of gateway meter for power collection.
Daytime PV power generation and the peak period of the power grid typically coincide with the peak period of park electricity usage. As a result, the role of PV is not only seen in the local consumption goal of saving electricity for the park, but also supports demand reduction. However, due to the volatility of PV generation, which is that weather variables can easily result in less-than-planned PV output, higher requirements for the planning and application of ESS are put forth. The demand cost of the park with ESS can be expressed as:
where denote the total charging and discharging power of ESS during hour t of dth day in month k, respectively.
The equal yearly value method is typically used in user-side ESS planning, in which the whole investment cost can be expressed as the sum of the yearly investment cost. The annual discount coefficient is calculated using the yearly interest rate and the whole life cycle on the basis of taking into account the time value of capital. The annual investment cost of ESS for the park is:
where represents the annualized discount coefficient of ESS within L years [27]. represents the investment price of ESS, and represents the installation capacity of ESS under the ith transformer.
The annual operation and maintenance costs of ESS include fixed operation and maintenance costs and variable operation and maintenance costs:
where is the operation and maintenance cost of unit capacity ESS, including labor cost and management cost, which is independent of the operation process and generally fixed. denotes the ESS-rated power under the th transformer. are the charging and discharging power of ESS associated with ith transformer, represents the operation and maintenance price of ESS, is the time interval of ESS operation, taking 1 h, and is the charging/discharging efficiency of ESS.
3.1. ESS Constraints under Multi-Transformer
In addition to the charging and discharging constraints of the ESS itself, this part mainly introduces the power loss and line constraints of multiple ESS interactions under multiple transformers. In the planning model, it is necessary to meet the power flow constraints and power balance constraints, and the rated power of the equipment should not exceed the maximum capacity.
ESS location ni is a binary variable, if ni = 1, it means that there is an ESS installed under the ith transformer, and if ni = 0, it indicates that there is not an ESS installed under the ith transformer:
The charging and discharging power of ESS participating in bidirectional energy interaction of different load nodes cannot exceed the line capacity constraints:
represents the maximum allowable power of the th line involving transformer i. With the charging and discharging of ESS, the state of energy will change according to the following constraint:
Given that the charging/discharging current of ESS is linear with the charging/discharging rate, an excessive charging/discharging current may degrade the device’s performance and reduce its working life; therefore, the charging/discharging rate of ESS must adhere to the restrictions.
where is the charging/discharging rate of ESS, and is generally chosen.
Under a multi-transformer scenario, the uplink and downlink power of line i meet the following constraints:
where are the downlink and uplink power of line i, respectively. At the same time, these two variables satisfy .
In a multiple transformer scenario, the transformer is no longer viewed as a lossless component but rather as a loss resistance because of the loss of energy charges caused by each transformer interacting with the others. The power of the load node where the transformer is situated is made up of PV output, load, and ESS charging and discharging power. The power balance constraint of each line is represented as follows:
where represents the operating efficiency of the transformer.
3.2. Economic Benefit Analysis of Industrial Park with ESS
The ideal ESS configuration under variable voltage after the user side is intended to reduce the electricity cost of the park while taking into account the ESS investment cost. The development of a systematic investment rate model, which would allow for the calculation of the investment recovery cycle, must also be taken into consideration. The net income mostly consists of PV access income, demand electricity savings income, and income from electricity savings. The annual net return of ESS can be modeled as:
where represents the annual net return on investment. represents the service life of ESS, and represents the equivalent total investment of ESS in the normal operation period.
The annualized investment return of ESS is given as:
where represents the annualized return on investment, and its reciprocal is the investment recovery cycle.
The economic analysis of ESS is primarily concerned with the targeted beneficiary users. The industrial park benefits from the ESS installation, and the primary source of income is the money saved on the electricity bill.
4. Planning Parameter Description of ESS
The configuration power, configuration capacity, monthly demand defense value, and charging/discharging power of ESS at each time point are all independent variables in the planning configuration model of an industrial park ESS under multi-transformer, and each of these variables satisfies the requirements of Equations (10)–(15). The simulation period of the model is 1 year, consisting of 12 months.
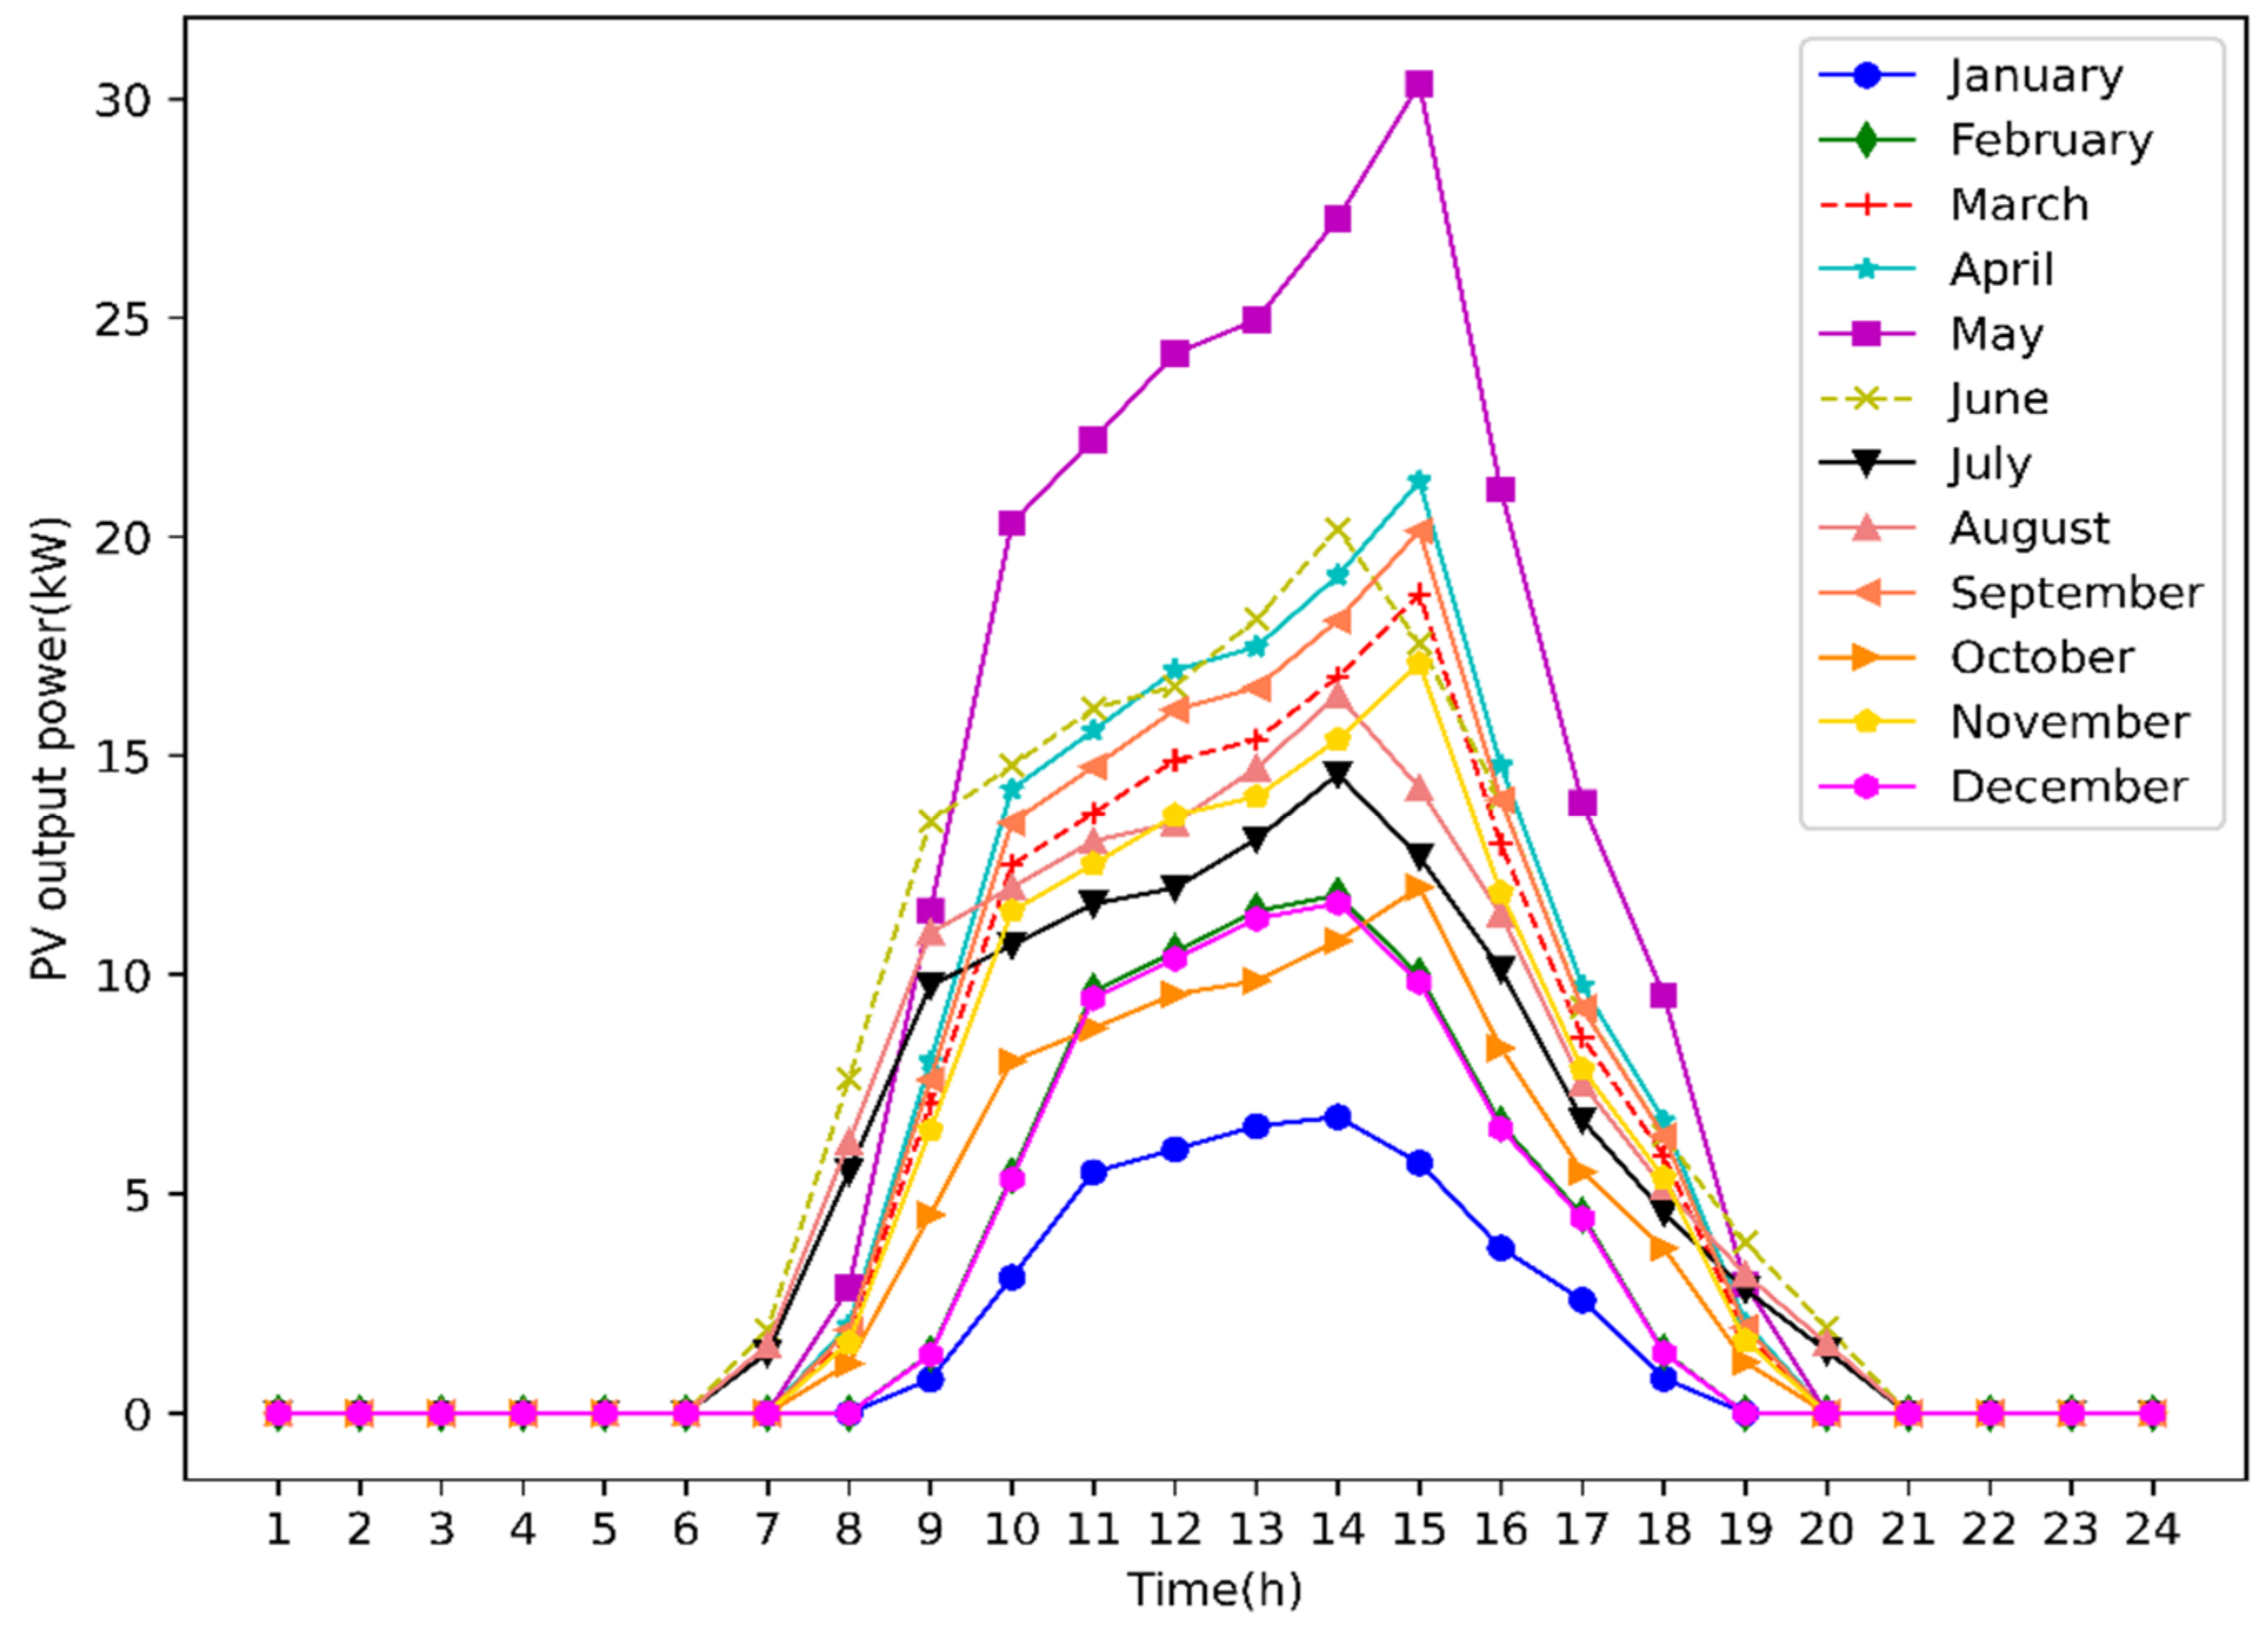
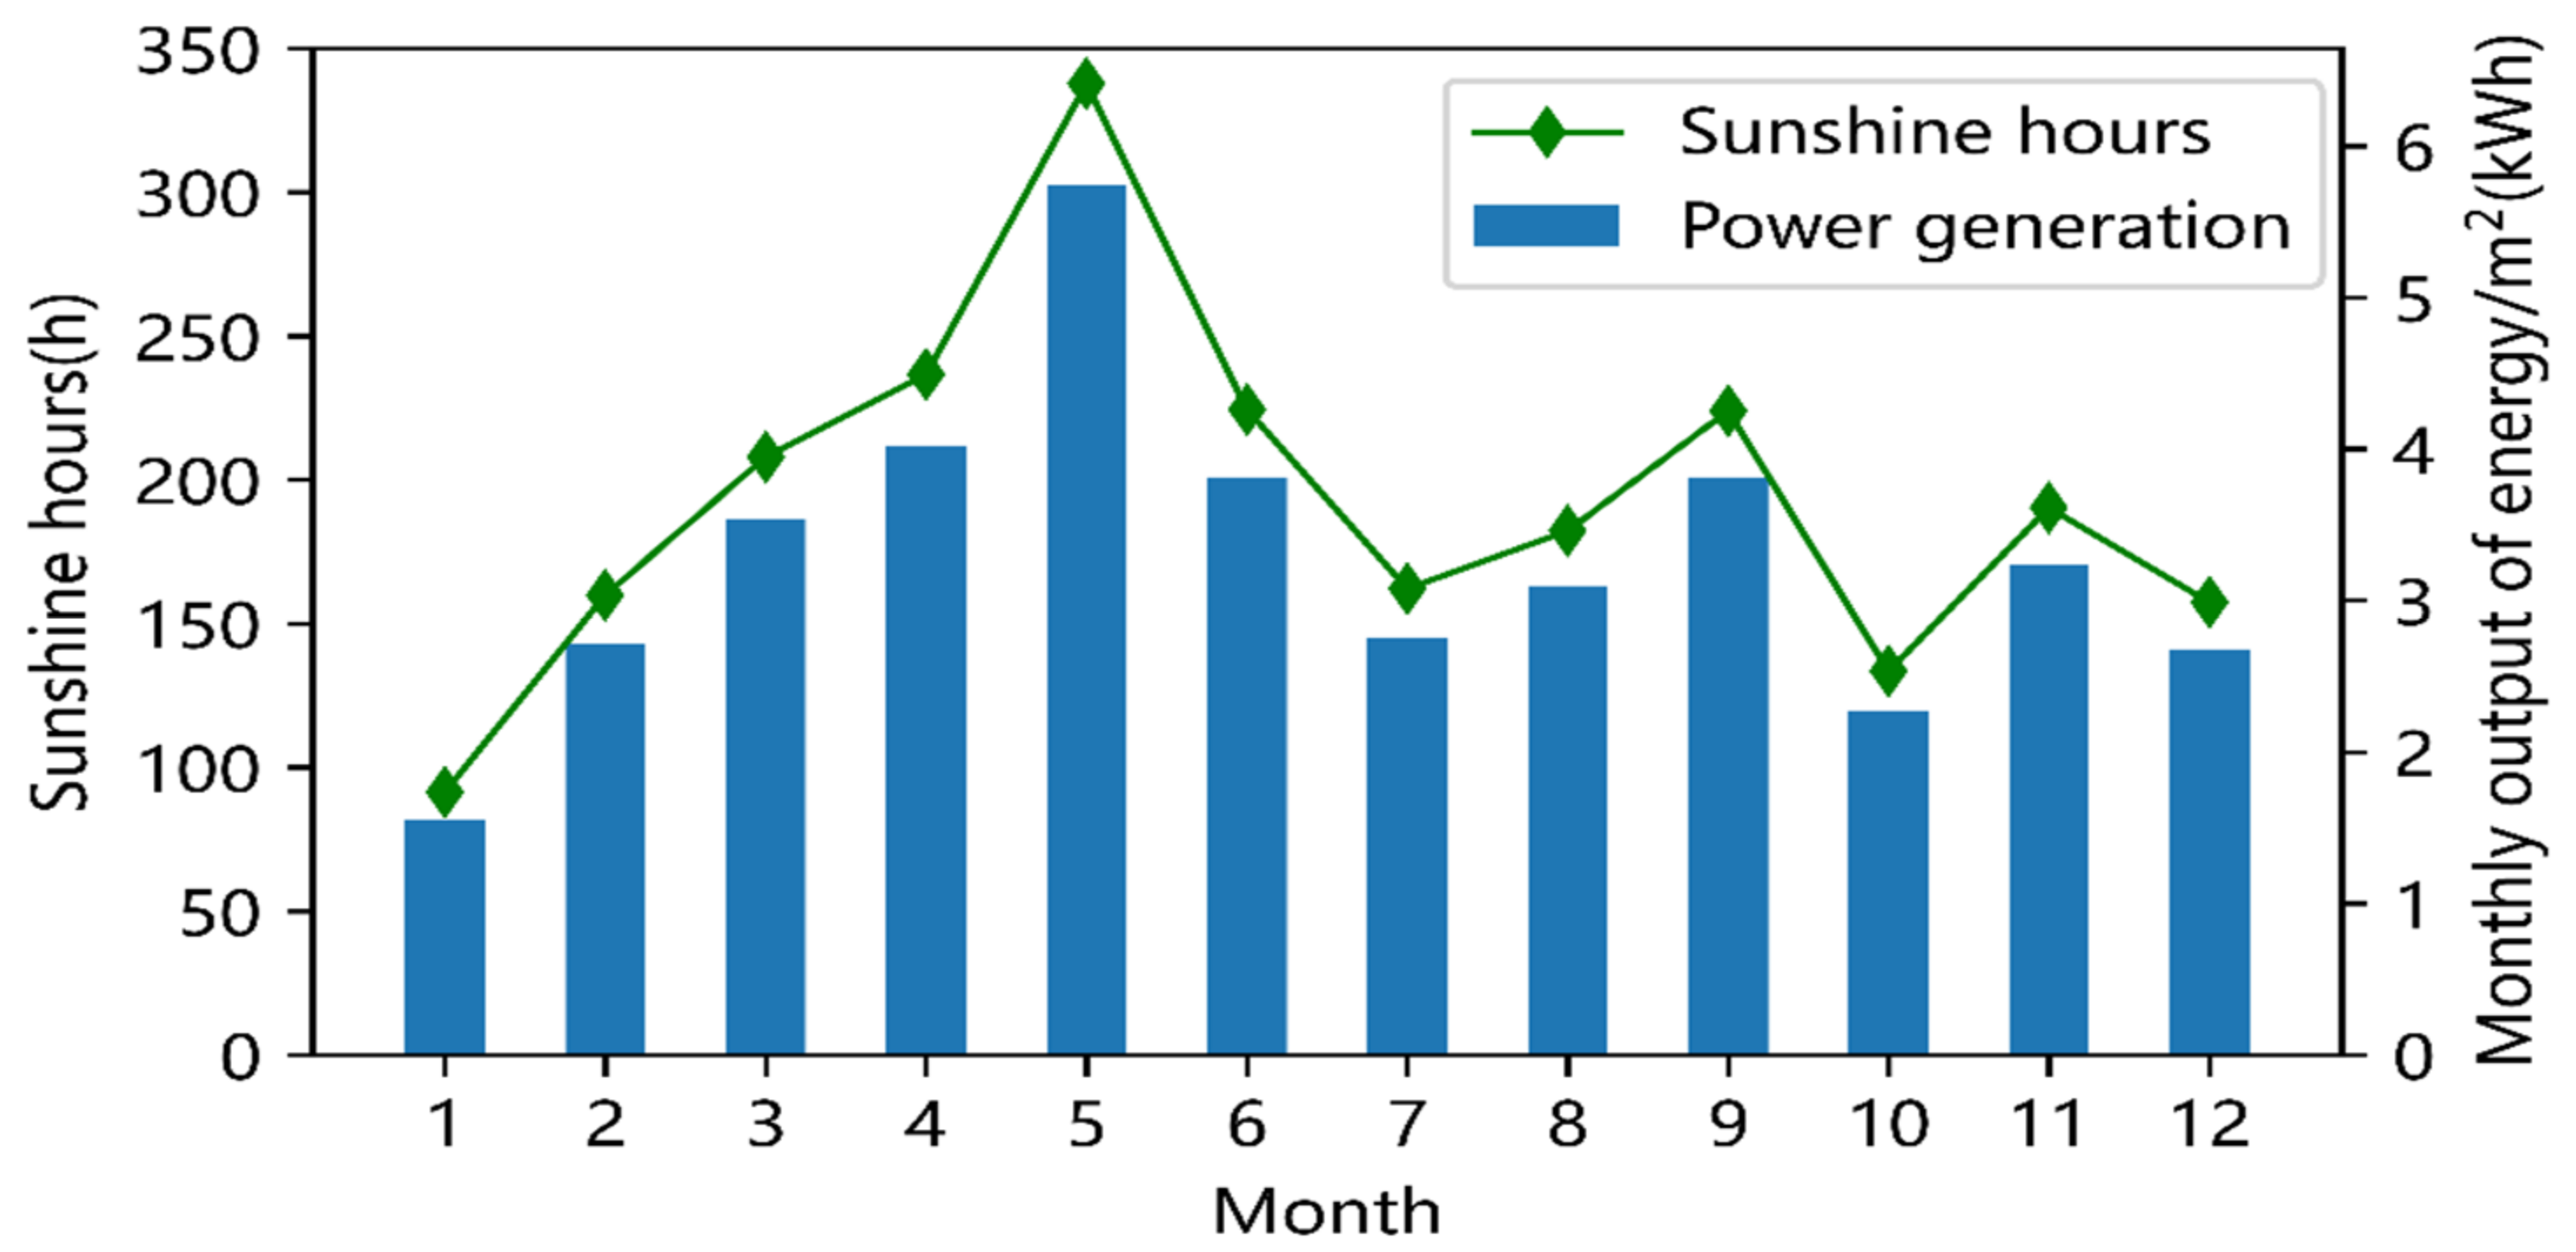
4.1. PV Outputs in Different Months
The accessible area of the roof of the plant and office building on the user side of the industrial park restricts the installed capacity of the PV power-producing components. Currently, 350 kWp, 390 kWp, and 150 kWp of PV capacity are installed on the user side of the three transformers in the industrial park. Following the principle of spontaneous self-use and residual power access, each one of them connects to the load via a PCS inverter. The typical PV production statistics of the four seasons can be calculated based on the features of the Northern Hemisphere lighting, seasonal illumination characteristics, and monthly average sunshine hours [28,29]. The annual total radiation in the region’s horizontal plane can be calculated to be 1314 kWh/m2, as shown in Figure 3, which shows the monthly statistics of light and power generation in the area, based on NASA satellite monitoring data.
Figure 3.
Monthly radiation and power generation in a certain region.
The figure shows that PV production has a long duration and a big peak in the summer and a short duration and a little peak in the winter. Different weather conditions will impact the output level of PV power-generating systems because solar radiation directly affects PV power generation. For instance, the output of PV power-producing systems may decline significantly in overcast or wet weather [30]. As a result, the output of a PV power-producing system is highly uncertain. The power generation curve for a 50 kWp PV station nearby the industrial park over a 12-month period is depicted in Figure 4.
Figure 4.
Typical PV output curves in the 12 months of a year.
It should be mentioned that, in the proposed planning model, a typical PV output curve of wet days is added to the original 12-day PV output curves shown in Figure 4, as part of the planning process to reflect the impact of rainy days on the generation of PV power. The typical production curve on rainy days is set at 3% of the normal output curve in order to streamline the planning process.
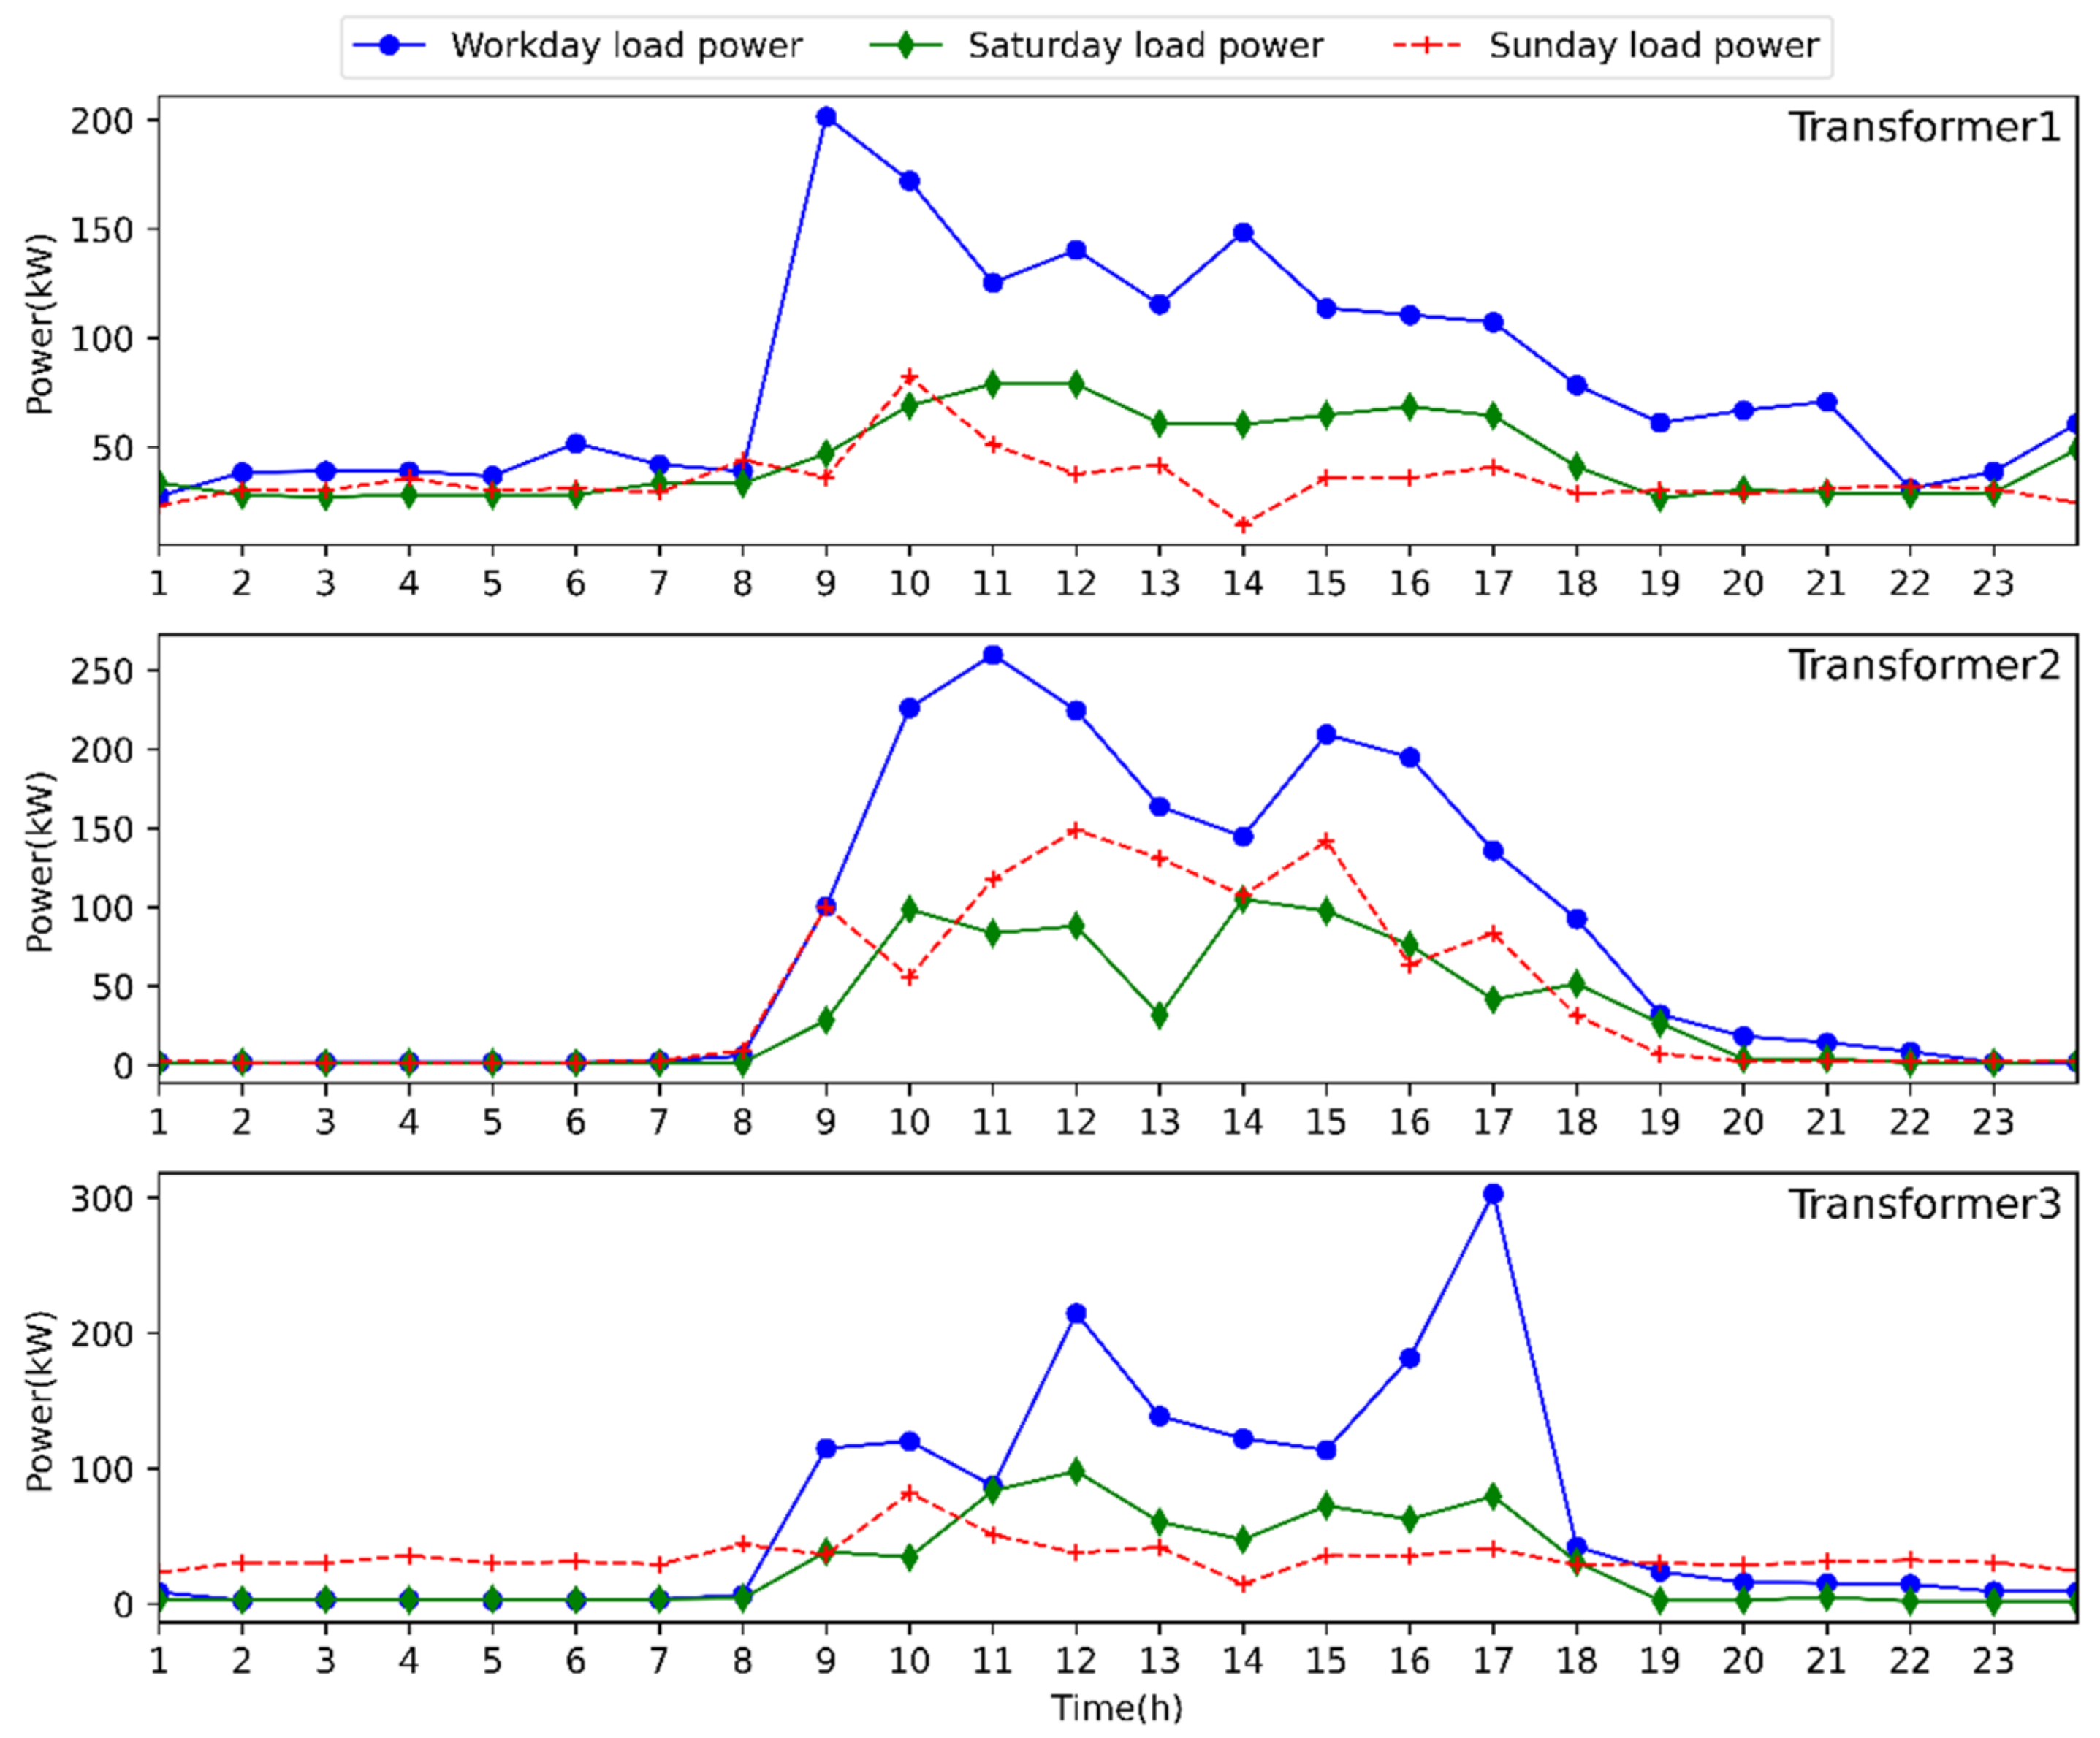
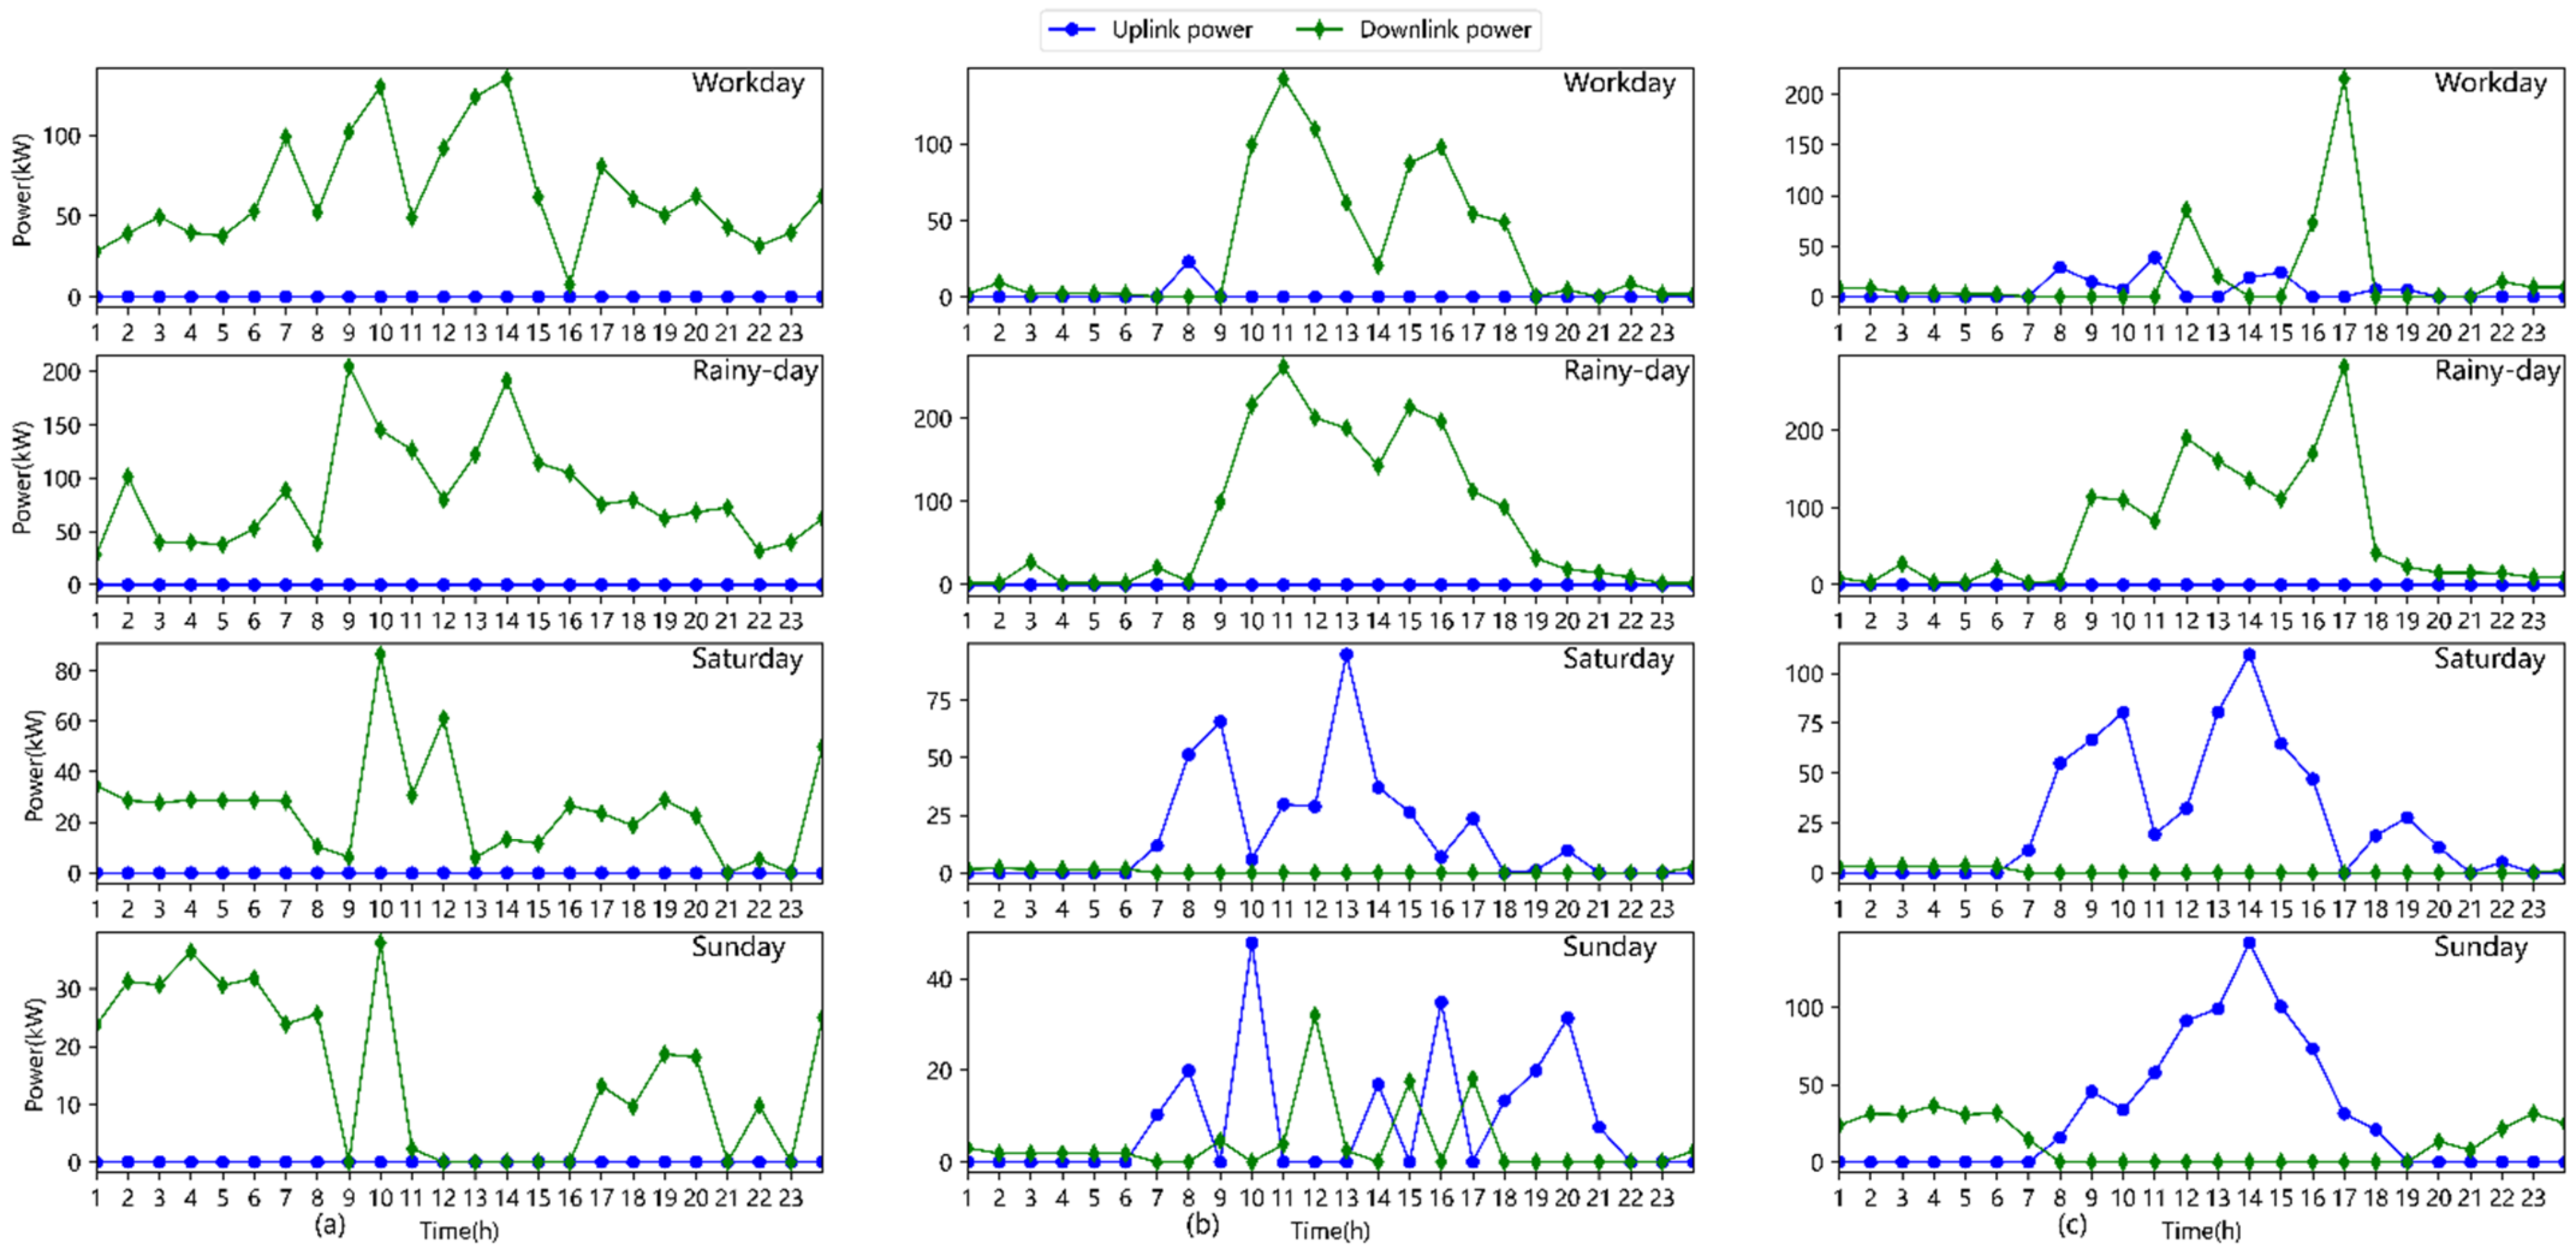
4.2. Typical Daily Load Characteristics
In this paper, the optimal configuration of the decentralized ESS for an industrial park microgrid with three transformers is taken into account. As for the daily load of each load node, it is initially categorized into working day, Saturday, and Sunday loads. The load data of each transformer, which total 14 curves and include the load data on Saturday and Sunday in addition to the normal load data for the previous 12-month working days, are used to predict the load on wet days. Figure 5 displays the three transformers’ typical daily load.
Figure 5.
Typical load curves under different transformers.
4.3. Description of Other Parameters
A lithium iron phosphate battery is chosen with an ESS efficiency of 85% during charging and discharging taking into account technological economy and safety. The upper and lower limits of the state of charge (SOC) of the ESS system are set to 100% and 20%, respectively, taking into account the 6% loan interest rate. The data sampling period is 1 h. The cost of the container battery ESS (including installation) is 1600 RMB/kWh, the cost of operation and maintenance is 0.05 RMB/kWh, and a two-part tariff is used. The ESS operation life is set to 8 years. The operating efficiency of each transformer is set to 98%. The proposed planning model is a mixed integer linear programming (MILP) problem since the constraints contain nonlinear terms, such as bilinear product terms, between variables. The optimal configuration model of the ESS was constructed using Python software in this study, and it was solved using the Gurobi 9.0 solver.
5. Numerical Analysis
5.1. Economic Analysis of Decentralized ESS
According to the PV output and load data shown in Figure 4 and Figure 5, the initial annual electricity and demand costs for the industrial park without ESS are 580,000 RMB and 260,000 RMB, respectively. In this paper, the optimal capacity and location of decentralized ESS for an industrial park with three transformers are studied. According to the multi-transformer topology of the park, seven operation scenarios are considered for comparison, and the optimal solutions of each scenario are given in Table 1. In scenarios 1, 2, and 3, ESS is configured at the load node below transformers 1, 2, and 3, respectively. In scenarios 4, 5, and 6, two ESSs are configured at the load nodes below transformers 1-2, 2-3, and 1-3, respectively. In scenario 7, three ESSs are configured at the load nodes below transformers 1-2-3. The optimal outputs of different scenarios shown in Table 1 are obtained by using multiple optimization processes.
Table 1.
Result comparison of ESS configuration under different scenarios.
As shown in Table 1, the optimal capacities of a single ESS, two ESSs, and three ESSs for an industrial park with three transformers are listed, respectively. Although the optimal capacities of ESS in different scenarios are almost the same, it can be seen from the table that the decentralized configuration ESS is superior to the single-transformer configuration ESS in terms of annual income, annual net return, and annualized investment return. This is because the decentralized configuration ESS can reduce power loss involving the lines and transformers of the industrial park. The total investment of scenario 7 is 449,400 RMB, and the investment recovery cycle is about 4 years. The ESS capacities associated with each transformer are 121 kWh, 49 kWh, and 47 kWh. It can be seen that after the installation of ESS, the electricity and demand costs of the park are 511,000 RMB and 209,700 RMB, respectively, which are 69,000 RMB and 50,300 RMB less than those without the installation of ESS.
Figure 6 compares the demand power of the park with and without ESS to analyze the impact of ESS on reducing demand power. When compared to situations without PV, installing PV can somewhat lower the demand power. Due to the impact of the weather conditions, PV production varies widely and randomly and contributes little to lowering the demand power. The demand power of the industrial park can be greatly reduced with ESS. As can be seen from the figure, the demand power is reduced by more than 100 kW per month.
Figure 6.
Demand power of the park with and without ESS.
The optimal charging and discharging power, and SOC of each ESS under workdays, rainy days, Saturdays, and Sundays are depicted in Figure 7. From the figure, it can be observed that ESS has substantially larger charging and discharging power on workdays and rainy days than it does on weekends. The load curves are comparatively flat, and the PV outputs are high on Saturday and Sunday, which explains why. The primary function of ESS in this scenario is to arbitrage through local PV usage. Moreover, we can see that the operation of ESS satisfies the SOC constraint.
Figure 7.
Charging and discharging curves of each ESS under different typical days. (a) ESS characteristic below transformer1; (b) ESS characteristic below transformer2; (c) ESS characteristic below transformer3.
Moreover, the interactive power of the gateway meter during typical days of different months is also given in Figure 8. The figure makes it very evident that PV power can lower the industrial park’s demand power obtained from the upper grid on sunny days, but its impact on demand power reduction on rainy days is minimal. The demand cost of the industrial park accounts for 30.59% of the total cost, and this further demonstrates the necessity of planning ESS for the industrial park.
Figure 8.
Power curves of gateway meter during typical days of different months. (a) March; (b) July; (c) November.
Figure 9 shows the uplink and downlink power through different transformers throughout workdays, rainy days, Saturdays, and Sundays. As can be seen from the second row in Figure 9 involving rainy days, due to the little output of PV, there are no power interaction behaviors among the different transformers. In the typical days of workdays, Saturdays, and Sundays, there is a large PV output power, and the interactive power between different transformers occurs, especially on Sunday.
Figure 9.
Uplink and downlink power of different transformers throughout workdays, rainy days, Saturdays, and Sundays. (a) Uplink and downlink power of transformer1; (b) uplink and downlink power of transformer2; (c) uplink and downlink power of transformer3.
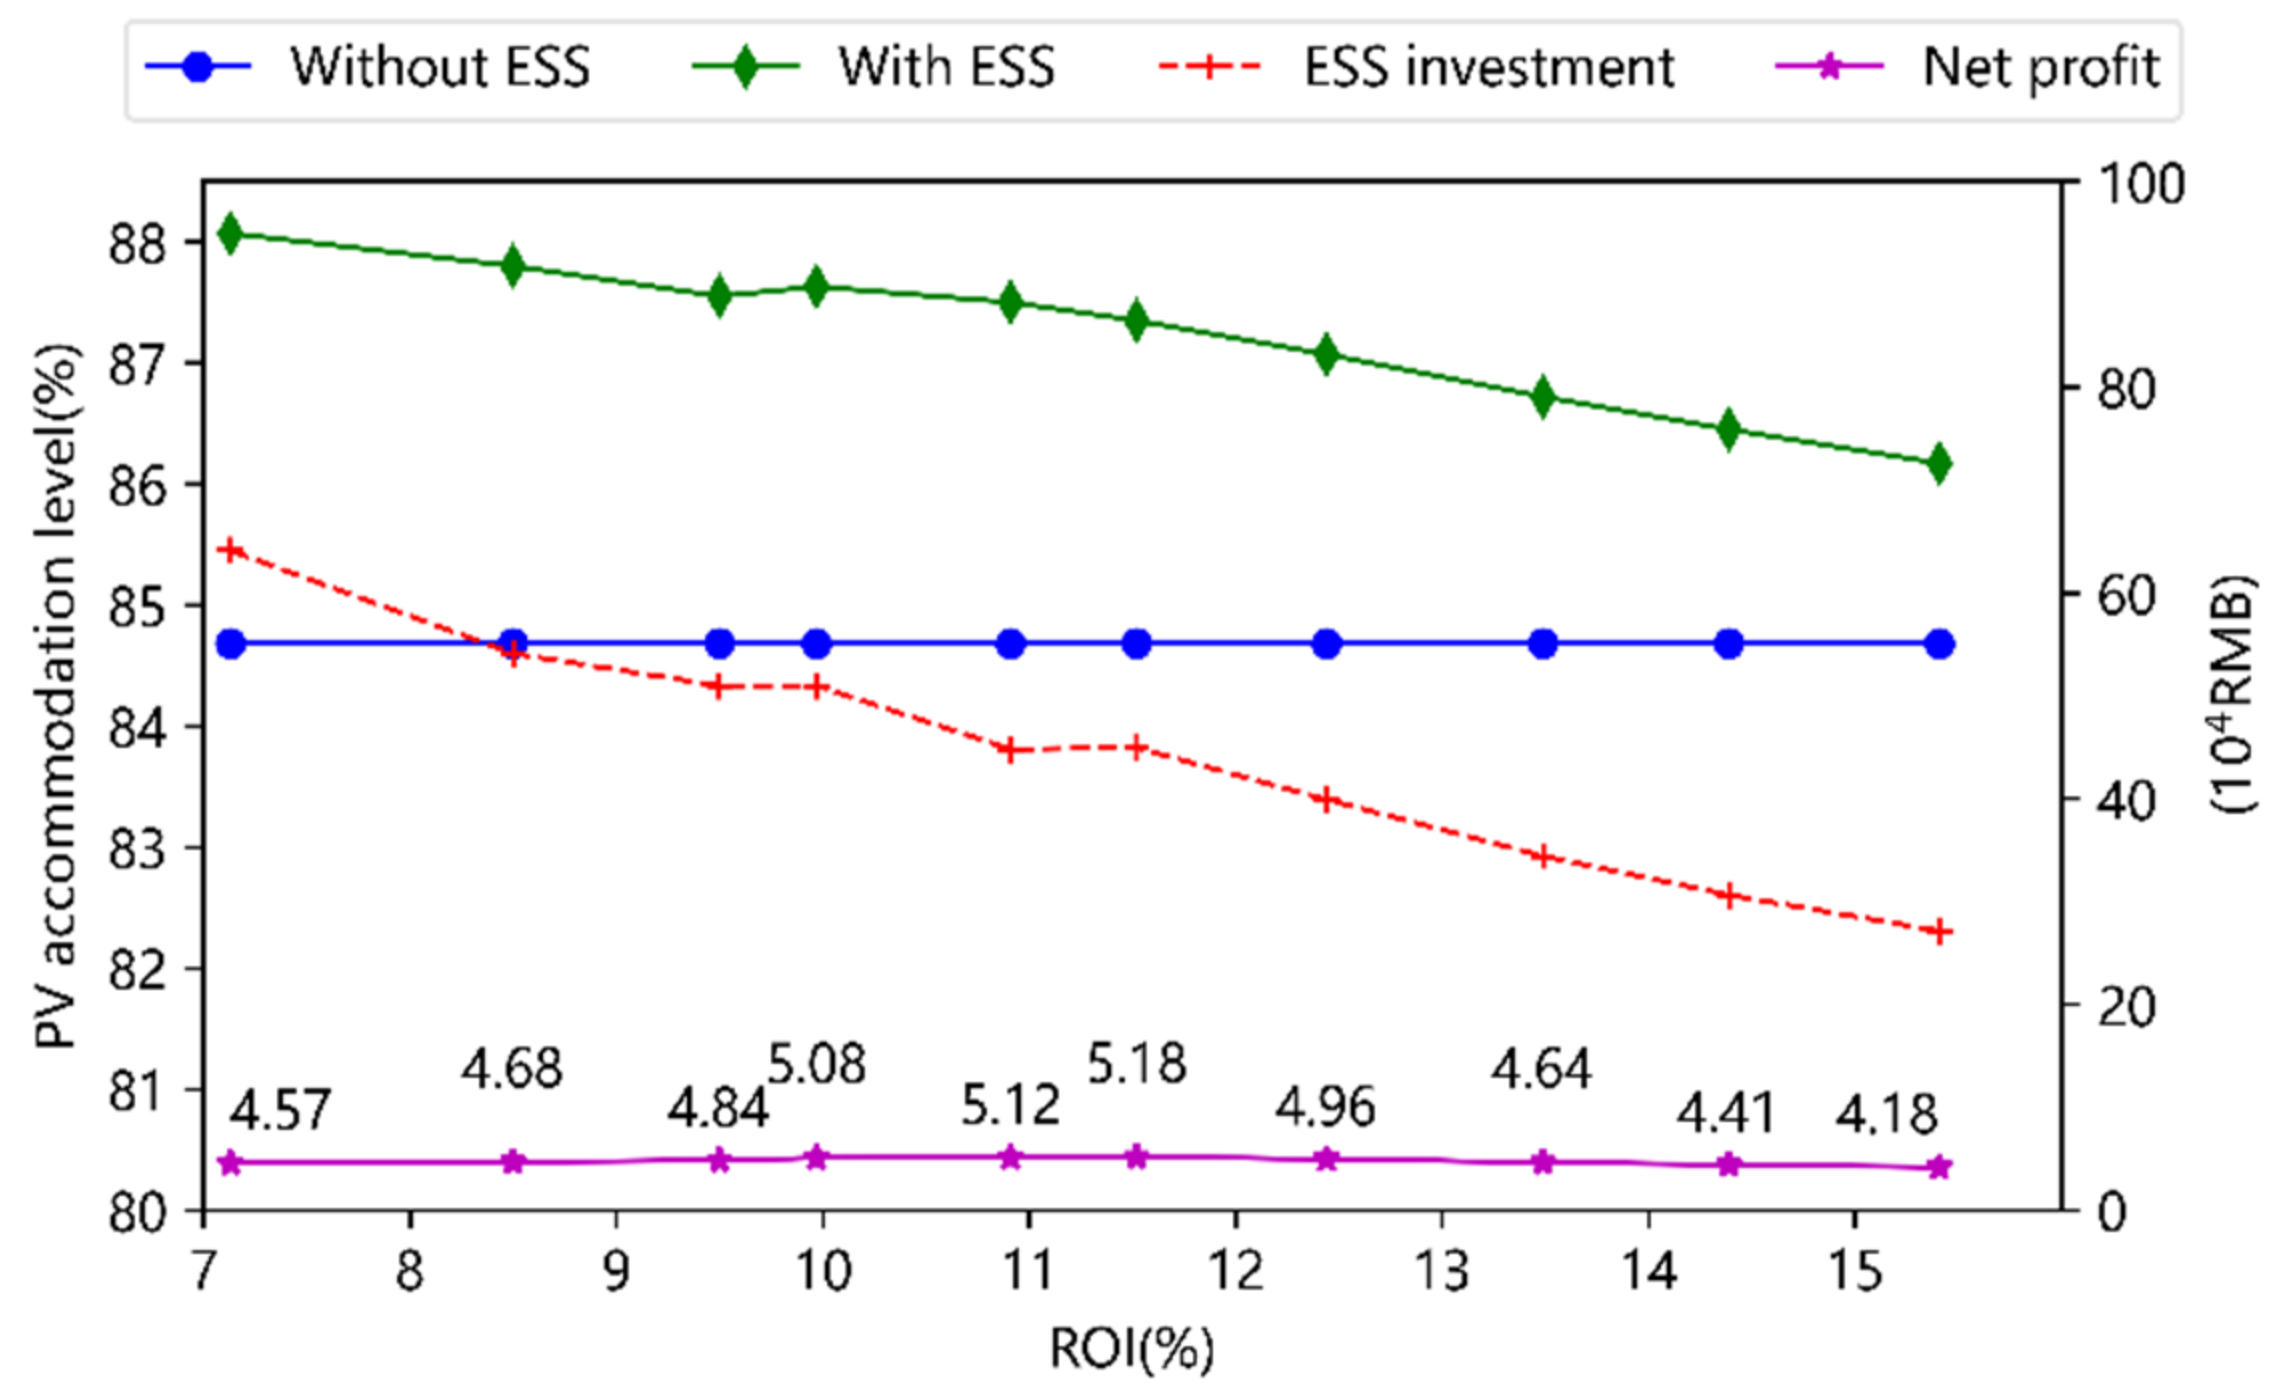
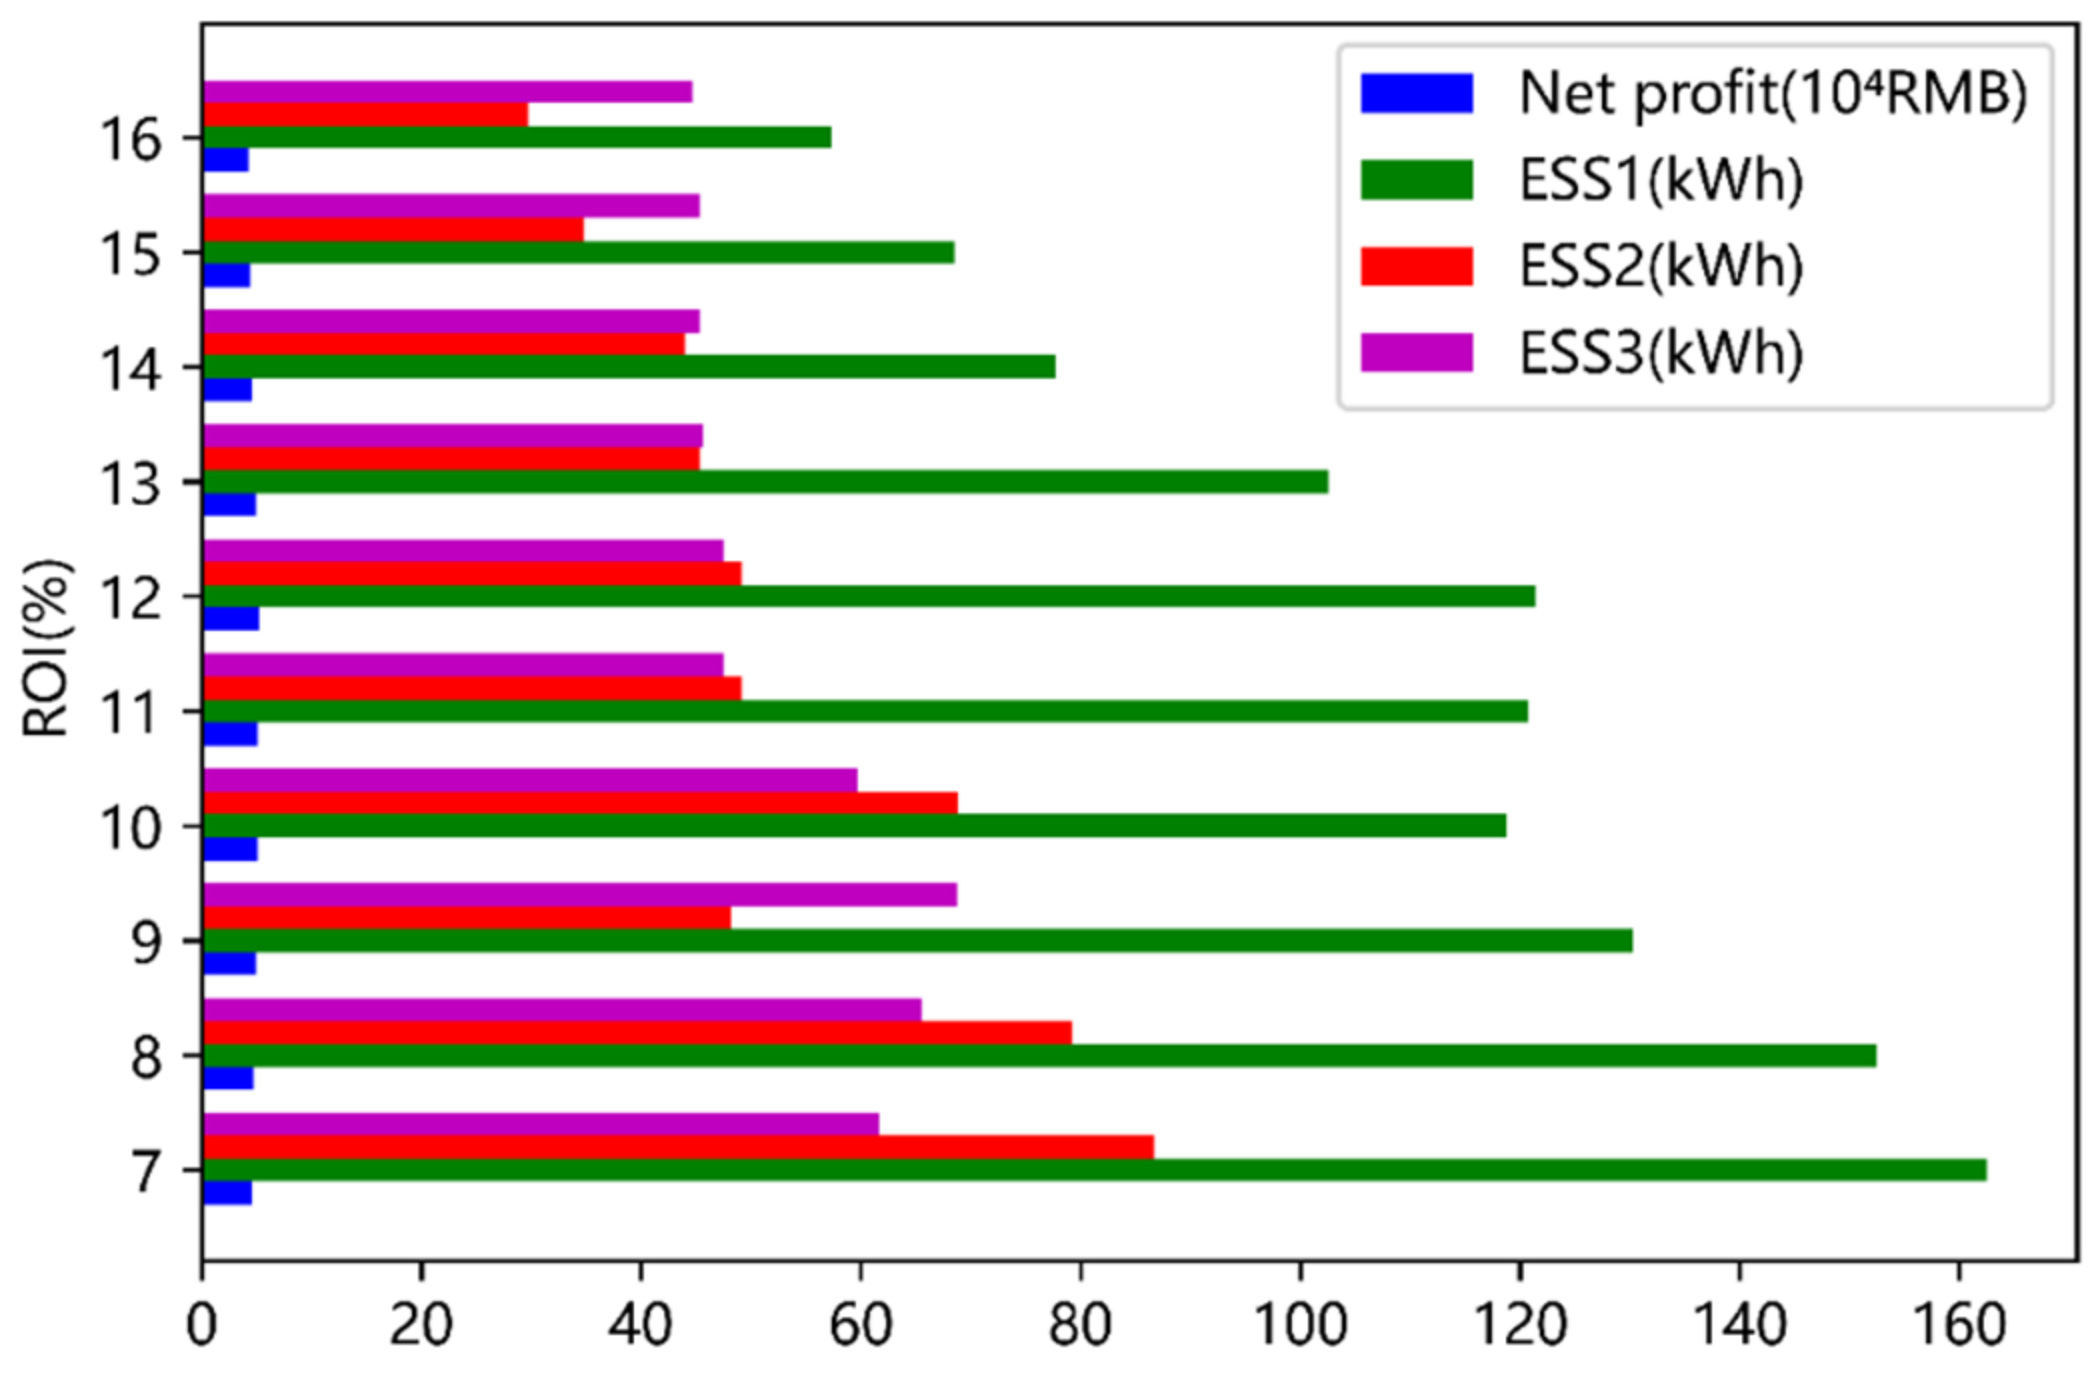
5.2. Optimal Configuration Analysis of Decentralized ESS under Different Return on Investments
The two most important issues when park users install ESS to take part in energy management are investment and return. Users frequently worry about how to set up ESS to optimize ultimate returns on the assumption of a specific return on investment (ROI). Finding a balance between revenue and user input is so crucial.
In this subsection, the optimal configuration of decentralized ESS under different ROIs is investigated. Figure 10 illustrates the relationship between the net profit, PV accommodation level, and ROI of the park. The figure shows that when ROI increases, the amount of PV accommodation and the ESS investment are on the decline. This is due to the fact that a high ESS installation would not provide the park with a significant return, and as a result, the ESS’s capacity is constrained by a greater ROI requirement. Additionally, with the increase in ROI, the net profit increases first and then decreases. Moreover, it is interesting to note that ESS investment and PV accommodation level have a positive correlation. The simulation results also show that the suggested strategy can optimize the park’s return while ensuring a specific level of investment.
Figure 10.
Configuration analysis of decentralized ESS under different ROIs.
Figure 11 depicts the optimal capacities and net profit of ESS under different ROIs. As the ROI rises, the capacities of ESS put beneath each transformer diminish. This suggests that in order to find a compromise solution for multiple-transformer-integrated industrial parks, the ROI and net profit should be taken into account.
Figure 11.
The optimal capacities and net profit of ESS under different ROIs.
6. Conclusions
This paper presented a thorough analysis of ESS planning for a multi-transformer-integrated industrial park. To examine the cost–benefit of ESS for the park, the planning model fully took the TOU electricity tariff, demand tariff, on-grid power price, and ESS operation and maintenance cost into account. Moreover, the load characteristics and bidirectional energy interaction of different nodes were also considered in the planning model to determine the optimal capacity and location of ESS. The effectiveness of the proposed planning model was validated by testing on an industrial park with three transformers in Zibo city, China, and we drew the following conclusions:
- (1)
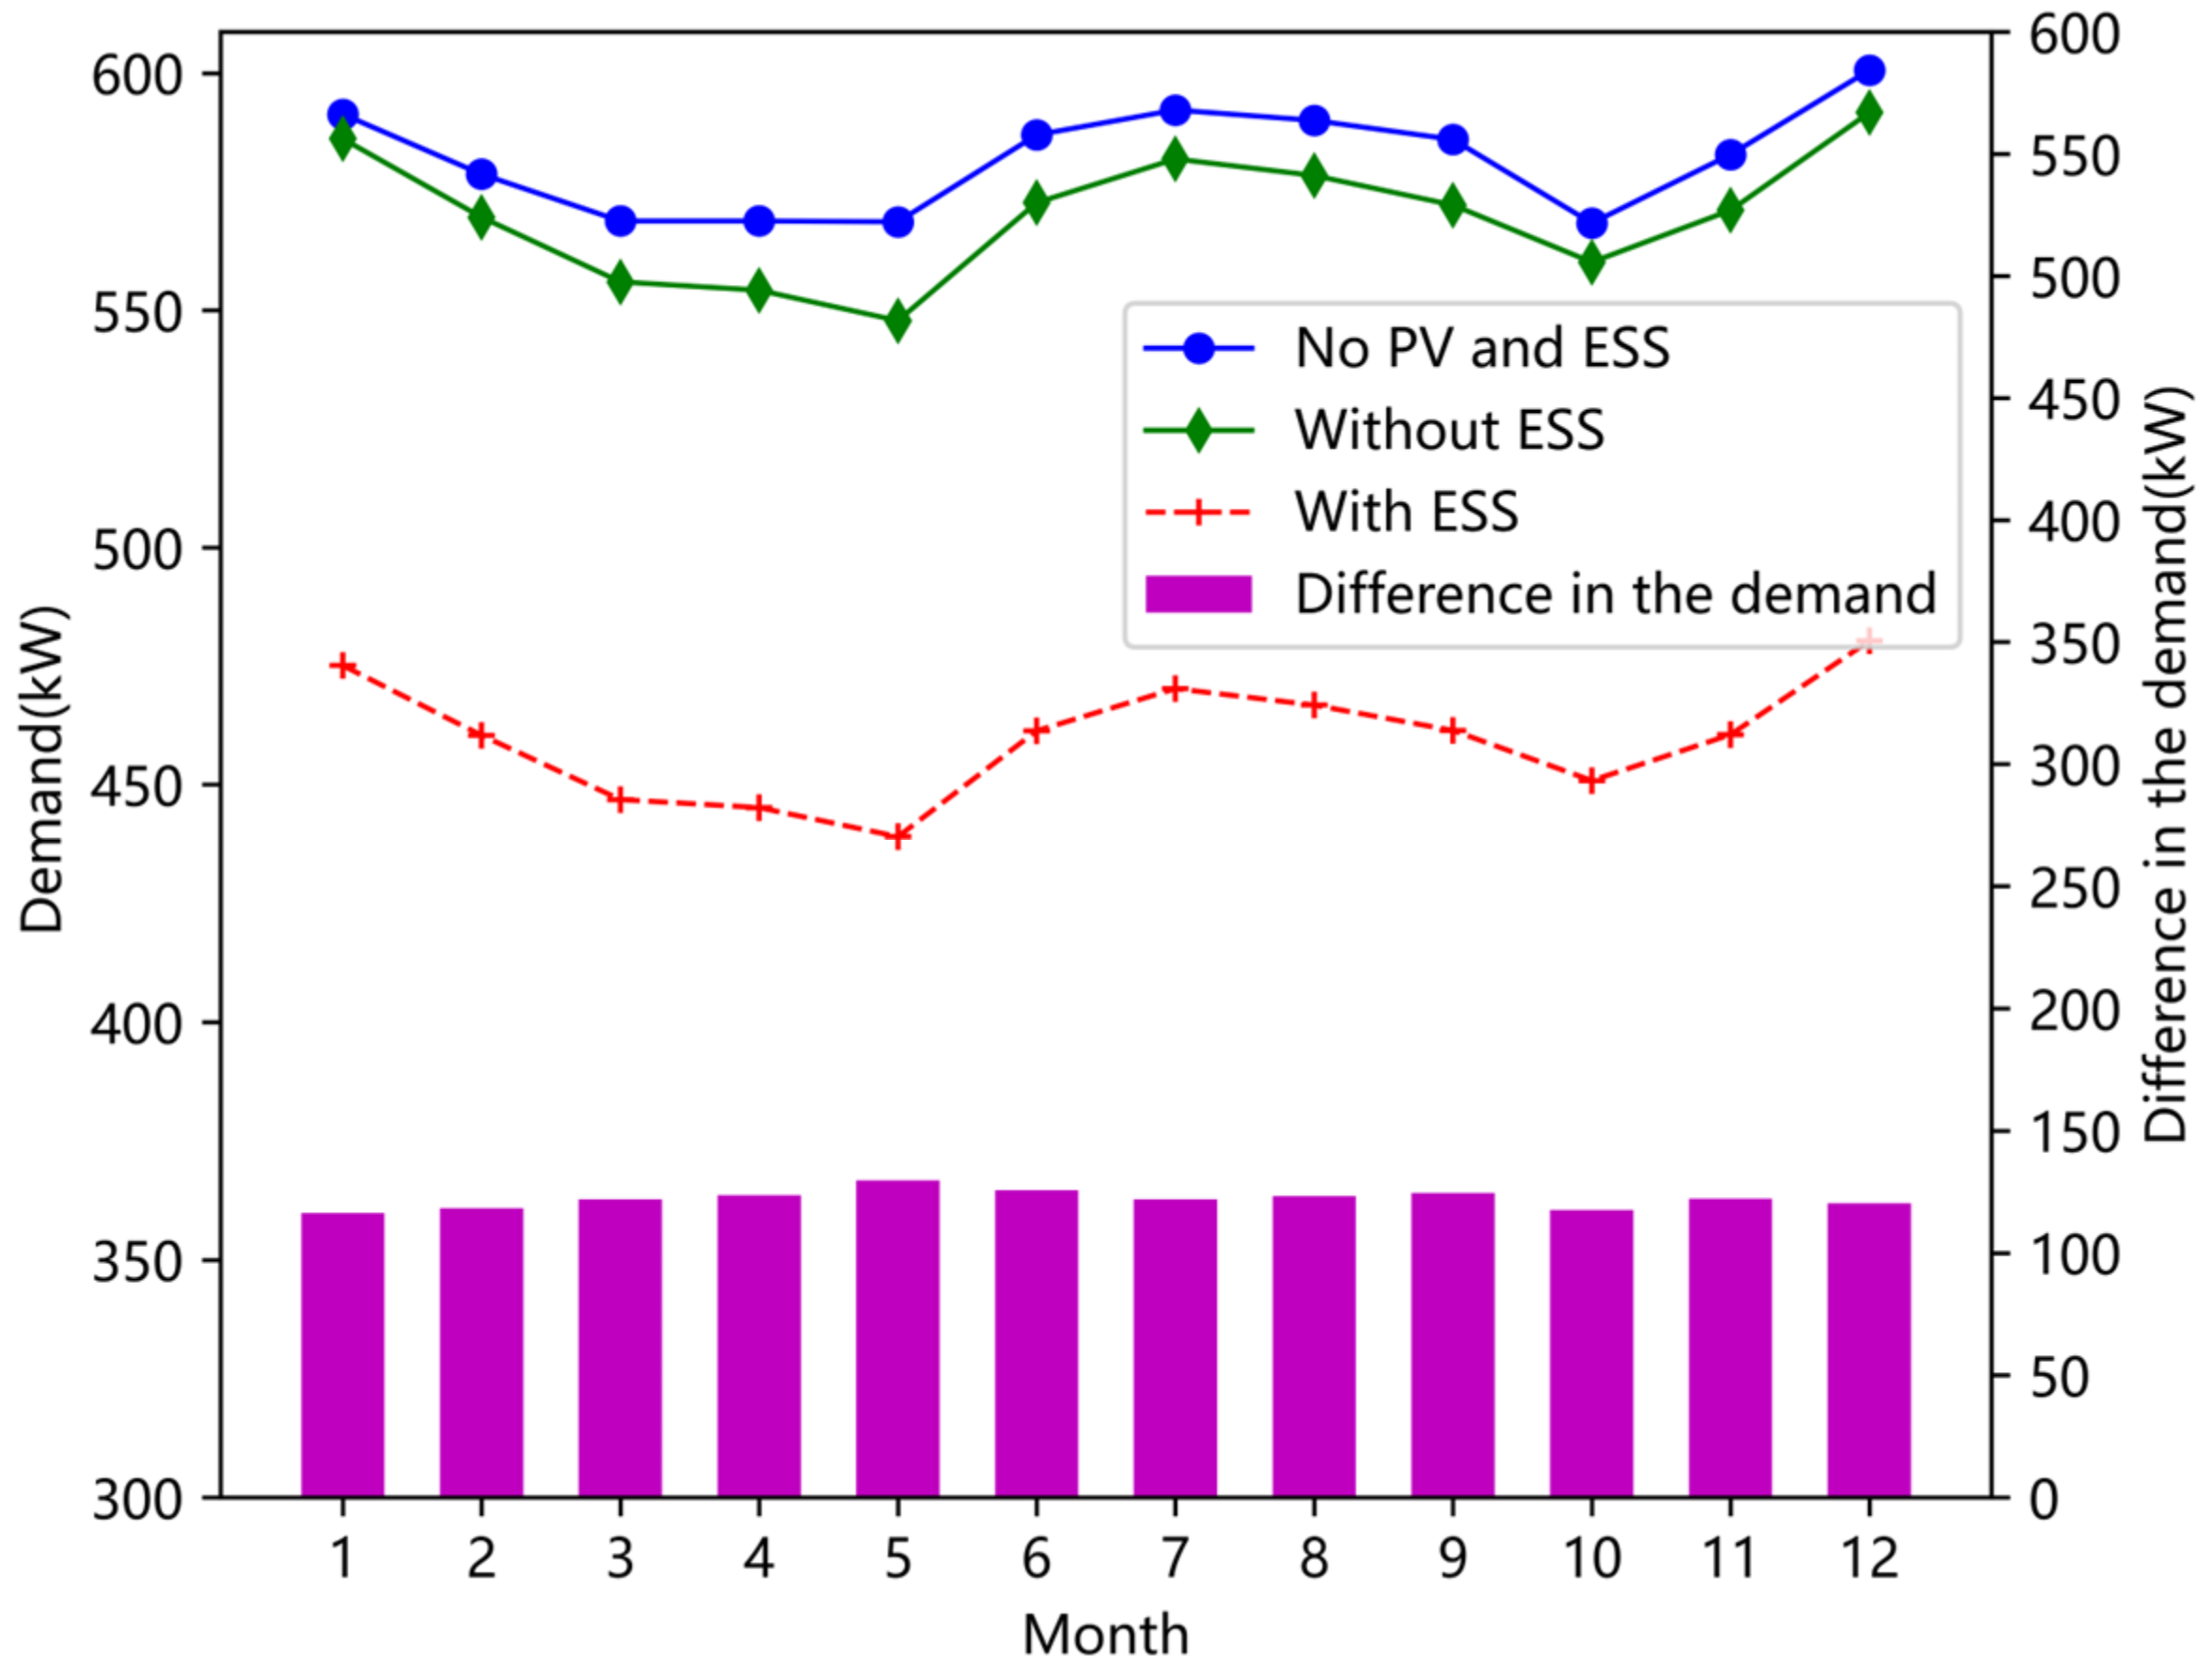
- ESS can effectively lower electricity and demand costs of industrial parks, which fall by 11.90% and 19.35%, respectively, in contrast to those without the installation of ESS.
- (2)
- It is important to take into account the location optimization of ESS in multiple-transformer-integrated industrial park microgrids. The ROI and annualized investment are in conflict with each other, which should be considered simultaneously in ESS planning.
- (3)
- The installation of ESS can help industrial parks accommodate PV power. PV becomes less accommodating as the annual net return rises. This is due to the fact that a low ESS configuration capacity is correlated with a high yearly net return, which lowers the amount of accommodation, and the PV accommodation level increases from 84.68% to 88%.
- (4)
- As for an industrial park, ESS configuration is not the more the better. This also verifies the necessity to optimize ESS in industrial parks with PV.
Author Contributions
W.C. and J.C., conceptualization, methodology, and investigation; B.X., writing, review, funding acquisition, and supervision; X.C. and W.Y., writing—review and editing. All authors have read and agreed to the published version of the manuscript.
Funding
This research was funded by a project supported by the National Natural Science Foundation of China (52005306).
Data Availability Statement
The data used to support the findings of this study are available from the corresponding author upon request.
Conflicts of Interest
The authors declare no conflict of interest.
References
- Abdalla, A.N.; Nazir, M.S.; Tao, H.; Cao, S.; Ji, R.; Jiang, M.; Yao, L. Integration of Energy Storage System and Renewable Energy Sources Based on Artificial Intelligence: An Overview. J. Energy Storage 2021, 40, 102811. [Google Scholar] [CrossRef]
- Wei, Y.M.; Chen, K.; Kang, J.N.; Chen, W.; Wang, X.Y.; Zhang, X. Policy and Management of Carbon Peaking and Carbon Neutrality: A Literature Review. Engineering 2022, 14, 52–63. [Google Scholar] [CrossRef]
- Okubo, T.; Shimizu, T.; Hasegawa, K.; Kikuchi, Y.; Manzhos, S.; Ihara, M. Factors Affecting the Techno-Economic and Environmental Performance of on-Grid Distributed Hydrogen Energy Storage Systems with Solar Panels. Energy 2023, 269, 126736. [Google Scholar] [CrossRef]
- Anastasovski, A. What Is Needed for Transformation of Industrial Parks into Potential Positive Energy Industrial Parks? A Review. Energy Policy 2023, 173, 113400. [Google Scholar] [CrossRef]
- Wei, Y.; Han, T.; Wang, S.; Qin, Y.; Lu, L.; Han, X.; Ouyang, M. An Efficient Data-Driven Optimal Sizing Framework for Photovoltaics-Battery-Based Electric Vehicle Charging Microgrid. J. Energy Storage 2022, 55, 105670. [Google Scholar] [CrossRef]
- Tan, Q.; Ding, Y.; Zheng, J.; Dai, M.; Zhang, Y. The Effects of Carbon Emissions Trading and Renewable Portfolio Standards on the Integrated Wind–Photovoltaic–Thermal Power-Dispatching System: Real Case Studies in China. Energy 2021, 222, 119927. [Google Scholar] [CrossRef]
- Li, B.; Li, M.; Yan, S.; Zhang, Y.; Shi, B.; Ye, J. An optimal energy storage system sizing determination for improving the utilization and forecasting accuracy of photovoltaic (PV) power stations. Front. Energy Res. 2023, 10, 1–12. [Google Scholar] [CrossRef]
- Su, R.; He, G.; Su, S.; Duan, Y.; Cheng, J.; Chen, H.; Wang, K.; Zhang, C. Optimal placement and capacity sizing of energy storage systems via NSGA-II in active distribution network. Front. Energy Res. 2023, 10, 1875. [Google Scholar] [CrossRef]
- Xie, R.; Wei, W.; Shahidehpour, M.; Wu, Q.; Mei, S. Sizing renewable generation and energy storage in stand-alone microgrids considering distributionally robust shortfall risk. IEEE Trans. Power Syst. 2022, 37, 4054–4066. [Google Scholar] [CrossRef]
- Matin, S.A.A.; Mansouri, S.A.; Bayat, M.; Jordehi, A.R.; Radmehr, P. A multi-objective bi-level optimization framework for dynamic maintenance planning of active distribution networks in the presence of energy storage systems. J. Energy Storage 2022, 52, 104762. [Google Scholar] [CrossRef]
- Mishra, D.K.; Ghadi, M.J.; Li, L.; Zhang, J.; Hossain, M.J. Active distribution system resilience quantification and enhancement through multi-microgrid and mobile energy storage. Appl. Energy 2022, 311, 118665. [Google Scholar] [CrossRef]
- Moshe, S.; Oz, B. Charging More for Priority via Two-Part Tariff for Accumulating Priorities. Eur. J. Oper. Res. 2023, 304, 652–660. [Google Scholar] [CrossRef]
- Hosseini Imani, M.; Niknejad, P.; Barzegaran, M.R. Implementing Time-of-Use Demand Response Program in Microgrid Considering Energy Storage Unit Participation and Different Capacities of Installed Wind Power. Electr. Power Syst. Res. 2019, 175, 105916. [Google Scholar] [CrossRef]
- Wei, X.; Qiu, R.; Liang, Y.; Liao, Q.; Klemeš, J.J.; Xue, J.; Zhang, H. Roadmap to Carbon Emissions Neutral Industrial Parks: Energy, Economic and Environmental Analysis. Energy 2022, 238, 121732. [Google Scholar] [CrossRef]
- Bahramirad, S.; Reder, W.; Khodaei, A. Reliability-Constrained Optimal Sizing of Energy Storage System in a Microgrid. IEEE Trans. Smart Grid 2012, 3, 2056–2062. [Google Scholar] [CrossRef]
- Fallahifar, R.; Kalantar, M. Optimal Planning of Lithium Ion Battery Energy Storage for Microgrid Applications: Considering Capacity Degradation. J. Energy Storage 2023, 57, 106103. [Google Scholar] [CrossRef]
- Du, X.; Li, X.; Hao, Y.; Chen, L. Sizing of centralized shared energy storage for resilience microgrids with controllable load: A bi-level optimization approach. Front. Energy Res. 2022, 10, 954833. [Google Scholar] [CrossRef]
- Ma, M.; Huang, H.; Song, X.; Peña-Mora, F.; Zhang, Z.; Chen, J. Optimal sizing and operations of shared energy storage systems in distribution networks: A bi-level programming approach. Appl. Energy 2022, 307, 118170. [Google Scholar] [CrossRef]
- Hong, Z.; Wei, Z.; Li, J.; Han, X. A Novel Capacity Demand Analysis Method of Energy Storage System for Peak Shaving Based on Data-Driven. J. Energy Storage 2021, 39, 102617. [Google Scholar] [CrossRef]
- Schaefer, E.W.; Hoogsteen, G.; Hurink, J.L.; van Leeuwen, R.P. Sizing of Hybrid Energy Storage through Analysis of Load Profile Characteristics: A Household Case Study. J. Energy Storage 2022, 52, 104768. [Google Scholar] [CrossRef]
- Samanta, A.; Chowdhuri, S. Active Cell Balancing of Lithium-Ion Battery Pack Using Dual DC-DC Converter and Auxiliary Lead-Acid Battery. J. Energy Storage 2021, 33, 102109. [Google Scholar] [CrossRef]
- Zhang, Y.; Augenbroe, G. Optimal demand charge reduction for commercial buildings through a combination of efficiency and flexibility measures. Appl. Energy 2018, 221, 180–194. [Google Scholar] [CrossRef]
- Wei, J.; Zhang, Y.; Wang, J.; Wu, L. Distribution LMP-based demand management in industrial park via a bi-level programming approach. IEEE Trans. Sustain. Energy 2021, 12, 1695–1706. [Google Scholar] [CrossRef]
- Wikstrom, P.; Terens, L.A.; Kobi, H. Reliability, availability, and maintainability of high-power variable-speed drive systems. IEEE Trans. Ind. Appl. 2000, 36, 231–241. [Google Scholar] [CrossRef]
- Chen, J.J.; Qi, B.X.; Rong, Z.K.; Peng, K.; Zhao, Y.L.; Zhang, X.H. Multi-Energy Coordinated Microgrid Scheduling with Integrated Demand Response for Flexibility Improvement. Energy 2021, 217, 119387. [Google Scholar] [CrossRef]
- Qu, Z.L.; Chen, J.J.; Peng, K.; Zhao, Y.L.; Rong, Z.K.; Zhang, M.Y. Enhancing stochastic multi-microgrid operational flexibility with mobile energy storage system and power transaction. Sustain. Cities Soc. 2021, 71, 102962. [Google Scholar] [CrossRef]
- Ma, G.; Li, J.; Zhang, X.P. Energy Storage Capacity Optimization for Improving the Autonomy of Grid-connected Microgrid. IEEE Trans. Smart Grid 2023. [Google Scholar] [CrossRef]
- Ullah, A.; Imran, H.; Maqsood, Z.; Butt, N.Z. Investigation of optimal tilt angles and effects of soiling on PV energy production in Pakistan. Renew. Energy 2019, 139, 830–843. [Google Scholar] [CrossRef]
- Bakker, K.; Whan, K.; Knap, W.; Schmeits, M. Comparison of statistical post-processing methods for probabilistic NWP forecasts of solar radiation. Sol. Energy 2019, 191, 138–150. [Google Scholar] [CrossRef]
- Chen, C.; Duan, S.; Cai, T.; Liu, B.; Hu, G. Smart energy management system for optimal microgrid economic operation. IET Renew. Power Gener. 2010, 5, 258–267. [Google Scholar] [CrossRef]
Disclaimer/Publisher’s Note: The statements, opinions and data contained in all publications are solely those of the individual author(s) and contributor(s) and not of MDPI and/or the editor(s). MDPI and/or the editor(s) disclaim responsibility for any injury to people or property resulting from any ideas, methods, instructions or products referred to in the content. |
© 2023 by the authors. Licensee MDPI, Basel, Switzerland. This article is an open access article distributed under the terms and conditions of the Creative Commons Attribution (CC BY) license (https://creativecommons.org/licenses/by/4.0/).