You are currently viewing a new version of our website. To view the old version click .
Energies
  • Article
  • Open Access

27 March 2023

Operational Parameter Analysis and Performance Optimization of Zinc–Bromine Redox Flow Battery

,
,
and
1
Department of Mathematics and Physics, North China Electric Power University, Beijing 102206, China
2
Key Laboratory of Power Station Energy Transfer Conversion and System, Ministry of Education, North China Electric Power University, Beijing 102206, China
3
School of Energy Power and Mechanical Engineering, North China Electric Power University, Beijing 102206, China
*
Author to whom correspondence should be addressed.
This article belongs to the Special Issue Emerging Materials, Structures, and Devices in Energy Conversion and Storage

Abstract

Zinc–bromine redox flow battery (ZBFB) is one of the most promising candidates for large-scale energy storage due to its high energy density, low cost, and long cycle life. However, numerical simulation studies on ZBFB are limited. The effects of operational parameters on battery performance and battery design strategy remain unclear. Herein, a 2D transient model of ZBFB is developed to reveal the effects of electrolyte flow rate, electrode thickness, and electrode porosity on battery performance. The results show that higher positive electrolyte flow rates can improve battery performance; however, increasing electrode thickness or porosity causes a larger overpotential, thus deteriorating battery performance. On the basis of these findings, a genetic algorithm was performed to optimize the batter performance considering all the operational parameters. It is found that the battery energy efficiency can reach 79.42% at a current density of 20   mA   cm 2 . This work is helpful to understand the energy storage characteristics and high-performance design of ZBFB operating at various conditions.

1. Introduction

Renewable energy, such as wind and solar power, is an effective way to achieve carbon neutrality [1,2]. However, the intermittent and fluctuation nature hinder its development, stimulating the requirement of energy storage technologies [3,4]. Redox flow batteries (RFB) are a promising large-scale energy storage technique due to their high energy efficiency, large energy storage scale, long cycle life, and easy scalability [5,6,7]. Currently, all-vanadium redox flow batteries (VRFB), zinc–iron redox flow batteries (ZIRFB), and zinc–bromine redox flow batteries (ZBFB) have been scaled up and commercialized [8]. Their advantages and disadvantages are compared in Table 1. It is found that ZBFB exhibits superior energy density, low cost, and long cycle life [9,10,11,12,13,14].
Table 1. Comparison of the advantages and disadvantages of VRFB, ZIRFB, and ZBFB.
Many studies have been performed to improve ZBFB performance. To inhibit zinc dendrite, Kim et al. [15] examined the electrochemical characteristics of a bromine complex agent during zinc deposition and dissolution. The bromine complex diffusion rate on the zinc metal surface affects zinc dendrite formation. Zinc dendrite development is suppressed by increasing bromine complex concentration. Jiang et al. [16] discovered that increasing carbon surface vacancies changes zinc distribution and morphology. Accordingly, graphite felt electrodes with high carbon defect content were developed to limit zinc dendrite growth and uniformly deposit in the negative electrode. To alleviate the continuous decline in ZBFB current efficiency, Yang et al. [17] discovered that adding a surface-active agent to the electrolyte can increase catholyte mixing on the electrode surface, thus improving current efficiency and battery stability. To reduce the internal resistance of ZBFB, Wu et al. [18] used highly ionic conductive supporting electrolytes to improve the electrolyte conductivity, where heat-treated graphite felt electrode was also used to boost catalytic activity. It is found that the energy efficiency of ZBFB assembled with treated electrodes is improved significantly. To improve positive electrode catalytic activity, Archana et al. [19] modified the graphite felt electrode under oxygen and nitrogen atmospheres to increase its surface area and oxygen-containing functional groups. Finally, the energy efficiency of ZBFB can reach 77% at 10   mA   cm 2 .
For better battery design, comprehensive understanding of the physics behind structural design and operational parameters is a prerequisite. Despite significant progress in ZBFB, most studies are performed by experiments. Compared with experiments, numerical modeling is a more economical and effective tool to reveal the underlying mechanisms of flow batteries [20]. Earlier, simple 1D and 2D steady-state models were utilized to study the electrochemical reaction mechanisms of ZBFB. Unfortunately, charge transfer losses and side reactions were ignored, and it failed to simulate electrolyte transport [21,22,23,24]. In recent years, Koo et al. [25] developed a model on the basis of Ohm’s law and charge conservation to calculate ZBFB current distribution to predict battery charging and discharging behavior, which can also identify the ideal operational parameters of the stack. Xu et al. [26] developed a 2D model incorporating mass transfer and electrochemistry, where a 3D sub-model of the electrolyte flow channel could examine the effects of different flow channel types on battery performance. However, none of the above studies examined the impacts of operational parameters on ZBFB performance.
In the literature, the impacts of electrolyte flow rate, electrode thickness, and porosity on VRFB performance have been reported [27,28,29]. It has been demonstrated that operational parameters significantly affect VRFB performance. However, since VRFB and ZBFB operate under different principles, the mechanism and results may differ on how operational parameters affect the battery performance. The experiences with VRFB may no longer hold for ZBFB. On the basis of this gap, this paper aims to develop a ZBFB model to answer how positive electrolyte flow rate, electrode thickness, and electrode porosity affect battery charging and discharging. Furthermore, the impacts of these parameters on ZBFB performance are complex due to the inter-coupling effect between them. Each parameter has an optimal value under a particular condition, but it will be varied when operating conditions changed. Thus, achieving the best battery design requires multi-parameter optimization. A single-objective genetic algorithm (GA) is coupled into the model to address this issue.

2. Numerical Modeling

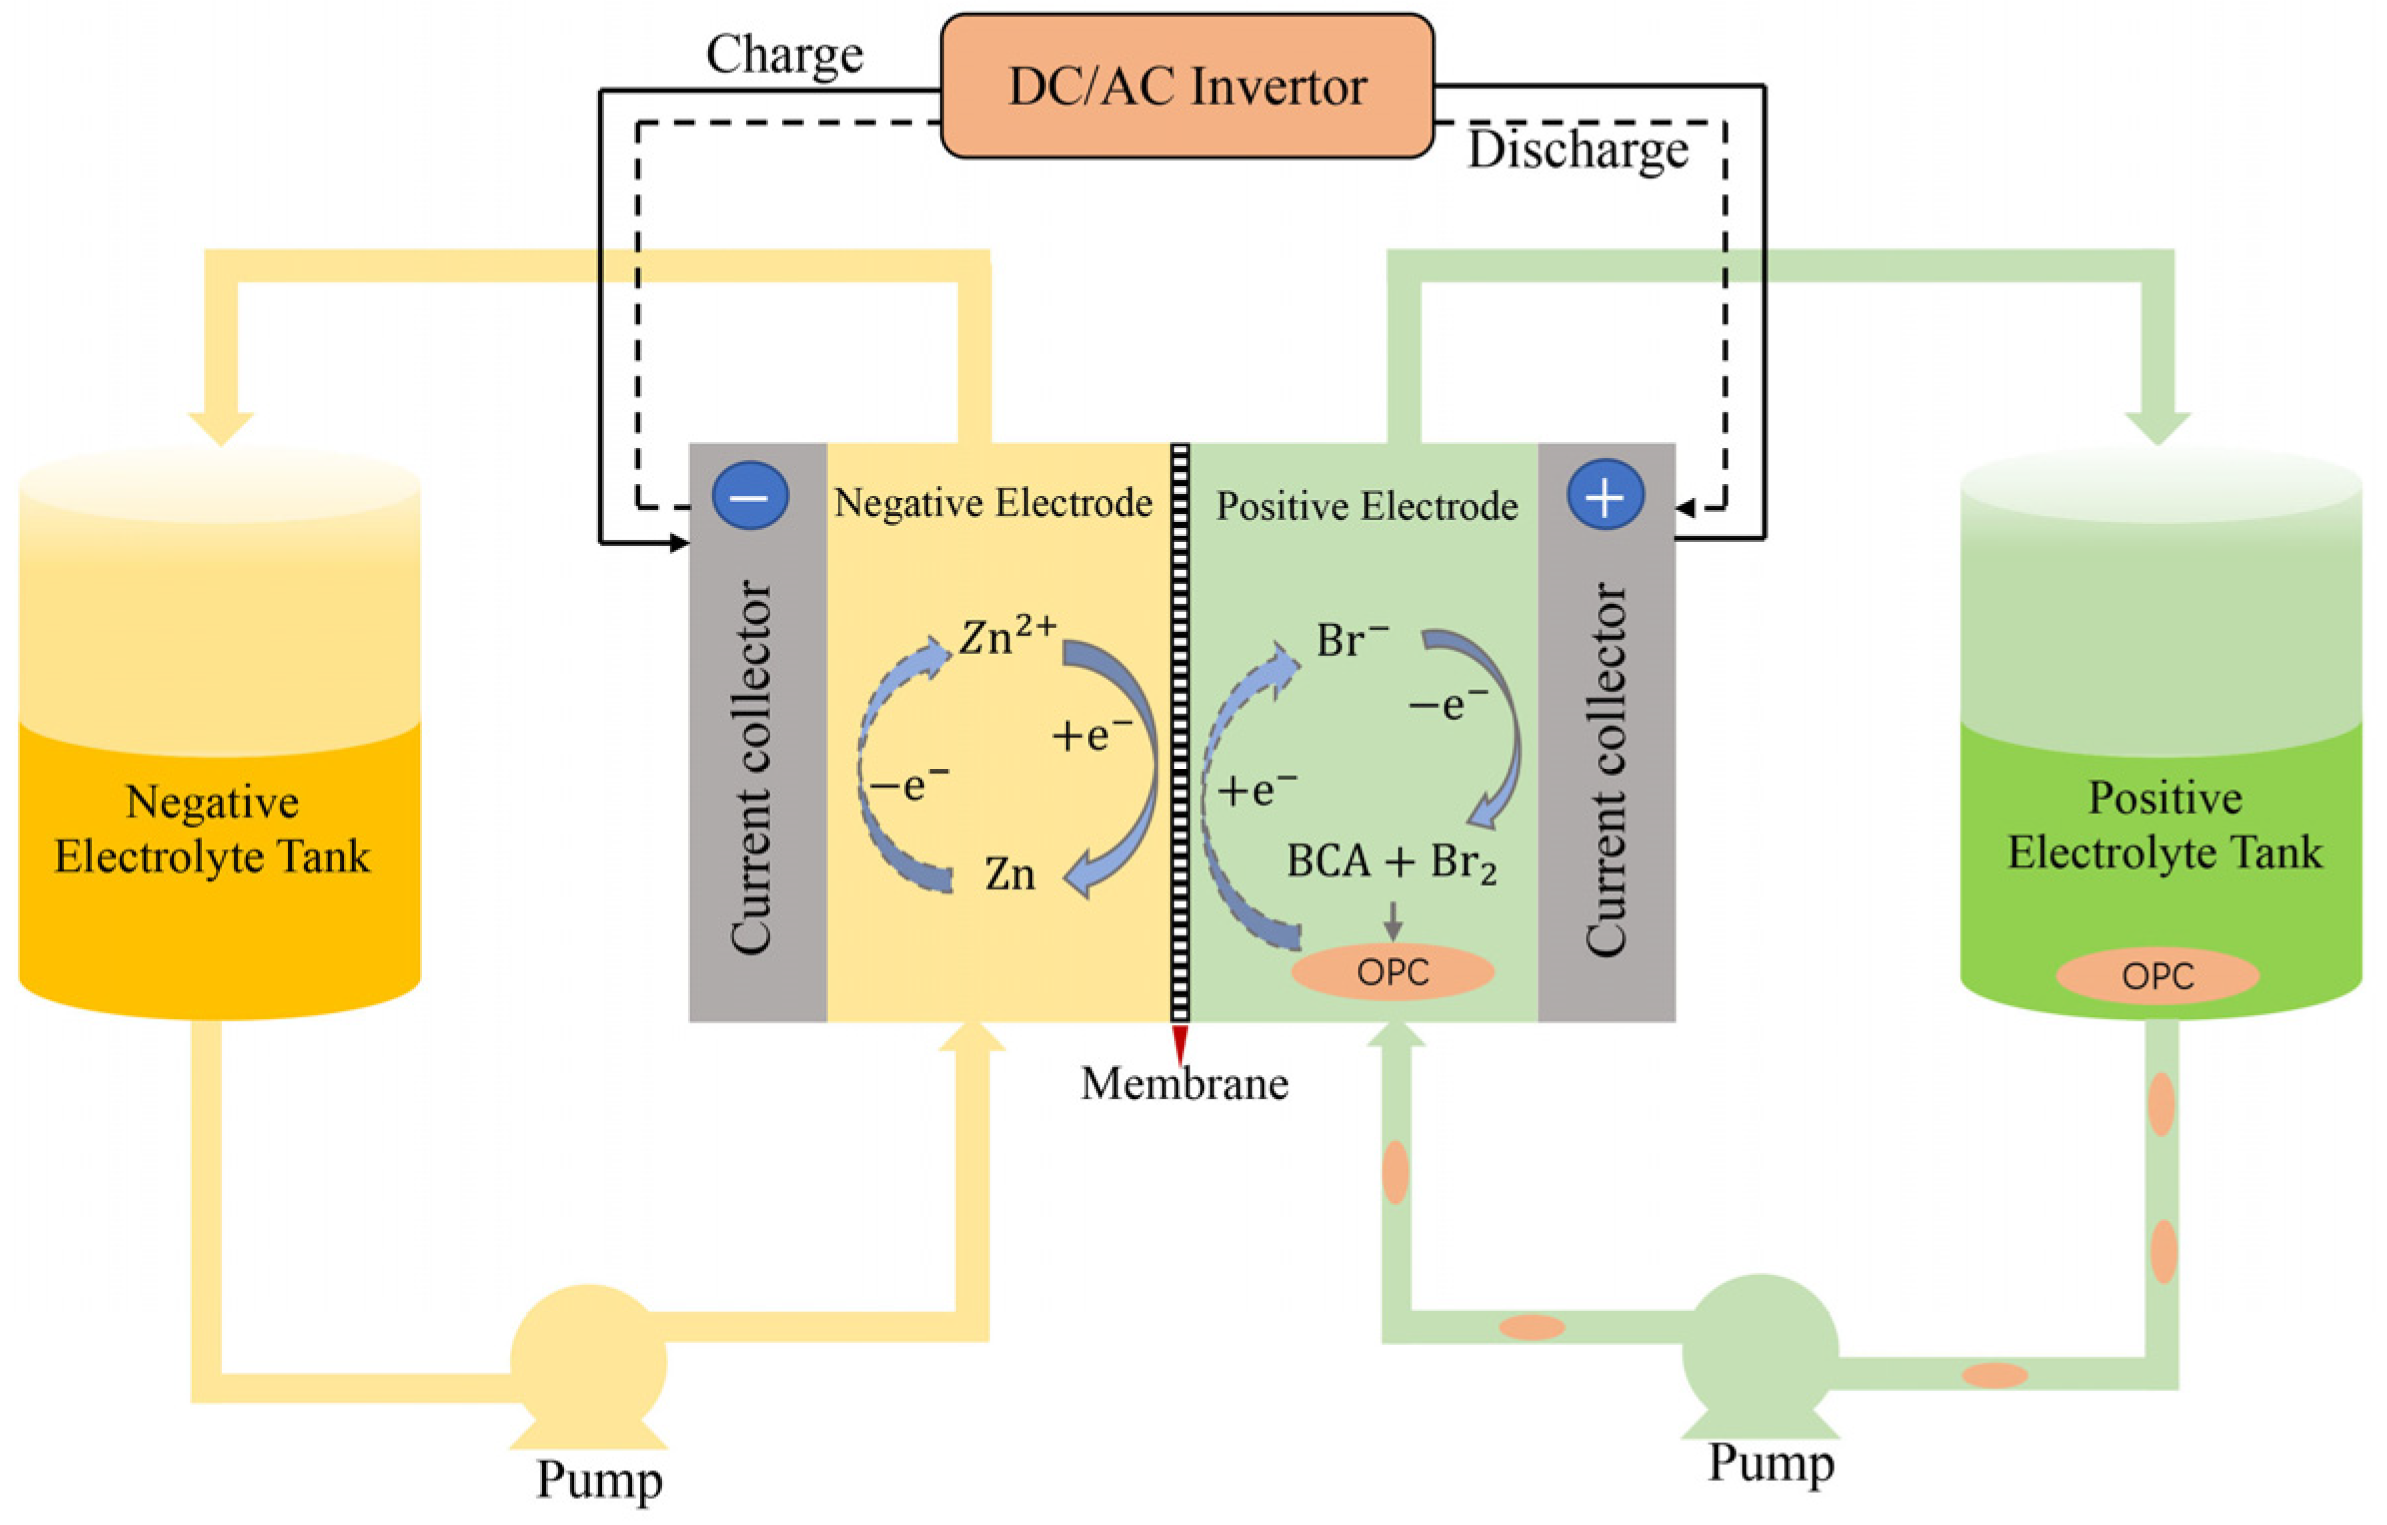
2.1. Electrochemical Reactions

The structure and principle of the ZBFB are shown in Figure 1, which consists of current collectors, porous electrodes, a membrane, tanks for storing electrolytes, and pumps for transporting electrolytes. The main electrolyte component is ZnBr 2 . B r / B r 2 and Z n 2 + / Z n are the redox pairs at the positive and negative electrodes, respectively. Bromine ions are oxidized to bromine during charging, and zinc ions are reduced to zinc. During discharging, the reaction occurs in the opposite direction. The expressions of the redox reaction are as follows:
Figure 1. Schematic diagram of the structure and principle of ZBFB (BCA = bromine complex agent; OPC = oily polybromide complex).
Positive electrode:
2 B r discharge charge B r 2 + 2 e
Negative electrode:
Z n 2 + + 2 e discharge charge Z n
Total reaction:
2 B r + Z n 2 + discharge charge B r 2 + Z n

2.2. Governing Equations

2.2.1. Transport in Electrodes

The electrolyte of ZBFB is a mixture of liquid, including charged species and a bromine complex agent. The electrolyte flow in a porous electrode can be numerically simulated by considering the equations of species, mass, momentum, and electrochemical reactions. The mass conservation equation for each species in ZBFB can be expressed as:
t ( ε c i ) + · N i = S i
where c i is the species concentration, ε is the electrode porosity, N i is the species molar flux, and S i is the source term. The molar flux of each specie in Equation (4) can be calculated by the Nernst–Planck equation:
N i = D i e f f c i z i κ i c i F ϕ I + u c i
This equation represents the mass transfer caused by diffusion, migration, and convection sequentially, where D i e f f is the effective diffusion coefficient, ϕ is the potential, κ i is the ionic mobility, F is the Faraday’s constant, and u is the electrolyte velocity. The effective diffusion coefficient D i e f f of the species can be calculated using the Bruggemann equation:
D i e f f = ε 3 2 D i
According to the dilute solution approximation, the ionic mobility κ i can be calculated using the Nernst–Einstein equation:
κ i = D i e f f R T
where R is the universal gas constant and T is the temperature. During the charging process, zinc will be deposited on the negative electrode, resulting in a change in the electrode porosity, which is determined by the following equation:
Δ ε = i c i c i , 0 ρ i M i
The thickness of zinc deposited can be expressed by the following equation:
Δ s = i c i c i , 0 a ( ρ i M i )
where ρ is the density of zinc, M is the molar mass of zinc, and a is the specific surface area of the porous electrode.

2.2.2. Electrochemical Kinetics

The Butler–Volmer equation is used to describe the transfer current density j of electrochemical reactions in porous electrodes:
j p o s = a F k p o s ( c B r ) 1 α p o s ( c B r 2 ) α p o s [ c B r s c B r exp ( ( 1 α p o s ) F η p o s R T ) c B r 2 s c B r 2 exp ( α p o s F η p o s R T ) ]
j n e g = a F k n e g ( c Z n ) 1 α n e g ( c Z n 2 + ) α n e g [ c Z n s c Z n exp ( ( 1 α n e g ) F η n e g R T ) c Z n 2 + s c Z n 2 + exp ( α n e g F η n e g R T ) ]
where j p o s and j n e g denote the transfer current densities of the positive and negative electrodes, respectively, k p o s and k n e g denote the redox reaction rate constants, α p o s and α n e g are the charge transfer coefficients, and η p o s and η n e g represent the activation overpotentials of the positive and negative reactions, respectively, which can be determined by the following equations:
η p o s = ϕ s , p o s ϕ l , p o s E 0 , p o s
η n e g = ϕ s , n e g ϕ l , n e g E 0 , n e g
where ϕ s is the electrode potential, ϕ l is the electrolyte potential, E 0 , p o s and E 0 , n e g are the equilibrium potentials for the positive and negative reactions, respectively, which are given by the Nernst equation:
E 0 , p o s = 1.09 + R T 2 F log ( ( 1000 c B r ) 2 )
E 0 , n e g = 0.76 + R T 2 F log ( c Z n 2 + 1000 )
Then the initial voltage of the battery E i n i t can be calculated by the following equation:
E i n i t = E 0 , p o s E 0 , n e g + R T 2 F log ( c B r 2 1000 )
Because the negative electrode potential is low, it is assumed that B r 2 immediately oxidized when it reaches the negative-membrane boundary, so the B r 2 concentration of the negative electrode is zero.

2.2.3. Tanks

When the ZBFB operates, the pump transports the electrolyte to the porous electrode for reaction. Then, the electrolyte flows into the tank from the porous electrode. Assuming that the electrolyte in the tank is fully mixed and there is no electrochemical reaction, the following equation is given:
V t a n k d c t a n k d t = δ Ω i n c i ( n u ) δ Ω o u t c t a n k ( n u )
where V t a n k is the tank volume, c t a n k is the species concentration in the tank, n is the normal vector at the boundary, and δ Ω i n and δ Ω o u t are the inlet and outlet boundaries of the battery, respectively.

2.2.4. Side Reactions

During charging process, bromine is usually present as polybromide ions, the cross-diffusion of which could cause self-discharge and capacity decay. To suppress this issue, using a complex agent to capture polybromide ions to form complexes is an effective method [30]. In the model, complexes can be formed by combining with the complex agent Q:
B r 2 + Q B r Q
It is assumed that the complexation reaction is rapid and achieves equilibrium, and that the complex agent Q is in excess.

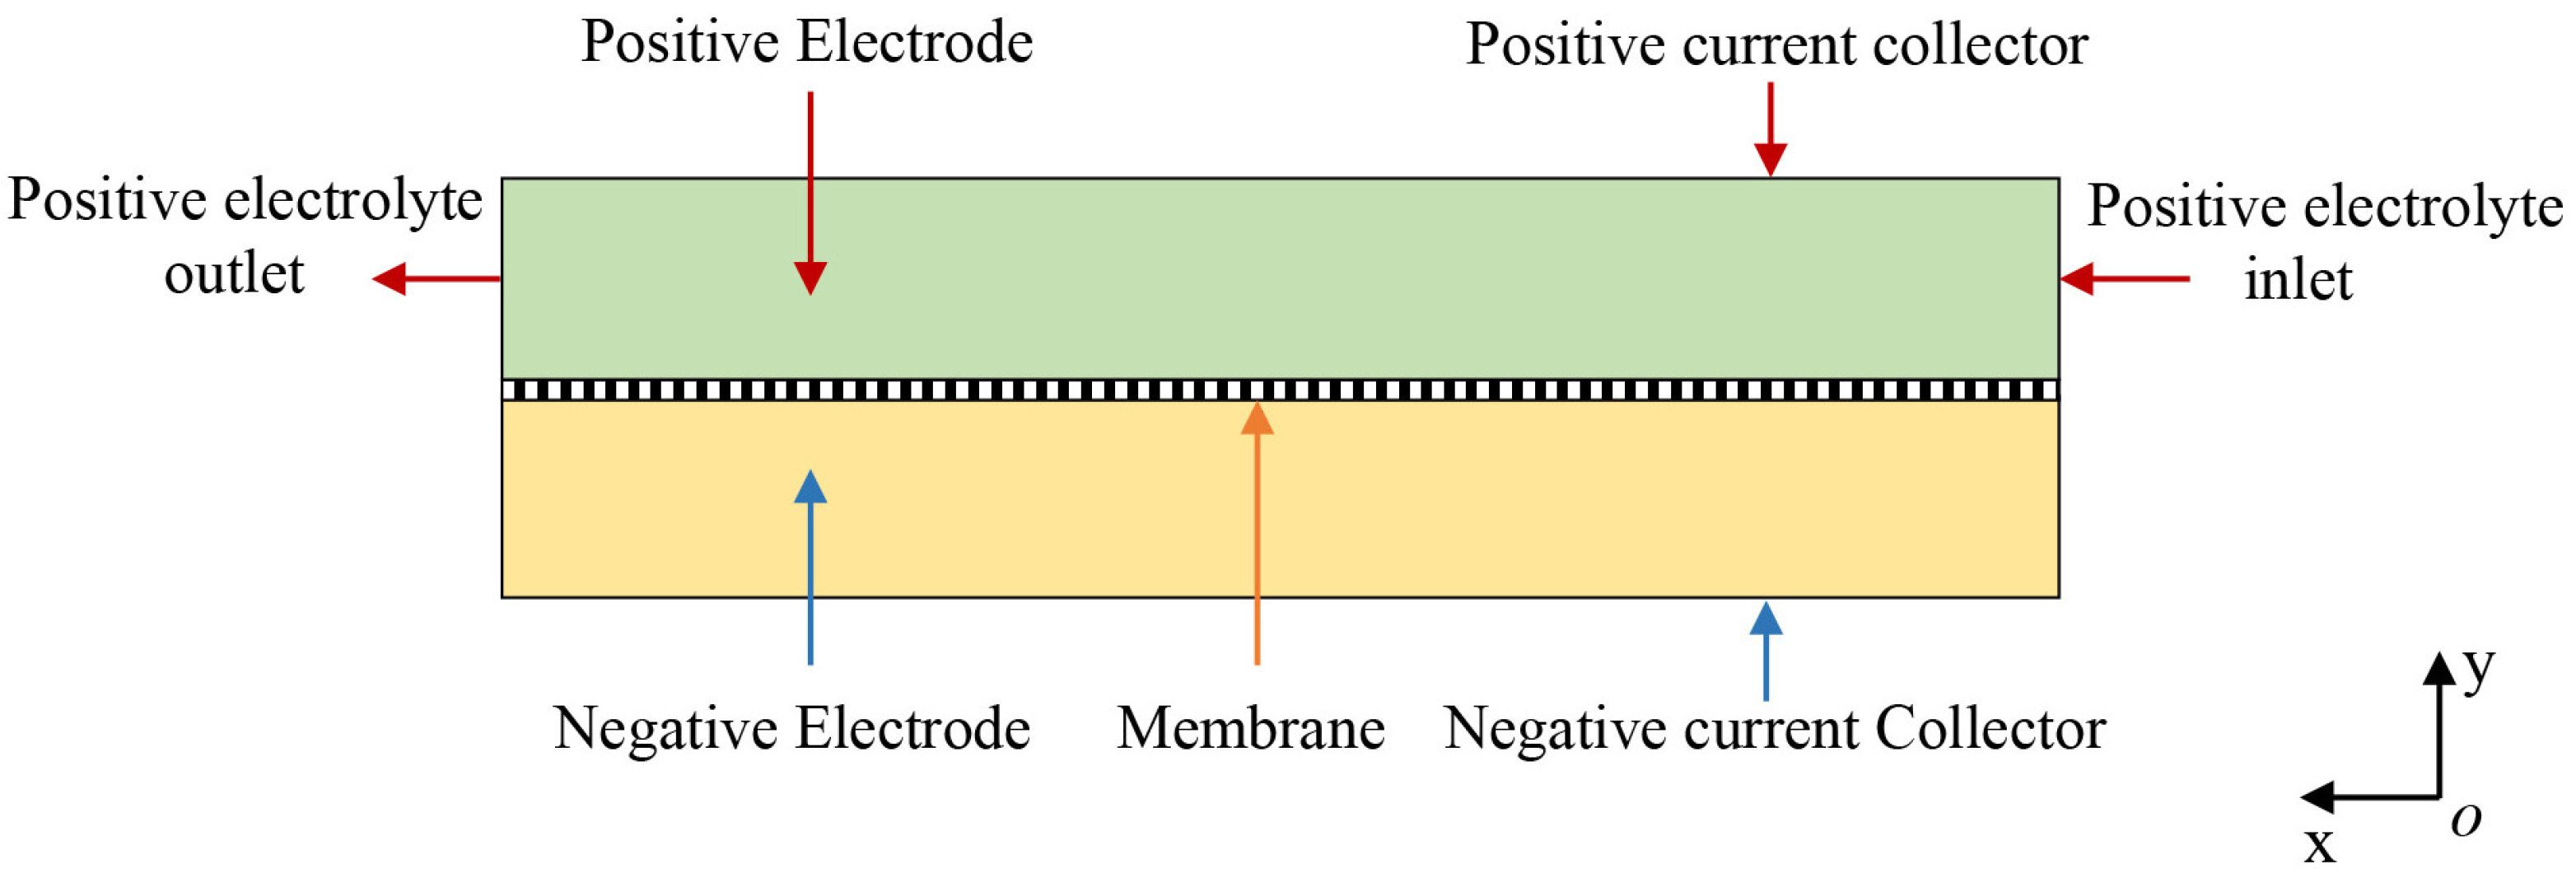
2.3. Calculation Area and Boundary Conditions

This two-dimensional transient model correctly simulates the effects of operational parameters on battery performance and uses fewer computational resources than the three-dimensional model. As shown in Table 2, the model uses the galvanostatic method, 0.5 h charge at a constant current, followed by discharge at the same current. To test whether the effects of the operational parameters on the battery performance are consistent at high and low current densities, the current densities chosen here are 20   mA   cm 2 and 40   mA   cm 2 [31]. As shown in Figure 2, the positive current collector transmits the electrode current and has an initial operating voltage E i n i t , and B r / B r 2 reacts at the positive electrode. The membrane is between the positive and negative electrodes to prevent active species from crossing. Z n 2 + / Z n undergoes a deposition–dissolution reaction at the negative electrode, and the negative current collector is set to ground. The positive electrolyte enters with a velocity U i n , and the boundary condition is flux. All boundary conditions except the positive and negative current collector boundaries are insulated.
Table 2. Boundary conditions.
Figure 2. Schematic diagram of the model calculation area.

2.4. Assumptions and Solutions

Some assumptions should be made to simplify the model: (1) the battery is operated under isothermal conditions; (2) the fluid is incompressible; (3) the dilute solution approximation is used during species transport; and (4) the bromine volatilization is neglected. During the charge–discharge cycle of ZBFB, the formation of zinc dendrites can be divided into three stages: initial growth, dissolution, and regrowth due to the uneven distribution of active species and charges [32]. Zinc dendrites may form after multiple cycles of the battery, causing blockage of electrode pores and capacity decay. However, the present model focuses on the effects of operational parameters on the battery charging and discharging; only one charge/discharge circle was performed in each condition, so zinc dendrites were not observed. The model was solved by the finite element method. In the simulation, the discharge cut-off voltage is 1.2 V to save time. The parameters and initial values used in the simulation are listed in Table 3.
Table 3. Parameters and initial values used in the simulation.

2.5. Performance Indicators

The following equations can determine the voltage, coulomb, and energy efficiency of ZBFB:
η V = V ¯ d i s c h a r g e V ¯ c h a r g e × 100 %
η C = I ¯ d i s c h a r g e t d i s c h a r g e I ¯ c h a r g e t c h a r g e × 100 %
η E = η V × η C
where V ¯ d i s c h a r g e and V ¯ c h a r g e are the average discharge voltage and charge voltage, respectively, and I ¯ d i s c h a r g e and I ¯ c h a r g e are the average discharge current and charge current, respectively. This model uses the galvanostatic method ( 20   mA   cm 2 , 40   mA   cm 2 ), where I ¯ d i c h a r g e / I ¯ c h a r g e = 1 . t d i s c h a r g e and t c h a r g e are the effective discharge time and charge time before the discharge cut-off voltage, respectively.

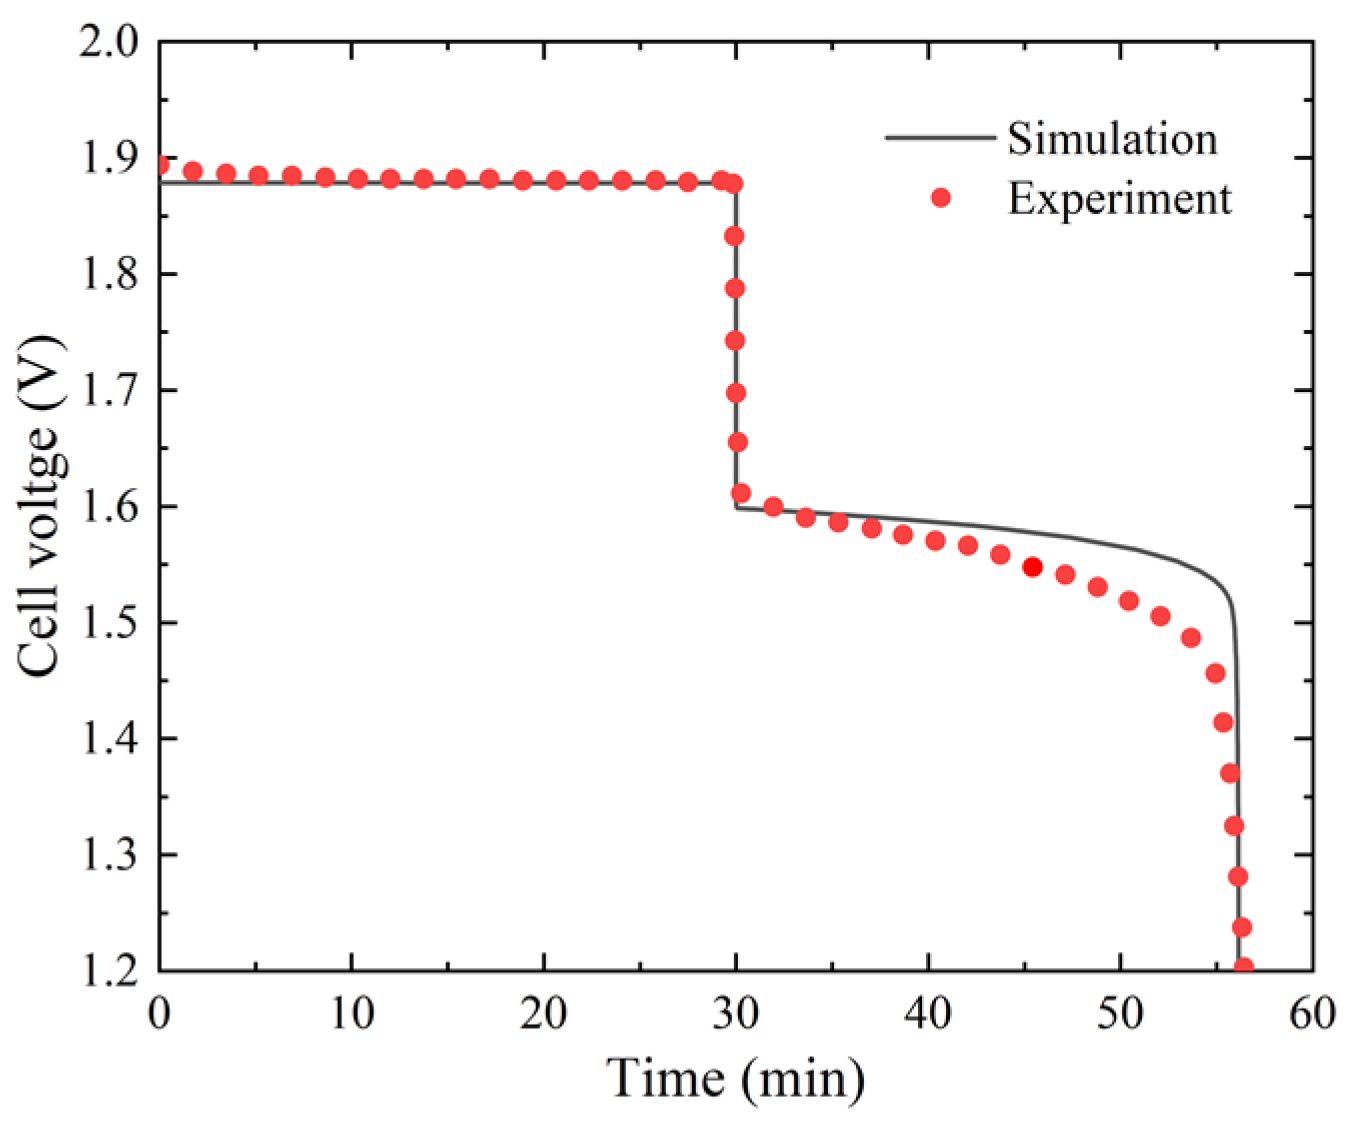
2.6. Model Validations

To verify the accuracy of the model, the simulation results of the model were compared to Suresh et al.’s experimental data at 20   mA   cm 2 [33]. Figure 3 shows that the two voltage curves have good agreement with a maximum error of 2.61%, indicating that the model can predict ZBFB charging and discharging behavior. The two voltage curves deviate slightly because the model ignores the side reactions caused by bromine diffusion, and variation in reactants concentration causes changes in the reaction rate constant.
Figure 3. Simulated voltage of ZBFB at a current density of 20   mA   cm 2 compared with the experimental voltage.

3. Results and Discussion

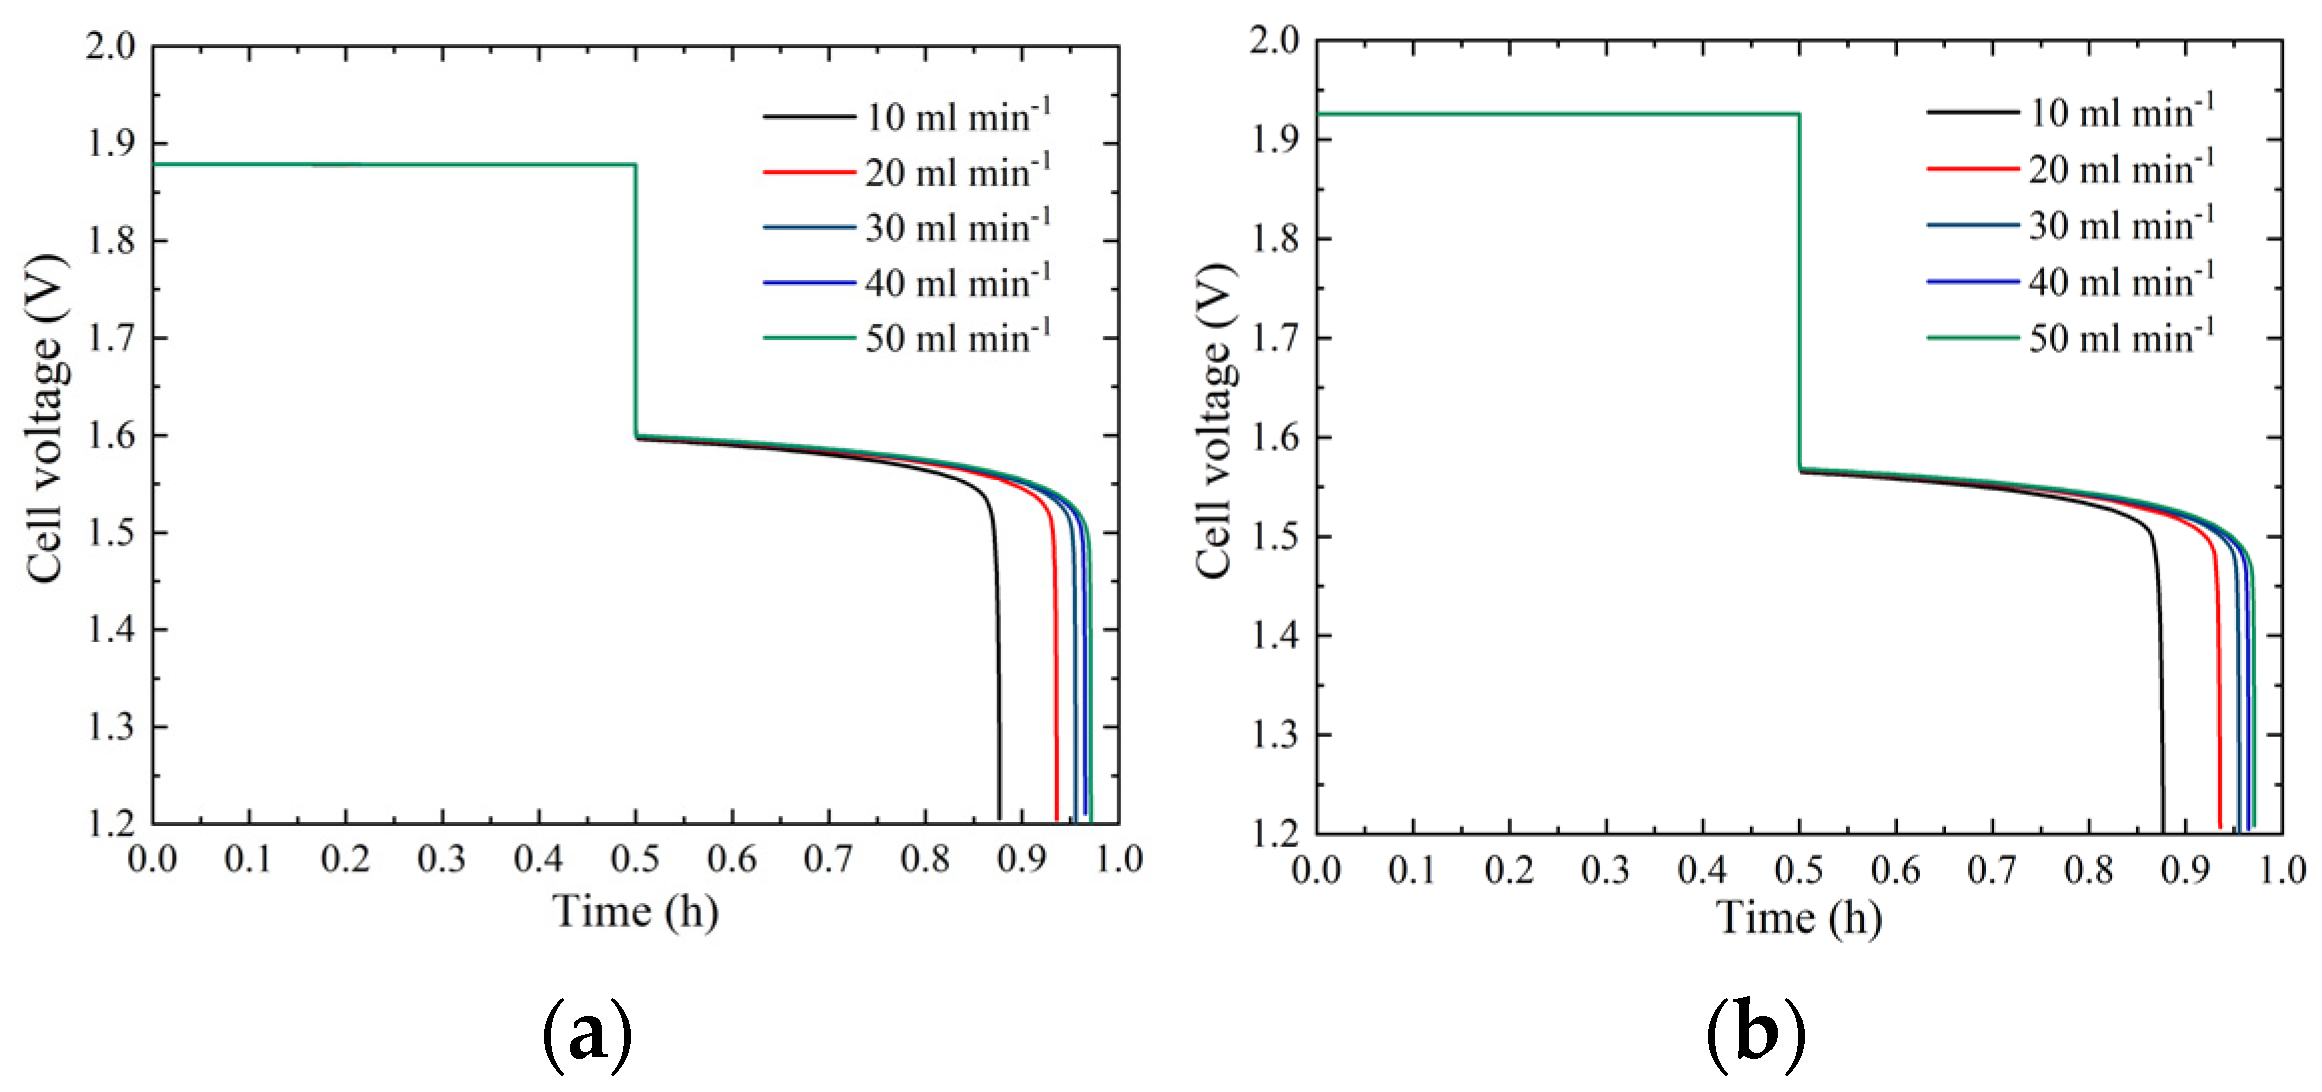
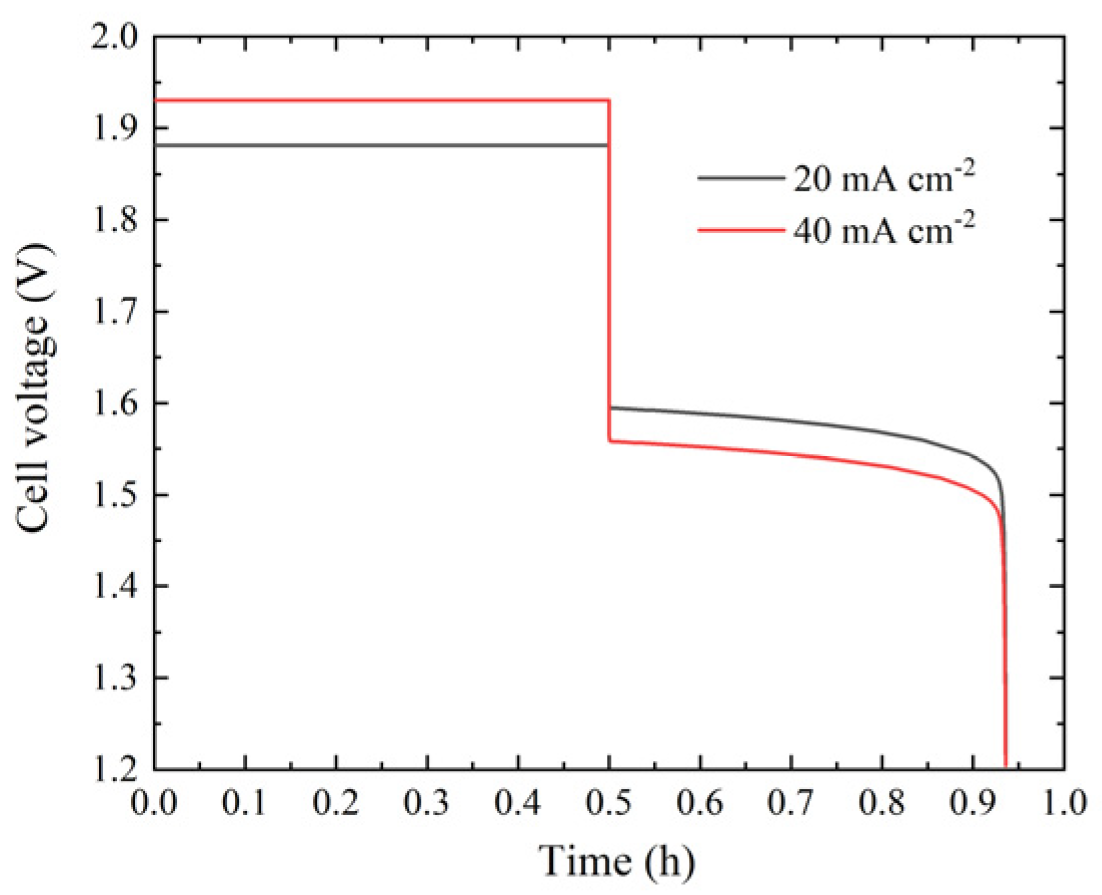
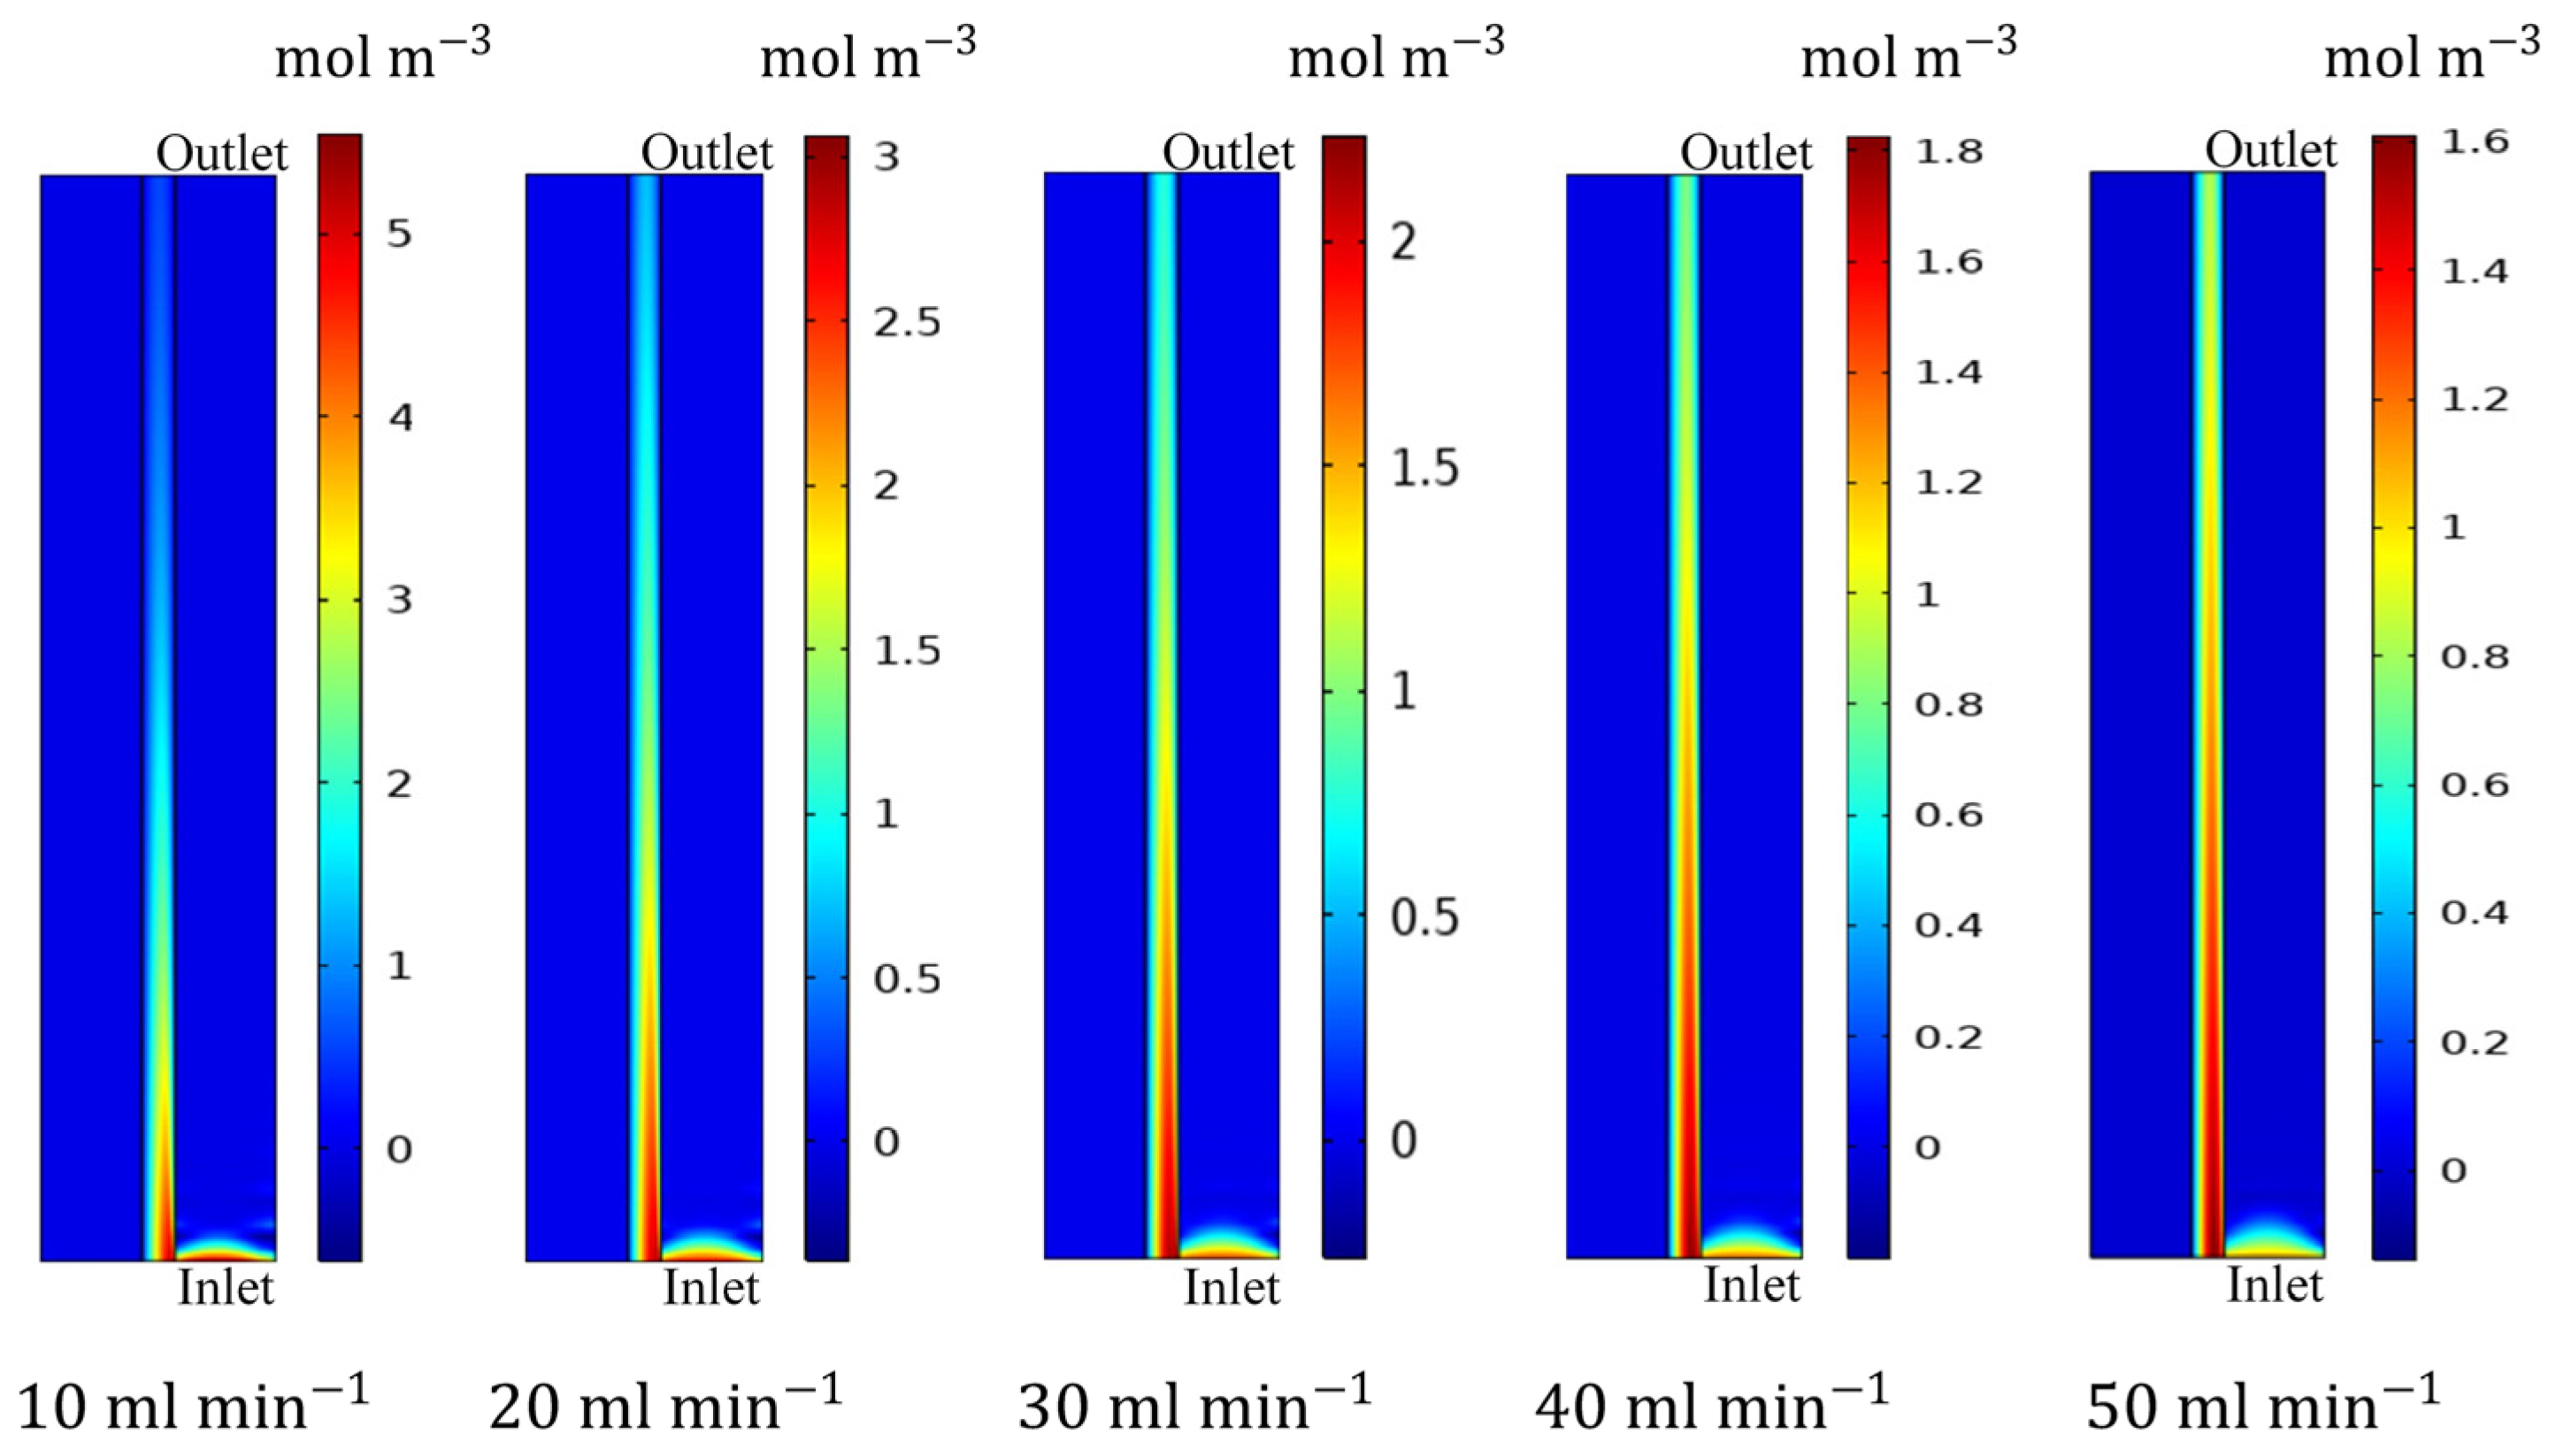
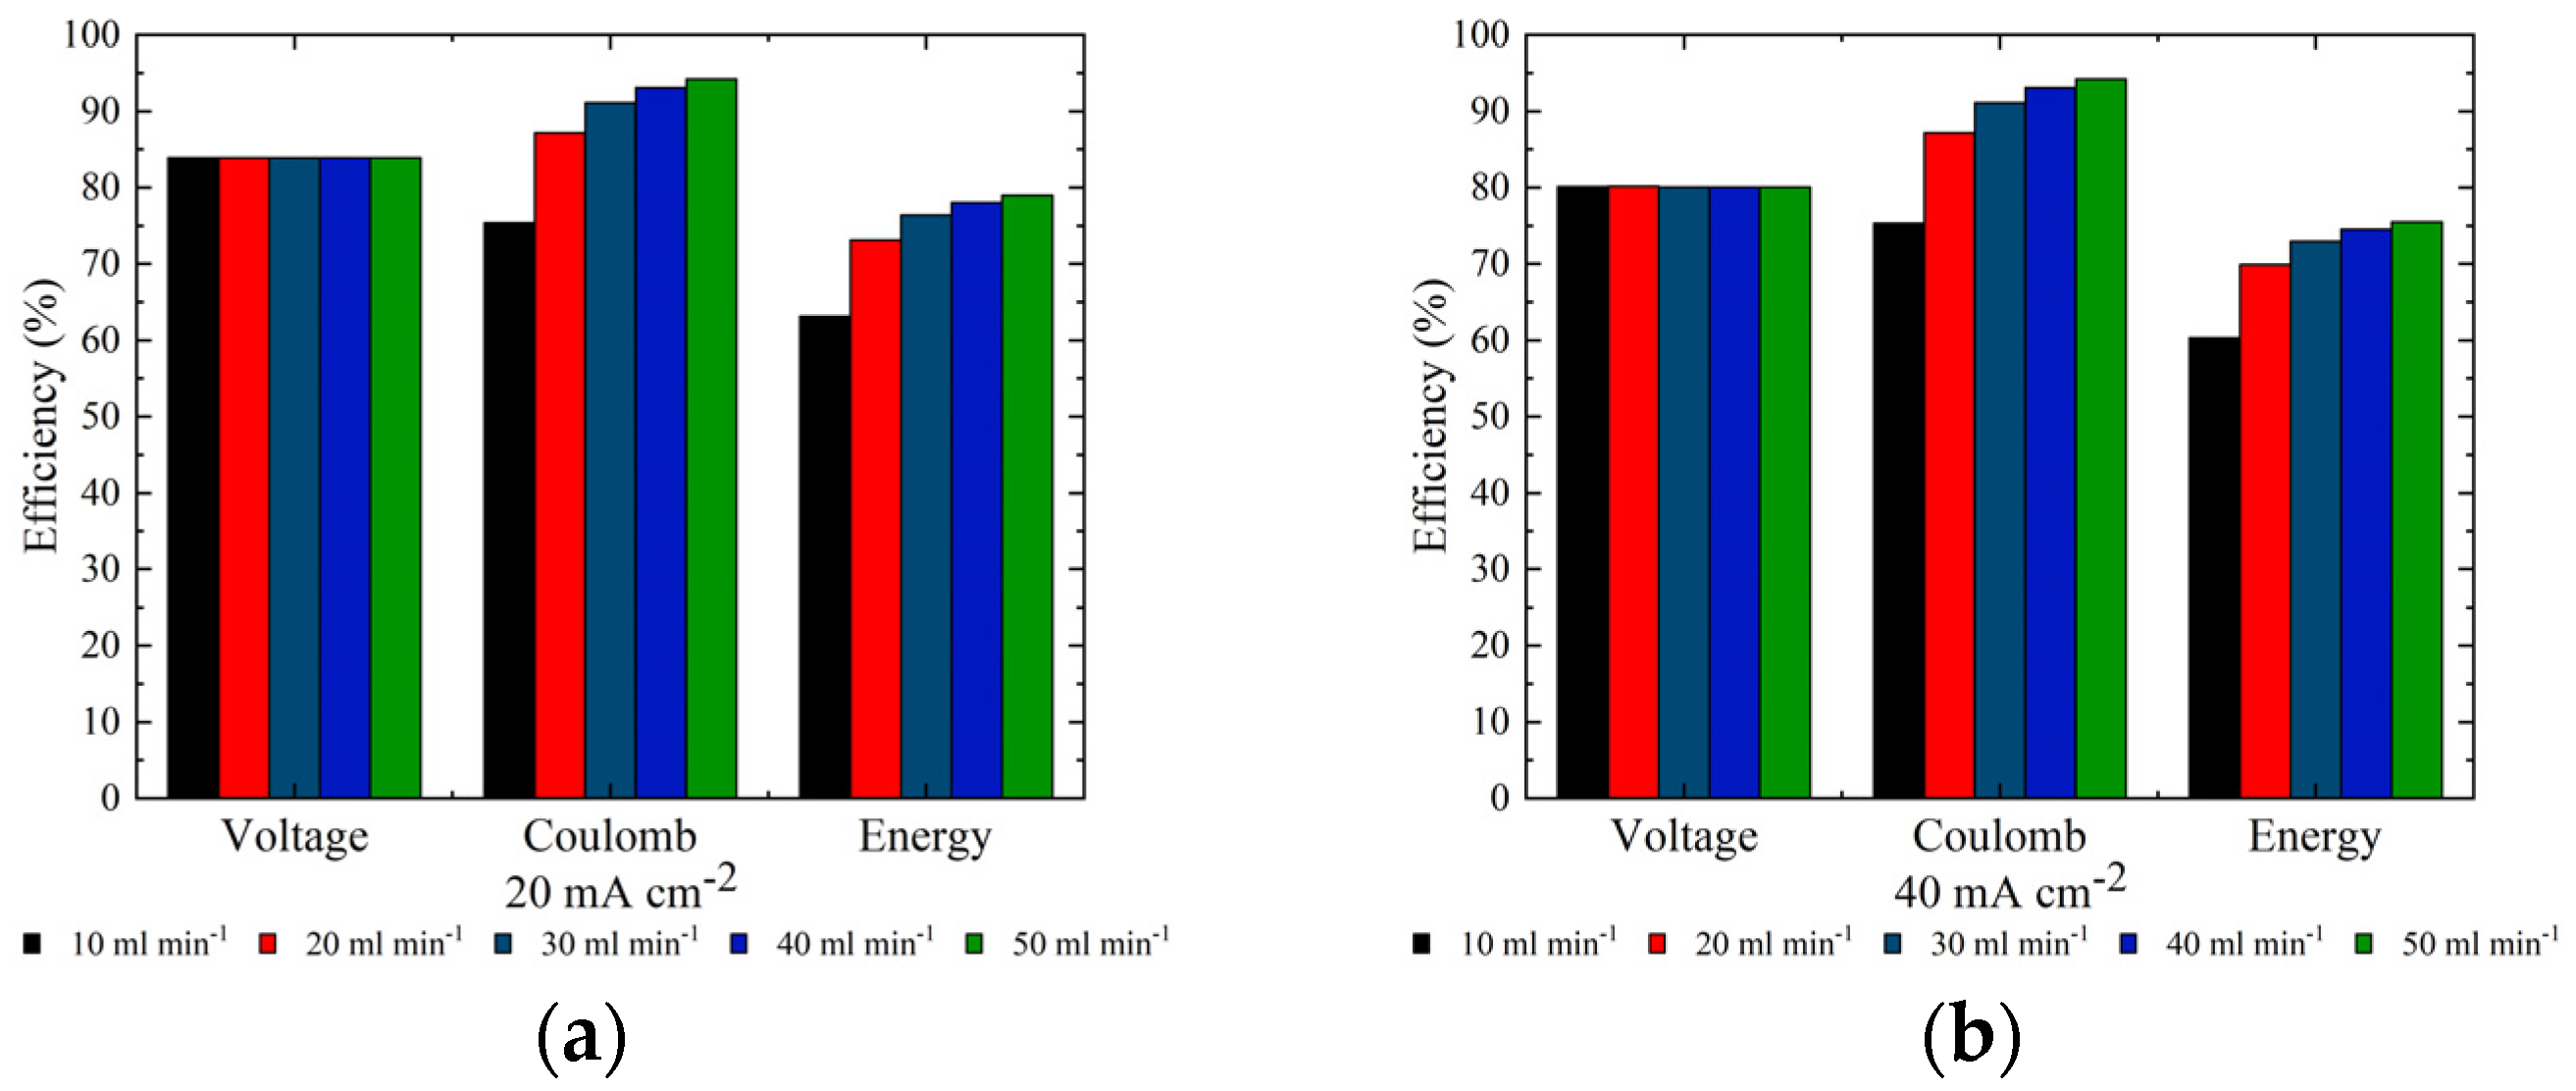
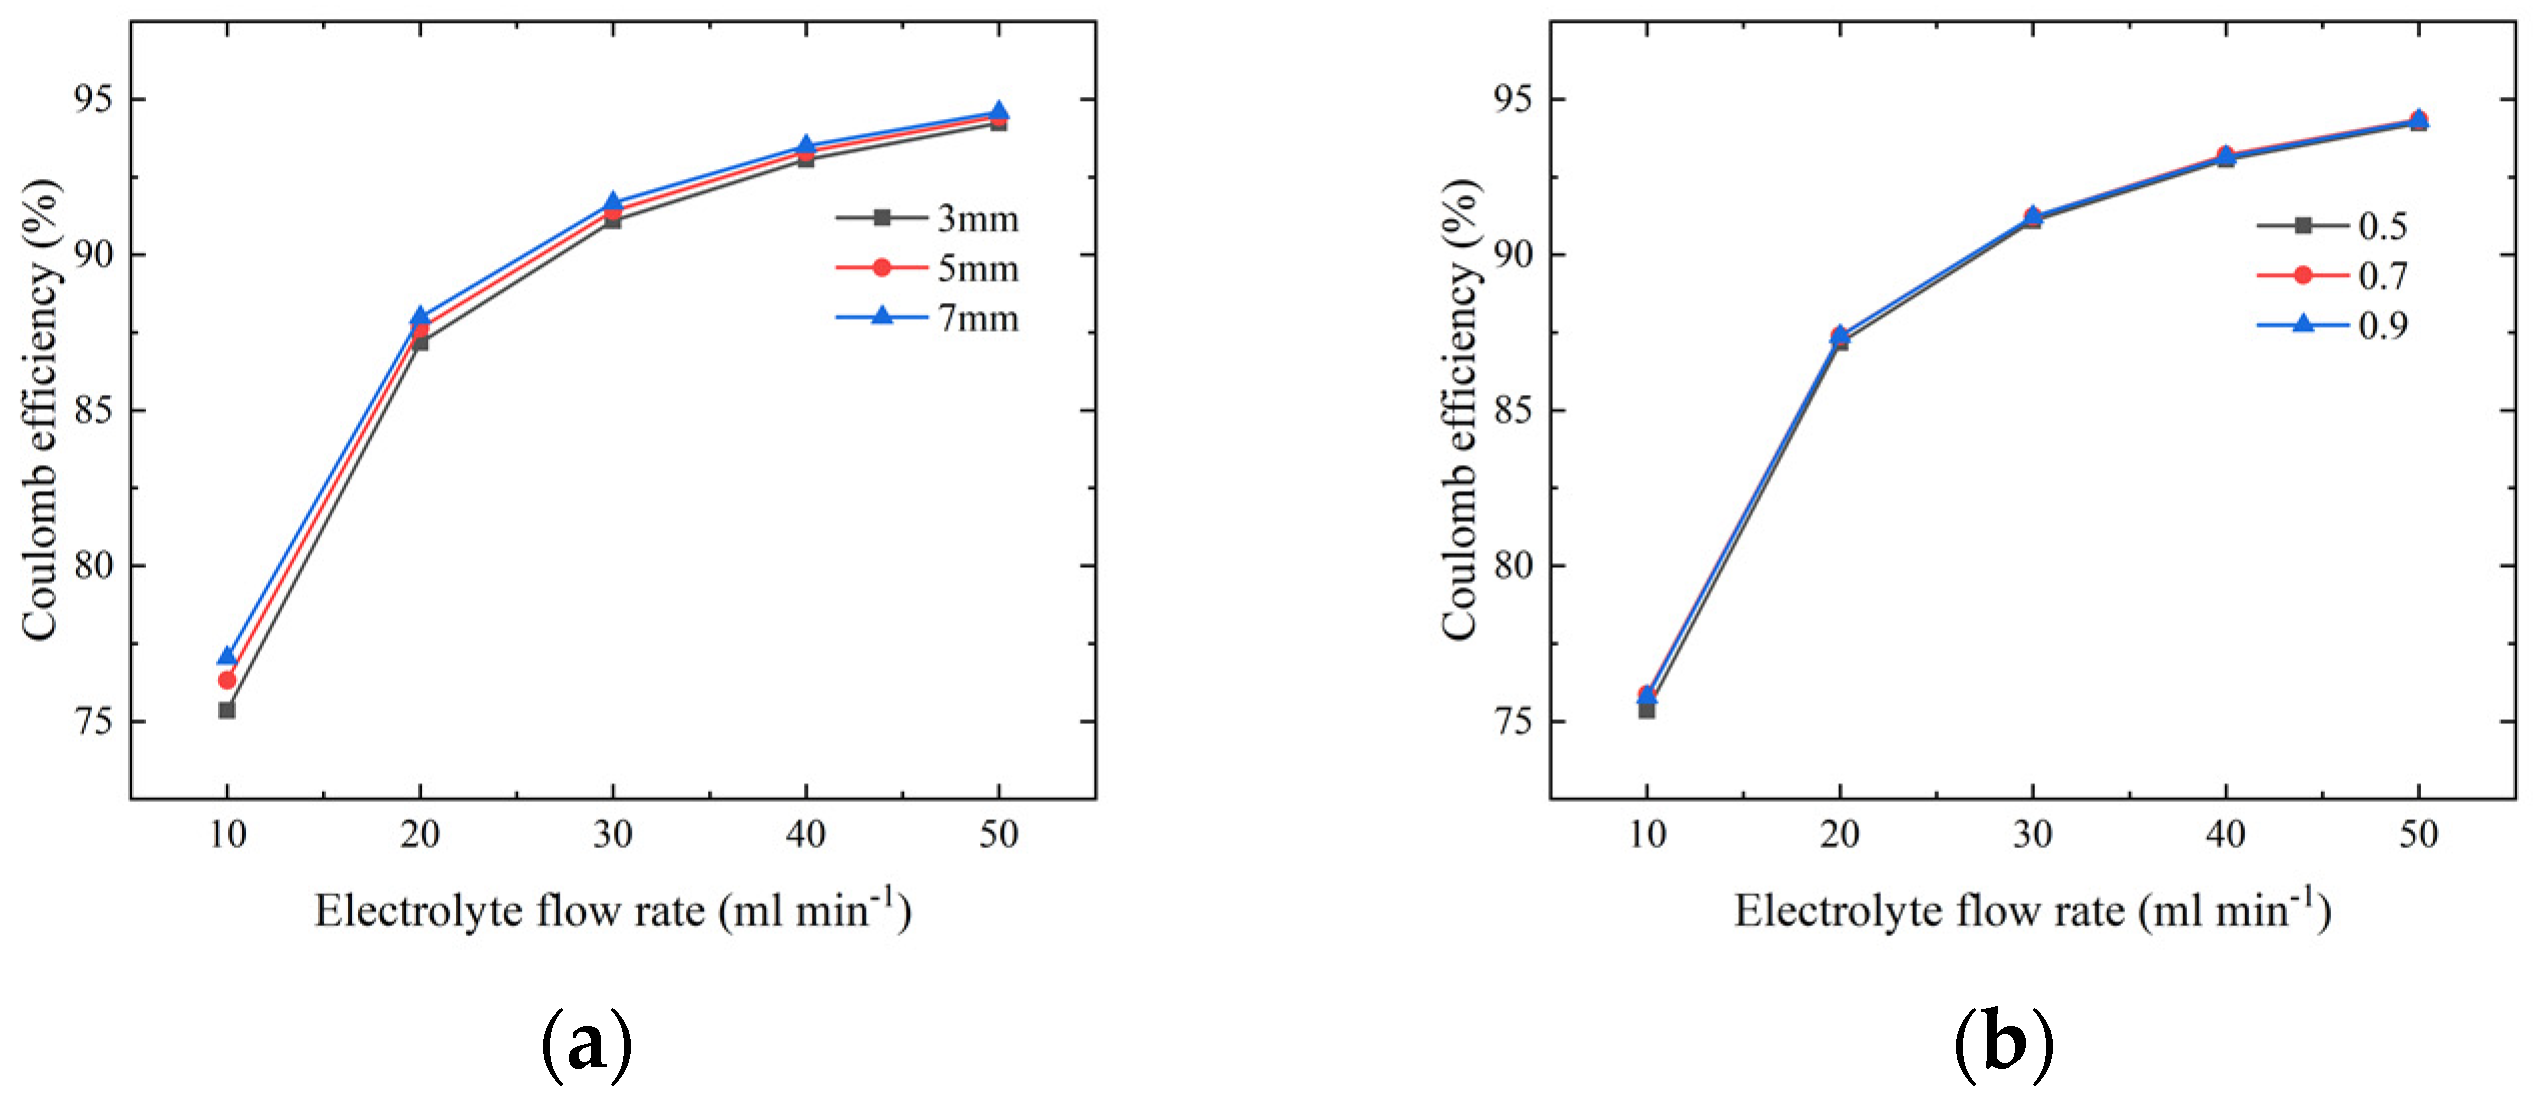
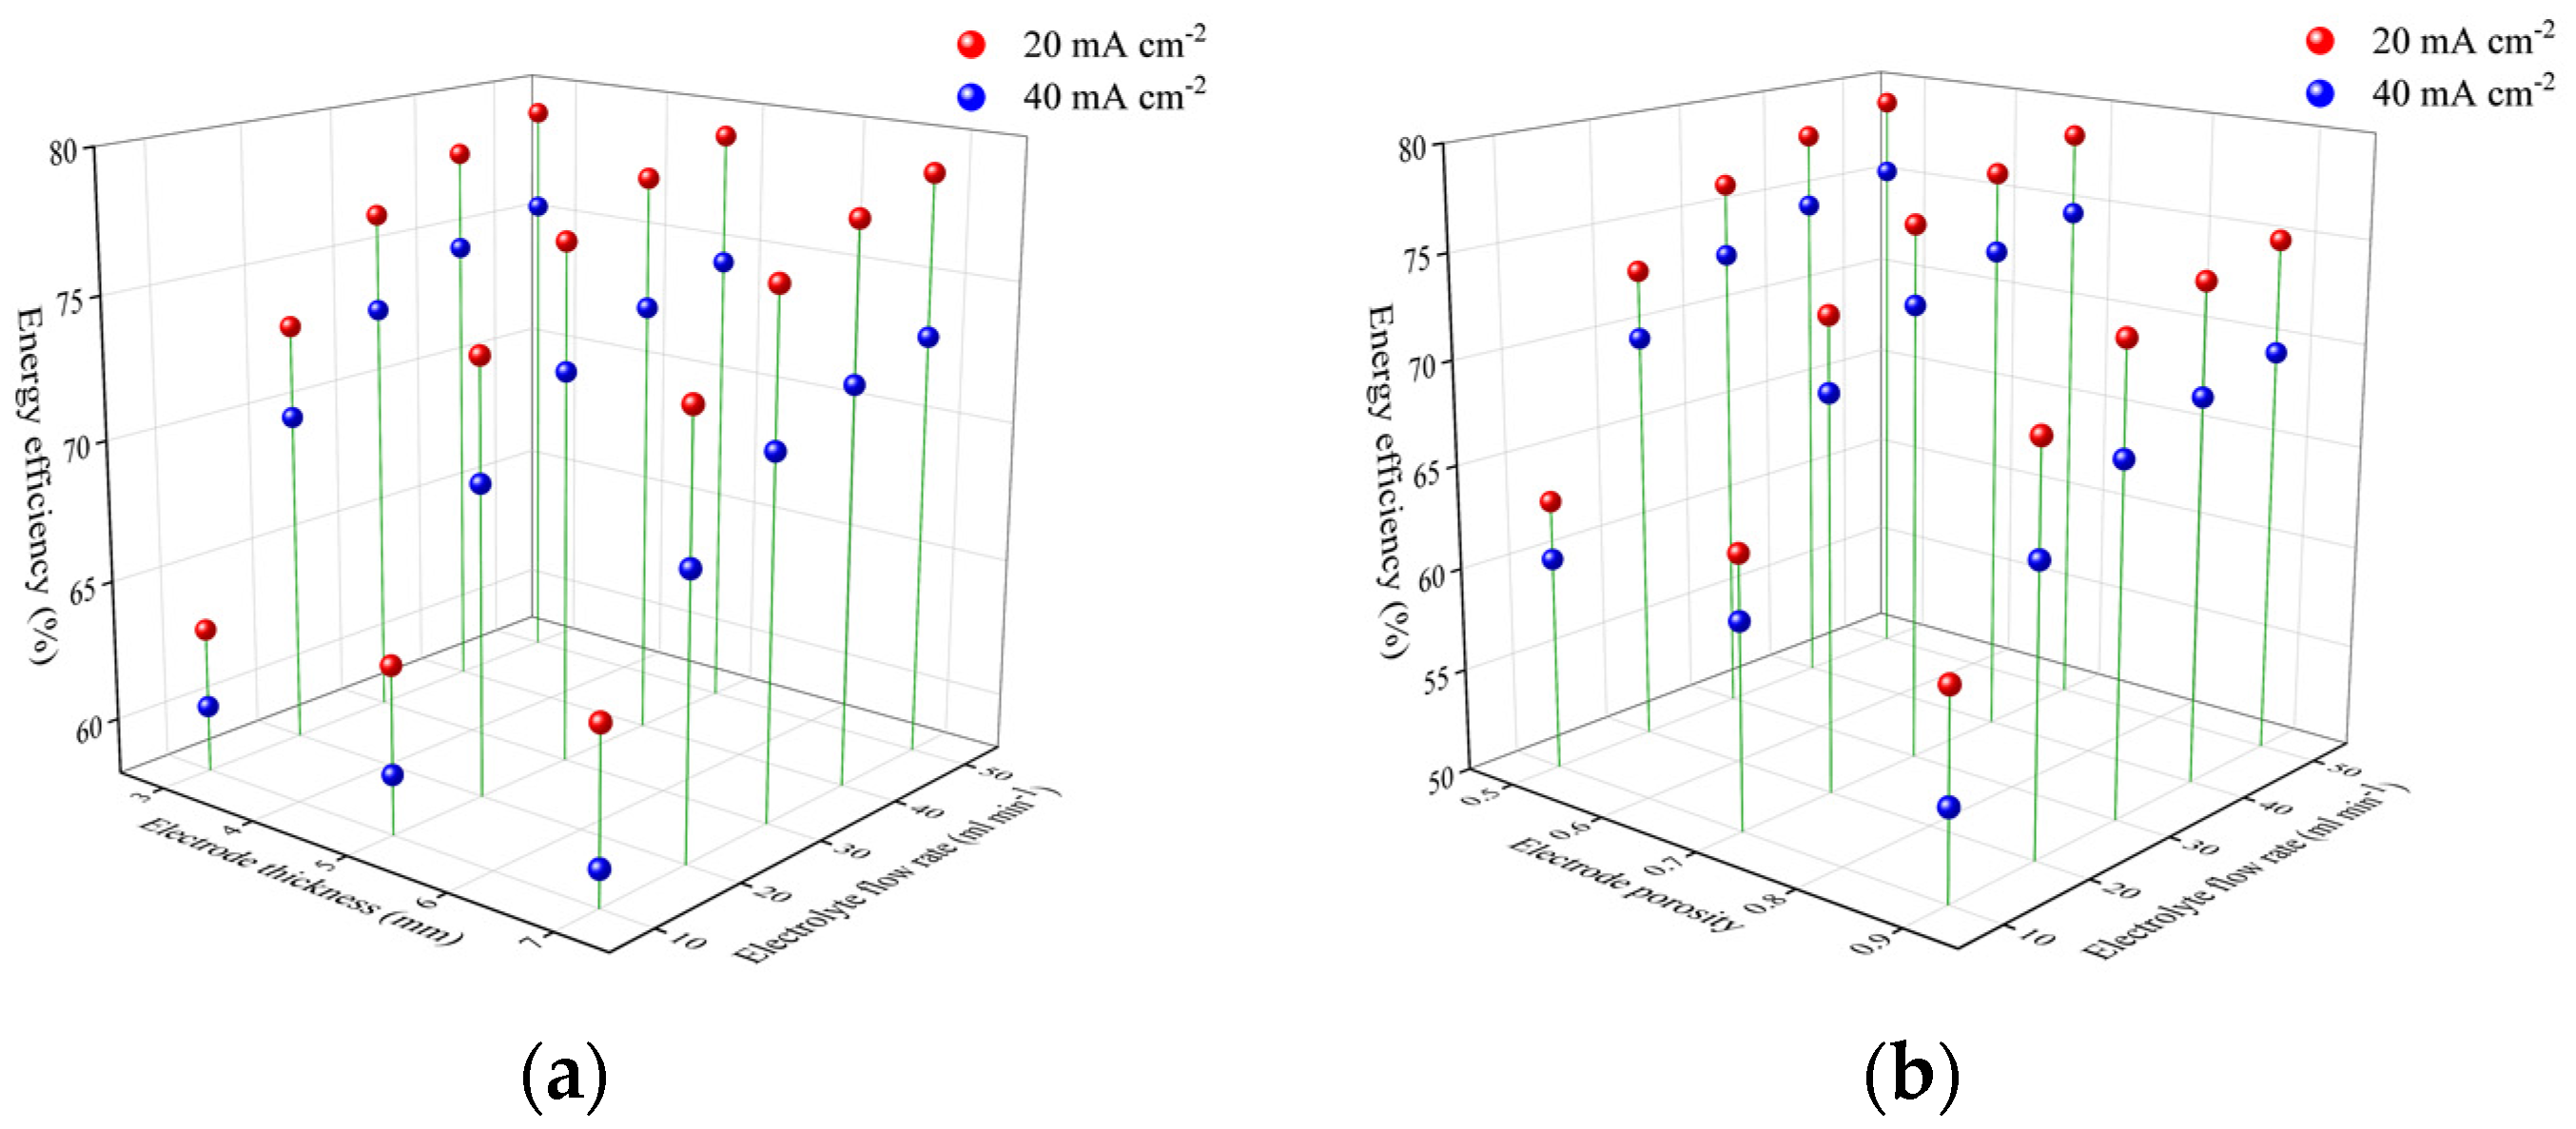
3.1. Effect of Electrolyte Flow Rate

The experiment has shown that increasing the positive electrolyte flow rate of ZBFB improves electrolyte transport and bromine redox reaction kinetics [35]. Figure 4 shows battery voltages with different positive electrolyte flow rates at current densities of 20 and 40   mA   cm 2 to further reveal how the bromine redox reaction is affected. As shown in Figure 5, the battery overpotential increases with current density at the same flow rate. Because more active species are needed for reaction, insufficient electrolytes may increase concentration polarization. With increasing electrolyte flow rate, battery discharge capacity increases significantly at the same current density. As shown in Table 4, at 20   mA   cm 2 , increasing the electrolyte flow rate from 10 to 50   mL   min 1 increases the discharge capacity by 0.58 Ah. The performance is even preferable at 40   mA   cm 2 when the electrolyte flow rate is increased from 10 to 50   mL   min 1 ; the discharge capacity increases by 1.16 Ah, thus improving battery performance. Figure 6 explains the phenomenon. As the electrolyte flow rate increases, the bromine concentration in the positive electrode at the end of discharge gradually decreases, indicating that increasing the electrolyte flow rate can effectively promote bromine transport and cause more bromine to participate in the redox reaction, thus improving bromine utilization and battery discharge capacity.
Figure 4. Battery voltages with different positive electrolyte flow rates at current densities of (a) 20   mA   cm 2 and (b) 40   mA   cm 2 .
Figure 5. Battery voltage variation with current density at the same flow rate.
Table 4. Discharge capacities of battery with different positive electrolyte flow rates at different current densities (Ah).
Figure 6. Bromine concentration distribution in the positive electrode at the end of discharge for battery with different positive electrolyte flow rates at a current density of 20   mA   cm 2 .
Figure 7 displays the voltage, coulomb, and energy efficiency of the battery with different positive electrolyte flow rates at current densities of 20 and 40   mA   cm 2 . At 20   mA   cm 2 , when the electrolyte flow rate increases from 10 to 50   mL   min 1 , the coulomb efficiency rose from 75.35% to 94.24%, the energy efficiency increased by 15.85% due to the coulomb efficiency increase, and the voltage efficiency remained stable. A similar trend can be observed at 40   mA   cm 2 , where the coulomb efficiency increased from 75.32% to 94.23%, and the energy efficiency increased by 15.11% as the electrolyte flow rate increases from 10 to 50   mL   min 1 . This indicates that the high positive electrolyte flow rate improves ZBFB performance. However, a high electrolyte flow rate needs more pumping power, decreasing battery system efficiency. As shown in Figure 4, changing the positive electrolyte flow rate has little influence on ZBFB charging. Thus, a low electrolyte flow rate during charging and a high electrolyte flow rate during discharging can improve ZBFB system efficiency. In addition, when the positive electrolyte flow rate is higher, only slightly discharge capacity is improved. As listed in Table 4, at 20   mA   cm 2 , increasing the electrolyte flow rate from 40 to 50   mL   min 1 enhances the discharge capacity by only 0.03 Ah. Thus, a relatively lower electrolyte flow rate can be adopted to reduce pumping power and maximize battery system efficiency.
Figure 7. Voltage, coulomb, and energy efficiency of battery with different positive electrolyte flow rates at current densities of (a) 20   mA   cm 2 and (b) 40   mA   cm 2 .

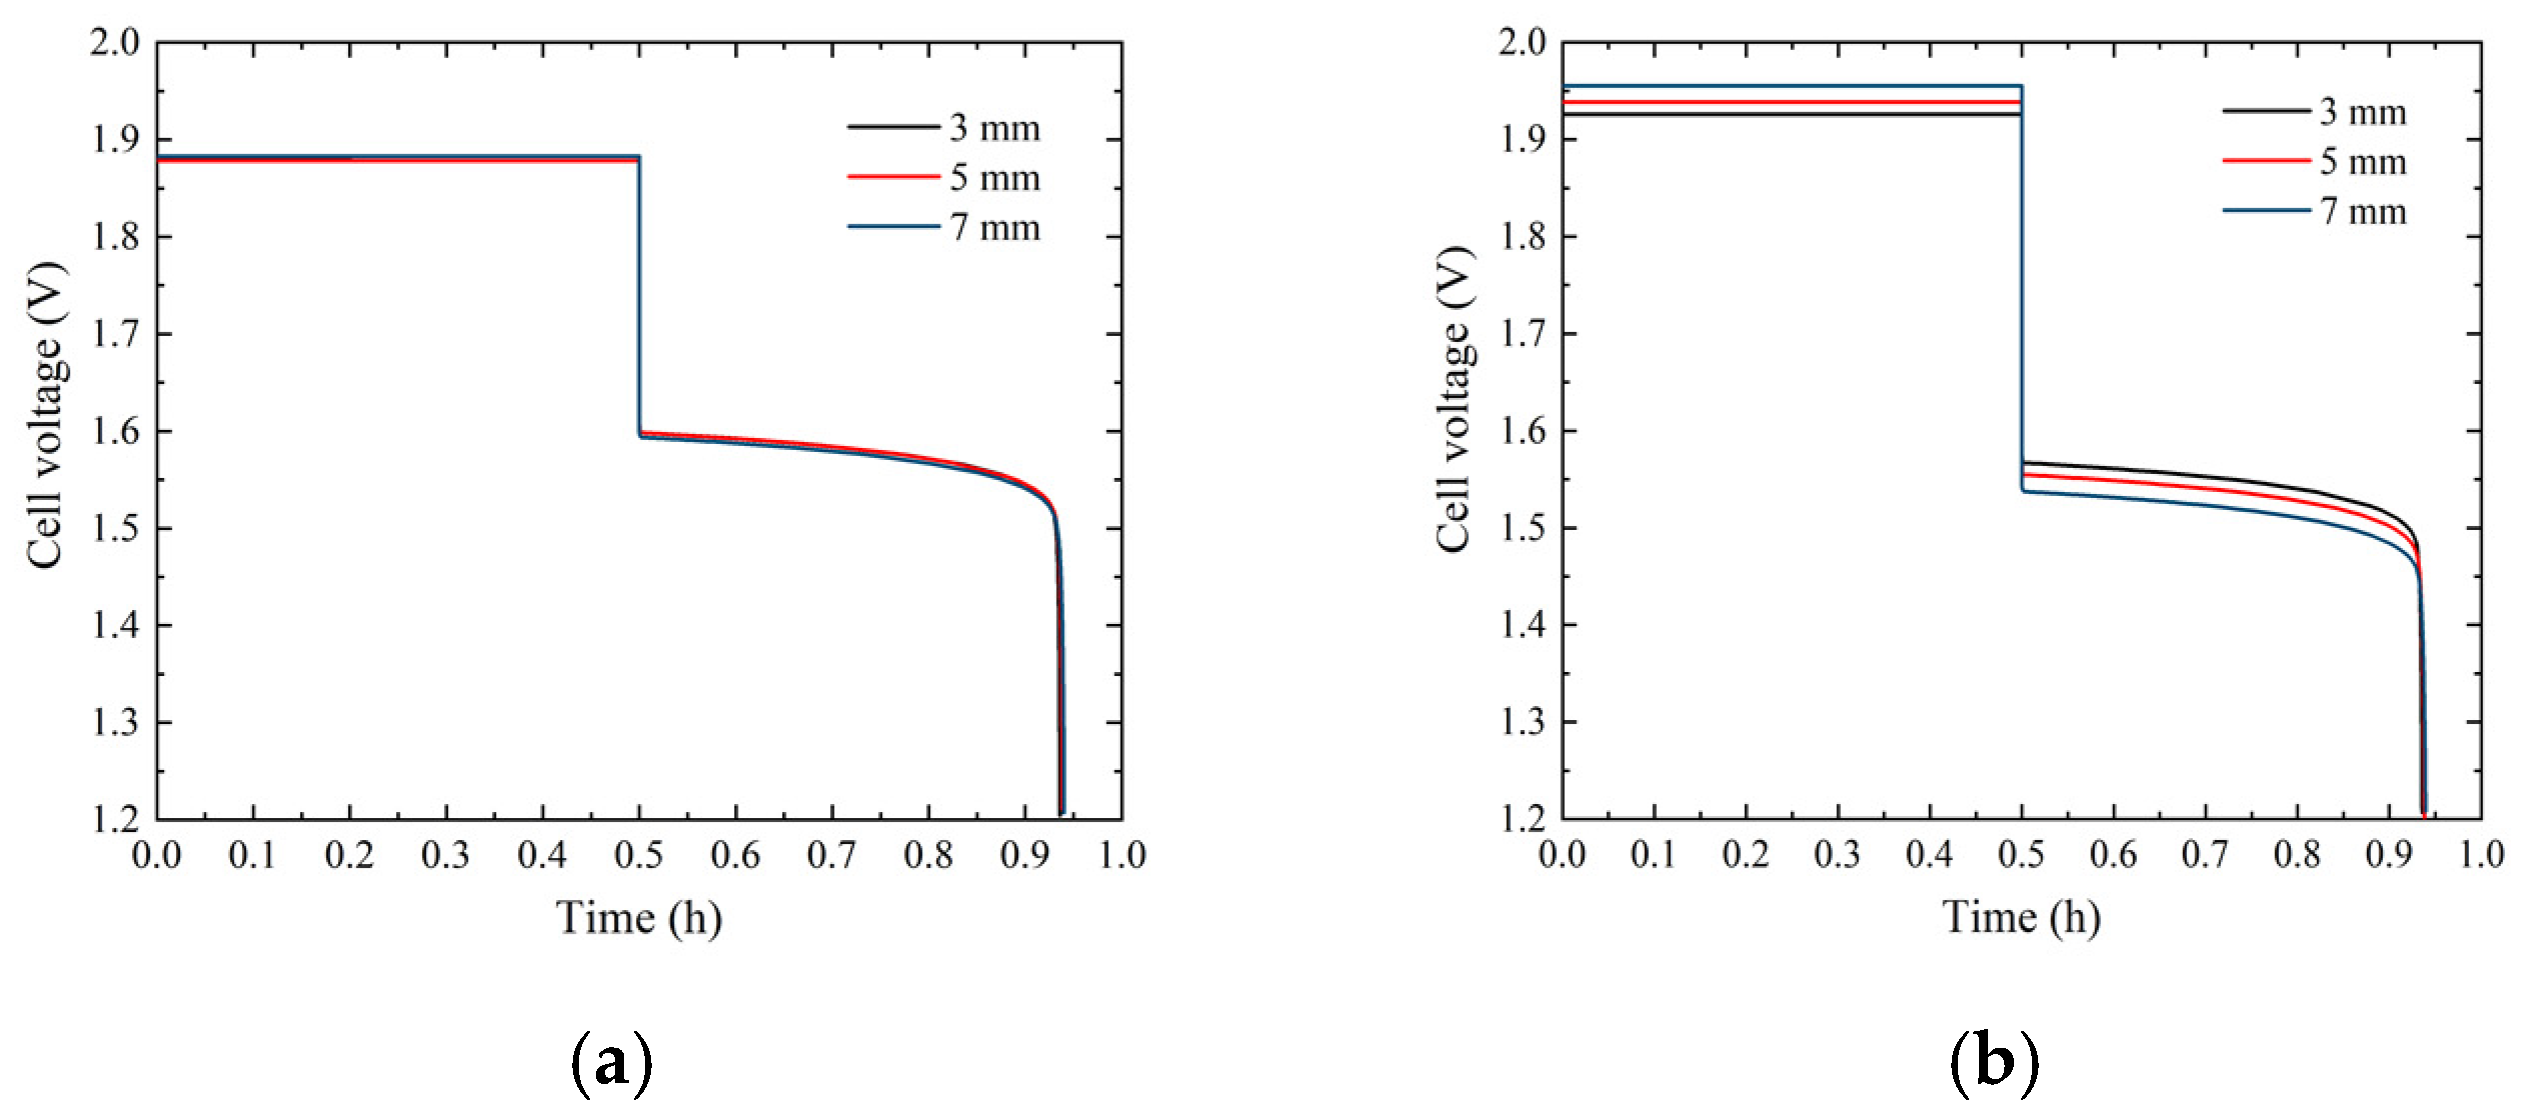
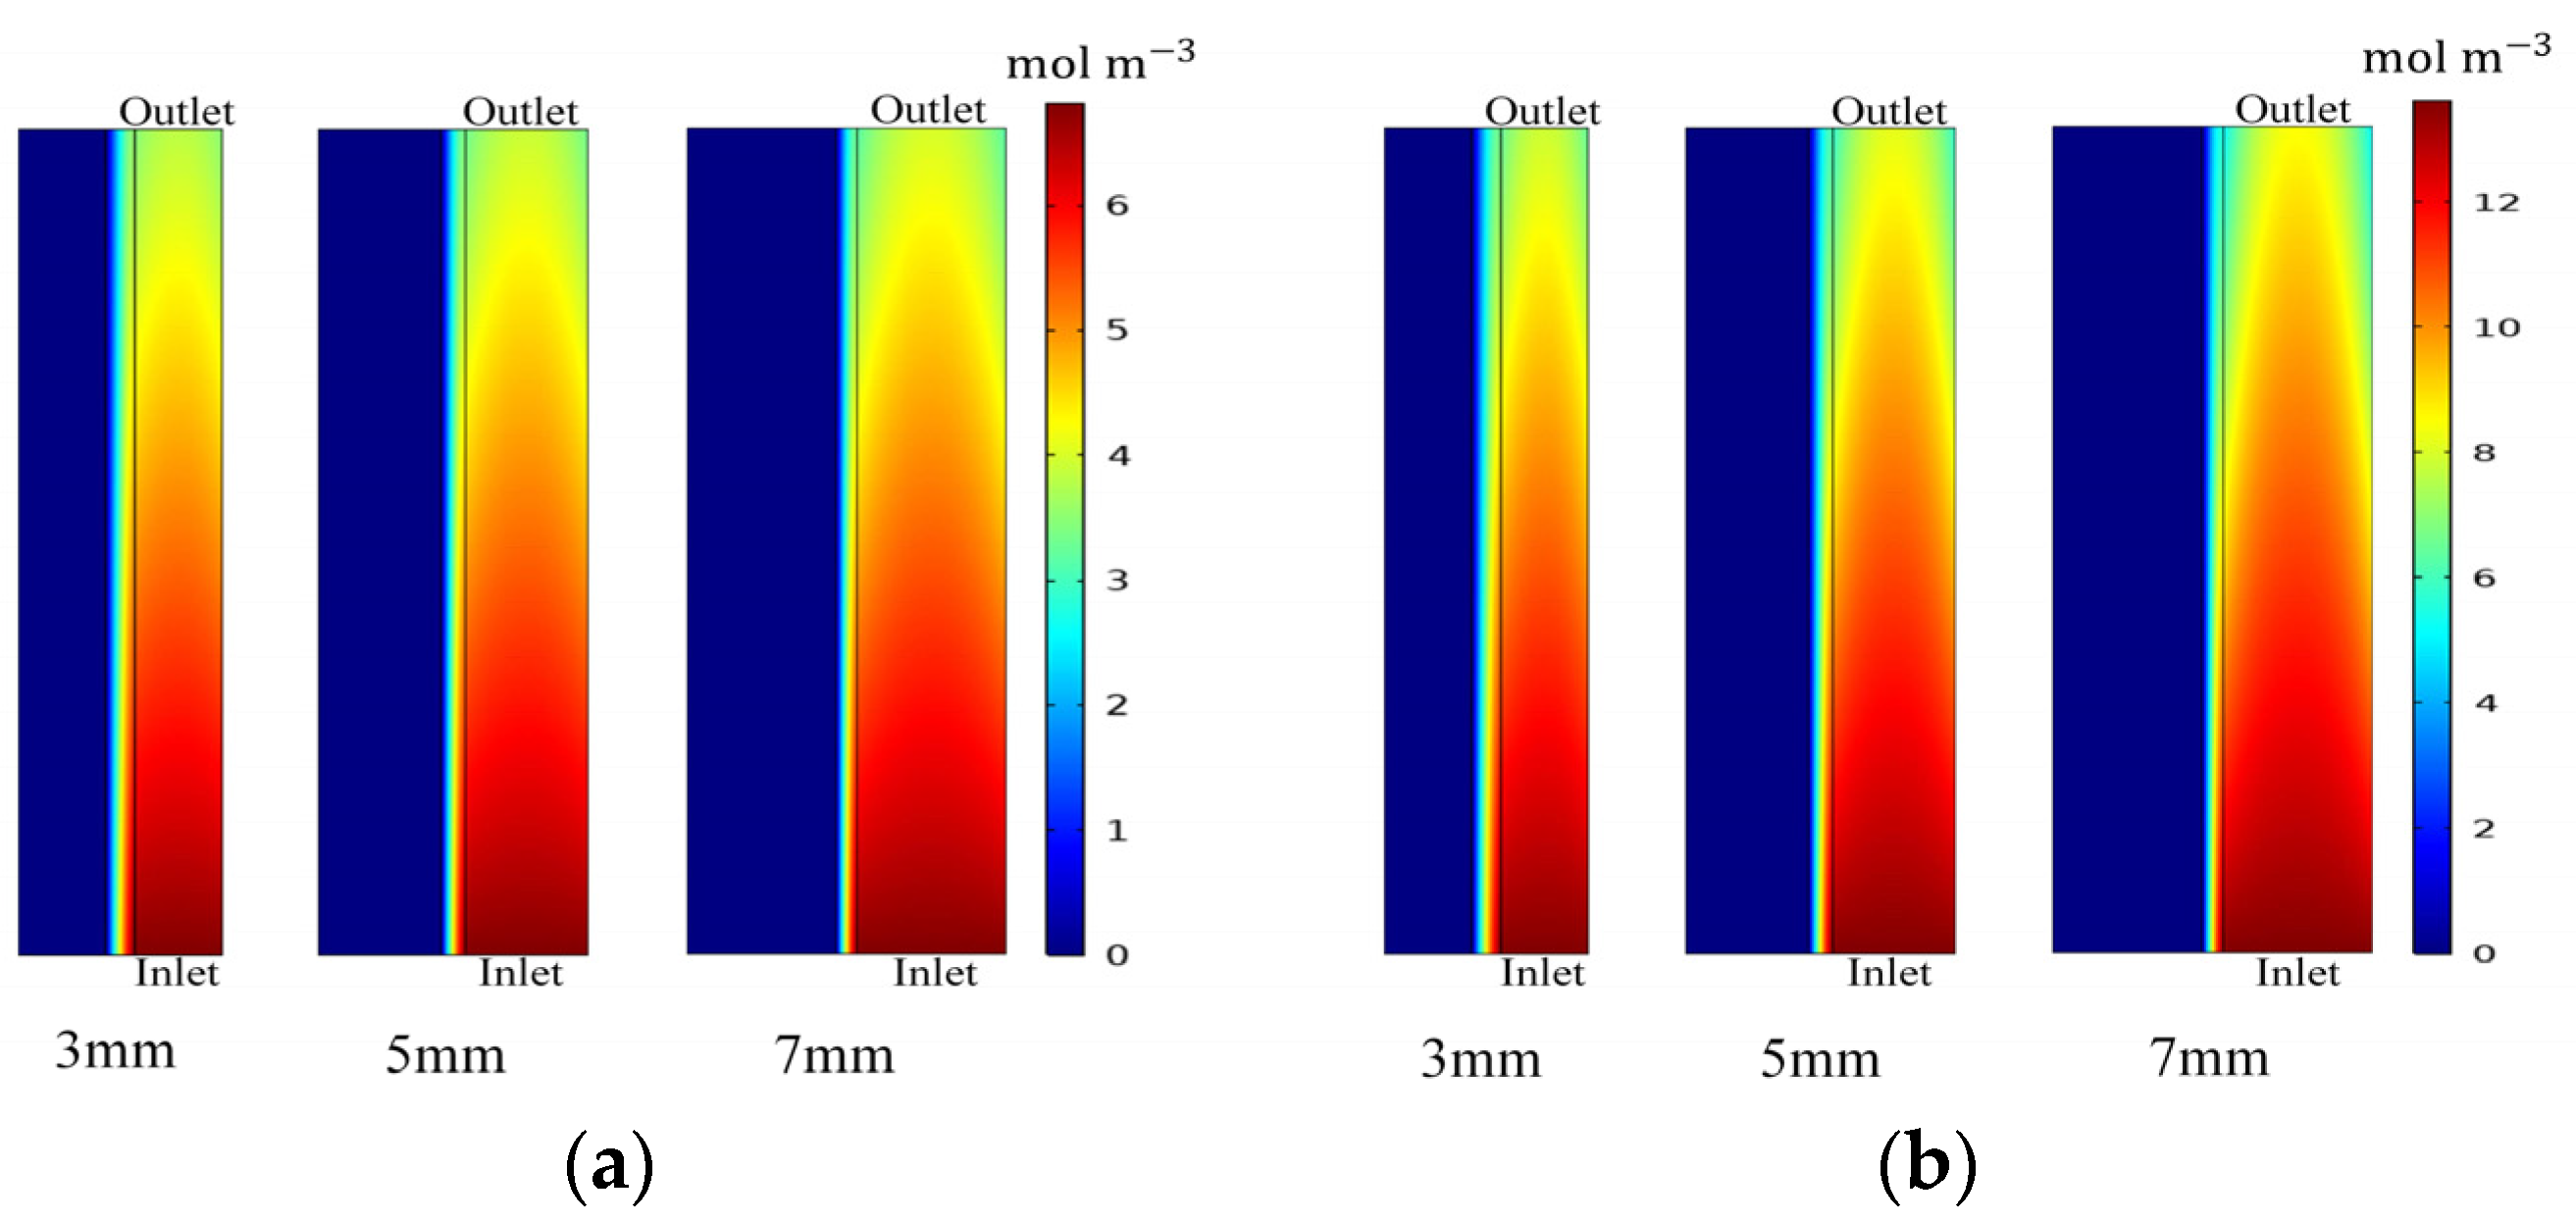
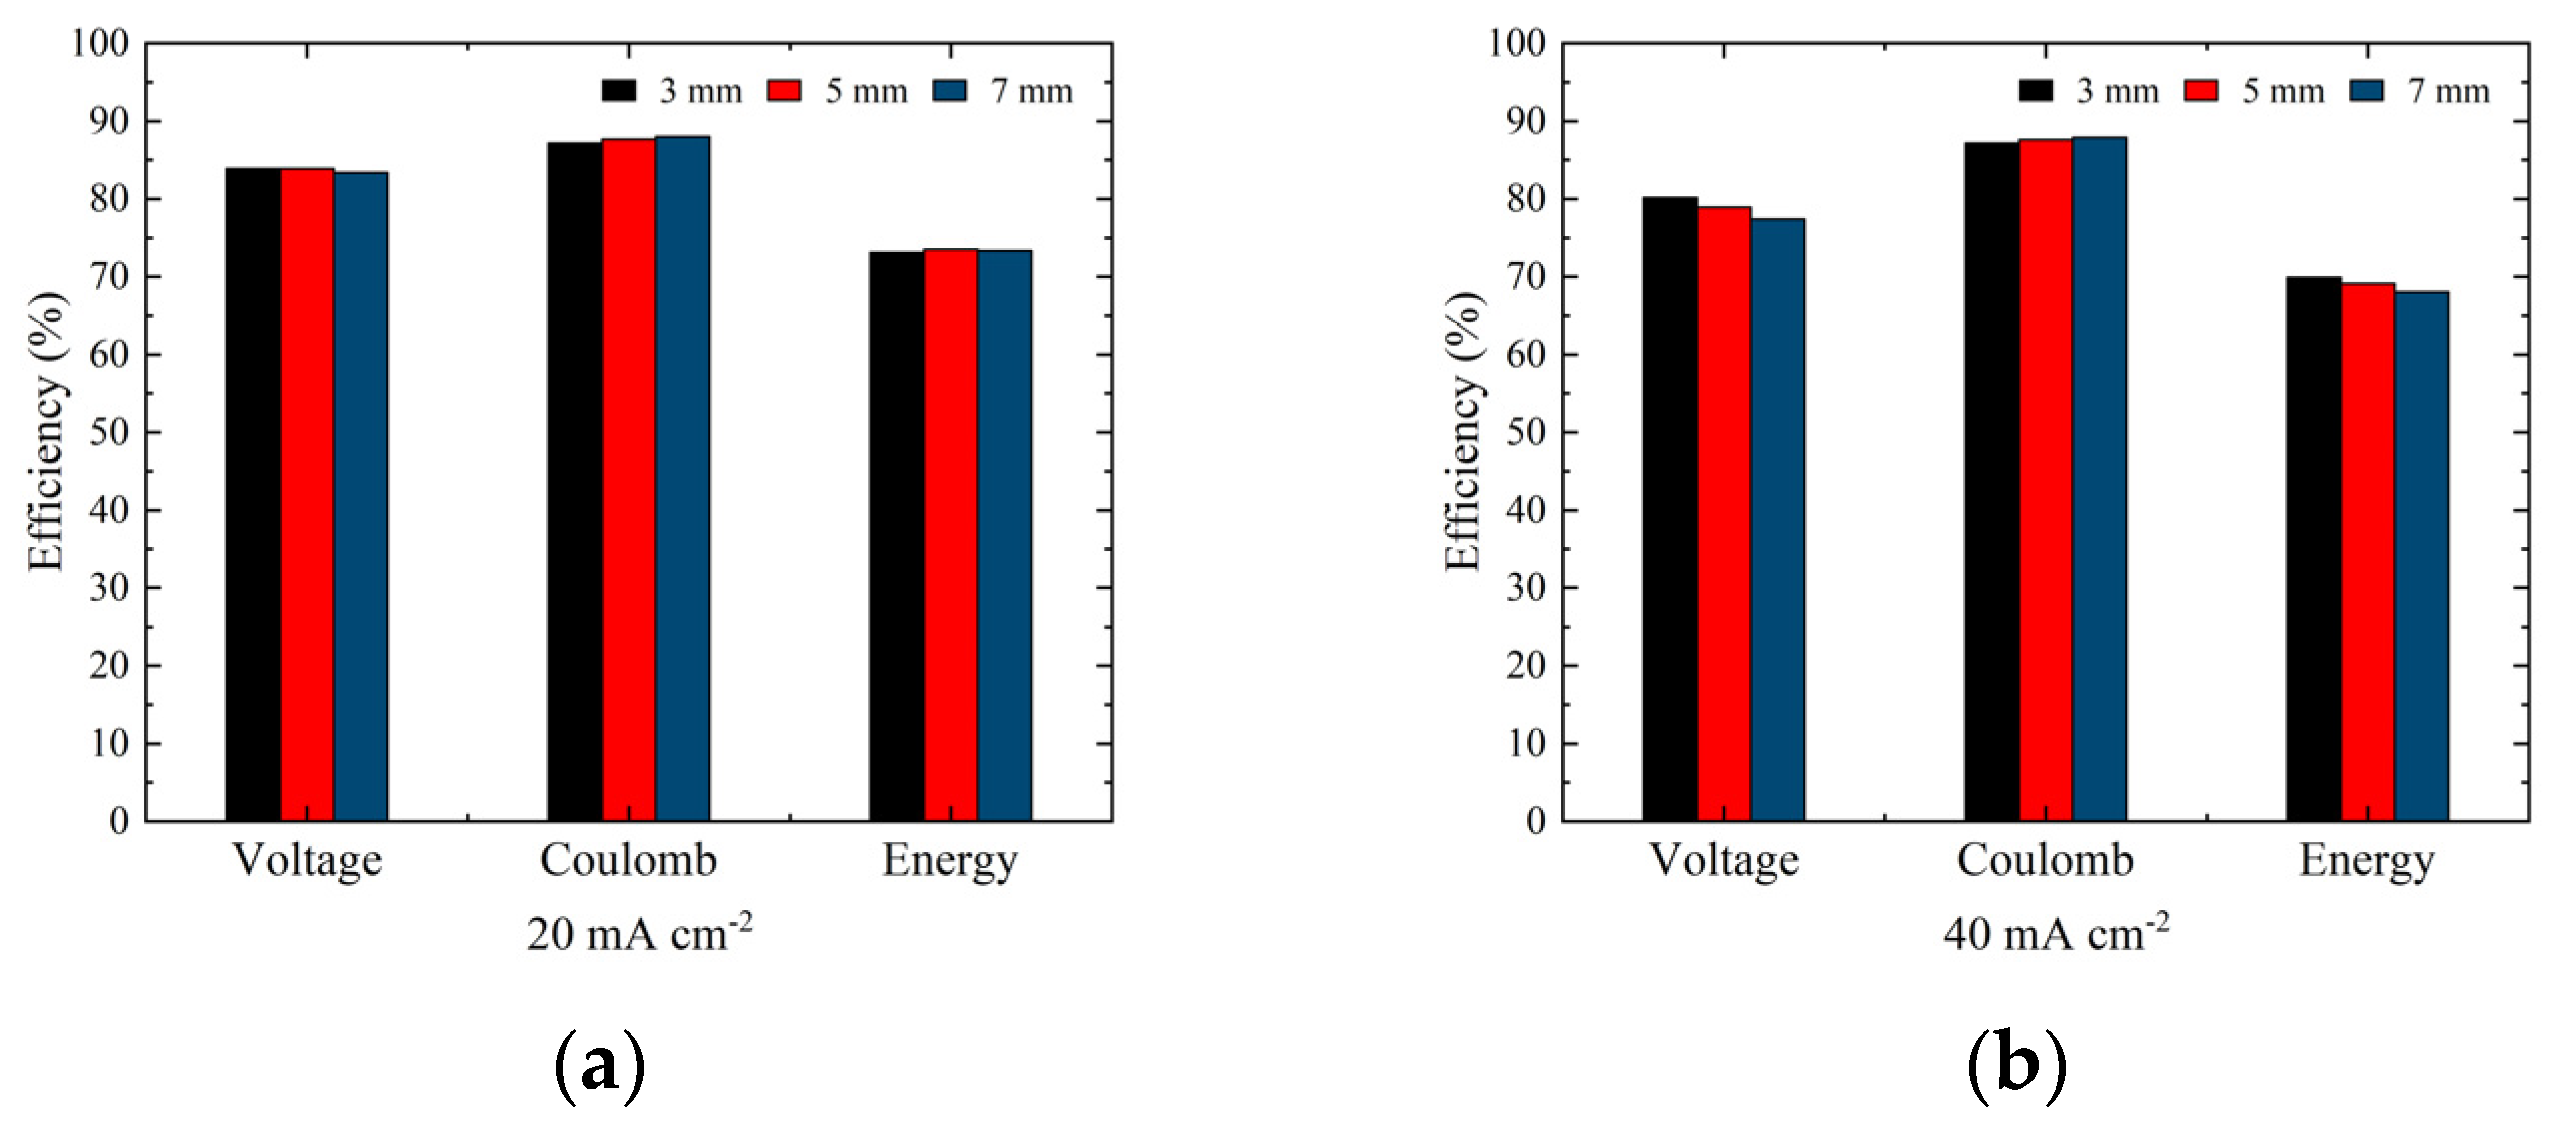
3.2. Effect of Electrode Thickness

The ZBFB performance is sensitive to electrode parameters. Figure 8 shows the battery voltages with different electrode thicknesses at current densities of 20 and 40   mA   cm 2 , with a positive electrolyte flow rate of 20   mL   min 1 . It is found that battery voltage varies little with different electrode thicknesses at 20   mA   cm 2 . For example, the battery discharge voltages with electrode thicknesses of 3 and 7 mm are 1.576 and 1.570 V, respectively. At 40   mA   cm 2 , however, battery voltages are apparently changed with electrode thicknesses. At both current densities, a thicker electrode increases battery overpotential. It is demonstrated that electrode thickness affects ZBFB performance mainly through active specie and electron transport. As shown in Figure 9, the bromine distribution explains the above phenomenon. As electrode thickness increases, active species cannot participate in the redox reaction in time, resulting in a non-uniform distribution of active species and concentration polarization, and ohmic polarization is more significant caused by longer electrons transport [36].
Figure 8. Battery voltages with different electrode thicknesses at current densities of (a) 20   mA   cm 2 and (b) 40   mA   cm 2 .
Figure 9. Bromine concentration distribution in the positive electrode at t = 0.85 h for battery with different electrode thicknesses at current densities of (a) 20   mA   cm 2 and (b) 40   mA   cm 2 .
The active surface area of the electrode increases with the electrode thickness. For example, the active surface area corresponding to 3 and 7 mm electrode thicknesses are 0.031 and 0.072   m 2 , respectively. Thicker electrodes can provide more active surface area for the redox reaction, allowing more bromine to participate and enhancing consumption. Thus, electrode thickness significantly increases battery discharge capacity (Table 5). Figure 10 displays the voltage, coulomb, and energy efficiency of the battery with different electrode thicknesses at current densities of 20 and 40   mA   cm 2 . Discharge capacity increases with electrode thickness, thus improving coulomb efficiency. At 20   mA   cm 2 , the coulomb efficiency increases from 87.17% to 88.00% as the electrode thickness increases from 3 to 7 mm. However, increasing electrode thickness also increases overpotential, decreasing voltage efficiency. The voltage efficiency reduces from 83.88% to 83.36% when the electrode thickness increases from 3 to 7 mm. A similar trend is observed at 40   mA   cm 2 when electrode thickness increased from 3 to 7 mm, coulomb efficiency increased from 87.15% to 87.90%, and voltage efficiency decreased from 80.19% to 77.40%.
Table 5. Discharge capacities of battery with different electrode thicknesses at different current densities (Ah).
Figure 10. Voltage, coulomb, and energy efficiency of battery with different electrode thicknesses at current densities of (a) 20   mA   cm 2 and (b) 40 mA   cm 2 .

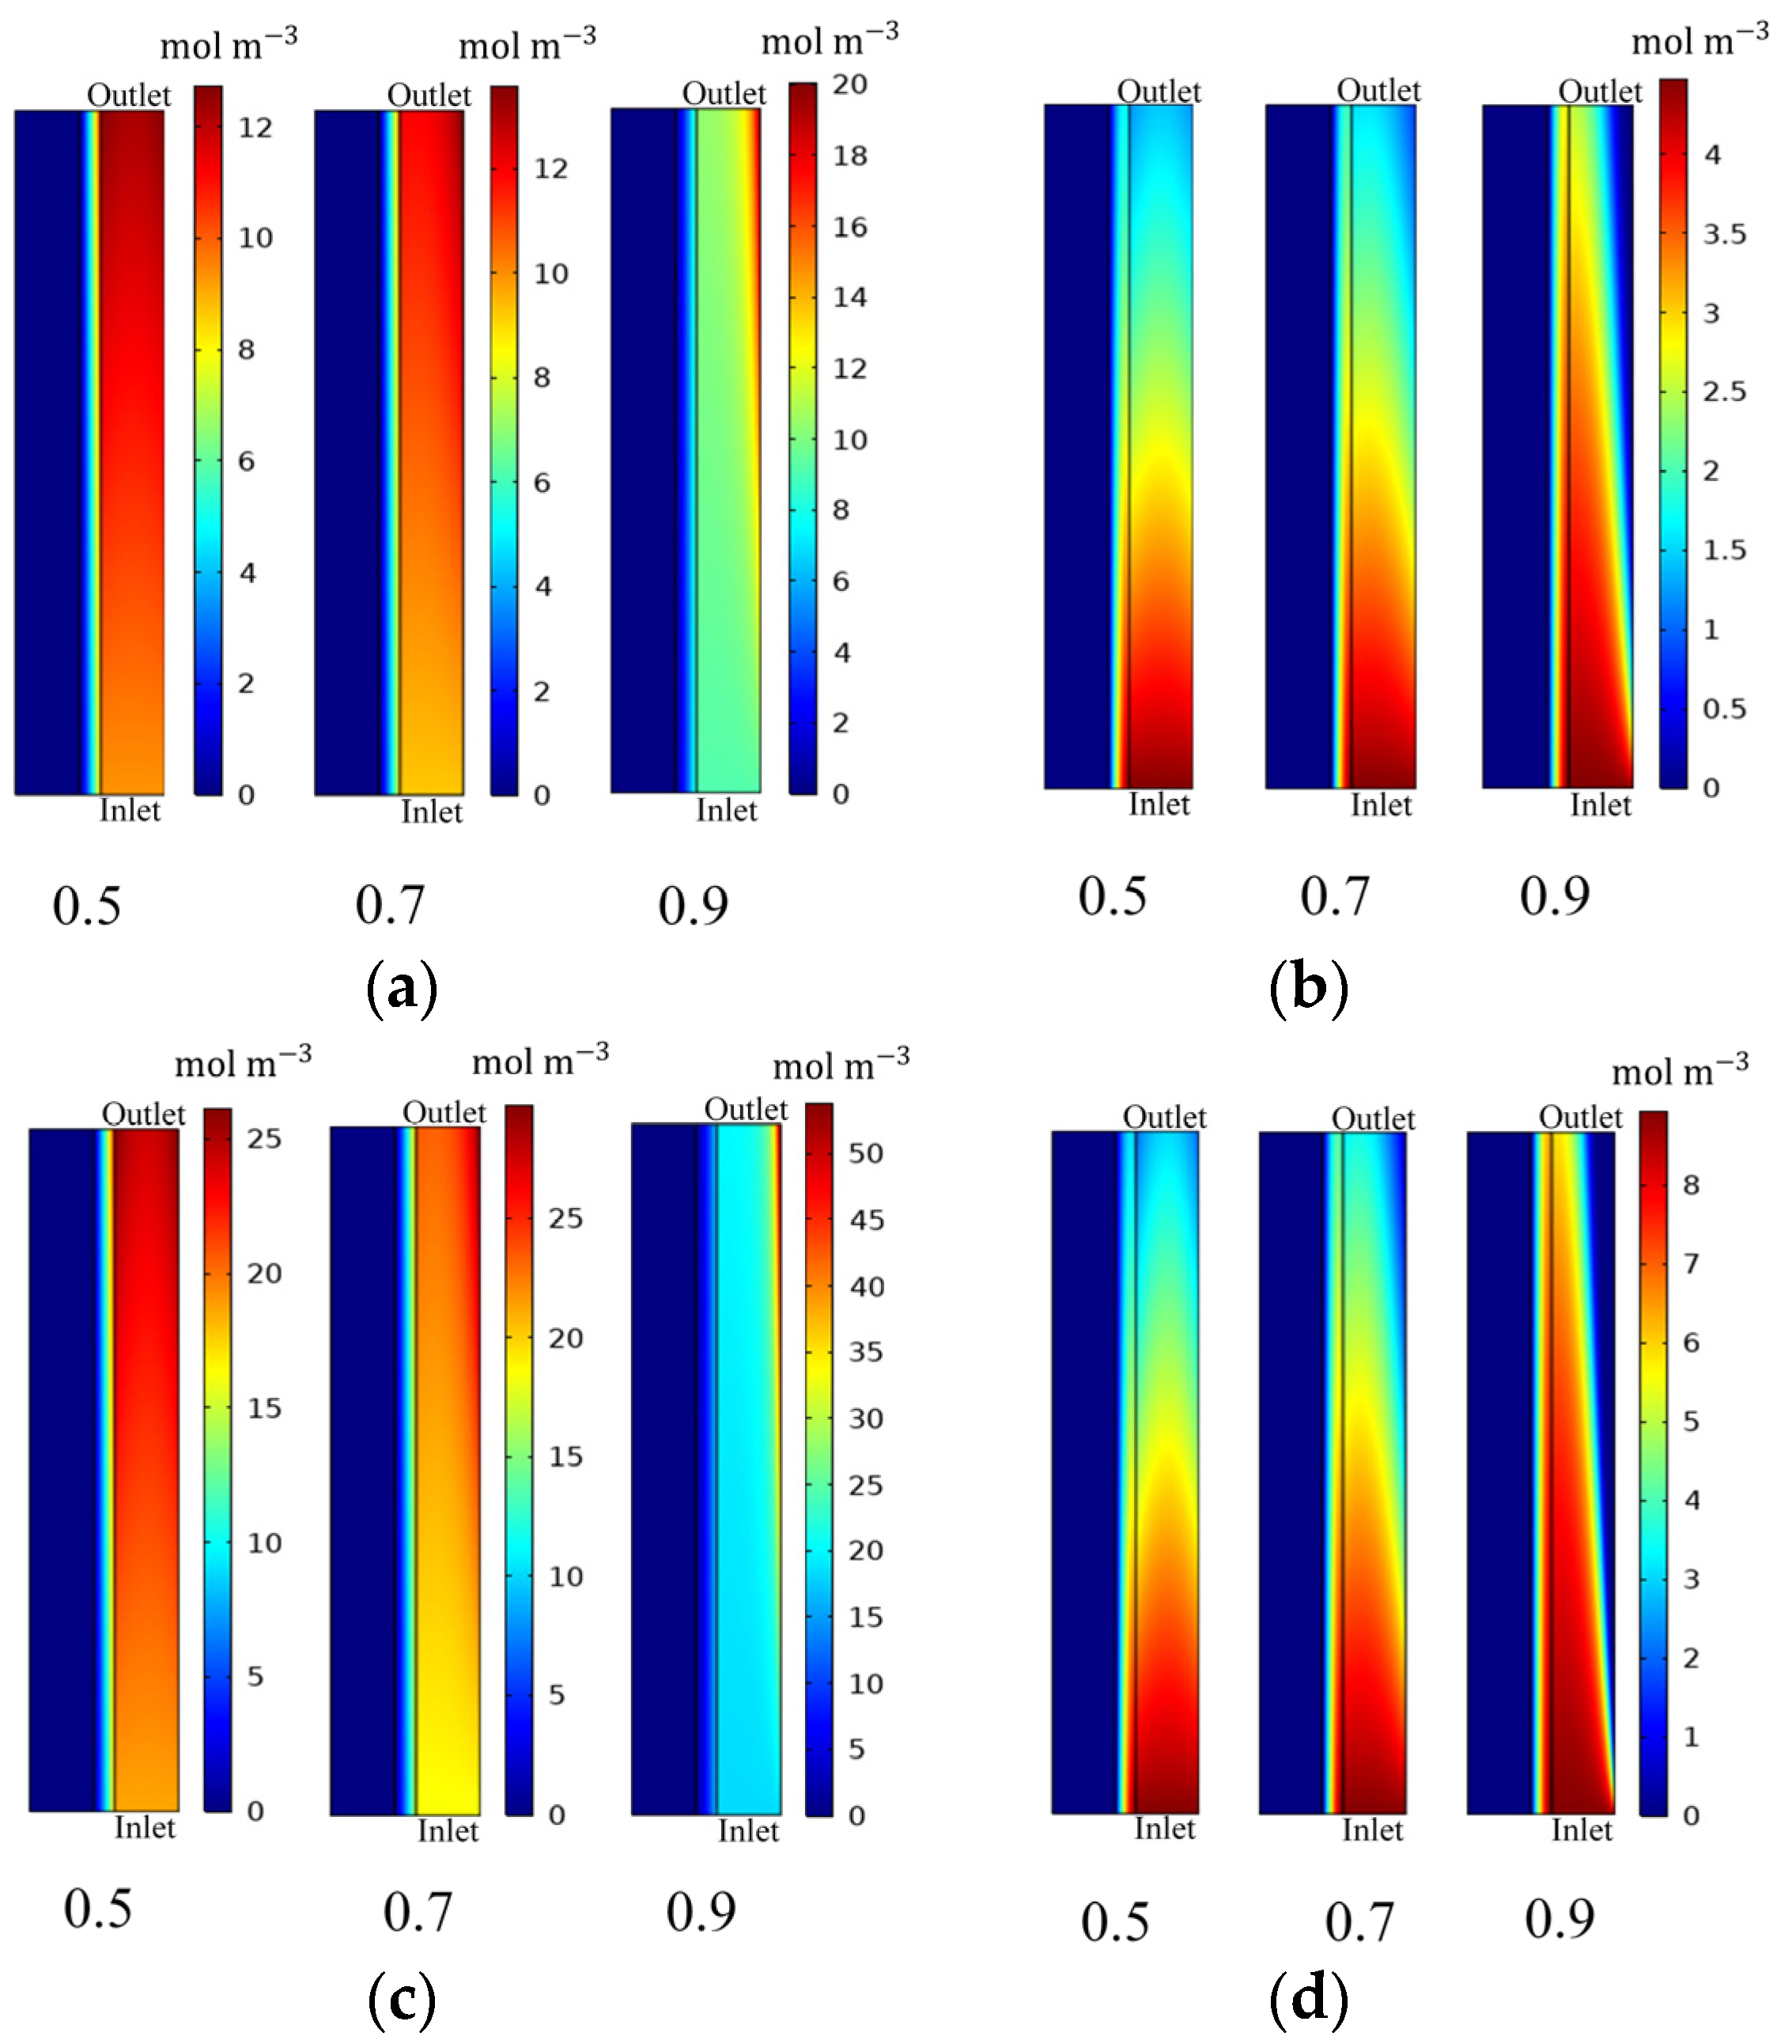
3.3. Effect of Electrode Porosity

Compared with planar electrodes, porous electrodes have a larger active surface area, which facilitates uniform zinc distribution and suppresses zinc dendrites. It also allows more bromine to participate in the reaction. Thus, porous electrodes are beneficial to extend battery life and increase battery discharge capacity [37,38,39,40]. Electrode porosity is also an essential factor affecting ZBFB performance. Figure 11 displays the battery voltages with different electrode porosities at current densities of 20 and 40   mA   cm 2 (electrolyte flow rate = 20   mL   min 1 and electrode thickness = 3 mm). The results show that electrode porosity increases overpotential. The overpotential is more prominent when porosity is 0.9. Figure 12 explains the phenomenon. As electrode porosity increases, reactants diffuse and accumulate to both electrode sides, causing non-uniform distribution and the resultant overpotential caused by concentration polarization.
Figure 11. Battery voltages with different electrode porosities at current densities of (a) 20   mA   cm 2 and (b) 40   mA   cm 2 .
Figure 12. Bromine concentration distribution in the positive electrode at (a) t = 0.2 h and (b) t = 0.9 h for battery with different electrode porosities at a current density of 20   mA   cm 2 and at (c) t = 0.2 h and (d) t = 0.9 h for battery with different electrode porosities at a current density of 40   mA   cm 2 .
Figure 13 shows the voltage, coulomb, and energy efficiency of the battery with different electrode porosities at current densities of 20 and 40   mA   cm 2 . At 20   mA   cm 2 , due to overpotential, voltage efficiency drops from 83.88% to 79.45% as the electrode porosity increases from 0.5 to 0.9, decreasing energy efficiency by 3.70%. It exhibits a similar tendency at 40   mA   cm 2 , where voltage efficiency reduces from 80.19% to 73.56%, with a 5.96% decrease in energy efficiency. In addition, as demonstrated in Table 6, the ZBFB with electrode porosity of 0.7 has the maximum discharge capacity at both current densities because the electrode porosity increases the redox reaction area and improves reactants utilization. However, as the porosity increases further, the reactants are not uniformly distributed and cannot participate in the reaction in time, resulting in a decrease in discharge capacity at a porosity of 0.9. Thus, high electrode porosity does not improve ZBFB performance.
Figure 13. Voltage, coulomb, and energy efficiency of battery with different electrode porosities at current densities of (a) 20   mA   cm 2 and (b) 40   mA   cm 2 .
Table 6. Discharge capacities of battery with different electrode porosities at different current densities (Ah).

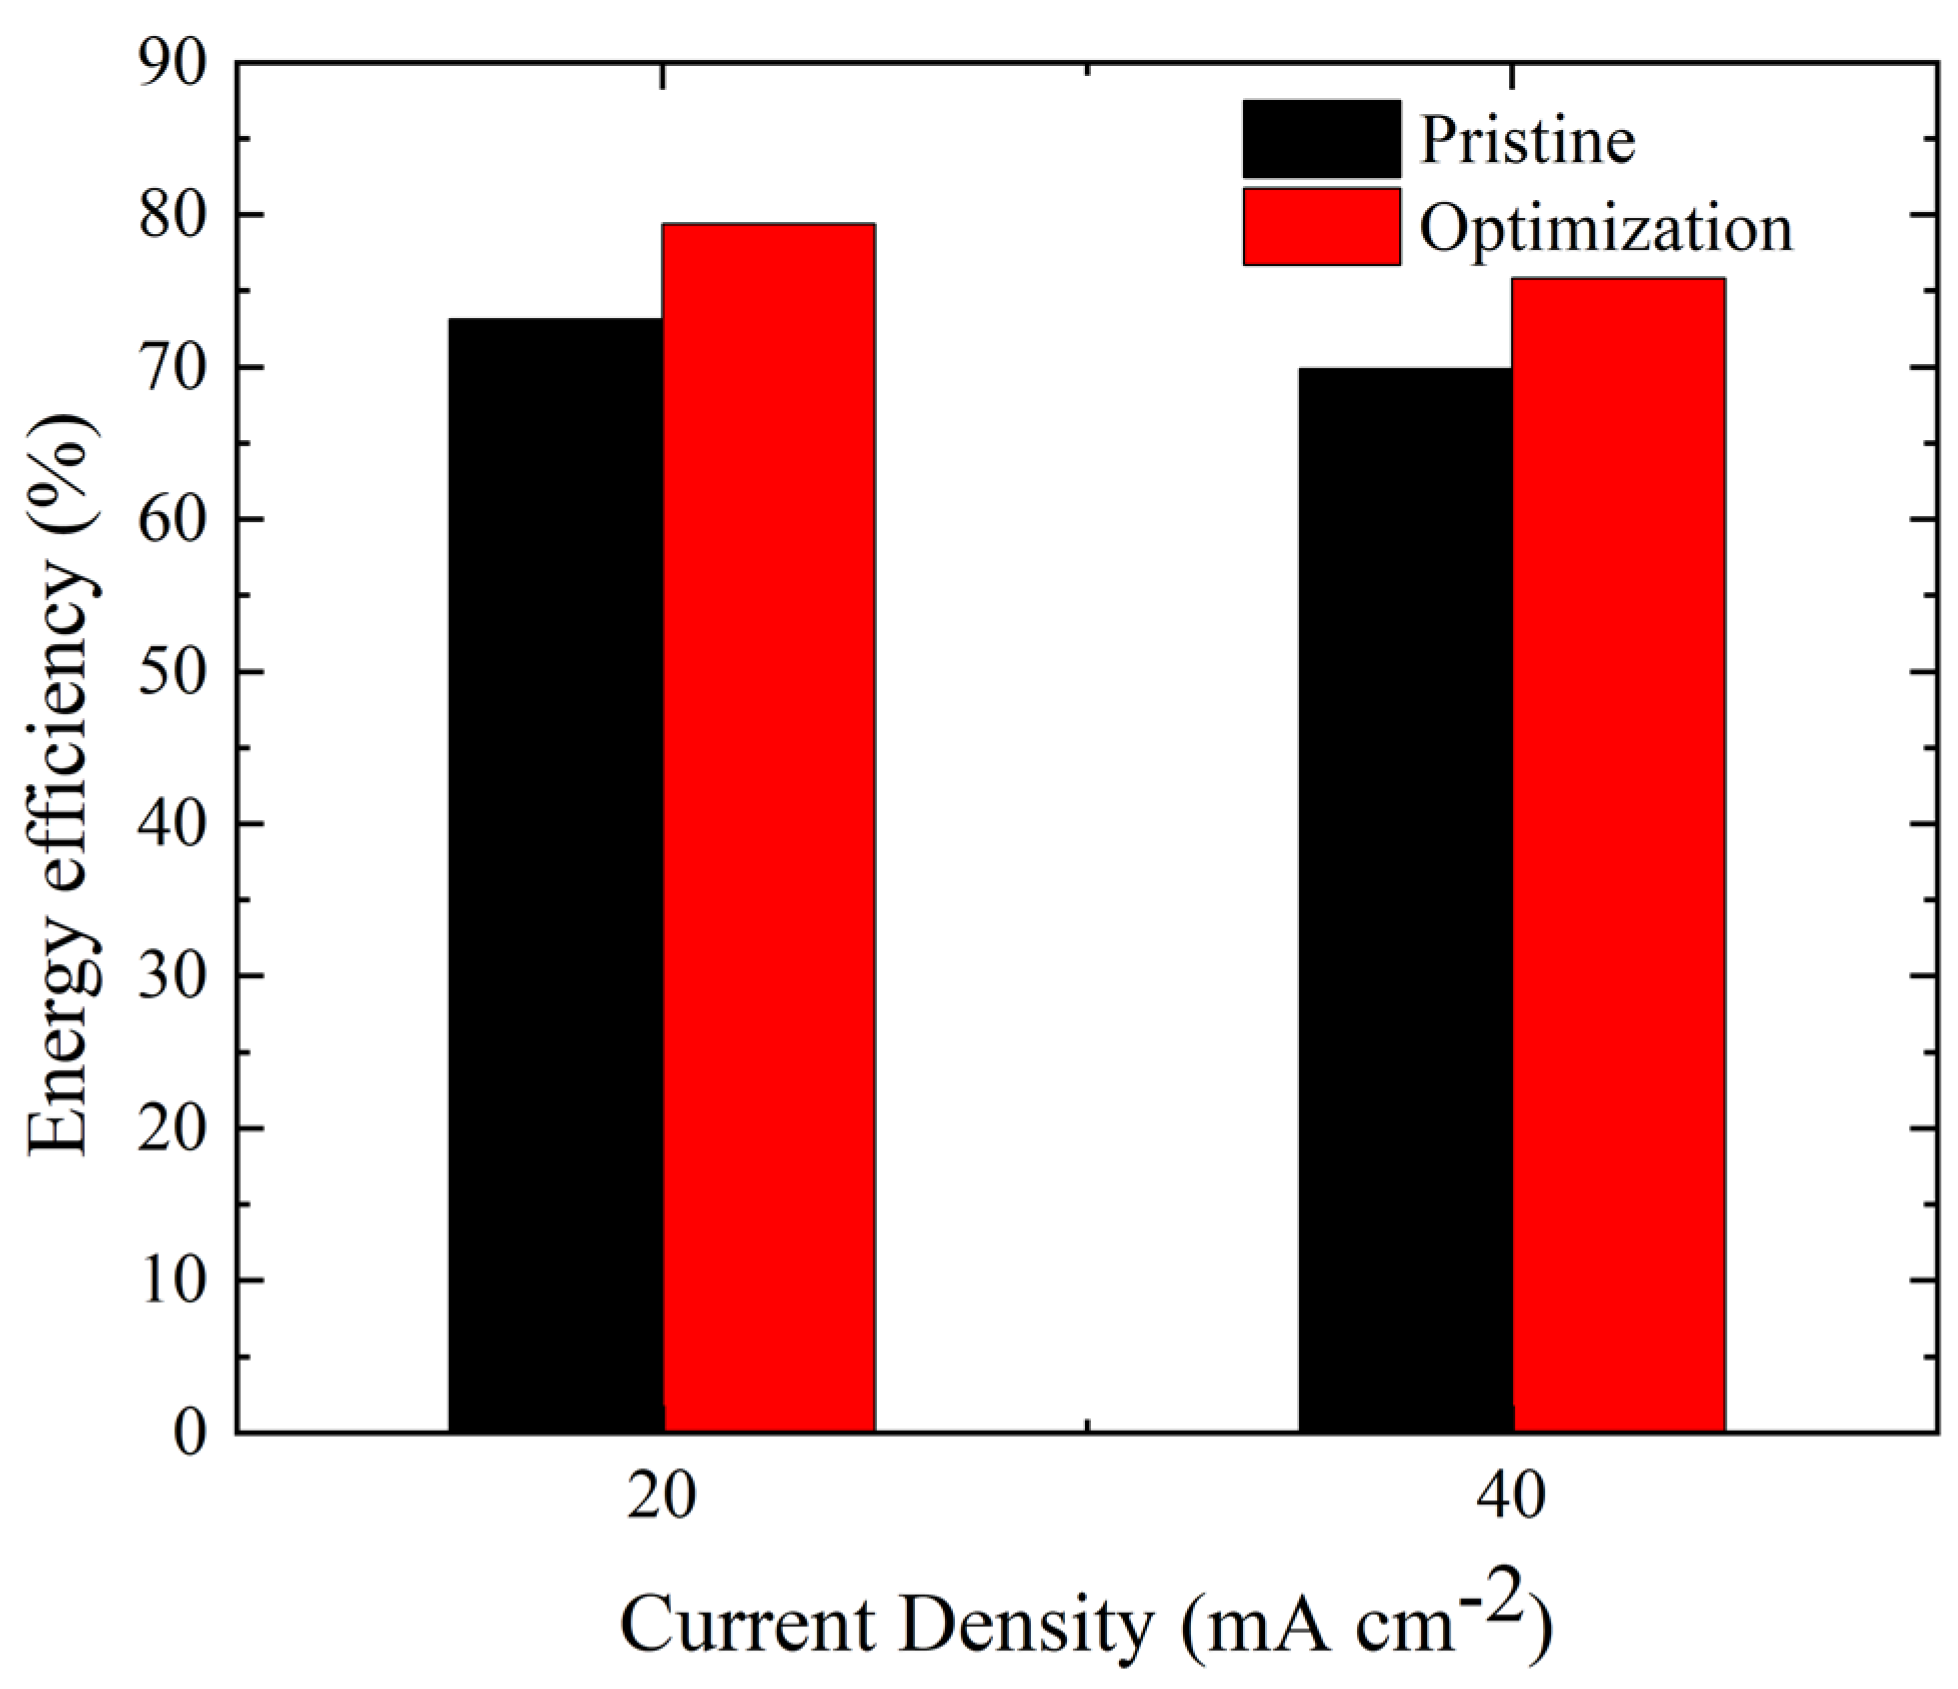
3.4. Parameter Optimization to Further Improve Battery Performance

Figure 14a shows the variation of the coulomb efficiency with various electrolyte flow rate and electrode thickness (electrode porosity is 0.5). The increased electrolyte flow rate and electrode thickness improve the coulomb efficiency. However, the improvement of coulomb efficiency by increasing electrode thickness becomes less significant at a larger flow rate. Figure 14b shows the variation of the coulomb efficiency with the electrolyte flow rate and the electrode porosity (electrode thickness is 3 mm). Increasing the electrolyte flow rate improves the coulomb efficiency. However, the influence of porosity is negligible. The reason is that there is a trade-off between the positive effect of increased reaction area and negative effect of concentration polarization caused by increasing porosity. The battery with electrode porosity of 0.7 has the maximum coulomb efficiency at different electrolyte flow rates. These tendencies are also valid at current density of 20   mA   cm 2 .
Figure 14. Coulomb efficiency of battery with (a) different electrolyte flow rates and electrode thicknesses and (b) different electrolyte flow rates and electrode porosities at a current density of 40   mA   cm 2 .
As shown in Figure 15, energy efficiency was also examined with different combinations of flow rates, electrode thicknesses, and porosities. As shown in Figure 15a, at 20   mA   cm 2 , the energy efficiency increases with the flow rate at different electrode thicknesses, but the effect of different electrode thickness is complex. For flow rate from 20 to 50   mL   min 1 , the energy efficiency increases first and then drops with electrode thickness, and has an optimal thickness of 5 mm. When flow rate is 10   mL   min 1 , the energy efficiency increases monotonically with electrode thickness and reaches its maximum at electrode thickness of 7 mm. At 40   mA   cm 2 , the effect of flow rate on energy efficiency is similar to the cases at current density of 20   mA   cm 2 . The effect of electrode thickness is also straightforward. The battery with a 3 mm electrode thickness has the highest energy efficiency at different electrolyte flow rates. Figure 15b shows that the energy efficiency increases with electrolyte flow rate for all electrode porosities. In contrast, it gradually decreases with electrode porosity for all electrolyte flow rates. The battery with electrode porosity of 0.5 has the highest energy efficiency, both for 20 and 40   mA   cm 2 .
Figure 15. Energy efficiency of battery with (a) different electrolyte flow rates and different electrode thicknesses and (b) different electrolyte flow rates and different electrode porosities at current densities of 20   mA   cm 2 and 40   mA   cm 2 .
Although sensitivity tests are performed on the parameters, there are coupling effects between different parameters. Each parameter has an optimal value under particular conditions. When operating conditions are changed, the ideal value for each parameter is varied. Thus, achieving the best battery design requires multi-parameter optimization. There are several algorithms to perform multi-parameter optimization, such as Particle Swarm Optimization (PSO), Differential Evolution (DE), and Genetic Algorithm (GA). Table 7 compares the pros and cons of the three algorithms. GA has been widely used in various optimization problems in science and engineering because of its strong global search capability and applicability to solving complex problems. Thus, GA is adopted.
Table 7. Comparison among different multi-parameter optimization algorithms.
In the optimization process, the population size and the evolutionary generation are both 50, and the crossover and the mutation probabilities are 0.9 and 0.2, respectively. The range of each variable is shown in Table 8. To determine the optimal energy efficiency, the fitness function F f i t of the algorithm is defined as:
F f i t = 1 η E + 1 = 1 η V × η C + 1
Table 8. The range of values of the parameters used in this work.
Table 9 shows the optimization results. As shown in Figure 16, the concentration loss of the redox reaction can be effectively improved after optimization, and the bromine concentration is more uniformly distributed, which effectively lowers the battery overpotential. Figure 17 shows the variation of current density with time. It is found that the optimized battery reaches a more uniform current density distribution, especially when the discharge is almost complete. As shown in Figure 18, the energy efficiency of the battery is improved. The optimized energy efficiency reaches 79.42% and 75.82% at current densities of 20 and 40   mA   cm 2 , respectively, corresponding to improvements by 6.30% and 5.95% when compared with the original design.
Table 9. Optimal combination of parameters at different current densities.
Figure 16. Comparison of the bromine concentration distribution in the positive electrode at 0.9 h at a current density of 20   mA   cm 2 : (a) Pristine and (b) Optimization.
Figure 17. Comparison of electrode current density distribution at different moments at a current density of 20   mA   cm 2 : (a) Pristine and (b) Optimization.
Figure 18. Comparison of energy efficiency of battery before and after optimization at different current densities.
Ali et al. [44] calculated the power-based efficiency for VRFB with various flow channels at different electrolyte flow rates, and found that efficiency is negatively proportional to increased flow rate. Likewise, for ZBFB designed in this study, understanding the trade-off between pumping power and energy efficiency at different flow rates maybe also important for determining the best operating conditions, which could be considered in future.

4. Conclusions

This paper developed a 2D transient ZBFB model, and the effects of positive electrolyte flow rate, electrode thickness, and electrode porosity on the battery performance were investigated. A genetic-algorithm-coupled optimization was performed to further boost the battery performance. The main conclusions are summarized as follows: (1) Increasing the positive electrolyte flow rate can effectively promote electrolyte transport, causing more bromine volume to participate in the redox reaction and, thus, significantly improving the battery discharge capacity; (2) Thicker electrode thickness raises battery overpotential due to deteriorated reactant distribution uniformity and more considerable ohmic loss. However, increasing electrode thickness can enhance the active surface area, significantly boosting battery discharge capacity; (3) Increasing the electrode porosity causes reactants to diffuse and accumulate on both electrode sides and produces a more significant concentration polarization, leading to a higher overpotential and lower battery performance; and (4) The operational parameters are optimized through a single-objective GA method. It is found that at 20   mA   cm 2 , the battery energy efficiency can reach 79.42% with an optimal parameter combination with a positive electrolyte flow rate of 50 mL   min 1 , electrode thickness of 5 mm, and electrode porosity of 0.5.

Author Contributions

Conceptualization, T.-H.W.; methodology, T.-H.W.; software, G.-X.W.; validation, G.-X.W.; formal analysis, Y.-Q.Z., G.-X.W., and R.-Y.L.; investigation, Y.-Q.Z., G.-X.W. and R.-Y.L.; resources, Y.-Q.Z.; data curation, Y.-Q.Z., G.-X.W. and R.-Y.L.; writing—original draft preparation, G.-X.W.; writing— review and editing, Y.-Q.Z., G.-X.W., R.-Y.L. and T.-H.W.; supervision, T.-H.W.; funding acquisition, T.-H.W. All authors have read and agreed to the published version of the manuscript.

Funding

This research was supported by the National Natural Science Foundation of China (Grant No. 51876059).

Data Availability Statement

Not applicable.

Conflicts of Interest

The authors declare no conflict of interest.

References

  1. Wang, Y.L.; Xu, H.K.; He, W.; Zhao, Y.L.; Wang, X.D. Lattice Boltzmann simulation of the structural degradation of a gas diffusion layer for a proton exchange membrane fuel cell. J. Power Sources 2023, 556, 232452. [Google Scholar] [CrossRef]
  2. Popat, Y.; Trudgeon, D.; Zhang, C.Q.; Walsh, F.C.; Connor, P.; Li, X.H. Carbon Materials as Positive Electrodes in Bromine-Based Flow Batteries. ChemPlusChem 2022, 87, e202100441. [Google Scholar] [CrossRef] [PubMed]
  3. Wang, Y.L.; Wang, S.X.; Liu, S.C.; Li, H.; Zhu, K. Optimization of reactants relative humidity for high performance of polymer electrolyte membrane fuel cells with co-flow and counter-flow configurations. Energy Convers. Manag. 2020, 205, 112369. [Google Scholar] [CrossRef]
  4. Hu, K.Y.; Zhao, P.Y.; Wang, S.X.; Wang, Y.L. Three-dimensional multiphase simulation of a partially narrowed flow field configuration for a high-performance polymer electrolyte membrane fuel cell. Appl. Therm. Eng. 2023, 223, 119986. [Google Scholar] [CrossRef]
  5. Park, M.; Ryu, J.; Wang, W.; Cho, J. Material design and engineering of next-generation flow-battery. Nat. Rev. Mater. 2017, 2, 16080. [Google Scholar] [CrossRef]
  6. Alotto, P.; Guarnieri, M.; Moro, F. Redox flow batteries for the storage of renewable energy: A review. Renew. Sustain. Energy Rev. 2014, 29, 325–335. [Google Scholar] [CrossRef]
  7. Vanýsek, P.; Novák, V. Redox flow batteries as the means for energy storage. J. Energy Storage 2017, 13, 435–441. [Google Scholar] [CrossRef]
  8. Tang, L.; Leung, P.; Mohamed, M.R.; Xu, Q.; Dai, S.; Zhu, X.; Flox, C.; Shah, A.A.; Liao, Q. Capital cost evaluation of conventional and emerging redox flow batteries for grid storage applications. Electrochim. Acta 2023, 437, 141460. [Google Scholar] [CrossRef]
  9. Cao, L.Y.; Skyllas-Kazacos, M.; Menictas, C.; Noack, J. A review of electrolyte additives and impurities in vanadium redox flow batteries. J. Energy Chem. 2018, 000, 1–23. [Google Scholar] [CrossRef]
  10. Khor, A.; Leung, P.; Mohamed, M.R.; Flox, C.; Xu, Q.; An, L.; Wills, R.G.A.; Morante, J.R.; Shah, A.A. Review of zinc-based hybrid flow batteries: From fundamentals to Applications. Mater. Today Energy 2018, 8, 80–108. [Google Scholar]
  11. Zhang, H.; Sun, C.Y.; Ge, M.M. Review of the Research Status of Cost-Effective Zinc–Iron Redox Flow Batteries. Batteries 2022, 8, 202. [Google Scholar] [CrossRef]
  12. Yuan, Z.Z.; Duan, Y.Q.; Liu, T.; Zhang, H.M.; Li, X.F. Toward a Low-Cost Alkaline Zinc-Iron Flow Battery with a Polybenzimidazole Custom Membrane for Stationary Energy Storage. iScience 2018, 3, 40–49. [Google Scholar] [CrossRef] [PubMed]
  13. Wu, M.C.; Zhao, T.S.; Zhang, R.H.; Jiang, H.R.; Wei, L. A Zinc-Bromine Flow Battery with Improved Design of Battery Structure and Electrodes. Energy Technol. 2018, 6, 333–339. [Google Scholar] [CrossRef]
  14. Hua, L.; Lu, W.; Li, T.; Xu, P.; Zhang, H.; Li, X. A highly selective porous composite membrane with bromine capturing ability for a bromine-based flow battery. Mater. Today Energy 2021, 21, 100763. [Google Scholar] [CrossRef]
  15. Kim, M.; Yun, D.; Jeon, J. Effect of a bromine complex agent on electrochemical performances of zinc electrodeposition and electrodissolution in Zinc-Bromide flow battery. J. Power Sources 2019, 438, 227020. [Google Scholar] [CrossRef]
  16. Jiang, H.R.; Wu, M.C.; Ren, Y.X.; Shyy, W.; Zhou, T.S. Towards a uniform distribution of zinc in the negative electrode for zinc bromine flow batteries. Appl. Energy 2018, 213, 366–374. [Google Scholar] [CrossRef]
  17. Yang, J.H.; Yang, H.S.; Ra, H.W.; Shim, J.; Jeon, J.D. Effect of a surface active agent on performance of zinc/bromine redox flow batteries: Improvement in current efficiency and system stability. J. Power Sources 2015, 275, 294–297. [Google Scholar] [CrossRef]
  18. Wu, M.C.; Zhao, T.S.; Jiang, H.R.; Zeng, Y.K.; Ren, T.X. High-performance zinc bromine flow battery via improved design of electrolyte and electrode. J. Power Sources 2017, 355, 62–68. [Google Scholar] [CrossRef]
  19. Archana, K.S.; Naresh, R.P.; Enale, H.; Rajendram, V.; Mohan, A.M.V.; Bhaskar, A.; Ragupathy, P.; Dixon, D. Effect of positive electrode modification on the performance of zinc-bromine redox flow batteries. J. Energy Storage 2020, 29, 101462. [Google Scholar] [CrossRef]
  20. Esan, O.C.; Shi, X.Y.; Pan, Z.F.; Huo, X.Y.; An, L.; Zhao, T.S. Modeling and Simulation of Flow Batteries. Adv. Energy Mater. 2020, 10, 2000758. [Google Scholar] [CrossRef]
  21. Simpson, G.D.; White, R.E. An algebraic model for a zinc/bromine flow battery. J. Electrochem. Soc. 1989, 136, 2137. [Google Scholar] [CrossRef]
  22. Evans, T.I.; White, R.E. A Mathematical Model of a Zinc/Bromine Flow Battery. J. Electrochem. Soc. 1987, 134, 866. [Google Scholar] [CrossRef]
  23. Mader, M.J.; White, R.E. A mathematical model of a Zn/Br2 battery on charge. J. Electrochem. Soc. 1986, 133, 1297. [Google Scholar] [CrossRef]
  24. Mader, M.J.; Walton, C.W.; White, R.E. Parallel plate electrochemical reactor model: Material balance closure and a simplification. J. Electrochem. Soc. 1986, 133, 1124–1130. [Google Scholar] [CrossRef]
  25. Koo, B.; Lee, D.; Yi, J.; Shin, C.B.; Kim, D.J.; Choi, E.M.; Kang, T.H. Modeling the performance of a zinc/bromine flow battery. Energies 2019, 12, 1159. [Google Scholar] [CrossRef]
  26. Xu, Z.C.; Wang, J.; Yan, S.C.; Fan, Q.; Lund, P.D. Modeling of Zinc Bromine redox flow battery with Application to channel design. J. Power Sources 2020, 450, 227436. [Google Scholar] [CrossRef]
  27. Ma, X.K.; Zhang, H.M.; Sun, C.X.; Zou, Y.; Zhang, T. An optimal strategy of electrolyte flow rate for vanadium redox flow battery. J. Power Sources 2012, 203, 153–158. [Google Scholar] [CrossRef]
  28. Ali, E.; Kwon, H.; Choi, J.; Lee, J.; Kim, J.; Park, H. A numerical study of electrode thickness and porosity effects in all vanadium redox flow batteries. J. Energy Storage 2020, 28, 101208. [Google Scholar] [CrossRef]
  29. Wang, Q.; Chen, W. Effects of porosity variation in different linear and combination modes in the electrode on the performance of all-vanadium flow battery. J. Energy Storage 2022, 51, 104394. [Google Scholar] [CrossRef]
  30. Li, X.J.; Li, T.Y.; Xu, P.C.; Xie, C.X.; Zhang, Y.H.; Li, X.F. A Complexing Agent to Enable a Wide-Temperature Range Bromine-Based Flow Battery for Stationary Energy Storage. Adv. Funct. Mater. 2021, 31, 2100133. [Google Scholar] [CrossRef]
  31. Lai, Q.Z.; Zhang, H.M.; Li, X.F.; Zhang, L.Q.; Cheng, Y.H. A novel single flow zinc-bromine battery with improved energy density. J. Power Sources 2013, 235, 1–4. [Google Scholar] [CrossRef]
  32. Xu, H.C.; Fan, Q.; Li, Y.; Wang, J.; Lund, P.D. Review of zinc dendrite formation in zinc bromine redox flow battery. Renew. Sustain. Energy Rev. 2020, 127, 109838. [Google Scholar] [CrossRef]
  33. Suresh, S.; Ulaganathan, M.; Venkatesan, N.; Periasamy, P.; Ragupathy, P. High performance zinc-bromine redox flow batteries: Role of various carbon felts and battery configurations. J. Energy Storage 2018, 20, 134–139. [Google Scholar] [CrossRef]
  34. Li, X. Modeling and simulation study of a metal free organic-inorganic aqueous flow battery with flow through electrode. Electrochim. Acta 2015, 170, 98–109. [Google Scholar] [CrossRef]
  35. Adith, R.V.; Naresh, R.; Mariyappan, K.; Ulaganathan, M.; Ragupathy, P. An optimistic approach on flow rate and supporting electrolyte for enhancing the performance characteristics of Zn-Br2 redox flow battery. Electrochim. Acta 2021, 388, 138451. [Google Scholar] [CrossRef]
  36. Chen, Z.Q.; Yu, W.T.; Liu, Y.F.; Zeng, Y.K.; He, Q.J.; Tan, P.; Ni, M. Mathematical modeling and numerical analysis of alkaline zinc-iron flow batteries for energy storage application. Chem. Eng. J. 2021, 405, 12668. [Google Scholar] [CrossRef]
  37. Minakshi, M.; Appadoo, D.; Martin, D.E. The Anodic Behavior of Planar and Porous Zinc Electrodes in Alkaline Electrolyte. Electrochem. Solid-State Lett. 2010, 13, A77–A80. [Google Scholar] [CrossRef]
  38. Minakshi, M.; Mitchell, D.R.G.; Prince, K. Incorporation of TiB2 additive into MnO2 cathode and its influence on rechargeability in an aqueous battery system. Solid State Ion. 2018, 179, 355–361. [Google Scholar] [CrossRef]
  39. Minakshi, M.; Ionescu, M. Anodic behavior of zinc in Zn-MnO2 battery using ERDA technique. Int. J. Hydrogen Energy 2010, 35, 7618–7622. [Google Scholar] [CrossRef]
  40. Kim, Y.; Jeon, J. An antisymmetric cell structure for high-performance zinc bromine flow battery. J. Phys. Conf. Ser. 2017, 939, 012021. [Google Scholar] [CrossRef]
  41. Marini, F.; Walczak, B. Particle swarm optimization (PSO). A tutorial. Chemom. Intell. Lab. Syst. 2015, 149, 153–165. [Google Scholar] [CrossRef]
  42. Ding, Q.F.; Yin, X.Y. Research survey of differential evolution algorithms. CAAI Trans. Intell. Syst. 2017, 12, 431–442. [Google Scholar]
  43. Zhang, Y.Q.; Sun, J.; Wang, G.X.; Wang, T.H. Advantage of a Thermoelectric Generator with Hybridization of Segmented Materials and Irregularly Variable Cross-Section Design. Energies 2022, 15, 2944. [Google Scholar] [CrossRef]
  44. Ali, E.; Kwon, H.; Kim, J.; Park, H. Numerical study on serpentine design flow channel configurations for vanadium redox flow batteries. J. Energy Storage 2020, 32, 101802. [Google Scholar] [CrossRef]
Disclaimer/Publisher’s Note: The statements, opinions and data contained in all publications are solely those of the individual author(s) and contributor(s) and not of MDPI and/or the editor(s). MDPI and/or the editor(s) disclaim responsibility for any injury to people or property resulting from any ideas, methods, instructions or products referred to in the content.

Article Metrics

Citations

Article Access Statistics

Multiple requests from the same IP address are counted as one view.