
Decoupling of Electricity Consumption Efficiency, Environmental Degradation and Economic Growth: An Empirical Analysis


Abstract
1. Introduction
2. Theoretical Framework on Decoupling
3. Review of Related Literature
4. Materials and Methods
4.1. Data
4.2. The Decoupling Analysis (DA)
5. Results of the Analysis and Discussion
5.1. Summary Statistics and Correlation Analysis
5.2. Empirical Analysis Results and Discussions
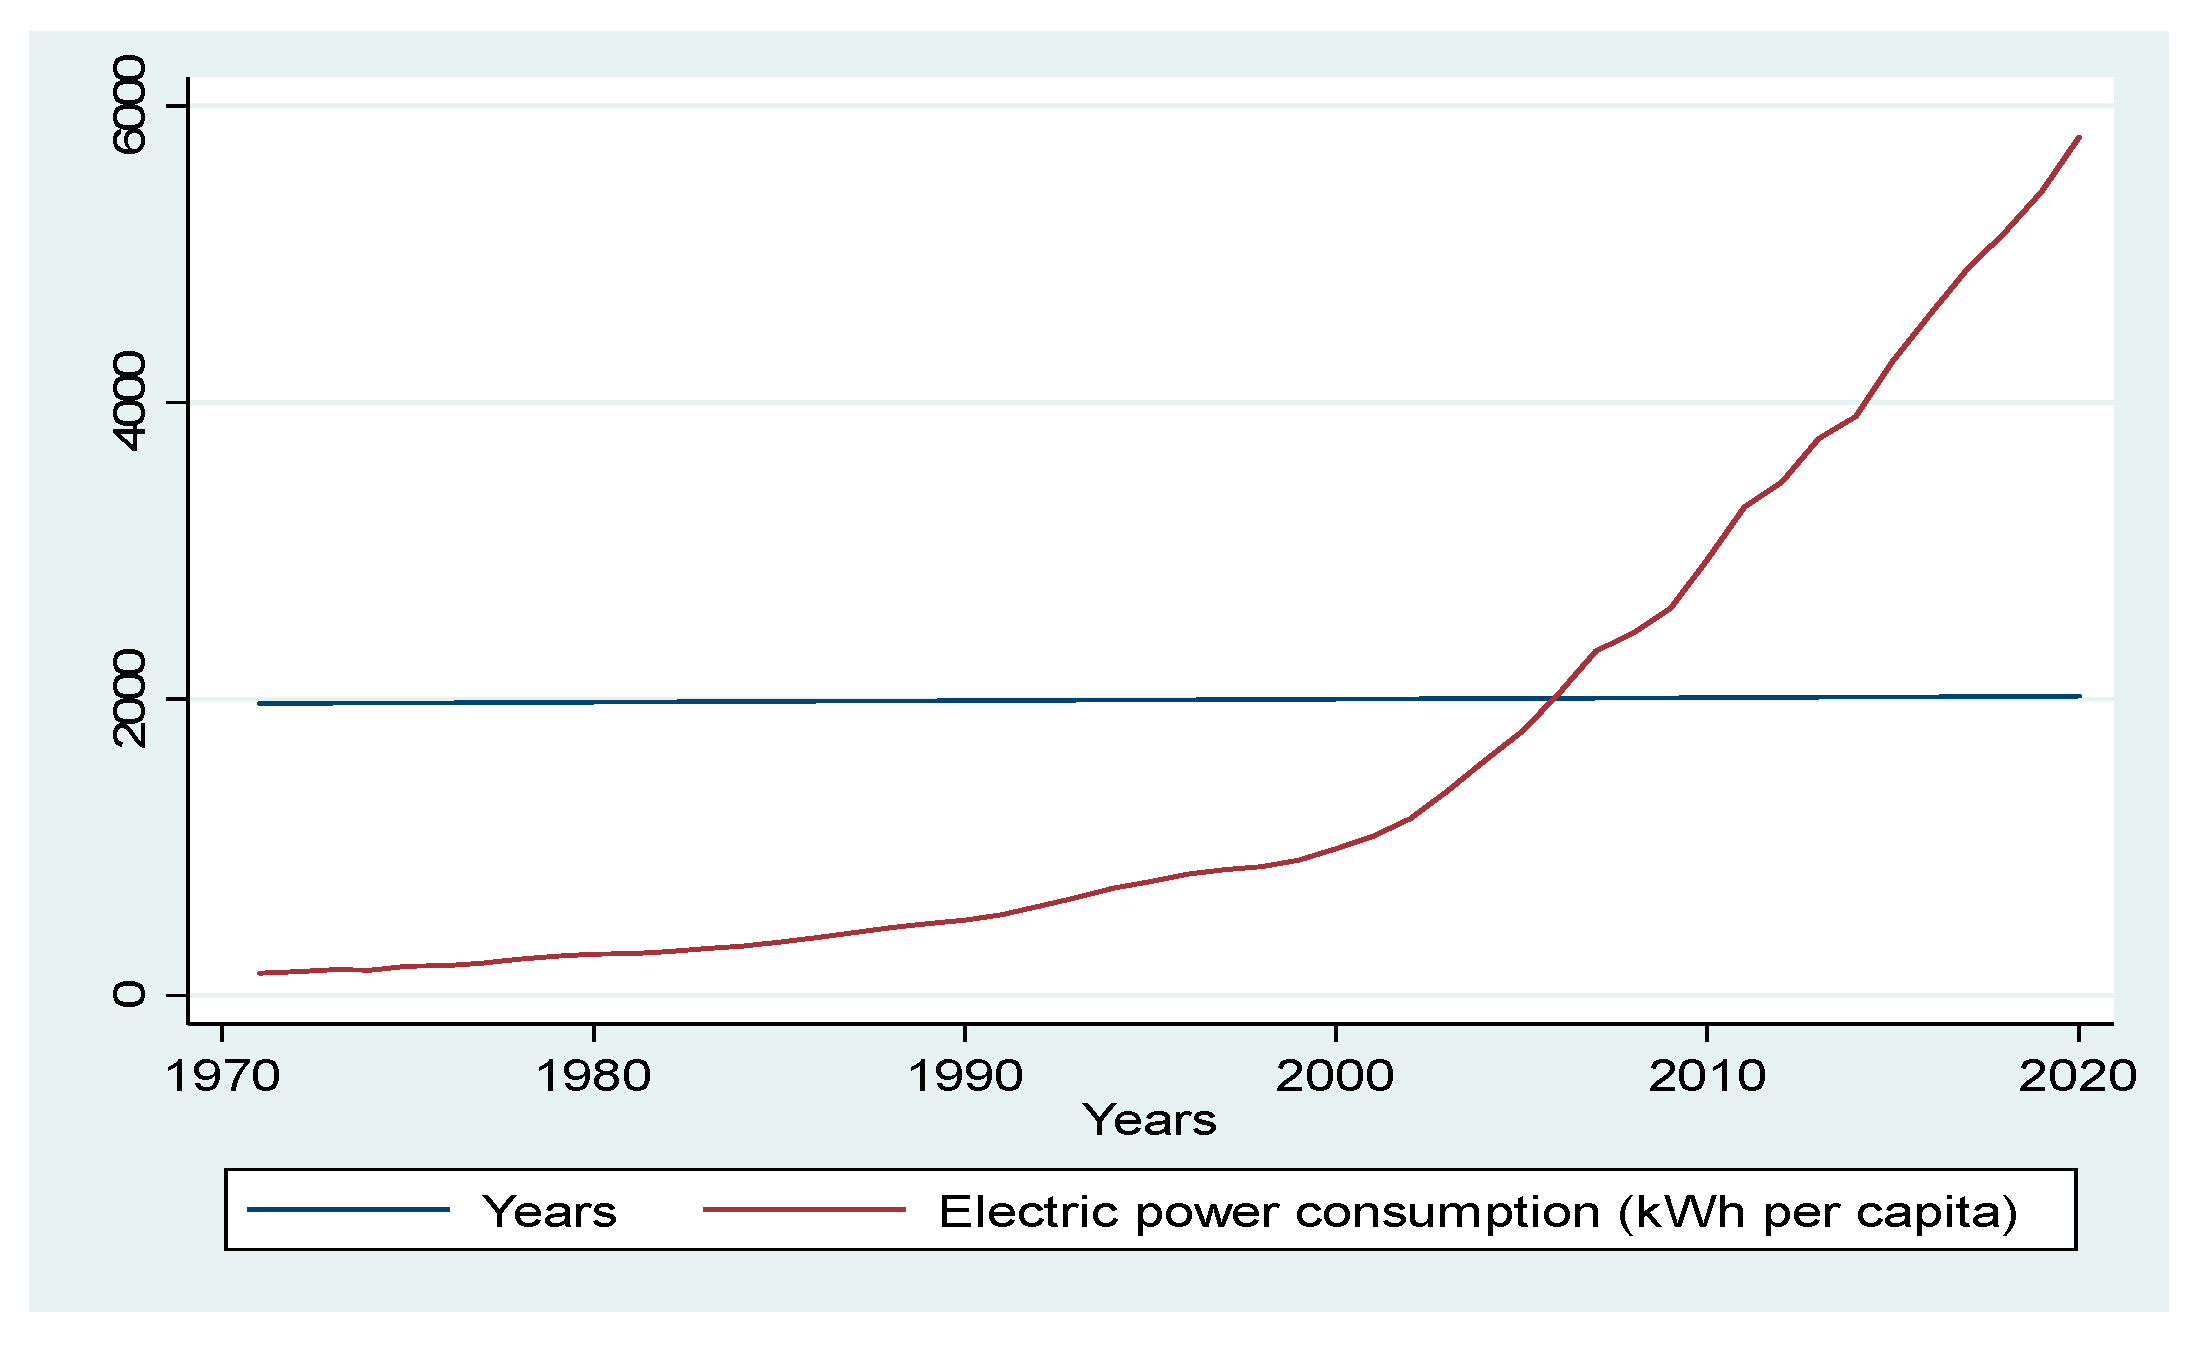
5.2.1. The Trends in Consumption of Electricity, Carbon (CO2) Emissions and the Economy of China
5.2.2. The Decoupling Analysis (DA) of Consumption of Electricity and the Economy of China
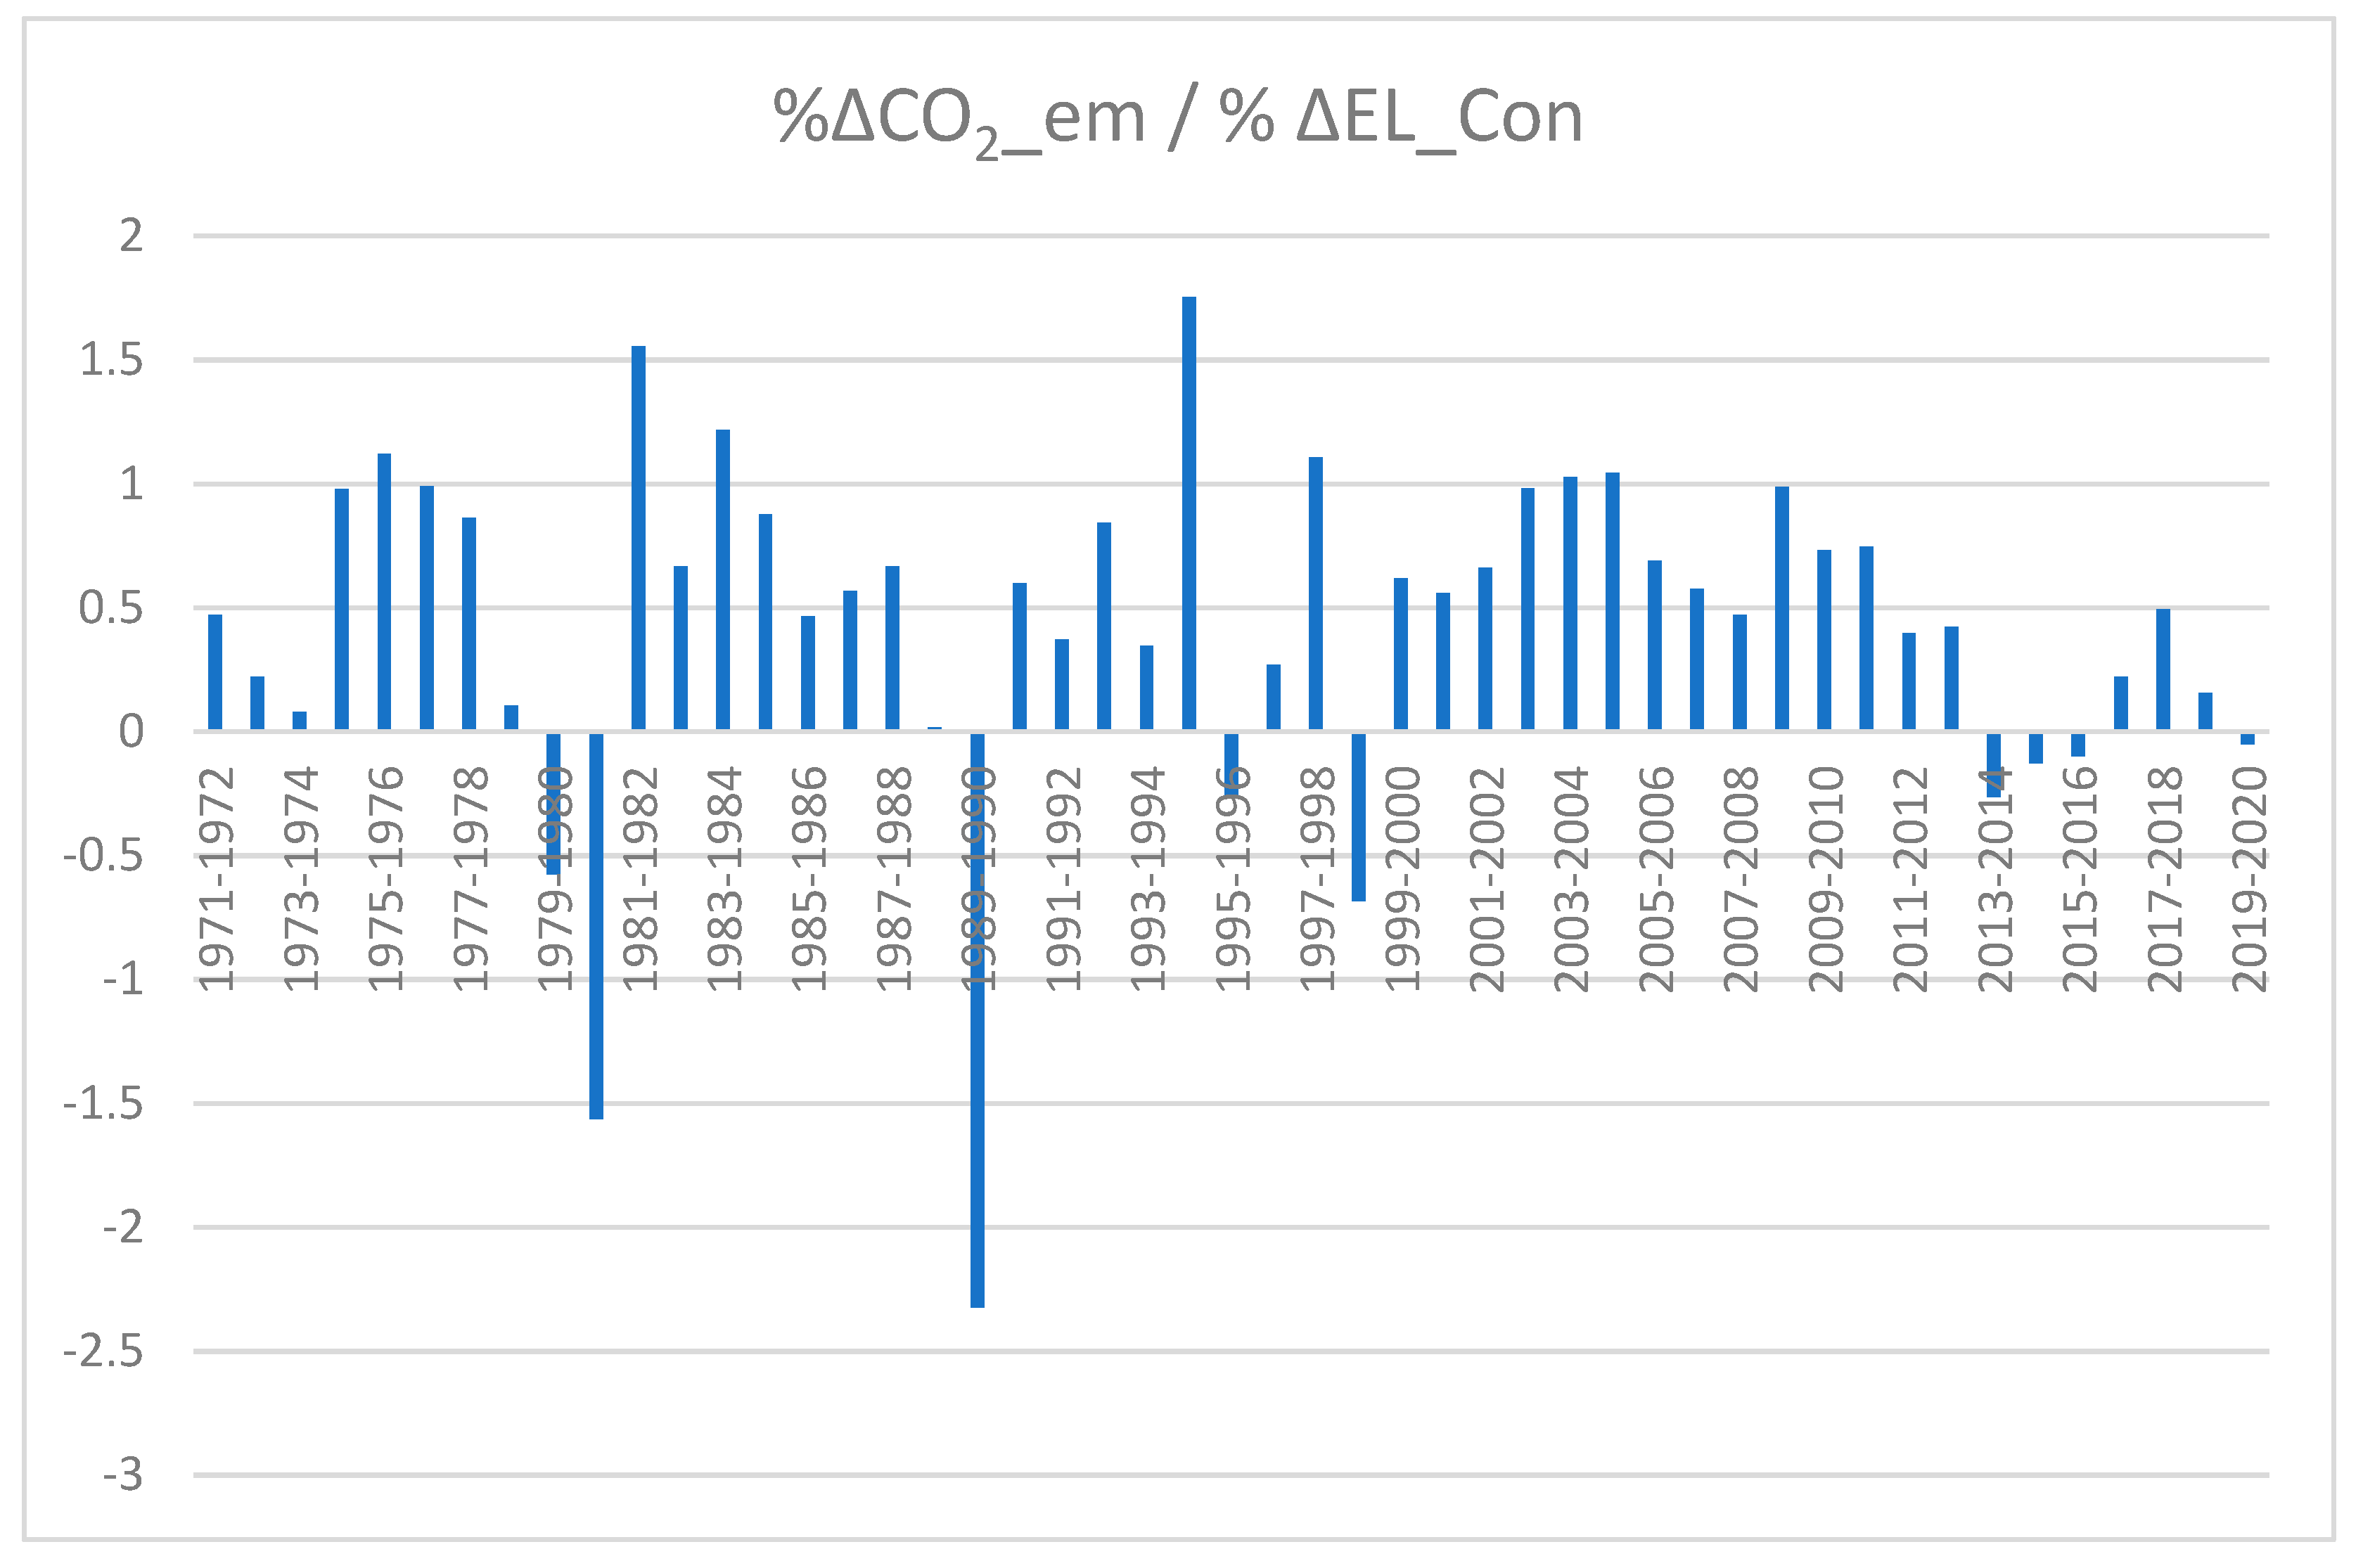
5.2.3. The Decoupling Analysis (DA) of CO2 emissions and Consumption of Electricity
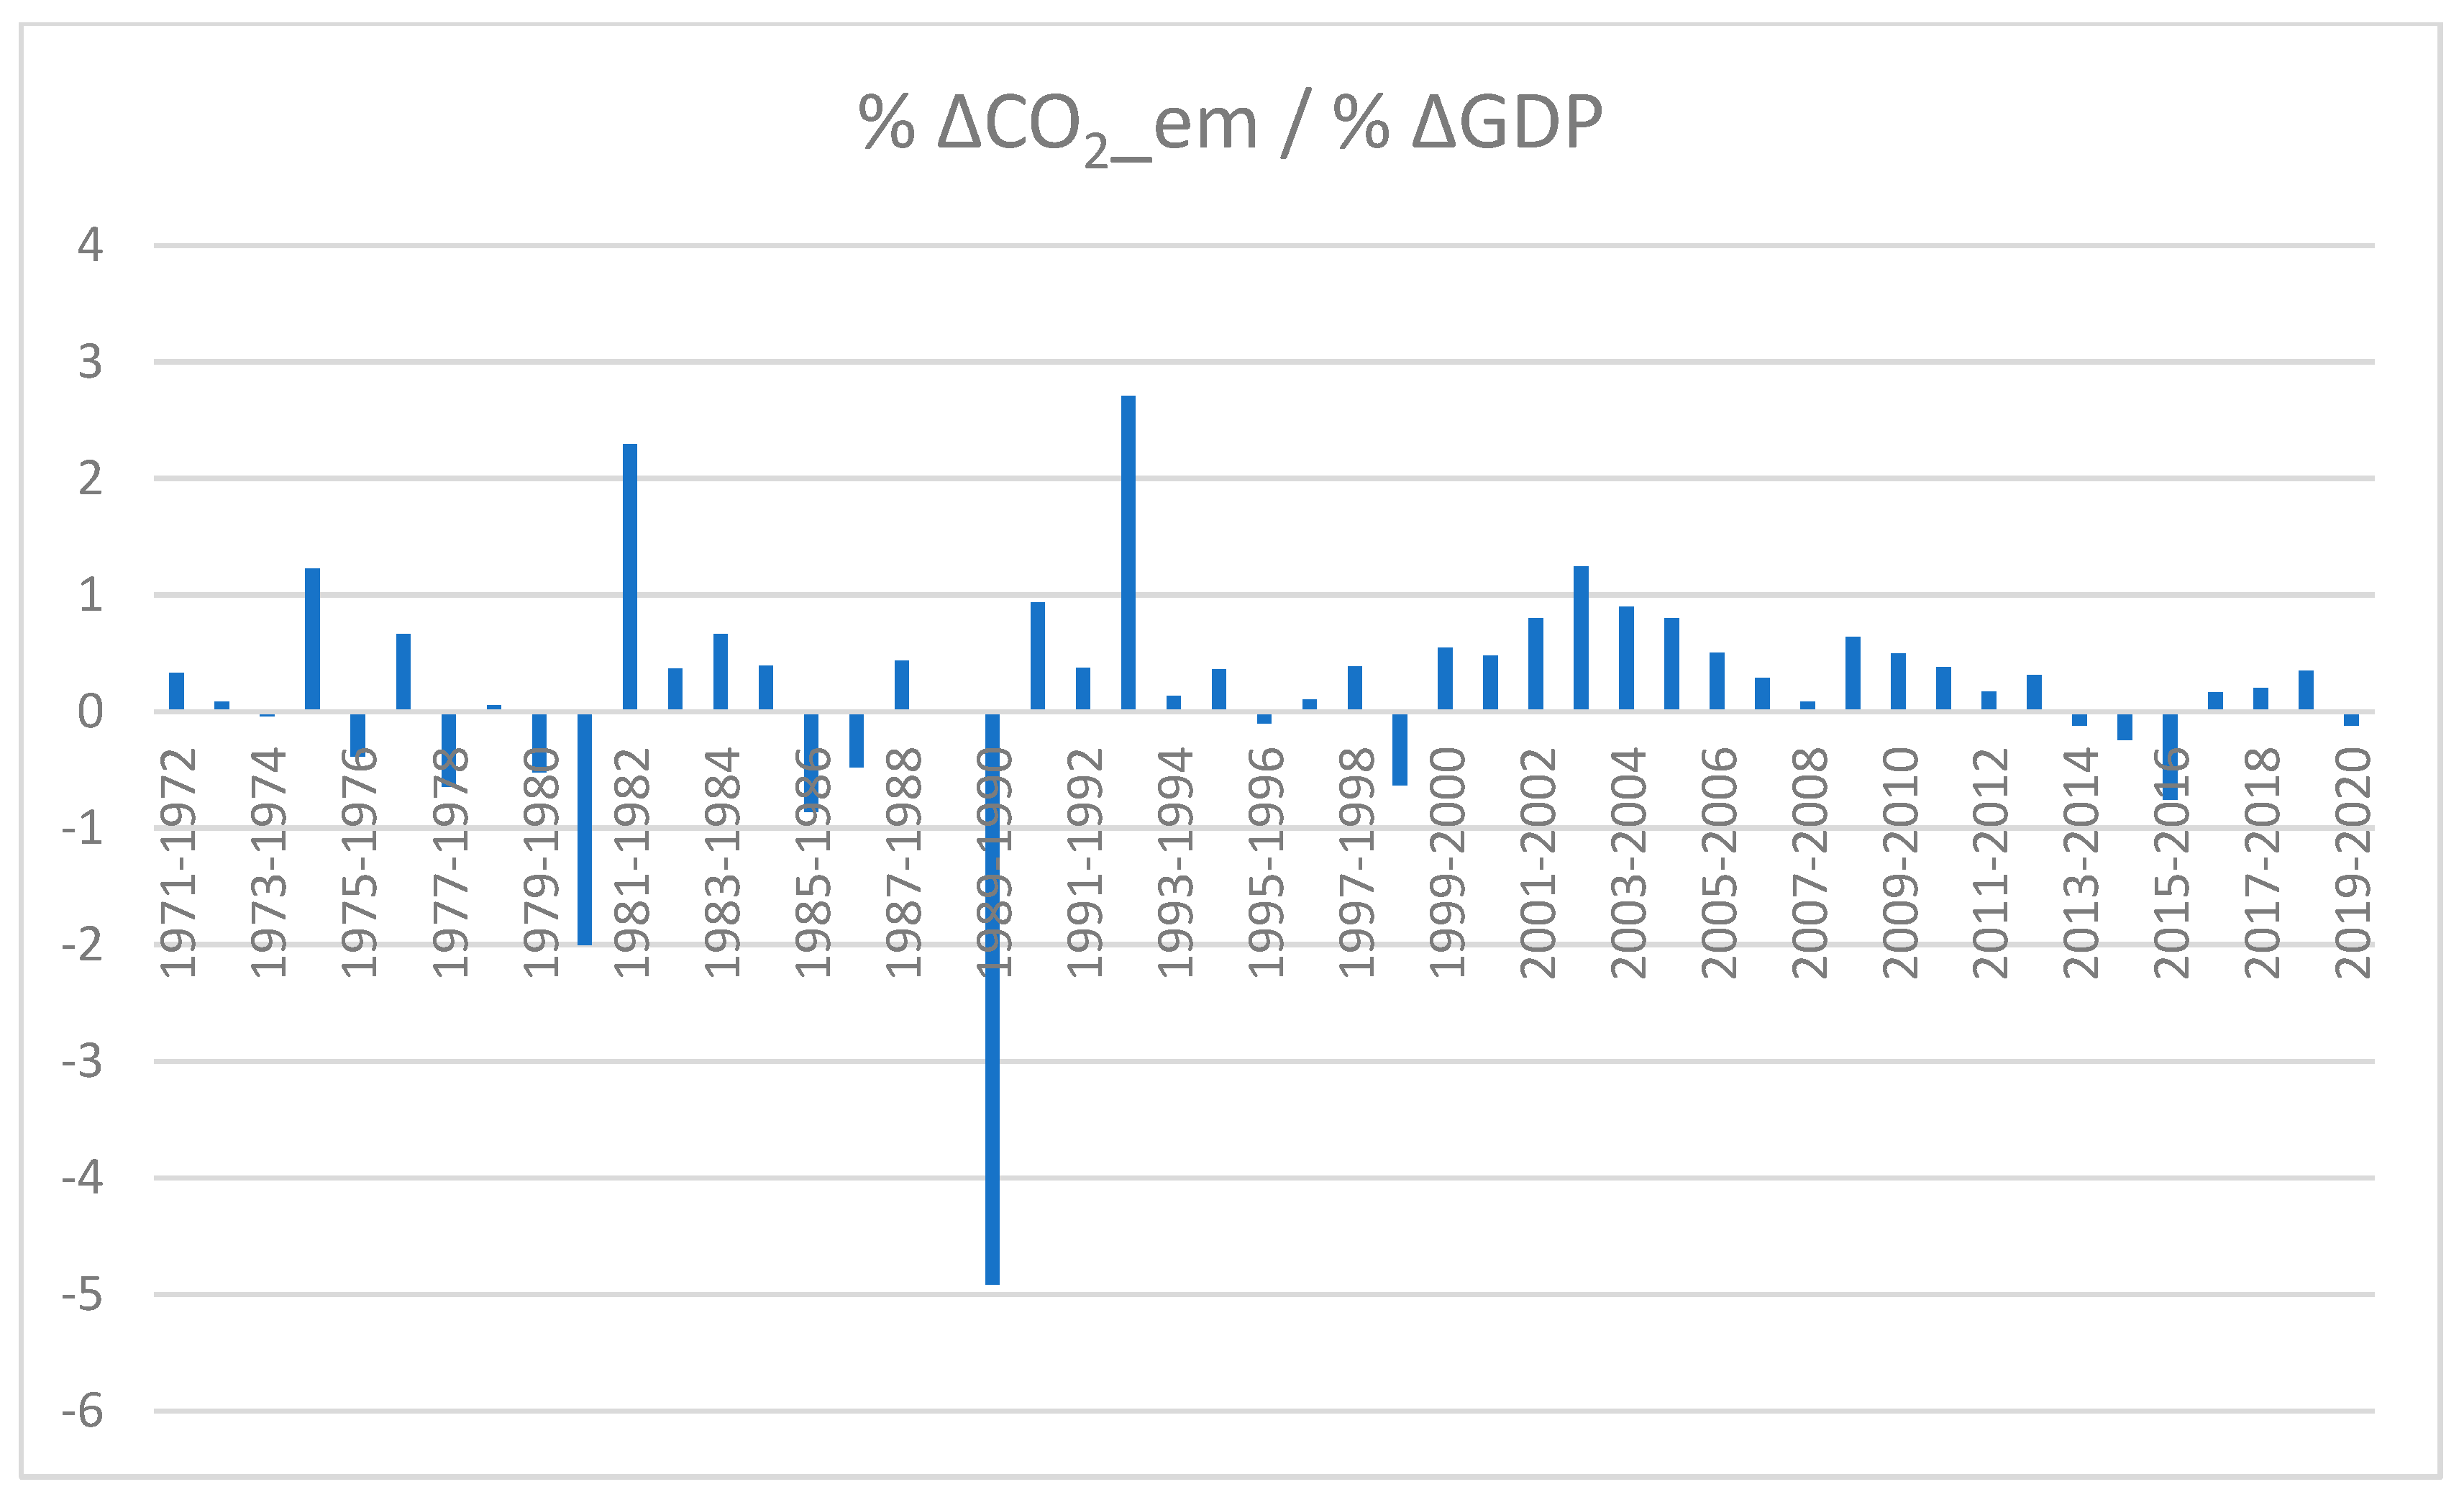
5.2.4. The Decoupling Analysis (DA) of CO2 Emissions and the Economy of China
5.3. Additional Analysis: Granger Causality Test
5.4. Discussion
6. Conclusions
- The findings of the study show weak and expansive negative decoupling for electricity consumption and economic growth. It indicates that weak decoupling happens when there is faster economic growth, and consumption of electricity also grows at a faster pace with the expansive negative decoupling.
- The findings show weak and strong decoupling for CO2 emissions and economic growth. These findings illustrate that weak decoupling happens when there is faster economic growth, and CO2 emissions also grows at a faster pace with the strong decoupling.
- Moreover, the findings of the study show weak and strong decoupling for CO2 emissions and electricity consumption decoupling. These results conclude that weak decoupling happens when there is fast growth in consumption of electricity, and CO2 emissions also grow at a faster pace with strong decoupling.
- Additionally, empirical findings show unidirectional causality for CO2 emissions and electricity consumption. The unidirectional causality appears between the growth of economic development and the growth of CO2 emissions. Finally, the relationship between the growth of electricity consumption and the growth of the economy shows unidirectional causality.
7. Policy Implications, Limitations and Recommendations for Future Studies
Author Contributions
Funding
Data Availability Statement
Conflicts of Interest
References
- Chen, G.; Wu, X. Energy overview for globalized world economy: Source, supply chain and sink. Renew. Sustain. Energy Rev. 2017, 69, 735–749. [Google Scholar] [CrossRef]
- Klemeš, J.J.; Van Fan, Y.; Jiang, P. The energy and environmental footprints of COVID-19 fighting measures–PPE, disinfection, supply chains. Energy 2020, 211, 118701. [Google Scholar] [CrossRef] [PubMed]
- Zhang, Y.; Chen, Q.; Chen, B.; Liu, J.; Zheng, H.; Yao, H.; Zhang, C. Identifying hotspots of sectors and supply chain paths for electricity conservation in China. J. Clean. Prod. 2020, 251, 119653. [Google Scholar] [CrossRef]
- Zhang, C.; Zhou, K.; Yang, S.; Shao, Z. On electricity consumption and economic growth in China. Renew. Sustain. Energy Rev. 2017, 76, 353–368. [Google Scholar] [CrossRef]
- Kraft, J.; Kraft, A. Relationship between energy and GNP. J. Energy Finance Dev. 1978, 3, 401–403. [Google Scholar]
- Aqeel, A.; Butt, M.S. The relationship between energy consumption and economic growth in Pakistan. Asia Pac. Dev. J. 2001, 8, 101–110. [Google Scholar]
- Mushtaq, K.; Abbas, F.; Ghafoor, A. Energy Use for Economic Growth: Cointegration and Causality Analysis from the Agriculture Sector of Pakistan. Pak. Dev. Rev. 2007, 46, 1065–1073. [Google Scholar] [CrossRef]
- Shahbaz, M.; Feridun, M. Electricity consumption and economic growth empirical evidence from Pakistan. Qual. Quant. 2011, 46, 1583–1599. [Google Scholar] [CrossRef]
- Tang, C.F.; Shahbaz, M. Sectoral analysis of the causal relationship between electricity consumption and real output in Pakistan. Energy Policy 2013, 60, 885–891. [Google Scholar] [CrossRef]
- Ge, F.; Ye, B.; Xing, S.; Wang, B.; Sun, S. The analysis of the underlying reasons of the inconsistent relationship between economic growth and the consumption of electricity in China e a case study of Anhui province. Energy 2017, 128, 601–608. [Google Scholar] [CrossRef]
- Meng, M.; Niu, D. Annual electricity consumption analysis and forecasting of China based on few observations methods. Energy Convers. Manag. 2011, 52, 953–957. [Google Scholar] [CrossRef]
- Gao, C.; Su, B.; Sun, M.; Zhang, X.; Zhang, Z. Interprovincial transfer of embodied primary energy in China: A complex network approach. Appl. Energy 2018, 215, 792–807. [Google Scholar] [CrossRef]
- Iyke, B.N. Electricity consumption and economic growth in Nigeria: A revisit of the energy-growth debate. Energy Econ. 2015, 51, 166–176. [Google Scholar] [CrossRef]
- Bildirici, M.E. Cement production, environmental pollution, and economic growth: Evidence from China and USA. Clean Technol. Environ. Policy 2019, 21, 783–793. [Google Scholar] [CrossRef]
- Piłatowska, M.; Geise, A.; Włodarczyk, A. The Effect of Renewable and Nuclear Energy Consumption on Decoupling Economic Growth from CO2 Emissions in Spain. Energies 2020, 13, 2124. [Google Scholar] [CrossRef]
- Tapio, P. Towards a theory of decoupling: Degrees of decoupling in the EU and the case of road traffic in Finland between 1970 and 2001. Transp. Policy 2005, 12, 137–151. [Google Scholar] [CrossRef]
- Vehmas, J.; Malaska, P.; Luukkanen, J.; Kaivo-oja, J.; Hietanen, O.; Vinnari, M.; Ilvonen, J. Europe in the Global Battle of Sustainability: Rebound Strikes Back?—Advanced Sustainability Analysis; Publications of the Turku School of Economics and Business Administration, Series Discussion and Working Papers 2003; Turun Kauppakorkeakoulu: Turku, Finland, 2003; Volume 7. [Google Scholar]
- Tapio, P. The Limits to Traffic Volume Growth, The Content and Procedure of Administrative Futures Studies on Finnish Transport CO2 Policy; Acta Futura Fennica 8; Finnish Society for Futures Studies & Finland Futures Research Centre: Turku, Finland, 2002; 148p. [Google Scholar]
- de Bruyn, S.M.; van den Bergh, J.C.J.M.; Opschoor, J.B. Economic growth and emissions: Reconsidering the empirical basis of environmental Kuznets curves. Ecol. Econ. 1998, 25, 161–175. [Google Scholar] [CrossRef]
- Arrow, K.; Bolin, B.; Costanza, R.; Dasgupta, P.; Folke, C.; Holling, C.S.; Jansson, B.-O.; Levin, S.; Maler, K.-G.; Perrings, C.; et al. Economic growth, carrying capacity, and the environment. Ecol. Econ. 1995, 15, 91–95. [Google Scholar] [CrossRef]
- Canas, A.; Ferrao, P.; Conceicao, P. A new environmental Kuznets curve? Relationship between direct material input and income per capita: Evidence from industrialized countries. Ecol. Econ. 2003, 46, 217–229. [Google Scholar] [CrossRef]
- Seppala, T.; Haukioja, T.; Kaivo-oja, J. The EKC Hypothesis does not hold for direct material flows. An environmental Kuznets curve hypothesis tests for direct material flows in 5 industrial countries. Population and Environment. J. Interdiscip. Stud. 2001, 23, 217–238. [Google Scholar]
- Bojnec, Š.; Papler, D. Economic efficiency, energy consumption and sustainable development. J. Bus. Econ. Manag. 2011, 12, 353–374. [Google Scholar] [CrossRef]
- Dagar, V.; Ahmed, F.; Waheed, F.; Bojnec, Š.; Khan, M.K.; Shaikh, S. Testing the Pollution Haven Hypothesis with the Role of Foreign Direct Investments and Total Energy Consumption. Energies 2022, 15, 4046. [Google Scholar] [CrossRef]
- Boamah, K.B.; Du, J.G.; Bediako, I.A.; Boamah, A.J.; Abdul-Rasheed, A.A.; Owusu, S.M. Carbon dioxide emission and economic growth of China-the role of international trade. Environ. Sci. Pollut. Res. 2017, 24, 13049–13067. [Google Scholar] [CrossRef]
- Wang, Q.; Zhao, M.; Li, R.; Su, M. Decomposition and decoupling analysis of carbon emissions from economic growth: A comparative study of China and the United States. J. Clean. Prod. 2018, 197, 178–184. [Google Scholar] [CrossRef]
- Wu, Y.; Zhu, Q.; Zhu, B. Decoupling analysis of world economic growth and CO2 emissions: A study comparing developed and developing countries. J. Clean. Prod. 2018, 190, 94–103. [Google Scholar] [CrossRef]
- Wang, Q.; Zhang, F. Does increasing investment in research and development promote economic growth decoupling from carbon emission growth? An empirical analysis of BRICS countries. J. Clean. Prod. 2019, 252, 119853. [Google Scholar] [CrossRef]
- Gao, C.; Ge, H.; Lu, Y.; Wang, W.; Zhang, Y. Decoupling of provincial energy-related CO2 emissions from economic growth in China and its convergence from 1995 to 2017. J. Clean. Prod. 2021, 297, 126627. [Google Scholar] [CrossRef]
- Wang, Q.; Zhang, F. The effects of trade openness on decoupling carbon emissions from economic growth—Evidence from 182 countries. J. Clean. Prod. 2020, 279, 123838. [Google Scholar] [CrossRef]
- Shan, Y.; Fang, S.; Cai, B.; Zhou, Y.; Li, D.; Feng, K.; Hubacek, K. Chinese cities exhibit varying degrees of decoupling of economic growth and CO2 emissions between 2005 and 2015. One Earth 2021, 4, 124–134. [Google Scholar] [CrossRef]
- Rao, G.; Liao, J.; Zhu, Y.; Guo, L. Decoupling of economic growth from CO2 emissions in Yangtze River Economic Belt sectors: A sectoral correlation effects perspective. Appl. Energy 2022, 307, 118223. [Google Scholar] [CrossRef]
- Zhao, X.; Jiang, M.; Zhang, W. Decoupling between Economic Development and Carbon Emissions and Its Driving Factors: Evidence from China. Int. J. Environ. Res. Public Heal. 2022, 19, 2893. [Google Scholar] [CrossRef] [PubMed]
- Sun, D.; Cai, S.; Yuan, X.; Zhao, C.; Gu, J.; Chen, Z.; Sun, H. Decomposition and decoupling analysis of carbon emissions from agricultural economic growth in China’s Yangtze River economic belt. Environ. Geochem. Health 2022, 44, 2987–3006. [Google Scholar] [CrossRef] [PubMed]
- Li, R.; Chen, Z.; Xiang, J. A region-scale decoupling effort analysis of carbon dioxide emissions from the perspective of electric power industry: A case study of China. Environ. Dev. Sustain. 2022, 1–26. [Google Scholar] [CrossRef]
- Liu, F.; Kang, Y.; Guo, K. Is electricity consumption of Chinese counties decoupled from carbon emissions? A study based on Tapio decoupling index. Energy 2022, 251, 123879. [Google Scholar] [CrossRef]
- WDI. World Development Indicators; World Bank: Washington, DC, USA, 2022. [Google Scholar]
- Granger, C.W.J. Investigating Causal Relations by Econometric Models and Cross-spectral Methods. Econometrica 1969, 37, 424–438. [Google Scholar] [CrossRef]
- Wang, W.; Mu, H.; Kang, X.; Song, R.; Ning, Y. Changes in industrial electricity consumption in china from 1998 to 2007. Energy Policy 2010, 38, 3684–3690. [Google Scholar] [CrossRef]
- Zhang, C.; Su, B.; Zhou, K.; Yang, S. Analysis of electricity consumption in China (1990–2016) using index decomposition and decoupling approach. J. Clean. Prod. 2018, 209, 224–235. [Google Scholar] [CrossRef]
- Kopidou, D.; Diakoulaki, D. Decomposing industrial CO2 emissions of Southern European countries into production-and consumption-based driving factors. J. Clean. Prod. 2017, 167, 1325–1334. [Google Scholar] [CrossRef]
- Li, Z.; Sun, L.; Geng, Y.; Dong, H.; Ren, J.; Liu, Z.; Tian, X.; Yabar, H.; Higano, Y. Examining industrial structure changes and corresponding carbon emission reduction effect by combining input-output analysis and social network analysis: A comparison study of China and Japan. J. Clean. Prod. 2017, 162, 61–70. [Google Scholar] [CrossRef]
- Karmellos, M.; Kopidou, D.; Diakoulaki, D. A decomposition analysis of the driving factors of CO2 (Carbon dioxide) emissions from the power sector in the European Union countries. Energy 2016, 94, 680–692. [Google Scholar] [CrossRef]
- Sumabat, A.K.; Lopez, N.S.; Yu, K.D.; Hao, H.; Li, R.; Geng, Y.; Chiu, A.S. Decomposition analysis of Philippine CO2 emissions from fuel combustion and electricity generation. Appl. Energy 2016, 164, 795–804. [Google Scholar] [CrossRef]
- Jiang, R.; Li, R. Decomposition and Decoupling Analysis of Life-Cycle Carbon Emission in China’s Building Sector. Sustainability 2017, 9, 793. [Google Scholar] [CrossRef]
- Goh, T.; Ang, B.W.; Xu, X.Y. Quantifying drivers of CO2 emissions from electricity generation–Current practices and future extensions. Appl. Energy 2018, 231, 1191–1204. [Google Scholar] [CrossRef]
- Jamil, M.; Ahmed, F.; Debnath, G.C.; Bojnec, Š. Transition to Renewable Energy Production in the United States: The Role of Monetary, Fiscal, and Trade Policy Uncertainty. Energies 2022, 15, 4527. [Google Scholar] [CrossRef]


| Variable | Notation | Description | Source |
|---|---|---|---|
| Economic Development | GDP_g | GDP per capita (current US dollars) | WDI |
| Electricity Consumption | EL_c | Electric power consumption (kWh per capita) | WDI |
| CO2 Emissions | CO2_em | CO2 emissions (metric tons per capita) | WDI |
| Energy Use | ENE_u | Energy use (kg of oil equivalent per capita) | WDI |
| Population Total | POP_t | Population, total (ten thousand) | WDI |
| Population Urban | POP_u | The population in urban areas (percentage of population in total) | WDI |
| Statistics | CO2_em | EL_c | ENG_u | GDP_g | POP_t | POP_u |
|---|---|---|---|---|---|---|
| Mean | 3.452557 | 1553.395 | 1934.640 | 2318.828 | 1.18 × 10⁹ | 4.27 × 10⁸ |
| Median | 2.515556 | 795.6806 | 868.0965 | 659.5352 | 1.21 × 10⁹ | 3.81 × 10⁸ |
| Maximum | 7.413452 | 5787.219 | 43380.78 | 10434.78 | 1.41 × 10⁹ | 8.67 × 10⁸ |
| Minimum | 1.042240 | 151.9893 | 464.9332 | 118.6546 | 8.41 × 10⁸ | 1.45 × 10⁸ |
| Std.Dev. | 2.262846 | 1652.723 | 6008.991 | 3198.695 | 1.73 × 10⁸ | 2.28 × 10⁸ |
| Skewness | 0.748070 | 1.193946 | 6.758475 | 1.403665 | −0.363526 | 0.440920 |
| Kurtosis | 1.937867 | 3.117083 | 47.13242 | 3.487179 | 1.826624 | 1.885087 |
| Jarque–Bera | 7.013671 | 11.90778 | 4438.288 | 16.91344 | 3.969617 | 4.209737 |
| Probability | 0.029992 | 0.002596 | 0.000000 | 0.000212 | 0.137407 | 0.121862 |
| Variables | 1 | 2 | 3 | 4 | 5 | 6 | 7 |
|---|---|---|---|---|---|---|---|
| 1. GDP_g | 1.0000 | ||||||
| 2. EL_c | 0.9895 *** 0.0000 | 1.0000 | |||||
| 3. CO2_em | 0.9400 *** 0.0000 | 0.9677 *** 0.0000 | 1.0000 | ||||
| 4. EN_u | 0.9775 *** 0.0000 | 0.9957 *** 0.0000 | 0.9851 *** 0.0000 | 1.0000 | |||
| 6. POP_t | 0.7441 *** 0.0000 | 0.8160 *** 0.0000 | 0.8724 *** 0.0000 | 0.8425 *** 0.0000 | 0.7288 *** 0.0000 | 1.0000 | |
| 7. POP_u | 0.9060 *** 0.0000 | 0.9516 *** 0.0000 | 0.9716 *** 0.0000 | 0.9646 *** 0.0000 | 0.8953 *** 0.0000 | 0.9478 *** 0.0000 | 1.0000 |
| Years | % ΔEL_Con | % Δ GDP | % ΔEL_Con/% ΔGDP | States of Decoupling |
|---|---|---|---|---|
| 1971–1972 | 0.078443534 | 0.111491556 | 0.703582735 | Weak Decoupling |
| 1972–1973 | 0.073343095 | 0.191129302 | 0.383735482 | Weak Decoupling |
| 1973–1974 | −0.009664907 | 0.019413789 | −0.497837251 | Strong Decoupling |
| 1974–1975 | 0.142374357 | 0.113661267 | 1.252619836 | Expansive Coupling |
| 1975–1976 | 0.025073636 | −0.072536432 | −0.34566955 | Strong Negative Decoupling |
| 1976–1977 | 0.081491244 | 0.12101948 | 0.67337295 | Weak Decoupling |
| 1977–1978 | 0.11737091 | −0.15654191 | −0.749773083 | Strong Negative Decoupling |
| 1978–1979 | 0.084437257 | 0.17639003 | 0.478696312 | Weak Decoupling |
| 1979–1980 | 0.053297657 | 0.058818266 | 0.906141251 | Expansive Negative Decoupling |
| 1980–1981 | 0.014888924 | 0.011636023 | 1.279554278 | Expansive Coupling |
| 1981–1982 | 0.046813555 | 0.031782606 | 1.47293005 | Expansive Coupling |
| 1982–1983 | 0.059567044 | 0.108672969 | 0.548131194 | Weak Decoupling |
| 1983–1984 | 0.061167648 | 0.112149332 | 0.545412505 | Weak Decoupling |
| 1984–1985 | 0.078476567 | 0.174481221 | 0.449770847 | Weak Decoupling |
| 1985–1986 | 0.078662082 | −0.042555106 | −1.848475761 | Strong Negative Decoupling |
| 1986–1987 | 0.089952017 | −0.106822136 | −0.842072825 | Strong Negative Decoupling |
| 1987–1988 | 0.082622562 | 0.125989801 | 0.655787703 | Weak Decoupling |
| 1988–1989 | 0.055382833 | 0.096439442 | 0.574275749 | Weak Decoupling |
| 1989–1990 | 0.04769791 | 0.022525468 | 2.117510271 | Expansive Decoupling |
| 1990–1991 | 0.075073262 | 0.04799688 | 1.564127977 | Expansive Negative Decoupling |
| 1991–1992 | 0.101538481 | 0.100013005 | 1.015252777 | Expansive Negative Decoupling |
| 1992–1993 | 0.095822669 | 0.029823518 | 3.212990087 | Expansive Decoupling |
| 1993–1994 | 0.097293555 | 0.254650309 | 0.382067297 | Weak Decoupling |
| 1994–1995 | 0.059376213 | 0.287574701 | 0.206472311 | Weak Decoupling |
| 1995–1996 | 0.065950826 | 0.163628283 | 0.403052726 | Weak Decoupling |
| 1996–1997 | 0.038558721 | 0.101958002 | 0.378182386 | Weak Decoupling |
| 1997–1998 | 0.020963625 | 0.059912587 | 0.349903517 | Weak Decoupling |
| 1998–1999 | 0.049787926 | 0.053955631 | 0.922756811 | Expansive Negative Decoupling |
| 1999–2000 | 0.086414765 | 0.098576317 | 0.87662806 | Expansive Negative Decoupling |
| 2000–2001 | 0.084199903 | 0.097705282 | 0.861774317 | Expansive Negative Decoupling |
| 2001–2002 | 0.109894822 | 0.090589024 | 1.213114097 | Expansive Coupling |
| 2002–2003 | 0.154519282 | 0.122014758 | 1.266398299 | Expansive Coupling |
| 2003–2004 | 0.149587857 | 0.170741472 | 0.876107342 | Expansive Negative Decoupling |
| 2004–2005 | 0.123892399 | 0.16222901 | 0.763688312 | Weak Decoupling |
| 2005–2006 | 0.144027805 | 0.197221449 | 0.730284691 | Weak Decoupling |
| 2006–2007 | 0.140711155 | 0.283313781 | 0.496661881 | Weak Decoupling |
| 2007–2008 | 0.051782493 | 0.287432496 | 0.180155318 | Weak Decoupling |
| 2008–2009 | 0.067891459 | 0.104930758 | 0.647011999 | Weak Decoupling |
| 2009–2010 | 0.126751706 | 0.1874145 | 0.676317501 | Weak Decoupling |
| 2010–2011 | 0.119648089 | 0.233800679 | 0.511752531 | Weak Decoupling |
| 2011–2012 | 0.05165224 | 0.122233691 | 0.422569586 | Weak Decoupling |
| 2012–2013 | 0.084005744 | 0.114230651 | 0.735404579 | Weak Decoupling |
| 2013–2014 | 0.039426461 | 0.087713451 | 0.449491612 | Weak Decoupling |
| 2014–2015 | 0.096095822 | 0.049804744 | 1.929451163 | Expansive Coupling |
| 2015–2016 | 0.074043751 | 0.009721524 | 7.616475579 | Expansive Decoupling |
| 2016–2017 | 0.065731976 | 0.089274907 | 0.736287256 | Weak Decoupling |
| 2017–2018 | 0.050004064 | 0.123438439 | 0.405093135 | Weak Decoupling |
| 2018–2019 | 0.053465927 | 0.02407753 | 2.220573573 | Recessive Coupling |
| 2019–2020 | 0.067784388 | 0.028681157 | 2.363377041 | Recessive Coupling |
| Average | 0.0777 | 0.099629 | 0.860635 |
| Years | % ΔCO2_em | % ΔEL_Con | %ΔCO2_em/% ΔEL_Con | States of Decoupling |
|---|---|---|---|---|
| 1971–1972 | 0.036879175 | 0.078443534 | 0.470136583 | Weak Decoupling |
| 1972–1973 | 0.01621119 | 0.073343095 | 0.221032266 | Weak Decoupling |
| 1973–1974 | −0.000754493 | −0.009664907 | 0.078065187 | Recessive Coupling |
| 1974–1975 | 0.139203174 | 0.142374357 | 0.977726442 | Expansive Negative Decoupling |
| 1975–1976 | 0.02812444 | 0.025073636 | 1.121673803 | Expansive Coupling |
| 1976–1977 | 0.0805735 | 0.081491244 | 0.988738125 | Expansive Coupling |
| 1977–1978 | 0.10106126 | 0.11737091 | 0.8610418 | Weak Decoupling |
| 1978–1979 | 0.00881113 | 0.084437257 | 0.104351205 | Weak Decoupling |
| 1979–1980 | −0.030741631 | 0.053297657 | −0.576791423 | Strong Decoupling |
| 1980–1981 | −0.02328635 | 0.014888924 | −1.564004961 | Strong Decoupling |
| 1981–1982 | 0.072792078 | 0.046813555 | 1.554935911 | Expansive Coupling |
| 1982–1983 | 0.03977446 | 0.059567044 | 0.667725923 | Weak Decoupling |
| 1983–1984 | 0.074516873 | 0.061167648 | 1.218239962 | Expansive Coupling |
| 1984–1985 | 0.068900491 | 0.078476567 | 0.877975354 | Weak Decoupling |
| 1985–1986 | 0.036545945 | 0.078662082 | 0.464594171 | Weak Decoupling |
| 1986–1987 | 0.051033662 | 0.089952017 | 0.567343159 | Weak Decoupling |
| 1987–1988 | 0.055187376 | 0.082622562 | 0.667945586 | Weak Decoupling |
| 1988–1989 | 0.001010126 | 0.055382833 | 0.018238978 | Weak Decoupling |
| 1989–1990 | −0.11078807 | 0.04769791 | −2.322702814 | Strong Decoupling |
| 1990–1991 | 0.044921901 | 0.075073262 | 0.59837417 | Weak Decoupling |
| 1991–1992 | 0.037588204 | 0.101538481 | 0.370186784 | Weak Decoupling |
| 1992–1993 | 0.080694359 | 0.095822669 | 0.84212181 | Weak Decoupling |
| 1993–1994 | 0.033783088 | 0.097293555 | 0.347228422 | Weak Decoupling |
| 1994–1995 | 0.104068176 | 0.059376213 | 1.752691369 | Expansive Coupling |
| 1995–1996 | −0.016839125 | 0.065950826 | −0.255328498 | Strong Decoupling |
| 1996–1997 | 0.010412521 | 0.038558721 | 0.270043227 | Weak Decoupling |
| 1997–1998 | 0.023206335 | 0.020963625 | 1.106981052 | Expansive Coupling |
| 1998–1999 | −0.03405495 | 0.049787926 | −0.684000173 | Strong Decoupling |
| 1999–2000 | 0.053551239 | 0.086414765 | 0.61970011 | Weak Decoupling |
| 2000–2001 | 0.046988923 | 0.084199903 | 0.558063859 | Weak Decoupling |
| 2001–2002 | 0.072630465 | 0.109894822 | 0.660908895 | Weak Decoupling |
| 2002–2003 | 0.151658787 | 0.154519282 | 0.981487779 | Expansive Negative Decoupling |
| 2003–2004 | 0.15367184 | 0.149587857 | 1.027301563 | Expansive Negative Decoupling |
| 2004–2005 | 0.129478476 | 0.123892399 | 1.045088138 | Expansive Negative Decoupling |
| 2005–2006 | 0.099151752 | 0.144027805 | 0.688420907 | Weak Decoupling |
| 2006–2007 | 0.080830995 | 0.140711155 | 0.574446249 | Weak Decoupling |
| 2007–2008 | 0.024330694 | 0.051782493 | 0.469863317 | Weak Decoupling |
| 2008–2009 | 0.066966099 | 0.067891459 | 0.98637 | Expansive Negative Decoupling |
| 2009–2010 | 0.092629812 | 0.126751706 | 0.730797359 | Weak Decoupling |
| 2010–2011 | 0.089382011 | 0.119648089 | 0.747040853 | Weak Decoupling |
| 2011–2012 | 0.020533047 | 0.05165224 | 0.397524813 | Weak Decoupling |
| 2012–2013 | 0.035403017 | 0.084005744 | 0.421435668 | Weak Decoupling |
| 2013–2014 | −0.010457644 | 0.039426461 | −0.265244302 | Strong Decoupling |
| 2014–2015 | −0.012279385 | 0.096095822 | −0.12778272 | Strong Decoupling |
| 2015–2016 | −0.007344557 | 0.074043751 | −0.099192127 | Strong Decoupling |
| 2016–2017 | 0.014571688 | 0.065731976 | 0.2216834 | Weak Decoupling |
| 2017–2018 | 0.024713029 | 0.050004064 | 0.494220409 | Weak Decoupling |
| 2018–2019 | 0.00832254 | 0.053465927 | 0.15566063 | Weak Decoupling |
| 2019–2020 | −0.003539735 | 0.067784388 | −0.052220503 | Strong Decoupling |
| Average | 0.042041 | 0.0777 | 0.428166 |
| Years | % ΔCO2_em | % Δ GDP | % ΔCO2_em/% ΔGDP | States of Decoupling |
|---|---|---|---|---|
| 1971–1972 | 0.036879175 | 0.111491556 | 0.330779982 | Weak Decoupling |
| 1972–1973 | 0.01621119 | 0.191129302 | 0.084817923 | Weak Decoupling |
| 1973–1974 | −0.000754493 | 0.019413789 | −0.038863758 | Strong Decoupling |
| 1974–1975 | 0.139203174 | 0.113661267 | 1.224719536 | Expansive Negative Decoupling |
| 1975–1976 | 0.02812444 | −0.072536432 | −0.387728479 | Strong Negative Decoupling |
| 1976–1977 | 0.0805735 | 0.12101948 | 0.665789508 | Weak Decoupling |
| 1977–1978 | 0.10106126 | −0.15654191 | −0.645585965 | Strong Negative Decoupling |
| 1978–1979 | 0.00881113 | 0.17639003 | 0.049952537 | Weak Decoupling |
| 1979–1980 | −0.030741631 | 0.058818266 | −0.522654502 | Strong Decoupling |
| 1980–1981 | −0.02328635 | 0.011636023 | −2.001229238 | Strong Decoupling |
| 1981–1982 | 0.072792078 | 0.031782606 | 2.290311828 | Recessive Coupling |
| 1982–1983 | 0.03977446 | 0.108672969 | 0.366001408 | Weak Decoupling |
| 1983–1984 | 0.074516873 | 0.112149332 | 0.66444331 | Weak Decoupling |
| 1984–1985 | 0.068900491 | 0.174481221 | 0.394887718 | Weak Decoupling |
| 1985–1986 | 0.036545945 | −0.042555106 | −0.858791064 | Strong Negative Decoupling |
| 1986–1987 | 0.051033662 | −0.106822136 | −0.477744256 | Strong Negative Decoupling |
| 1987–1988 | 0.055187376 | 0.125989801 | 0.438030501 | Weak Decoupling |
| 1988–1989 | 0.001010126 | 0.096439442 | 0.010474203 | Weak Decoupling |
| 1989–1990 | −0.11078807 | 0.022525468 | −4.918347065 | Strong Decoupling |
| 1990–1991 | 0.044921901 | 0.04799688 | 0.935933779 | Recessive Coupling |
| 1991–1992 | 0.037588204 | 0.100013005 | 0.37583316 | Weak Decoupling |
| 1992–1993 | 0.080694359 | 0.029823518 | 2.705729029 | Recessive Coupling |
| 1993–1994 | 0.033783088 | 0.254650309 | 0.132664625 | Weak Decoupling |
| 1994–1995 | 0.104068176 | 0.287574701 | 0.361882237 | Weak Decoupling |
| 1995–1996 | −0.016839125 | 0.163628283 | −0.102910847 | Strong Decoupling |
| 1996–1997 | 0.010412521 | 0.101958002 | 0.102125592 | Weak Decoupling |
| 1997–1998 | 0.023206335 | 0.059912587 | 0.387336563 | Weak Decoupling |
| 1998–1999 | −0.03405495 | 0.053955631 | −0.631165818 | Strong Decoupling |
| 1999–2000 | 0.053551239 | 0.098576317 | 0.543246505 | Weak Decoupling |
| 2000–2001 | 0.046988923 | 0.097705282 | 0.480925101 | Weak Decoupling |
| 2001–2002 | 0.072630465 | 0.090589024 | 0.801757898 | Weak Decoupling |
| 2002–2003 | 0.151658787 | 0.122014758 | 1.242954454 | Expansive Negative Decoupling |
| 2003–2004 | 0.15367184 | 0.170741472 | 0.900026442 | Expansive Negative Decoupling |
| 2004–2005 | 0.129478476 | 0.16222901 | 0.798121596 | Weak Decoupling |
| 2005–2006 | 0.099151752 | 0.197221449 | 0.50274325 | Weak Decoupling |
| 2006–2007 | 0.080830995 | 0.283313781 | 0.285305554 | Weak Decoupling |
| 2007–2008 | 0.024330694 | 0.287432496 | 0.084648375 | Weak Decoupling |
| 2008–2009 | 0.066966099 | 0.104930758 | 0.638193226 | Weak Decoupling |
| 2009–2010 | 0.092629812 | 0.1874145 | 0.494251043 | Weak Decoupling |
| 2010–2011 | 0.089382011 | 0.233800679 | 0.382300047 | Weak Decoupling |
| 2011–2012 | 0.020533047 | 0.122233691 | 0.167981896 | Weak Decoupling |
| 2012–2013 | 0.035403017 | 0.114230651 | 0.30992572 | Weak Decoupling |
| 2013–2014 | −0.010457644 | 0.087713451 | −0.119225089 | Strong Decoupling |
| 2014–2015 | −0.012279385 | 0.049804744 | −0.246550517 | Strong Decoupling |
| 2015–2016 | −0.007344557 | 0.009721524 | −0.755494411 | Strong Decoupling |
| 2016–2017 | 0.014571688 | 0.089274907 | 0.163222662 | Weak Decoupling |
| 2017–2018 | 0.024713029 | 0.123438439 | 0.200205295 | Weak Decoupling |
| 2018–2019 | 0.00832254 | 0.02407753 | 0.345655881 | Weak Decoupling |
| 2019–2020 | −0.003539735 | 0.028681157 | −0.123416738 | Strong Decoupling |
| Average | 0.042041 | 0.099629 | 0.163948 |
| Null Hypothesis | Prob: | F-Stat: | Obs. |
|---|---|---|---|
| % Δ EL_c does not Granger Cause %ΔCO2_em %ΔCO2_em does not Granger Cause %ΔEL_c | 0.4998 * 0.0001 | 0.85505 2.64803 | 48 |
| %ΔGDP_g does not Granger Cause %ΔCO2_em %ΔCO2_em does not Granger Cause %ΔGDP_g | 0.0022 * 4.0 × 10−8 | 3.2480 7.66489 | 48 |
| %ΔGDP_ does not Granger Cause %ΔEL-c %ΔEL_c does not Granger Cause %ΔGDP_g | 0.0157 * 0.0001 | 4.57900 11.5548 | 48 |
| Variables | ADF-Test | PP-Test | ||
|---|---|---|---|---|
| I(0) | I(1) | I(0) | I(1) | |
| %ΔCO2_em | −0.575134 (0.86657) | −3.326939 ** (0.0190) | −0.575134 (0.8665) | −3.328565 ** (0.0189) |
| %ΔEL_c | −0.833895 (0.8004) | −3.035079 ** (0.0387) | −0.637644 (0.8524) | −3.035079 ** (0.0387) |
| %ΔGDP_g | −1.992755 (0.2890) | −6.560591 * (0.0000) | −1.992755 (0.2890) | −6.447658 * (0.0000) |
| Null Hypothesis | (AIC)-Lag Length | |||||
|---|---|---|---|---|---|---|
| L (0) | L(1) | L (2) | L(4) | L (5) | L (6) | |
| CO2_em => GDP_g GDP_g => CO2_em | −2.549832 * | −2.629116 | −2.080886 | −1.485861 | −1.180183 | −0.978388 |
| CO2_em => EL_c EL_c => CO2_em | −4.488560 * | −4.399347 | −4.228746 | −3.916094 | −2.929532 | −2.753448 |
| EL_c => GDP_g GDP_g => EL_c | −2.668898 | −2.703904 * | −2.593575 | −2.495889 | −2.348120 | −2.305389 |
Disclaimer/Publisher’s Note: The statements, opinions and data contained in all publications are solely those of the individual author(s) and contributor(s) and not of MDPI and/or the editor(s). MDPI and/or the editor(s) disclaim responsibility for any injury to people or property resulting from any ideas, methods, instructions or products referred to in the content. |
© 2023 by the authors. Licensee MDPI, Basel, Switzerland. This article is an open access article distributed under the terms and conditions of the Creative Commons Attribution (CC BY) license (https://creativecommons.org/licenses/by/4.0/).
Share and Cite
Laghari, F.; Ahmed, F.; Li, H.-X.; Bojnec, Š. Decoupling of Electricity Consumption Efficiency, Environmental Degradation and Economic Growth: An Empirical Analysis. Energies 2023, 16, 2620. https://doi.org/10.3390/en16062620
Laghari F, Ahmed F, Li H-X, Bojnec Š. Decoupling of Electricity Consumption Efficiency, Environmental Degradation and Economic Growth: An Empirical Analysis. Energies. 2023; 16(6):2620. https://doi.org/10.3390/en16062620
Chicago/Turabian StyleLaghari, Fahmida, Farhan Ahmed, Hai-Xia Li, and Štefan Bojnec. 2023. "Decoupling of Electricity Consumption Efficiency, Environmental Degradation and Economic Growth: An Empirical Analysis" Energies 16, no. 6: 2620. https://doi.org/10.3390/en16062620
APA StyleLaghari, F., Ahmed, F., Li, H.-X., & Bojnec, Š. (2023). Decoupling of Electricity Consumption Efficiency, Environmental Degradation and Economic Growth: An Empirical Analysis. Energies, 16(6), 2620. https://doi.org/10.3390/en16062620