Abstract
The depletion of fossil fuels and the emission of greenhouse gases have increased the demand for new and sustainable energy sources, leading to growing interest in using fast-growing filamentous fungi as a source of bioenergy. This study aimed to optimize the production of exopolysaccharides (EPS) and mycelial biomass (MB) from the native medicinal mushroom, Lignosus rhinocerus, through submerged liquid fermentation. Using response surface methodology (RSM), it was found that the glucose concentration and speed of agitation significantly influenced the production of MB and EPS (p < 0.05), while the initial pH medium had an insignificant effect. The validated optimized parameters of 50.0 g/L glucose, initial pH 4.0, and 128 rpm for speed of agitation were tested in 500 mL shake flasks, 5 L, and 13 L stirred-tank (STR) bioreactors. The production of MB and EPS increased significantly by ~1.2-fold in the 5 L STR and further increased to ~1.7-fold (MB) and ~2.4-fold (EPS) in the 13 L STR bioreactor compared to the shake flask. The lipid content of MB was also determined, with a result of 2.07% w/w using the Soxhlet extraction method. To conclude, this study emphasizes the ability of L. rhinocerus as a new source of bioenergy through large-scale production, with optimized parameters serving as a reference for future research and practical applications.
1. Introduction
The world’s population surpassed 8 billion people and by 2050, this number is expected to rise by more than 25% [1]. It is predicted that this increase, along with rising energy consumption, will result in an approximately 50% increase from 2018 levels [2]. Notably, the use of fossil fuels for energy has significantly increased greenhouse gas emissions (GHGs), causing dangerous changes to the Earth’s climate. From 2000 to 2021, the energy sector accounted for over 70% of total global GHG emissions and is expected to increase by 0.7% annually [3,4]. In 2021, the Asia-Pacific region, which makes up 60% of the world’s population, accounted for more than 45% of the world’s energy consumption and over half of the CO2 emissions from the world’s energy system [5,6]. To address this challenge, governments aim to achieve net-zero emissions by 2050, balancing unavoidable GHG emissions with their removal through reforestation and carbon capture and storage technology. This aligns with the United Nations’ Sustainable Development Goals and the goal of achieving net CO2 emissions [7]. Finding alternative energy sources to replace fossil fuels and producing novel bioenergy feedstocks is crucial in this effort. Microbiology and biotechnology are promising areas in the search for alternative, renewable, and carbon-free energy sources.
Filamentous fungi, such as the tiger milk medicinal mushroom Lignosus rhinocerus, are promising candidates in this field due to their fast growth and established use in biotechnology [8]. This rare mushroom is native to Southeast Asian countries, including Malaysia, Thailand, and Indonesia, and has traditionally been used by indigenous people to treat ailments and prevent diseases [9]. Extracts from the mycelial biomass of L. rhinocerus, known as exopolysaccharides, have pharmacologic properties such as anti-inflammatory, immune boosting, antimicrobial, anti-asthmatic, antiviral, anti-obesity, and antioxidant activities [10,11,12,13]. While the cultivation of L. rhinocerus fruiting bodies takes up to 12 months, it can be shortened to less than two weeks by producing its mycelium through submerged liquid fermentation with an adequate medium, reducing the time to manufacture bioactive compounds and the risk of contamination [14]. Additionally, L. rhinocerus’ β-D-glucan, a bioactive component, is typically extracted for therapeutic purposes, but the mushroom can also be utilized as a dependable supply of biomass and polysaccharides in various industries, including bioenergy [11,15].
Lipids are also one of the main components in cytoplasmic reserves in fungal cells [16]. According to Tang et al. [17], the content of lipids in mycelial biomass is greater than that of fruiting bodies. This scenario is mainly owing to the fact mycelia are collected during the vegetative phase, which serves as energy storage for fungal development. Recent studies have indicated that lipids from mycelia fungi may serve as a potential new feedstock for bioenergy, owing to their rapid growth [18]. Previous studies have reported that the major lipid elements in L. rhinocerus consist of linoleic acids, oleic acids, methyl linoleate, ethyl stearate, ethyl palmitate, palmitic acids, ethyl linoleate, and methyl oleate [19].
Submerged liquid fermentation (SLF) is the ideal method for producing medicinal mushroom biomass and industrial applications [20]. It has several advantages over solid-state fermentation. SLF in bioreactors provides a controlled and sterile environment that reduces the risk of contamination and guarantees consistent and repeatable results [21]. The improved oxygen transfer system in bioreactors can provide microorganisms with the necessary oxygen for growth and product production [22]. Additionally, bioreactors can be easily scaled up or down to meet changing production needs. The monitoring and control systems of bioreactors enable real-time monitoring and adjustment of parameters such as agitation speed, pH, and temperature optimization, the fermentation process, and enhancing productivity [23]. These factors combined result in increased efficiency and productivity compared to traditional methods. Overall, using bioreactors in fermentation processes provides several advantages, making them a preferred method for many industrial applications.
There have been several studies that explore media optimization in SLF using statistical techniques, such as response surface methodology (RSM) [24,25,26,27]. The optimization conditions for mycelial biomass (MB) and exopolysaccharides (EPS) using SLF are based on various factors, such as initial pH, temperature, glucose and nitrogen concentrations, and agitation speed [28]. RSM can be used to examine the interactions and relationships between responses and factors and determine the optimal conditions. RSM generates a huge quantity of data from a few trials [29]. It signifies an option to a traditional one-factor-at-a-time (OFAAT) approach, as it can evaluate various variables simultaneously, minimizing cost, time, and labour requirements [30]. To optimize the conditions for the growth of L. rhinocerus, this study employed a combination of the RSM and analysis of variance (ANOVA). This approach helped develop models that can predict the outcome of the cultivation process and express it in a clear and concise mathematical format [31]. For experimental design, the central composite design (CCD) was chosen in RSM analysis instead of other techniques, such as the Box–Behnken, factorial fractional, or full factorial design approaches [32]. The CCD design estimates both the main effects and the second-order interactions between variables, providing a more detailed representation of the RSM [33]. Moreover, the use of CCD in this study enables the detection of any curvature or non-linearity in the response surface, allowing for a more robust optimization of the process [34]. Therefore, CCD was deemed the most suitable approach for this study as it provides a more comprehensive and accurate representation of the response surface.
The pursuit of innovative and sustainable energy solutions continues, and this study takes a step in that direction by exploring the viability of L. rhinocerus as a bioenergy feedstock. L. rhinocerus was discovered in a tropical rainforest in Malaysia, and the focus of the study is on optimizing its cultivation conditions through the use of SLF in stirred-tank (STR) bioreactors. The parameters of glucose concentration, initial pH of the medium, and speed of agitation were modified to maximize the MB and EPS production. The lipid content from MB was also analysed. This study presents a novel contribution to the bioenergy field, as the potential of L. rhinocerus as a bioenergy feedstock has received limited attention in prior research. The findings of this research provide new insight into the viability and sustainability of using medicinal mushrooms as a source of clean energy.
2. Materials and Methods
2.1. Fungal Source
The wild L. rhinocerus strain ABI was obtained from the tropical rainforests of Malaysia. The sclerotium was grown aseptically on PDA medium agar plates to ensure feasibility and avoid contamination. Incubation was performed at room temperature for 10 days in the dark. Subsequently, the mycelium was subcultured onto a new malt extract agar plate (MEA) (Sigma-Aldrich, Dorset, UK) to obtain pure mycelium as a working culture. The strain was kept at 4 °C on PDA slants.
2.2. Inoculum Preparation in Shake Flasks
The inoculum preparation of L. rhinocerus involved two stages of seed culture. The first seed culture was performed by culturing the mycelium in a shake flask with an initial pH medium of 5.5 and incubating it at 30 °C on an orbital shaker at a speed of 150 rpm in the dark for ten days. The mycelium was then homogenized to generate a standardized size with an increased number of hyphal tips. Finally, it was inoculated into a 500 mL Erlenmeyer flask at 200 mL of working volume. The composition of the liquid medium was referred to by Usuldin et al. [8] unless otherwise specified.
2.3. Growth Curve Analysis
The growth curve for MB and EPS was recorded at two-day intervals from day 0 to day 15. The data were collected from the 2nd seed culture in a 200 mL medium, which was prepared in a 500 mL shake flask, under the conditions described in Section 2.2.
2.4. Media Optimization Using Statistical Tool Analysis
Table 1 displays the three independent variables, glucose concentration, speed of agitation, and initial pH medium that were optimized in this study. The responses were MB and EPS measured in grams per litre (g/L). The minimum and maximum ranges of the experimental factors were as follows: glucose concentration, 10 and 50 g/L; initial pH, 4 to 6; and speed of agitation, 100 to 200 rpm. Design-Expert® Software version 12.0 (StatEase, Inc., Minneapolis, MN, USA, 2019) was used to analyse variance (ANOVA) and plot three-dimensional (3D) graphs of the experimental data.

Table 1.
The values of the levels and ranges of the experimental factors.
To examine the impact of the variables and their interdependence, an empirical model based on a second-order quadratic equation was developed for the responses, as illustrated in Equation (1):
where Y = expected, = the constant coefficient, = the linear coefficient, = the interaction coefficient, = the quadratic coefficient, and = the coded values.
2.5. Bioreactor Validations
The RSM model was employed to maximize the production of both MB and EPS from the mushroom L. rhinocerus. The optimized values were validated through an experiment conducted in both 500 mL shake flasks and a 5 L STR bioreactor (3.5 L working volume) (Biostat B+, Sartorius Stedim, Goettingen, Germany), and then further scaled up in a 13 L STR bioreactor (10 L working volume) (Labfors 5, Infors AG, Bottmingen-Basel, Switzerland) using the SLF. The experiments were conducted in triplicate over 11 days using optimized parameters: 128 rpm speed of agitation, 30 °C temperature, and initial pH medium of 4.0. The air input for both bioreactors was 1.0 L/min. Figure 1 shows the process flow of the submerged liquid fermentation of L. rhinocerus strain ABI, starting from the culture of the fruiting body and cultivation in the stirred-tank bioreactor.
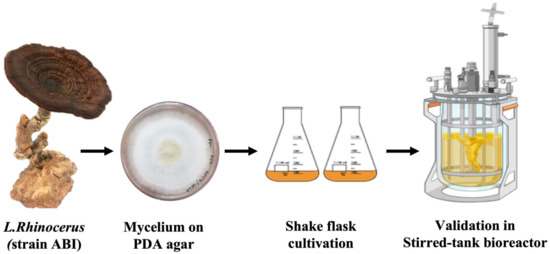
Figure 1.
Process flow of the submerged liquid fermentation of L. rhinocerus strain ABI, starting from the culture of the fruiting body to cultivation in the stirred-tank bioreactor.
2.6. Analytical Methods
2.6.1. Mycelial Biomass (MB)
The culture broth was harvested from shake flasks and bioreactors and filtered using a vacuum technique. The MB was rinsed with distilled water, placed on pre-weigh filter paper at 35 °C until a consistent weight was reached. The dry cell weight (DCW) was calculated by the gravimetric method. The MB concentration was analysed by multiplying the DCW by the dilution factor, as shown in Equation (2) [35]. The experiments were performed in triplicate.
2.6.2. Exopolysaccharides (EPS)
The supernatant attained from the filtration of MB (Section 2.6.1) was mixed with 95% ethanol (EtOH) at a ratio of 1:4 (sample to EtOH) in a pre-weighed Falcon tube (15 mL). The mixture was then vortexed and left to sit at 4 °C overnight. After 24 h, the material was separated for 15 min at 10,000 rpm and the pellet was collected, separated from the supernatant, and dried at 35 °C until it reached a consistent weight. To calculate the EPS, the weight of the Falcon tube containing EPS was subtracted from the weight of an empty Falcon tube, and the result was multiplied by the dilution factor to give the EPS value (g/L), as expressed in Equation (3).
2.7. Residual Glucose Determination
The 3,5-Dinitrosalicylic acid (DNSA) method was used to determine the concentration of the residual glucose in the culture media [36]. The filtrate (2 mL) obtained from the MB filtration was pipetted into a test tube, added with a DNS reagent (3 mL), and thoroughly vortexed. The tubes were then boiled for 5 min and left to cool down to room temperature. The sample absorbance (ABS) was determined using a spectrophotometer (Varian Cary® 50). The standard curve was plotted using different concentrations of glucose (Bendosen, Norway) ranging from 0 to 1.0 g/L.
2.8. Kinetics Calculation
The kinetic parameters of the batch fermentation process of L. rhinocerus strain ABI were calculated as follows [37]:
where Xmax = maximum cell concentration achieved at harvest and X0 = initial cell concentration.
2.9. Image Analysis
2.9.1. Compound Microscope
The morphological characteristics of the mycelial pellets were examined using a compound microscope (MT4000, Nikon, Tokyo, Japan). A sample of 1 mL was collected and placed in a petri dish. The pellet was observed using a microscopic objective at 4× magnification.
2.9.2. SEM Microscopy
The morphology of the dried MB and EPS was analysed by using a scanning electron microscope (Hitachi-SU1510, Japan)). Approximately 5 mm of dried MB and EPS samples were collected and viewed under SEM at 1000× magnification.
2.10. Lipid Extraction
The dried MB was ground using a Waring blender and the oil was extracted using n-hexane at a 1:5 sample-to-solvent ratio for 5 h using a Soxhlet apparatus at 60 °C. The hexane was then evaporated using a rotary evaporator at 40 °C. The oil content was determined using the following Equation (9) [38]:
2.11. Statistical Analysis
All experiments were conducted in three trials. GraphPad Prism 5 software (version 5.0) was used to measure the corresponding ‘mean ± SD’. If there is no error bar appears, it indicated that it is shorter than the symbol size. Analysis of variance (ANOVA) for the CCD quadratic model was performed using the Design Expert 12.0 program (Stat-Ease, Minneapolis, MN, USA) for RSSM. The p-values (p < 0.05) were used to demonstrate statistical significance levels for each coefficient model.
3. Results and Discussion
3.1. Growth Profiles
The growth profiles for the production of L. rhinocerus’ MB and EPS in batch fermentation were illustrated over 15 days. The growth stages were categorized as the lag, exponential, stationary, and death stages [39]. The traditional fungal growth pattern for L. rhinocerus for both MB (Figure 2a) and EPS (Figure 2b) are illustrated for production in the shake flasks. From day 0 to day 1, the mushroom exhibited a lag phase, indicating that it was adjusting to its surroundings. From day 2 to day 9, an exponential phase was seen, followed by the stationary and death stages until day 15. The highest MB production was observed on day 11.
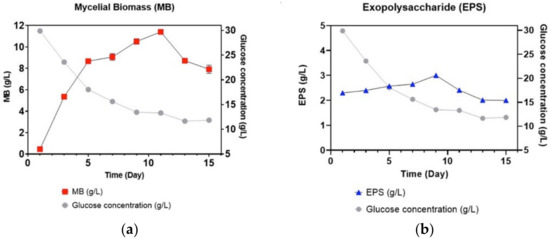
Figure 2.
Growth curve and glucose consumption analyses for (a) MB and (b) EPS of L. rhinocerus strain ABI in shake flask fermentation.
Meanwhile, in Figure 2b, the production of EPS was sluggish during the first 7 days, as the mycelium of L. rhinocerus was still acclimatizing to its surroundings and was in its exponential phase. The maximum EPS yield was seen on the 9th day, but afterward, a decline in EPS production was noticed until the 15th day. The growth profile of L. rhinocerus is comparable to other mycelial growth profiles, which usually take approximately two weeks of cultivation, whereas EPS peaked at 9–10 days [36,40].
3.2. Mycelial Biomass (MB) Production Optimization
In the optimization study using RSM, 20 different sets of culture conditions were employed, as shown in Table 2. The impact of agitation speed, glucose concentration, and the initial pH of the medium on the production of MB-EPS from L. rhinocerus was evaluated over 11 days for each experimental design, with three replicates performed for each condition.
Table 2.
RSM with the CCD matrix and the result of the MB and EPS outputs.
Table 3 presents the ANOVA for L. rhinocerus MB output. The results show the model was statistically significant due to the “Prob > F” value of 0.0046 being less than 0.05 (p < 0.05). The value of R2 reveals that the projected coefficient in this model can represent 84.60% of response variation, whereas the balance of 15.4% variations could not be described. The result of Adj. R2 of 0.7073 indicates that 70.73% of the adjusted coefficient determination value suggests the model’s effectiveness is within an acceptable range, as predicted by the R2 value. However, the large differences in Adj and Pred R2 are due to many non-significant terms. Lastly, the model was expressed in terms of the actual variables of MB and represented as Equation (10).
where Glu = glucose, Agit = agitation, and IpH = initial pH.
Table 3.
The results of analysis of variance (ANOVA) generated from the CCD quadratic model for MB.
The results from the model analysis (Table 3) indicate that glucose concentration (A) has the greatest influence on the production of MB, with a significant effect observed (p < 0.005). The quadratic term of speed of agitation (B2) also had a significant effect on the yield of MB, whereas the speed of agitation (B), Initial pH medium (C) and quadratic terms of glucose concentration (A2), initial pH (C2), the interaction between glucose and speed of agitation (AB), the interaction between glucose and initial pH (AC), and the interaction between the speed of agitation and initial pH (BC) had negative effects.
The 3D response surface plot of MB (Figure 3) illustrates the interaction between glucose concentration and speed of agitation, glucose concentration and initial pH medium, and the speed of agitation and initial pH medium. Figure 3a shows that as the glucose concentration increases, the MB also increases, while the speed of agitation has a quadratic effect on MB production. Figure 3b,c indicate that there is no significant effect of the initial pH medium on MB production. The maximum MB production was achieved at a glucose concentration of 50 g/L, initial pH 4.0, and a speed of agitation of 138.03 rpm.
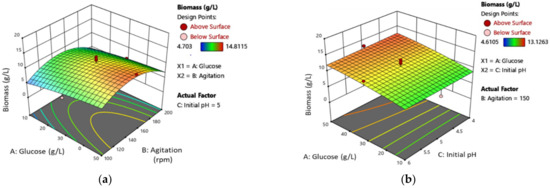
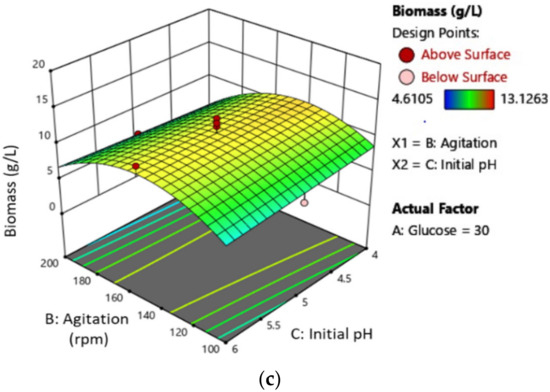
Figure 3.
Three-dimensional (3D) response surface plot of L. rhinocerus’ MB showing the interaction between (a) glucose concentration and the speed of agitation, (b) glucose concentration and initial pH medium, and (c) speed of agitation and initial pH medium.
3.3. Exopolysaccharides (EPS) Production Optimisation
The results of the ANOVA for L. rhinocerus’ EPS output are presented in Table 4. The results reveal that the model was statistically significant, with a p-value less than 0.05. The value of R2 indicates that the projected coefficient in this model can explain 94.66% of the response variability. Meanwhile, the Adj. R2 value of 0.8985, which corresponds to 89.85% of the adjusted coefficient determination, suggests that the model is effective and within an acceptable range with the predicted R2 value. Thus, the EPS model can be expressed using the actual variable by Equation (11).
Table 4.
The results of analysis of variance (ANOVA) generated from the CCD quadratic model for EPS.
The results in Table 4 reveal that the glucose concentration (A) and its quadratic term (AB) have the most significant influence (p < 0.0001) on EPS production. Agitation (B) and its quadratic terms (B2) also demonstrate a strong effect on EPS yield (p < 0.05). On the other hand, the initial pH medium (C) and its quadratic terms (A2, AC, BC, and C2) have a negative impact. The 3D plots in Figure 4 depict the interaction between glucose concentration and speed of agitation, glucose concentration and initial pH medium, and speed of agitation and initial pH medium on EPS production. Figure 4a,b show that the yield of EPS increases with an increase in glucose concentration. However, there is no significant effect of initial pH media on the production of EPS, as shown in Figure 4b,c. The maximum EPS was obtained with a glucose concentration of 49.73 g/L, a speed of agitation of 103.04 rpm, and an initial pH of 4.58. This model highlights the significant impact of glucose concentration on the proliferation of MB, which in turn increases EPS production. To further improve EPS production during mycelial growth, it is necessary to increase glucose concentration and agitation.
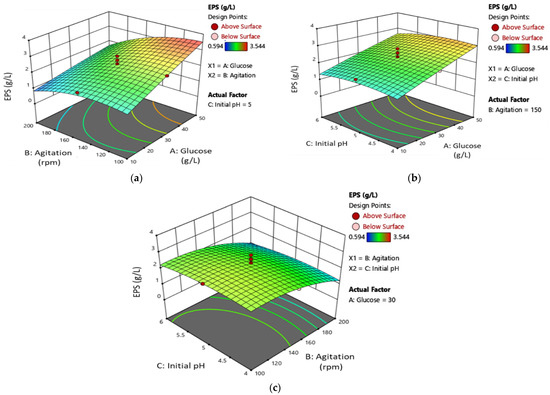
Figure 4.
The three-dimensional (3D) response surface plot of L. rhinocerus’ EPS demonstrates the relationship for (a) speed of agitation and glucose concentration, (b) initial pH medium and glucose concentration, and (c) initial pH medium and speed of agitation.
3.4. Optimized Conditions Verification
The robustness of the model was assessed by comparing its predicted MB and EPS values to actual results under ideal statistical conditions, as shown in Table 5. Experiments were carried out in 500 mL shake flasks and a 5 L STR bioreactor with controlled conditions to validate the model. Its accuracy was confirmed using Equations (10) and (11). The MB and EPS production in shake flasks were 14.31 g/L and 1.87 g/L, respectively. Meanwhile, production in the 5 L STR bioreactor increased 1.1-fold for MB (15.60 g/L) and 1.3-fold for EPS (2.39 g/L) compared to shake flasks.
Table 5.
Model validation of the optimized conditions in the shake flask and bioreactor.
Further verification was performed in a 13 L STR using the optimized conditions where the yield of MB (23.93 g/L) and EPS (4.40 g/L) were increased, which showed an increase of 1.7-fold for MB and 2.4-fold for EPS as compared to the shake flask. The synthesis of both MB and EPS in a bioreactor may be influenced by fermentation parameters, including dissolved oxygen and agitation rate. Due to the use of impellers, STR bioreactors also offer superior aeration, which may promote the development of L. rhinocerus and result in higher levels of MB and EPS. The validation findings showed that the model was accurate for L. rhinocerus with high MB and EPS production when taken as a whole.
At the end of the experiment, the values of MB and EPS were derived according to Equations (5) and Equation (7), as shown in Table 6. MB yield was 0.677 ± 0.1 (gDCW/gGlu) and EPS yield was 0.181 ± 0.005 (gDCW/gGlu), respectively. The productivity of MB (0.995 ± 0.1 g/L/day) and EPS (0.333 ± 0.01 g/L/day) was determined using Equation (4) and Equation (6), respectively. The specific EPS production rate was 0.029 ± 0.005 day−1. Figure 5 illustrates the stages of L. rhinocerus cultivation in SLF, from shake flasks to upscaling in STR bioreactors for the production of MB and EPS.
Table 6.
Kinetic parameters by L. rhinocerus strain ABI using batch fermentation.
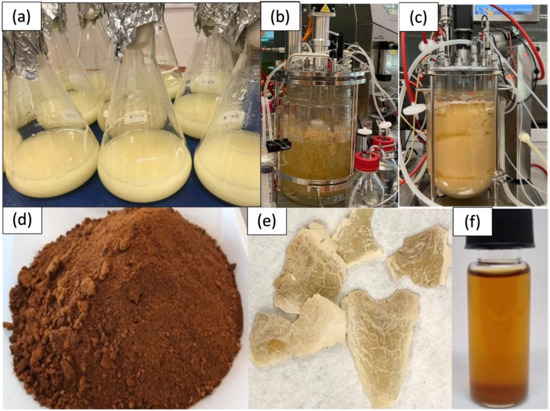
Figure 5.
The stages of L. rhinocerus cultivation in submerged liquid fermentation (SLF) and its products: (a) seed culture in shake flasks, (b) cultivation in a 5 L STR bioreactor after 7 days of the fermentation process, (c) cultivation in a 13 L STR bioreactor after 11 days of the fermentation process, (d) powdered MB, (e) dried EPS, and (f) oil production from MB.
3.5. Image Analysis
3.5.1. Pellet Morphology
The form of mycelial pellets has a direct impact on the generation of polysaccharides [41]. In this investigation, the optimum pellet sizes for maximum levels of total MB and EPS for the L. rhinocerus strain ABI were reported (Figure 6). According to our observations, the shape of mycelial pellets is not constant across different cultivation conditions; it can be vast and round or small and irregular. Figure 6a illustrates the formation of globular pellets under the optimum culture conditions for MB production, which have a smooth and less hairy outer layer. Figure 6b illustrates the creation of tiny, loosely branching pellets with a thick hairy surface for culture conditions with the highest EPS output. Finally, Figure 6c depicts the development of compact, thick-branched pellets with a hairy surface under culture conditions that yield the maximum levels of MB and EPS. As reported in [36], small, loosely branching mycelium pellets tend to produce more polysaccharides than larger ones.
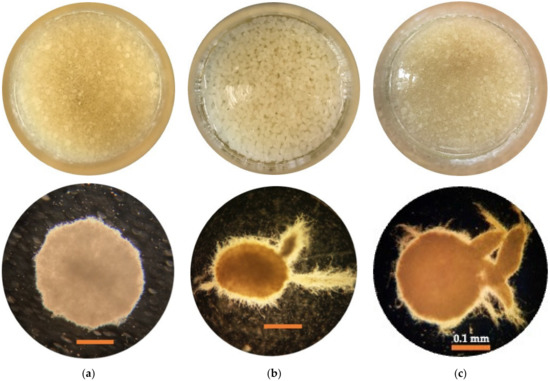
Figure 6.
Macroscopic (above) and microscopic (below) (under microscope 4× obj) for morphological analysis of mycelium pellet of L. rhinocerus strain ABI in optimized media conditions for responses (a) MB, (b) EPS, and (c) MB and EPS. The bars indicate 0.1 mm.
3.5.2. Microstructure Analysis
Figure 7 depicts the morphology and microstructure of the dried MB and EPS surfaces from L. rhinocerus as seen through SEM at 1000×. Figure 7a reveals that the surface structure of MB was irregular, with the rod-shaped forms attached, indicating dried hyphae. The drying process resulted in an uneven and wrinkled surface texture for EPS, as seen in Figure 7b.
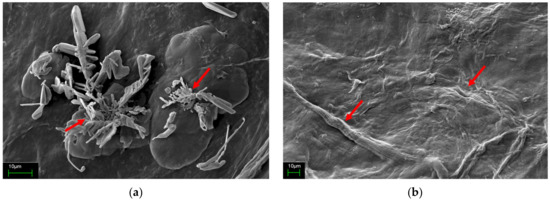
Figure 7.
The scanning electron microscopes of wild Malaysian L. rhinocerus strain ABI (1000× obj) grown in batch fermentation at 30 °C, pH 4, 50 g/L glucose, and 128.24 rpm. (a) Dried MB and (b) dried EPS. The bars indicate 10 µm.
3.6. Lignosus Rhinocerus Lipid Yield and Its Potential as a Biodiesel
The lipid extraction from MB using the Soxhlet method resulted in a yield of 2.07% (w/w) on a dry weight basis, using a 5:1 solvent-to-sample ratio after 5 h. The yield is in agreement with the observation made by Lau et al. [42] that L. rhinocerotis had low levels of lipids (2.3% (w/w)) (Table 7). Despite this, the mycelium of L. rhinocerus was discovered to have a much greater lipid content than the sclerotium and fruiting body [17]. However, lipid yield from L. rhinocerus was relatively low compared to other filamentous fungi sources [43]. Figure 5f shows the oil production from MB L. rhinocerus in this study.
The lipid production in a bioreactor could help to improve the sustainability and competitiveness of L. rhinocerus as a feedstock for biodiesel. The use of a bioreactor could allow for the scaling up and optimization of L. rhinocerus production, reducing energy and water requirements and minimizing waste. However, further research and analysis are needed to fully understand the environmental impact of the materials and to make an informed decision on their potential as feedstocks for bioenergy production. Compared to other sources, such as microalgae, the life cycle assessment (LCA) of microalgae as a feedstock for bioenergy production considers the environmental impact from the cradle to the grave, including resource extraction, use, and disposal [44]. However, the potential environmental impact of the production process and waste disposal of L. rhinocerus has yet to be assessed using the LCA. In summary, the use of a bioreactor for the production of L. rhinocerus-based biodiesel can improve its effectiveness and sustainability compared to other microorganisms, making it a promising alternative feedstock for biodiesel production.
3.7. Comparison of the Present Study to Earlier Research
Table 7 displays the known research addressing MB and EPS in the SLF of Lignosus species. To date, there has not been a significant amount of recent research conducted for the optimization of L. rhinocerus production using SLF. In fact, the comparison reveals that most of the research reported using OFAAT as an optimization technique, with only current research employing RSM. Additionally, one study employed the orthogonal matrix method to optimize medium composition [45]. Previous studies have shown that there was a significant increase in both MB and EPS yields when conditions were optimized [45,46]. The most extensive scaled-up process was reported by Lin et al. [47] using a 2.0 tonne bioreactor. It was demonstrated that MB and EPS production in the STR bioreactor achieved the highest biomass compared to other reported studies in a high-scale bioreactor system [8]. As far as we are aware, there has not been any study conducted to optimize the media composition for the production of L. rhinocerus’ MB and EPS. These data employ the first RSM data to optimize the growth of L. rhinocerus in STR bioreactors.
Table 7.
The literature comparison for the optimization of L. rhinocerus using submerged liquid fermentation.
Table 7.
The literature comparison for the optimization of L. rhinocerus using submerged liquid fermentation.
| Species | Origin | Temperature Range (°C) | Optimization Method | Cultivation Mode | Working Volume (L) | Initial pH | Glucose Concentration (g/L) | Agitation (rpm) | MB (g/L) | EPS (g/L) | Lipid Yield (% w/w) | Reference |
|---|---|---|---|---|---|---|---|---|---|---|---|---|
| L. rhinocerus strain ABI | Lata Iskandar, Malaysia | 23–31 | Response surface methodology (RSM) | STR Bioreactor | 10 | 4.0 | 50 | 128.24 | 23.93 | 4.4 | 2.07 | Current study |
| L. rhinocerus strain ABI | Lata Iskandar, Malaysia | 23–31 | One-factor-at-a-time (OFAAT) | STR Bioreactor | 10 | 5.5 | 40 | 200 | * NA | NA | NA | [8] |
| L.rhinocerus | - | 25 | OFAAT | Shake flask | 2 | 5.0 | 20 | 120 | NA | NA | NA | [47] |
| STR bioreactor | 500; 20,000 | |||||||||||
| L. rhinocerus | Sanming, Fujian Province, China | 22–32 | OFAAT | Shake flask | 0.075 | NA | 40 | 180 | 15 | 5 | NA | [46] |
| L. rhinocerotis (KUM61075) | Kenaboi Forest Reserve, Negeri Sembilan, Malaysia | 22–30 | OFAAT | Shake flask | 0.1 | 6.0–6.5 | 15 | 150 | 0.062 | 0.294 | 2.3 | [48] |
| STR Bioreactor | 3 | 200 | NA | NA | ||||||||
| L. rhinocerus | Lata Iskandar, Malaysia | 23–31 | OFAAT and the orthogonal matrix method | Shake flask | 0.05 | 6.0 | 20 | 150 | 2.17 | 1.18 | NA | [45] |
| STR Bioreactor | 1.5 | 80 | 100 | 6.37 | 1.20 |
* NA = data not available.
3.8. Challenges and Limitations of L. rhinocerus as a Potential Bioenergy
There are several challenges and limitations that must be addressed to make lipid production from L. rhinocerus a viable source of bioenergy:
- i.
- Cost of the process: The cost of growing mycelium in a bioreactor and processing it into bioenergy will depend on several factors, such as the scale of production, the efficiency of the bioreactor system, and the cost of inputs such as water, nutrients, and energy.
- ii.
- Lipid content: The lipid content of the mycelium will also play a role in its potential as a source of bioenergy. Higher lipid content will result in higher energy output when converted into bioenergy. However, the lipid content can be affected by several factors, including the growing conditions, the mushroom strain, and the growth stage.
- iii.
- Stakeholders: The stakeholders in producing mycelium-based bioenergy will include growers, processors, investors, and government agencies. Ensuring the interests of all stakeholders are taken into account will be important in the successful development and implementation of this new source of bioenergy.
- iv.
- Readiness of industry: The bioenergy industry is rapidly evolving, and there may be challenges in establishing a market for mycelium-based bioenergy. The readiness of the industry to embrace this new source of bioenergy will play a role in its success.
- v.
- Change of fossil fuel to biodiesel: The shift from fossil fuels to bioenergy, including biodiesel, is important in reducing greenhouse gas emissions and promoting sustainability. However, this transition will need to consider the challenges and limitations of using mycelium-based bioenergy.
- vi.
- Food vs. energy: The United Nations Sustainable Development Goals (SDGs) provide a framework for promoting sustainable development. This study’s investigation aligns with two of these goals: SDG 7 (Affordable and Clean Energy) and SDG 12 (Responsible Consumption and Production). Additionally, the lipids extracted from L. rhinocerus could also contribute to SDG 2 (Zero Hunger), as mushrooms are a highly functional food. However, the debate around the risk of using food for biofuels is a long-standing and contentious issue that demands attention.
Despite these challenges, the lipid from L. rhinocerus has the potential to be a new and important source of bioenergy. In order to make the most of this potential, it is necessary to address the challenges and limitations associated with its production and to invest in research and development aimed at improving its yield, quality, and scalability. This will require a multi-disciplinary approach involving researchers from fields such as biology, chemistry, engineering, and economics.
4. Conclusions
The energy crisis, such as the depletion of fossil fuels and increasing emission of greenhouse gas emissions, has motivated scientists worldwide to seek alternative energy sources. The optimal conditions for maximum MB production (14.85 ± 0.5 g/L) were an initial pH of 4, a glucose concentration of 50.0 g/L, and an agitation speed of 138 rpm. On the other hand, the optimal conditions for maximum EPS production (4.71 ± 0.1 g/L) were an initial pH of 4.58, a glucose concentration of 49.73 g/L, and an agitation speed of 103 rpm. Furthermore, to maximize both MB and EPS production (14.31 g/L and 1.87 g/L, respectively), the optimized conditions were an initial pH of 4, a glucose concentration of 50.0 g/L, and an agitation at 128 rpm. These optimized parameters were also validated in 5 L and 13 L STR bioreactors, resulting in increased yields of MB and EPS compared to a 500 mL shake flask culture. The study also found that the glucose concentration and agitation had a significant impact on MB and EPS production, while the initial pH of the medium had an insignificant effect. Additionally, the MB lipid was successfully extracted using the Soxhlet extraction method. From a future perspective, this study provides a foundation for the large-scale production of L. rhinocerus and its potential applications in bioenergy. Furthermore, the study highlights the importance of using statistical analysis methods for media optimization and its impact on the productivity and yields of MB and EPS. Further research could focus on optimizing lipid extraction and evaluating its properties for use as a bioenergy feedstock and the potential commercialization of this renewable energy source.
Author Contributions
Conceptualization, S.R.A.U. and W.A.A.Q.I.W.-M.; methodology, R.A. and W.A.A.Q.I.W.-M.; software, W.A.A.Q.I.W.-M.; validation, R.A., Z.I. and W.A.A.Q.I.W.-M.; formal analysis, S.R.A.U.; investigation, S.R.A.U.; resources, W.A.A.Q.I.W.-M.; data curation, A.A.J.; writing—original draft preparation, S.R.A.U.; writing—review and editing, W.A.A.Q.I.W.-M.; visualisation, R.A.; supervision, W.A.A.Q.I.W.-M., Z.I. and A.A.J.; project administration, Z.I.; funding acquisition, W.A.A.Q.I.W.-M. and Z.I. All authors have read and agreed to the published version of the manuscript.
Funding
We would like to thank The Ministry of Higher Education (MOHE) for supporting this research under the Fundamental Research Grant Scheme FP066-2018A (FRGS/1/2018/STG05/UM/02/7), Universiti Sains Islam Malaysia (USIM) Research Grant [PPPI/UGC_0119/KPI/051000/11919] awarded to Rahayu Ahmad, and the Bio-Analytical Industry Development Programme (BIDP) award under the Agro-Biotechnology Institute, Malaysia, awarded to Siti Usuldin.
Data Availability Statement
Not applicable.
Acknowledgments
Thank you Ministry of Higher Education (MOHE), Universiti Sains Islam Malaysia (USIM) and Agro-Biotechnology Institute, Malaysia.
Conflicts of Interest
The authors declare no conflict of interest.
References
- Galanakis, C.M. The Vertigo of the Food Sector within the Triangle of Climate Change, the Post-Pandemic World, and the Russian-Ukrainian War. Foods 2023, 12, 721. [Google Scholar] [CrossRef] [PubMed]
- Holechek, J.L.; Geli, H.M.E.; Sawalhah, M.N.; Valdez, R. A Global Assessment: Can Renewable Energy Replace Fossil Fuels by 2050? Sustainability 2022, 14, 4792. [Google Scholar] [CrossRef]
- Ma, S.; Lei, T.; Meng, J.; Liang, X.; Guan, D. Global oil refining’s contribution to greenhouse gas emissions from 2000 to 2021. Innovation 2023, 4, 100361. [Google Scholar] [CrossRef] [PubMed]
- Das, A.K.; Sharma, A. Chapter 1—Climate change and the energy sector. In Advancement in Oxygenated Fuels for Sustainable Development; Kumar, N., Mathiyazhagan, K., Sreedharan, V.R., Kalam, M.A., Eds.; Elsevier: Amsterdam, The Netherlands, 2023; pp. 1–6. [Google Scholar] [CrossRef]
- Rahman, M.M.; Alam, K. CO2 Emissions in Asia-Pacific Region: Do Energy Use, Economic Growth, Financial Development, and International Trade Have Detrimental Effects? Sustainability 2022, 14, 5420. [Google Scholar] [CrossRef]
- Mujtaba, A.; Jena, P.K. Nexus Between the Energy Market, Industrialization, and Economic Growth in the Asia-Pacific Region. Energy Res. Lett. 2022, 3, 32631. [Google Scholar] [CrossRef]
- Rowan, N.J.; Casey, O. Empower Eco multiactor HUB: A triple helix ‘academia-industry-authority’ approach to creating and sharing potentially disruptive tools for addressing novel and emerging new Green Deal opportunities under a United Nations Sustainable Development Goals framework. Curr. Opin. Environ. Sci. Health 2021, 21, 100254. [Google Scholar] [CrossRef]
- Usuldin, S.R.A.; Mahmud, N.; Ilham, Z.; Ikram, N.K.K.; Ahmad, R.; Wan, W.A.A.Q.I. In-depth spectral characterization of antioxidative (1, 3)-β-D-glucan from the mycelium of an identified tiger milk mushroom Lignosus rhinocerus strain ABI in a stirred-tank bioreactor. Biocatal. Agric. Biotechnol. 2020, 23, 101455. [Google Scholar] [CrossRef]
- Alugoju, P.; Tencomnao, T. Tiger’s Milk Mushroom (Lignosus rhinocerus). In Mushrooms; CRC Press: Boca Raton, FL, USA, 2023; pp. 239–253. [Google Scholar]
- Ng, M.J.; Kong, B.H.; Teoh, K.H.; Yap, Y.H.-Y.; Ng, S.T.; Tan, C.S.; Razif, M.F.M.; Fung, S.Y. In vivo anti-tumor activity of Lignosus rhinocerus TM02® using a MCF7-xenograft NCr nude mice model. J. Ethnopharmacol. 2023, 304, 115957. [Google Scholar] [CrossRef]
- Moussaa, A.Y.; Xu, B. A narrative review on inhibitory effects of edible mushrooms against malaria and tuberculosis-the world’s deadliest diseases. Food Sci. Hum. Wellness 2023, 12, 942–958. [Google Scholar] [CrossRef]
- Ng, M.J.; Razif, M.F.M.; Kong, B.H.; Ng, S.T.; Tan, C.S.; Yap, H.-Y.Y.; Fung, S.Y. The genome of Lignosus tigris: Uncovering its hidden nutraceutical potential. S. Afr. J. Bot. 2023, 154, 108–119. [Google Scholar] [CrossRef]
- Faris Taufeq, F.Y.; Habideen, N.H.; Rao, L.N.; Podder, P.K.; Katas, H. Potential Hemostatic and Wound Healing Effects of Thermoresponsive Wound Dressing Gel Loaded with Lignosus rhinocerotis and Punica granatum Extracts. Gels 2023, 9, 48. [Google Scholar] [CrossRef]
- Cheong, P.; Yong, Y.; Fatima, A.; Ng, S.; Tan, C.; Kong, B.; Tan, N.; Rajarajeswaran, J.; Fung, S. Cloning, overexpression, purification, and modeling of a lectin (Rhinocelectin) with antiproliferative activity from tiger milk mushroom, Lignosus rhinocerus. IUBMB Life 2019, 71, 1579–1594. [Google Scholar] [CrossRef]
- Alavi, F.; Ciftci, O.N. Purification and fractionation of bioactive peptides through membrane filtration: A critical and application review. Trends Food Sci. Technol. 2023, 131, 118–128. [Google Scholar] [CrossRef]
- Willetts, H.; Bullock, S. Developmental biology of sclerotia. Mycol. Res. 1992, 96, 801–816. [Google Scholar] [CrossRef]
- Tang, Y.; Li, Y.-Y.; Li, H.-M.; Wan, D.-J.; Tang, Y.-J. Comparison of Lipid Content and Fatty Acid Composition between Tuber Fermentation Mycelia and Natural Fruiting Bodies. J. Agric. Food Chem. 2011, 59, 4736–4742. [Google Scholar] [CrossRef]
- Delattre, C.; Cabrera-Barjas, G.; Banerjee, A.; Rodriguez-Llamazares, S.; Pierre, G.; Dubessay, P.; Michaud, P.; Zamani, A. Production of fungal biopolymers and their advanced applications. In Current Developments in Biotechnology and Bioengineering; Elsevier: Amsterdam, The Netherlands, 2023; pp. 497–532. [Google Scholar]
- Nallathamby, N.; Lakshmanan, H.; Vidyadaran, S.; Abd Malek, S.N.; Phan, C.-W.; Sabaratnam, V. Lipid-rich fraction of the sclerotium of Tiger Milk Mushroom Lignosus rhinocerotis (Agaricomycetes) attenuates LPS-induced inflammation in BV2 cells via Nrf2 pathway. Braz. J. Pharm. Sci. 2021, 56, 1–12. [Google Scholar] [CrossRef]
- Berovic, M.; Zhong, J.-J. Advances in Production of Medicinal Mushrooms Biomass in Solid State and Submerged Bioreactors; Springer: Berlin/Heidelberg, Germany, 2023. [Google Scholar]
- Vehapi, M.; İnan, B.; Kayacan-Cakmakoglu, S.; Sagdic, O.; Özçimen, D. Production of Bacillus subtilis soil isolate as biocontrol agent under bioreactor conditions. Arch. Microbiol. 2023, 205, 52. [Google Scholar] [CrossRef]
- Malik, P.; Mukherjee, T.K. Large-Scale Culture of Mammalian Cells for Various Industrial Purposes. In Practical Approach to Mammalian Cell and Organ Culture; Springer: Berlin/Heidelberg, Germany, 2023; pp. 1–45. [Google Scholar]
- Egger, D.; Nebel, S.; Gensler, M.; Kreß, S.; Hansmann, J.; Kasper, C. Bioreactors: Enabling technologies for research and manufacturing. In Tissue Engineering; Elsevier: Amsterdam, The Netherlands, 2023; pp. 431–456. [Google Scholar]
- Contato, A.G.; Inácio, F.D.; Bueno, P.S.A.; Nolli, M.M.; Janeiro, V.; Peralta, R.M.; de Souza, C.G.M. Pleurotus pulmonarius: A protease-producing white rot fungus in lignocellulosic residues. Int. Microbiol. 2023, 26, 43–50. [Google Scholar] [CrossRef]
- Zhao, X.; Chai, J.; Wang, F.; Jia, Y. Optimization of Submerged Culture Parameters of the Aphid Pathogenic Fungus Fusarium equiseti Based on Sporulation and Mycelial Biomass. Microorganisms 2023, 11, 190. [Google Scholar] [CrossRef]
- Majid, S.; Ahmad, K.; Ali, D. Microbial detoxification of Pyrethroid insecticide Bifenthrin by selected Fungal strains and Optimizing conditions using Response Surface Methodology. Researchsquare, 2023; preprint. [Google Scholar] [CrossRef]
- Rahman, S.; Sharma, P.; Said, Z. Application of Response Surface Methodology Based D-Optimal Design for Modeling and Optimisation of Osmotic Dehydration of Zucchini. Digit. Chem. Eng. 2022, 4, 100039. [Google Scholar] [CrossRef]
- Yap, L.S.; Lee, W.L.; Ting, A.S.Y. Bioprocessing and purification of extracellular L-asparaginase produced by endophytic Colletotrichum gloeosporioides and its anticancer activity. Prep. Biochem. Biotechnol. 2022; ahead of print. [Google Scholar] [CrossRef]
- Lamidi, S.; Olaleye, N.; Bankole, Y.; Obalola, A.; Aribike, E.; Adigun, I. Applications of Response Surface Methodology (RSM) in Product Design, Development, and Process Optimization. In Response Surface Methodology–Research Advances and Applications; IntechOpen: London, UK, 2022. [Google Scholar] [CrossRef]
- Bouchelkia, N.; Tahraoui, H.; Amrane, A.; Belkacemi, H.; Bollinger, J.-C.; Bouzaza, A.; Zoukel, A.; Zhang, J.; Mouni, L. Jujube stones based highly efficient activated carbon for methylene blue adsorption: Kinetics and isotherms modeling, thermodynamics and mechanism study, optimization via response surface methodology and machine learning approaches. Process Saf. Environ. Prot. 2023, 170, 513–535. [Google Scholar] [CrossRef]
- Percy, A.J.; Edwin, M. Studies on the performance and emission characteristics of a dual fuel VCR engine using producer gas as secondary fuel: An optimization approach using response surface methodology. Energy 2023, 263, 125685. [Google Scholar] [CrossRef]
- Shah, S.A.R.; Kahla, N.B.; Atig, M.; Anwar, M.K.; Azab, M.; Mahmood, A. Optimization of fresh and mechanical properties of sustainable concrete composite containing ARGF and fly ash: An application of response surface methodology. Constr. Build. Mater. 2023, 362, 129722. [Google Scholar] [CrossRef]
- Reji, M.; Kumar, R. Response surface methodology (RSM): An overview to analyze multivariate data. Indian J. Microbiol. Res. 2022, 9, 241–248. [Google Scholar]
- Chong, D.J.S.; Chan, Y.J.; Arumugasamy, S.K.; Yazdi, S.K.; Lim, J.W. Optimisation and performance evaluation of response surface methodology (RSM), artificial neural network (ANN) and adaptive neuro-fuzzy inference system (ANFIS) in the prediction of biogas production from palm oil mill effluent (POME). Energy 2023, 266, 126449. [Google Scholar] [CrossRef]
- Supramani, S.; Ahmad, R.; Ilham, Z.; Annuar, M.S.M.; Klaus, A.; Wan, W.A.A.Q.I. Optimisation of biomass, exopolysaccharide and intracellular polysaccharide production from the mycelium of an identified Ganoderma lucidum strain QRS 5120 using response surface methodology. AIMS Microbiol. 2019, 5, 19. [Google Scholar] [CrossRef]
- Abdullah, N.R.; Sharif, F.; Azizan, N.H.; Hafidz, I.F.M.; Supramani, S.; Usuldin, S.R.A.; Ahmad, R.; Wan, W.A.A.Q.I. Pellet diameter of Ganoderma lucidum in a repeated-batch fermentation for the trio total production of biomass-exopolysaccharide-endopolysaccharide and its anti-oral cancer beta-glucan response. AIMS Microbiol. 2020, 6, 379. [Google Scholar] [CrossRef]
- Stanbury, P.F.; Whitaker, A.; Hall, S.J. Principles of Fermentation Technology; Elsevier: Amsterdam, The Netherlands, 2013. [Google Scholar]
- Elsadig, E.E.; Ali, A.E.B.; Abdelgadir, M.I. Comparative Study of some Physicochemical Properties of Extracted Oil from Modified and Non-modified Cottonseeds. J. Food Sci. 2023, 4, 1–11. [Google Scholar] [CrossRef]
- Gu, S.; Wang, Z.; Wang, J. Untargeted rapid differentiation and targeted growth tracking of fungal contamination in rice grains based on headspace-gas chromatography-ion mobility spectrometry. J. Sci. Food Agric. 2022, 102, 3673–3682. [Google Scholar] [CrossRef]
- Pokhrel, C.P.; Ohga, S. Submerged culture conditions for mycelial yield and polysaccharides production by Lyophyllum decastes. Food Chem. 2007, 105, 641–646. [Google Scholar] [CrossRef]
- Zheng, X.; Cairns, T.C.; Ni, X.; Zhang, L.; Zhai, H.; Meyer, V.; Zheng, P.; Sun, J. Comprehensively dissecting the hub regulation of PkaC on high-productivity and pellet macromorphology in citric acid producing Aspergillus niger. Microb. Biotechnol. 2022, 15, 1867–1882. [Google Scholar] [CrossRef]
- Lau, B.F.; Abdullah, N.; Aminudin, N. Chemical Composition of the Tiger’s Milk Mushroom, Lignosus rhinocerotis (Cooke) Ryvarden, from Different Developmental Stages. J. Agric. Food Chem. 2013, 61, 4890–4897. [Google Scholar] [CrossRef]
- Sergeeva, Y.; Galanina, L.; Andrianova, D.; Feofilova, E. Lipids of filamentous fungi as a material for producing biodiesel fuel. Appl. Biochem. Microbiol. 2008, 44, 523–527. [Google Scholar] [CrossRef]
- Li, G.; Hao, Y.; Yang, T.; Xiao, W.; Pan, M.; Huo, S.; Lyu, T. Enhancing Bioenergy Production from the Raw and Defatted Microalgal Biomass Using Wastewater as the Cultivation Medium. Bioengineering 2022, 9, 637. [Google Scholar] [CrossRef]
- Lai, W.H.; Salleh, S.M.; Daud, F.; Zainal, Z.; Othman, A.M.; Saleh, N.M. Optimization of submerged culture conditions for the production of mycelial biomass and exopolysaccharides from Lignosus rhinocerus. Sains Malays. 2014, 43, 73–80. [Google Scholar]
- Ma, Y.; Yu, X. Effects of aqueous extracts of different traditional Chinese medicines on triterpenoid and extracellular polysaccharide production in Lignosus rhinocerus fermentation process. Mycosystema 2017, 36, 1667–1673. [Google Scholar]
- Lin, J.; Zhao, C.; Wu, C.-J.; Chen, C. Evaluation of effectiveness of liquid fermented Lignosus rhinocerus mycelium against H1N1 Influenza virus infections. Hans J. Food Nutr. Sci. 2020, 9, 201–210. [Google Scholar] [CrossRef]
- Lau, B.F.; Abdullah, N.; Aminudin, N.; Lee, H.B.; Yap, K.C.; Sabaratnam, V. The Potential of Mycelium and Culture Broth of Lignosus rhinocerotis as Substitutes for the Naturally Occurring Sclerotium with Regard to Antioxidant Capacity, Cytotoxic Effect, and Low-Molecular-Weight Chemical Constituents. PLoS ONE 2014, 9, e102509. [Google Scholar] [CrossRef]
Disclaimer/Publisher’s Note: The statements, opinions and data contained in all publications are solely those of the individual author(s) and contributor(s) and not of MDPI and/or the editor(s). MDPI and/or the editor(s) disclaim responsibility for any injury to people or property resulting from any ideas, methods, instructions or products referred to in the content. |
© 2023 by the authors. Licensee MDPI, Basel, Switzerland. This article is an open access article distributed under the terms and conditions of the Creative Commons Attribution (CC BY) license (https://creativecommons.org/licenses/by/4.0/).