Article

Characteristics of Porosity Distribution and Gas Migration in Different Layers of Comprehensive Working Face Goaf

1
School of Safety Science and Engineering, Xi’an University of Science and Technology, Xi’an 710054, China
2
China Construction Harbour and Channel Engineering Bureau Group Co., Ltd., Shenzhen 518108, China
*
Author to whom correspondence should be addressed.
Energies 2023, 16(5), 2325; https://doi.org/10.3390/en16052325
Submission received: 31 January 2023 / Revised: 21 February 2023 / Accepted: 23 February 2023 / Published: 28 February 2023

Abstract

:
The fracture field and permeability distribution model of comprehensive working face goaf was integrated upon the theoretical examination to investigate the fracture field distribution law of goaf and gas migration and accumulation characteristics, and this model has been applied to the mathematical model of gas migration and accumulation in goaf. The ANSYS FLUENT numerical simulation software was used to obtain the characteristics of gas migration and accumulation in goaf and its influencing factors and analyze the applicability of solving the features of gas migration and proliferation using the porosity model of layer division in goaf. The results were as follows: the porosity around the caving zone was a little big, whereas the porosity in the middle was a little small. The porosity was almost equal along the inclination and strike in a symmetrical distribution. The porosity occurred at the fracture zone with an “O” shape. As the gob layer height increased, the porosity tended to be small. The maximum value of the porosity of the goaf would shrink to the middle of the goaf with the increase of gob layer height. The gas mass fraction along the goaf inclination showed the growth characteristics of “exponential function”, the gas mass fraction along the goaf strike on the air inlet side showed the growth characteristics of “Boltzmann function”, and the gas mass fraction along the goaf strike on the air outlet roadway side manifested the growth characteristics of “linear function”. The main influencing factors were air leakage speed, negative pressure, and porosity distribution. The distribution model of porosity and permeability of different layers of gob can more accurately simulate the characteristics of gas migration and storage.

1. Introduction

Gas is always one of the key factors restricting and threatening the safe and efficient production of coal mines [1,2]. There are main concerns. One is to reduce the frequency of gas disasters, and the other lies in how to extract high-concentration gas for utilisation while improving coal production. Both issues catch and hold the mining public’s attention [3,4]. Mining behaviours lead to a large amount of pressure-relief gas flooding into the goaf, composed of mining-induced overburden rock and fractures [5,6]. Therefore, the goaf can be seen as a holistic structure with different pores and fractures, and gas transfuses and migrates from a gas enrichment region [7,8]. The porosity of goaf affects the gas concentration at the upper corner and the airflow, and the gas concentration determines the mining speed of the working face. Accordingly, it is necessary to study the fractures, pores distribution, gas migration, and accumulation characteristics of the goaf [9,10] so as to provide a scientific basis for high-concentration and high-efficiency drainage of pressure-relieved gas [11,12].
In essence, the caving zone and fractured zone of goaf are the main channels for gas migration, but the accumulation modes of rocks in the caving zone and fissure zone are different [13]. The caving zone constantly fractured and caved and then accumulated together, forming a natural accumulation area, a load-affected area, and a re-compaction area. Because of its irregular caving structure, it can be regarded as a porous medium [14]. Therefore, some scholars have suggested relevant theoretical algorithms to calculate the porosity distribution characteristics of the caving zone [15,16]. Vertical broken fractures and transverse interlayer fractures are formed after the rock of the fractured zone is broken [17]. It cannot be regarded as a porous media. Therefore, there is no mature theoretical method to express the porosity distribution characteristics of the fracture zone. According to research, the porosity steadily decreases from the caving zone to the fracture zone [18,19,20]. Therefore, it can be assumed that the porosity decreases as a linear or exponential trend to describe the porosity change in the goaf, but the conclusion drawn is not quite accurate.
When a relatively accurate porosity distribution model is acquired, the permeability distribution model can be calculated [21,22,23], obtaining the characteristics of gas migration and storage. This paper took the porosity distribution of goaf at the side of the cut eye and working face to receive goaf gas migration accumulation characteristics more accurately. It integrated the porosity distribution characteristics of the caving zone and fracture zone. Meanwhile, the porosity distribution model of goaf was received from the predecessors’ research. After the source and quantity of gas emission were determined, ANSYS FLUENT numerical simulation software was employed to simulate the gas migration and storage in goaf. The characteristics of gas migration and storage in goaf were acquired. Its applicability was, in turn, tested, laying a foundation for determining a gas extraction scheme in goaf as well as safe and efficient mining.

2. Mathematical Model of Gas Migration and Storage in Goaf

The caving and fracture zones are the main gas migration channels in the goaf, including air and gas migration. Gas sources are mainly coal walls, adjacent layers, and residual coal [24,25,26]. Therefore, this section contained two parts: distribution characteristics of porosity and permeability in goaf and governing equation of gas flow in goaf.

2.1. Porosity and Permeability of Different Layers of Gob

The caving zone is formed by roof collapse and accumulation of breaking down rocks, which can be directly regarded as a porous medium. Fracture rotation of rock strata in the fracture zone broke and rotated, resulting in vertical broken fractures and transverse interlayer fractures. Because of the different discontinuous modes of rocks in the caving zone and fracture zone, the porosity and permeability of each area should be calculated according to other calculation methods. The coal seam is nearly horizontal, so the caving zone porosity can be calculated by Equation (1) [27]:
φ G ( x , y , z ) = 1 + e 0.15 l y 2 | y | 1 h d h d + H H h d K p b 1 1 e x 2 l
where φ G ( x , y , z ) is the porosity of the caving zone, ly is the dipping direction length of working face (m), hd is the primary roof thickness (m), H is mining height (m), Kpb is the residual broken expansion coefficient after stabilisation of immediate broken down roof, and l is the average broken length of the primary roof (m).
After rock strata collapsed, the broken rocks formed to masonry beam structure, the unmatched movement of adjacent rock layers formed a movement curve, and the porosity of the fracture zone can be calculated by Equation (2) [28]. The subsidence amount of two adjacent layers of the fracture zone was different, thus forming a gap. According to the definition of porosity, the difference in subsidence amount of two adjacent layers is shown in Equation (3):
w ki ( x , y ) = w 0 i 1 e x 2 l 1 e l y / 2 - | y | 2 l i 1 e l y 4 l i
φ G ( x , y , z ) = φ i , i + 1 = Δ w ki   d x d y Δ Σ h i   d x d y = w ki w ki + 1 Σ h i Σ h i + 1
where φ i , i + 1 is the porosity of the fracture zone, Δ w ki is the difference in subsidence between two adjacent layers (m), Δ Σ h i is the height difference between adjoining rock layers (m), and li is the broken length of rocks (m).
The permeability and porosity of goaf meet the Blake–Kozeny relation [29,30], as shown in Equation (4):
k G = D p 2 φ G ( x , y , z ) 3 150 ( 1 φ G ( x , y , z ) ) 2
where kG is the permeability of the caving zone and fracture zone (m2), and DP is the average grain size of broken rocks in goaf (m).

2.2. Governing Equations of Gas Flow

2.2.1. Continuity Equation of Gas

When the fluid flows in the goaf, the inflow and outflow masses of a differential control volume are the same, and the fluid continuity equation upon on the mass conservation law is shown in Equation (5):
( ρ u ) = S m
where ρ is the density of mixed air (kg/m3), u is the fluid velocity vector in x, y, and z directions (m/s), and Sm is the quality of the source (kg/(m2·s)).

2.2.2. Equation of Momentum Conservation

Assuming that the goaf is a porous medium, the gas flow in the goaf meets the momentum conservation equation. Accordingly, the sum of external forces is the momentum change. The gas flow in the goaf receives resistance from the porous medium, which can be divided into viscous and inertial. Therefore, the momentum conservation equation of gas flow in the goaf is as follows:
t ( ρ u ) + ( ρ u u ) = P + ( τ ¯ ¯ ) + ρ g φ G ( x , y , z ) μ K G u C 2 1 2 ρ | u | u
where P is the hydrodynamic pressure (Pa), τ ¯ ¯ is the viscous stress tensor (Pa), τ ¯ ¯ = μ ( u + u T ) , and μ is the coefficient of kinetic viscosity (Pa·s). If the gas flow in the goaf is laminar, the inertial resistance term can be ignored, and C2 is 0.

2.3. Re-Normalisation Group (RNG) K-ε Model of Gas Transport

Compared with the standard K-ε gas transport model, the RNG K-ε gas transport model can more accurately describe high-speed gas flow and eddy current flow state. The most important thing is that it considers the low-speed flow in the goaf while calculating the high-speed flow in the goaf [27]. Therefore, the RNG K-ε gas transport model was used to describe the gas flow in the goaf in this paper.
t ( ρ k ) + x i ρ k u i = x j α k μ eff k x j + G k + G b ρ ε Y M + S k
t ( ρ ε ) + x i ρ ε u i = x j α ε μ eff ε x j + C 1 ε ε k G k + C 3 ε G b C 2 ε ρ ε 2 k R ε + S ε
Equation (7) is the gas turbulence equation [31,32]. k is the turbulence kinetic energy, ui is the fluid velocity vector in x, y, and z directions (m/s), α k is the inverse of the effective Prandtl number, ueff is the effective dynamic viscosity (Pa·s), Gk is the turbulent kinetic energy caused by the average velocity gradient, Gb is the turbulent kinetic energy generated by buoyancy, ε is the dissipation rate of turbulent kinetic energy, YM is the contribution of fluctuating expansion to the total dissipation rate in compressible turbulence, and Sk is the source term. Equation (8) is the gas diffusion equation. α ε is the inverse of the effective Prandtl number of ε equation, C and C is the experience constant, C is the experience constant when the gas rising and floating conditions have been considered, Rε is an additional term for the state of rapid gas flow, and Sε is the defined source term.

2.4. Mass Conservation Equation of Gas Components

If the chemical reaction between different gases is not considered in the goaf, the inflow gas mass source term should transform into diffusion term, convection term, and gas mass residual term:
ρ c s t + ρ u c s D s ρ c s = S s
where cs is the volume fraction of a component gas, ρcs is the mass concentration of the component gas (kg/m3), Ds is the diffusion coefficient of component gas (m2/s), and Ss is the residual gas mass term [33,34].

2.5. Fluid Equation of State

The state equation of the mixed gas in the goaf can be derived according to the state equation of the ideal gas, as shown in Equation (10):
p ρ gas = R T M gas
where p is the gas pressure (Pa), ρgas is the density of methane (kg/m3), and Mgas is the molar mass of methane (g/mol) [35,36].

3. Numerical Simulation of Gas Migration and Reservoir Characteristics in Goaf

3.1. Overview of Test Working Face

3.1.1. Lithologic Parameters of Overlying Strata on the Working Face

From Table 1, the average coal thickness of a working face was 3 m, the design mining length was 2300 m, and the inclination length was 220 m. The U-shaped ventilation mode was adopted. The coal seam was near the horizontal coal seam, and the immediate roof of the coal seam was 6 m.

3.1.2. Gas Emission from the Working Face

According to the separate source prediction in the mine gas emission prediction method, the gas emission quantity of the coal wall in front of the working face was 35.4 m3/min. The gas emission from the adjacent layer was 10.5 m3/min. The mining percentage was about 95%, and the residual coal emission amount was 1.86 m3/min.

3.2. Establishment of Geometric Model

This model includes goaf in Figure 1, working face, air inlet, and air outlet roadway. The goaf was 60 m high, 220 m wide, and 300 m long. It was composed of a caving zone and fracture zone, and the height of the collapse zone was 10 m. The working face size was 220 m × 10 m × 4 m, and the size of the inlet and outlet air roadway was 4 m × 20 m × 4 m.

3.3. Mesh Generation and Test System Setup

The test adopted the sweeping method to divide the grid. The unit size of the working face, air inlet roadway, and air outlet roadway was 1 m, the unit size of the caving zone was 5 m, and the unit size of the fracture zone was 10 m. A total of 15,208 units were divided, and the number of nodes was 22,172.
The test system included a mathematical model, gas composition, unit region, and boundary conditions. The mathematical model of gas migration and storage in goaf was deliberately selected as the mathematical model. The gas components include CH4, O2, and N2. Three gas emission sources were set in the unit area conditions: the working face, the caving zone, and the adjacent layer. The flow state of gas in the fracture zone was set as laminar flow, so the momentum conservation equation that ignored the inertia resistance term was adopted, and the momentum conservation equation considering the inertia resistance term was adopted in the caving zone, working face, air inlet roadway, and air outlet roadway. Furthermore, the boundary conditions of the air inlet and outlet tunnels were set. The air inlet tunnel was set as the velocity type inlet condition, the air outlet tunnel was set as the pressure type outlet condition, and other surfaces of the model were selected as the wall condition.

4. Test Results and Analysis

4.1. Distribution Characteristics of Porosity in Caving Zone and Fracture Zone

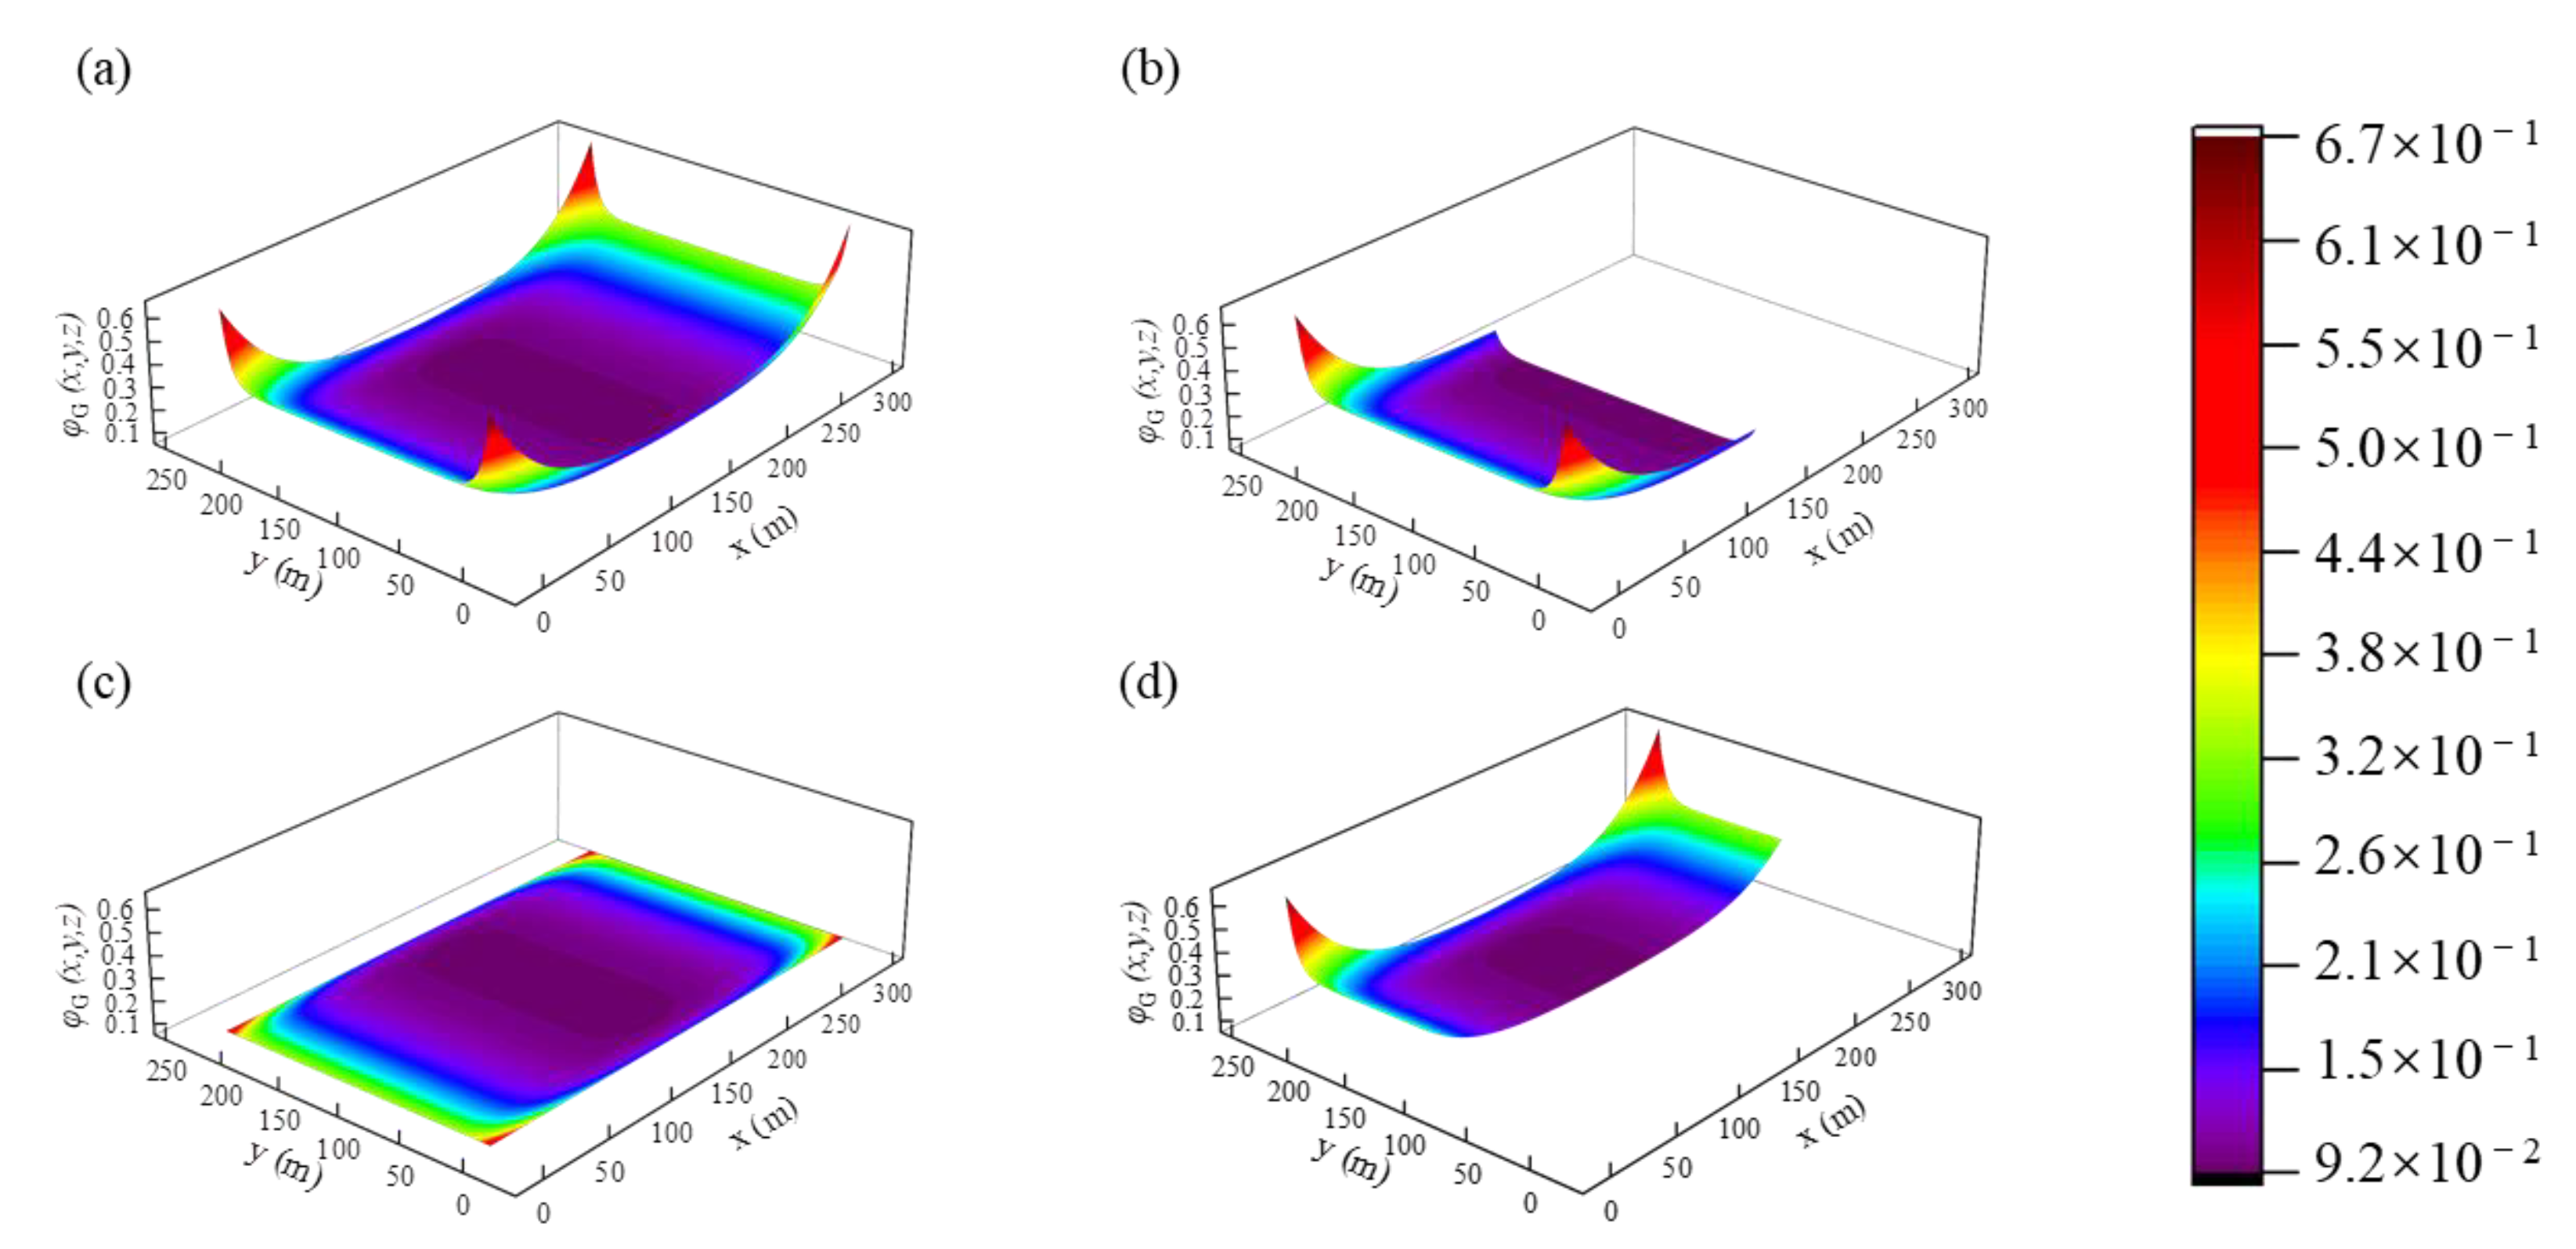
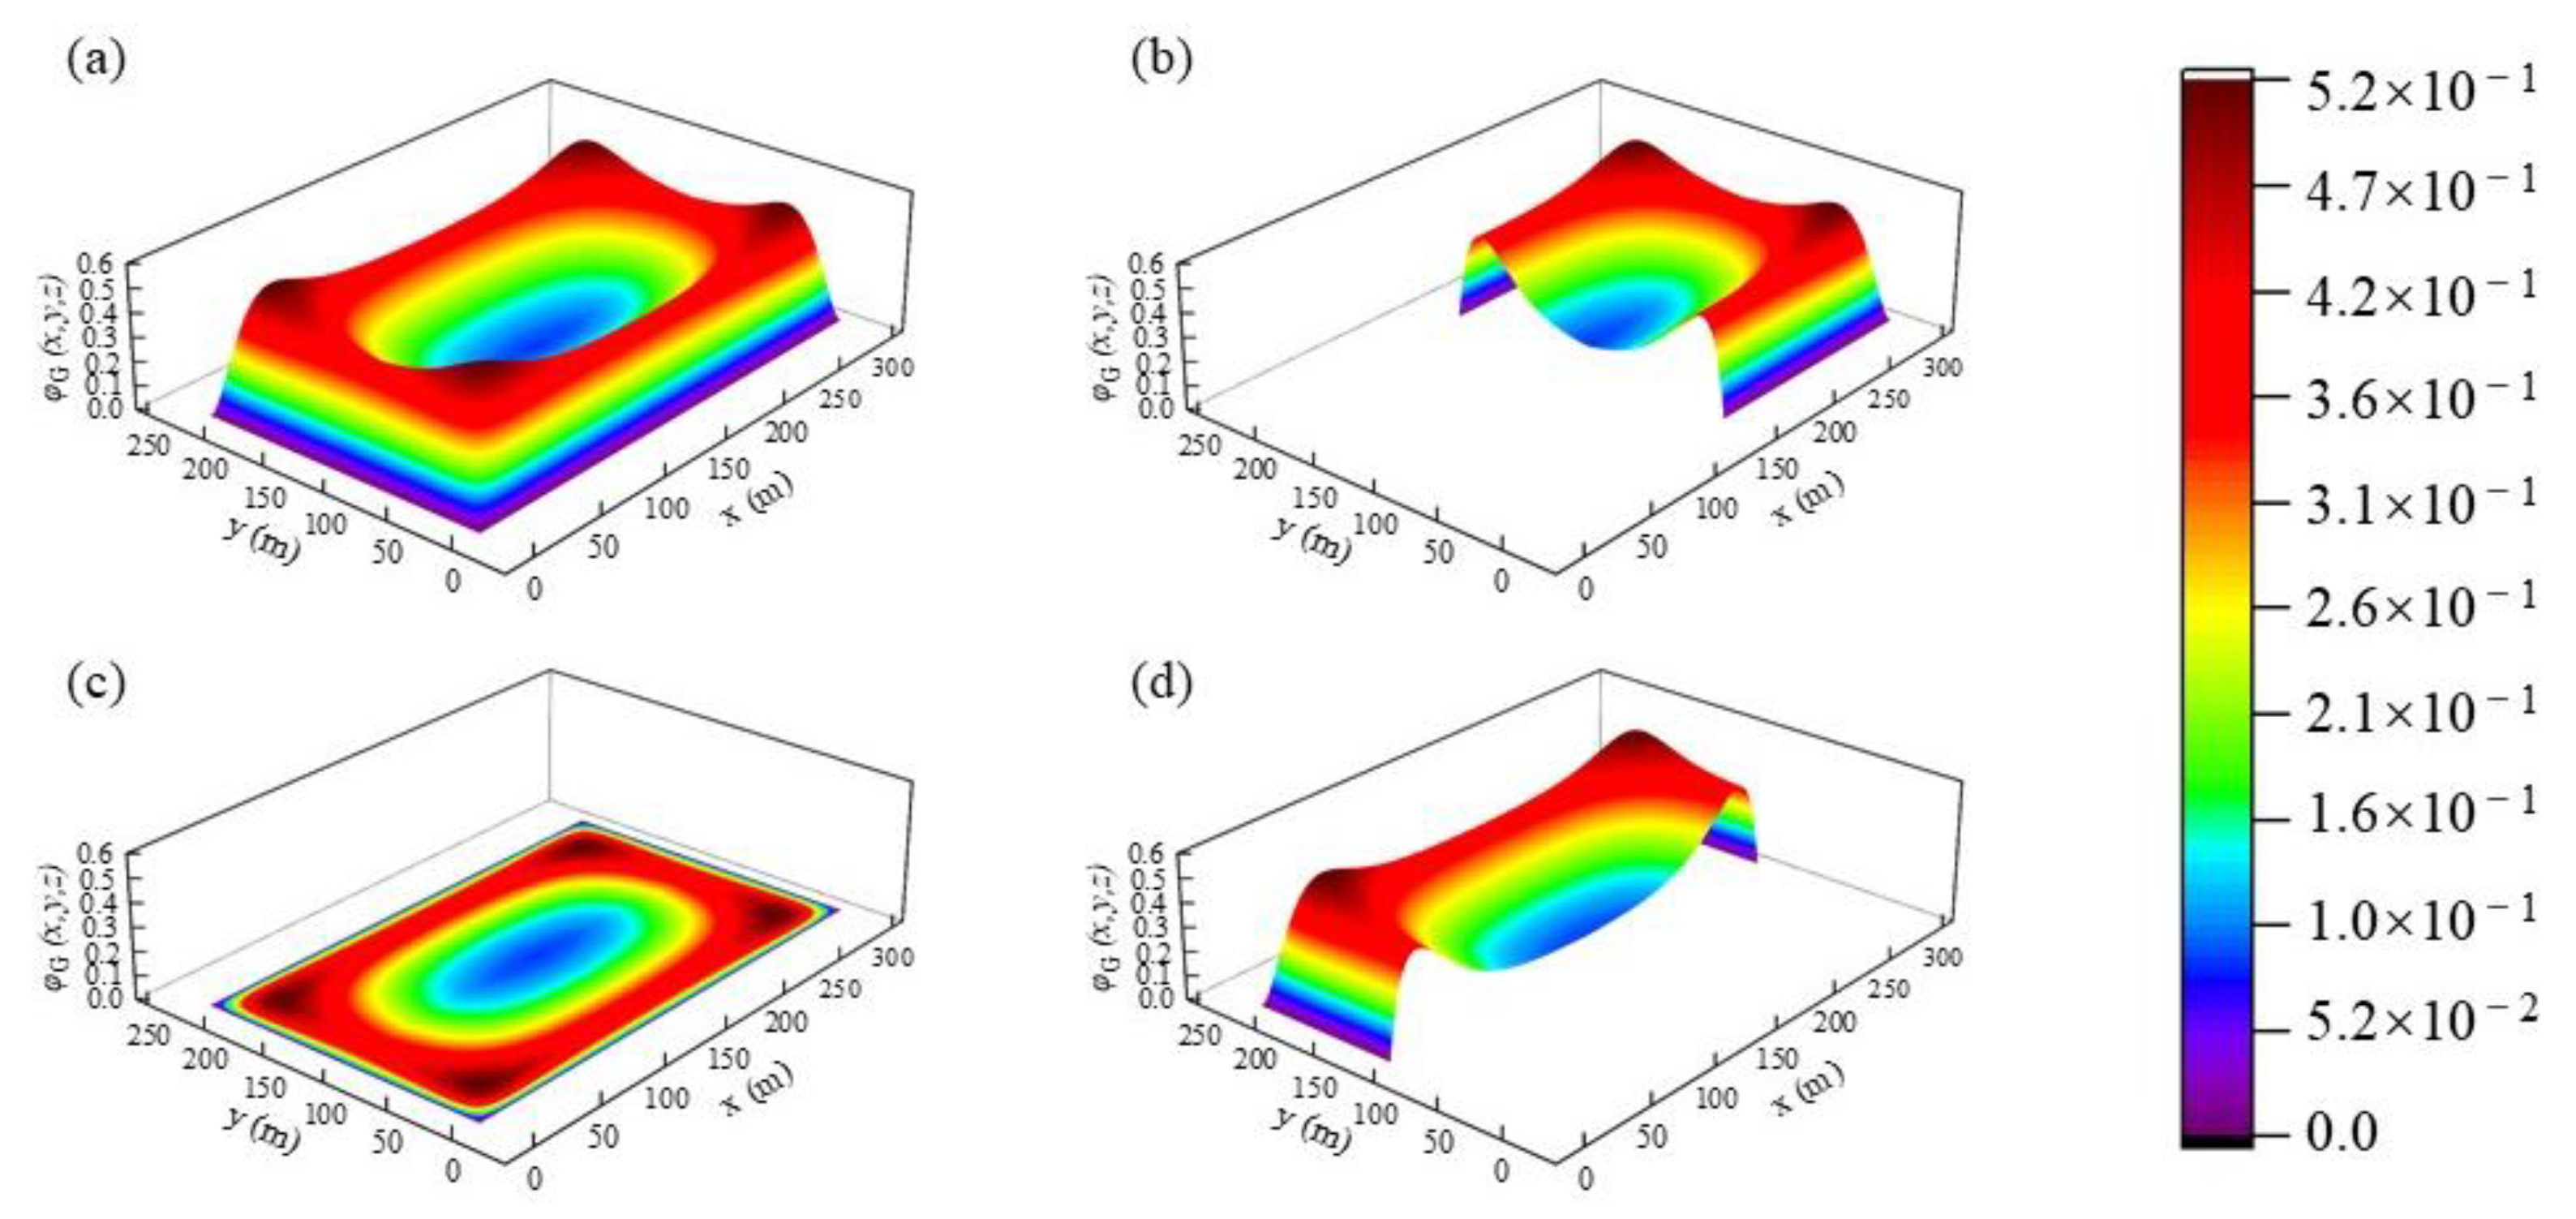
According to the lithologic parameters of the overlying strata of the working face and Equations (1)–(3), the distribution characteristics of the porosity in the caving zone are drawn, as shown in Figure 2. The distribution characteristics of the porosity between adjacent strata in the fracture zone are illustrated in Figure 3. As the distribution characteristics of the porosity between other adjacent strata are similar, it would not be repeated.
It can be observed from Figure 2 that the porosity around the caving zone was a little big, and the porosity in the middle was a little small; the reduction rate steadily decreased and finally reached 0. The distance from the working face was positioned to the position where the reduction rate tended to 0 was 50 m; in the actual production process, the side of the working face was within the goaf, followed by a natural accumulation area, a load-affected area, and the re-compaction area, the distance from the working face to the area where the void ratio of the caving zone tended to be flat was 50–60 m, indicating that the calculation model can represent the actual porosity distribution in the field. To facilitate the subsequent description of gas migration characteristics in the goaf, we assumed that the side of cut eye also had the same features. Therefore, the porosity almost equalled along the inclination and strike in a symmetrical distribution.
From Figure 3, it can be seen that the porosity of the fracture zone was small around and increased first and then decreased towards the middle of the goaf. From Figure 3c, it can be seen that the porosity presented an “O” shape, which was the same as the “O” shape distribution characteristic obtained in the literature [37], indicating that this calculation model can be used to represent the porosity characteristics of the fracture zone.
The comparison between Figure 2 and Figure 3 demonstrated the maximum porosity value in the caving zone that appeared in the roof arc triangular block area. The maximum value of the porosity of the goaf would shrink to the middle of the goaf with the increase of gob layer height.

4.2. Characteristics of Gas Migration and Accumulation

According to the mathematical model of gas migration and storage in goaf, the characteristics of gas migration and storage in goaf obtained by using FLUENT numerical simulation software are portrayed in Figure 4.

4.2.1. Characteristics of Gas Migration and Accumulation in the Strike Direction

To probe the distribution characteristics of gas mass fraction in the caving zone and fracture zone in the strike direction, a comparison diagram of the gas mass fraction at the side of the caving zone and the air inlet roadway was drawn according to Figure 4a. A comparison diagram of the gas mass fraction at the side of the fracture zone and the air inlet roadway was drawn according to Figure 4b, as shown in Figure 5a,b.
It can be seen from Figure 5 and Table 2 that with the increase of the depth of the goaf, the gas mass fraction of the fracture zone and the caving zone gradually increased. The gas mass fraction at the side of the air inlet roadway illustrated the growth characteristics of the “Boltzmann function”, and the air outlet roadway demonstrated the growth characteristics of the “linear function”.

4.2.2. Characteristics of Gas Migration and Accumulation in the Inclination Direction

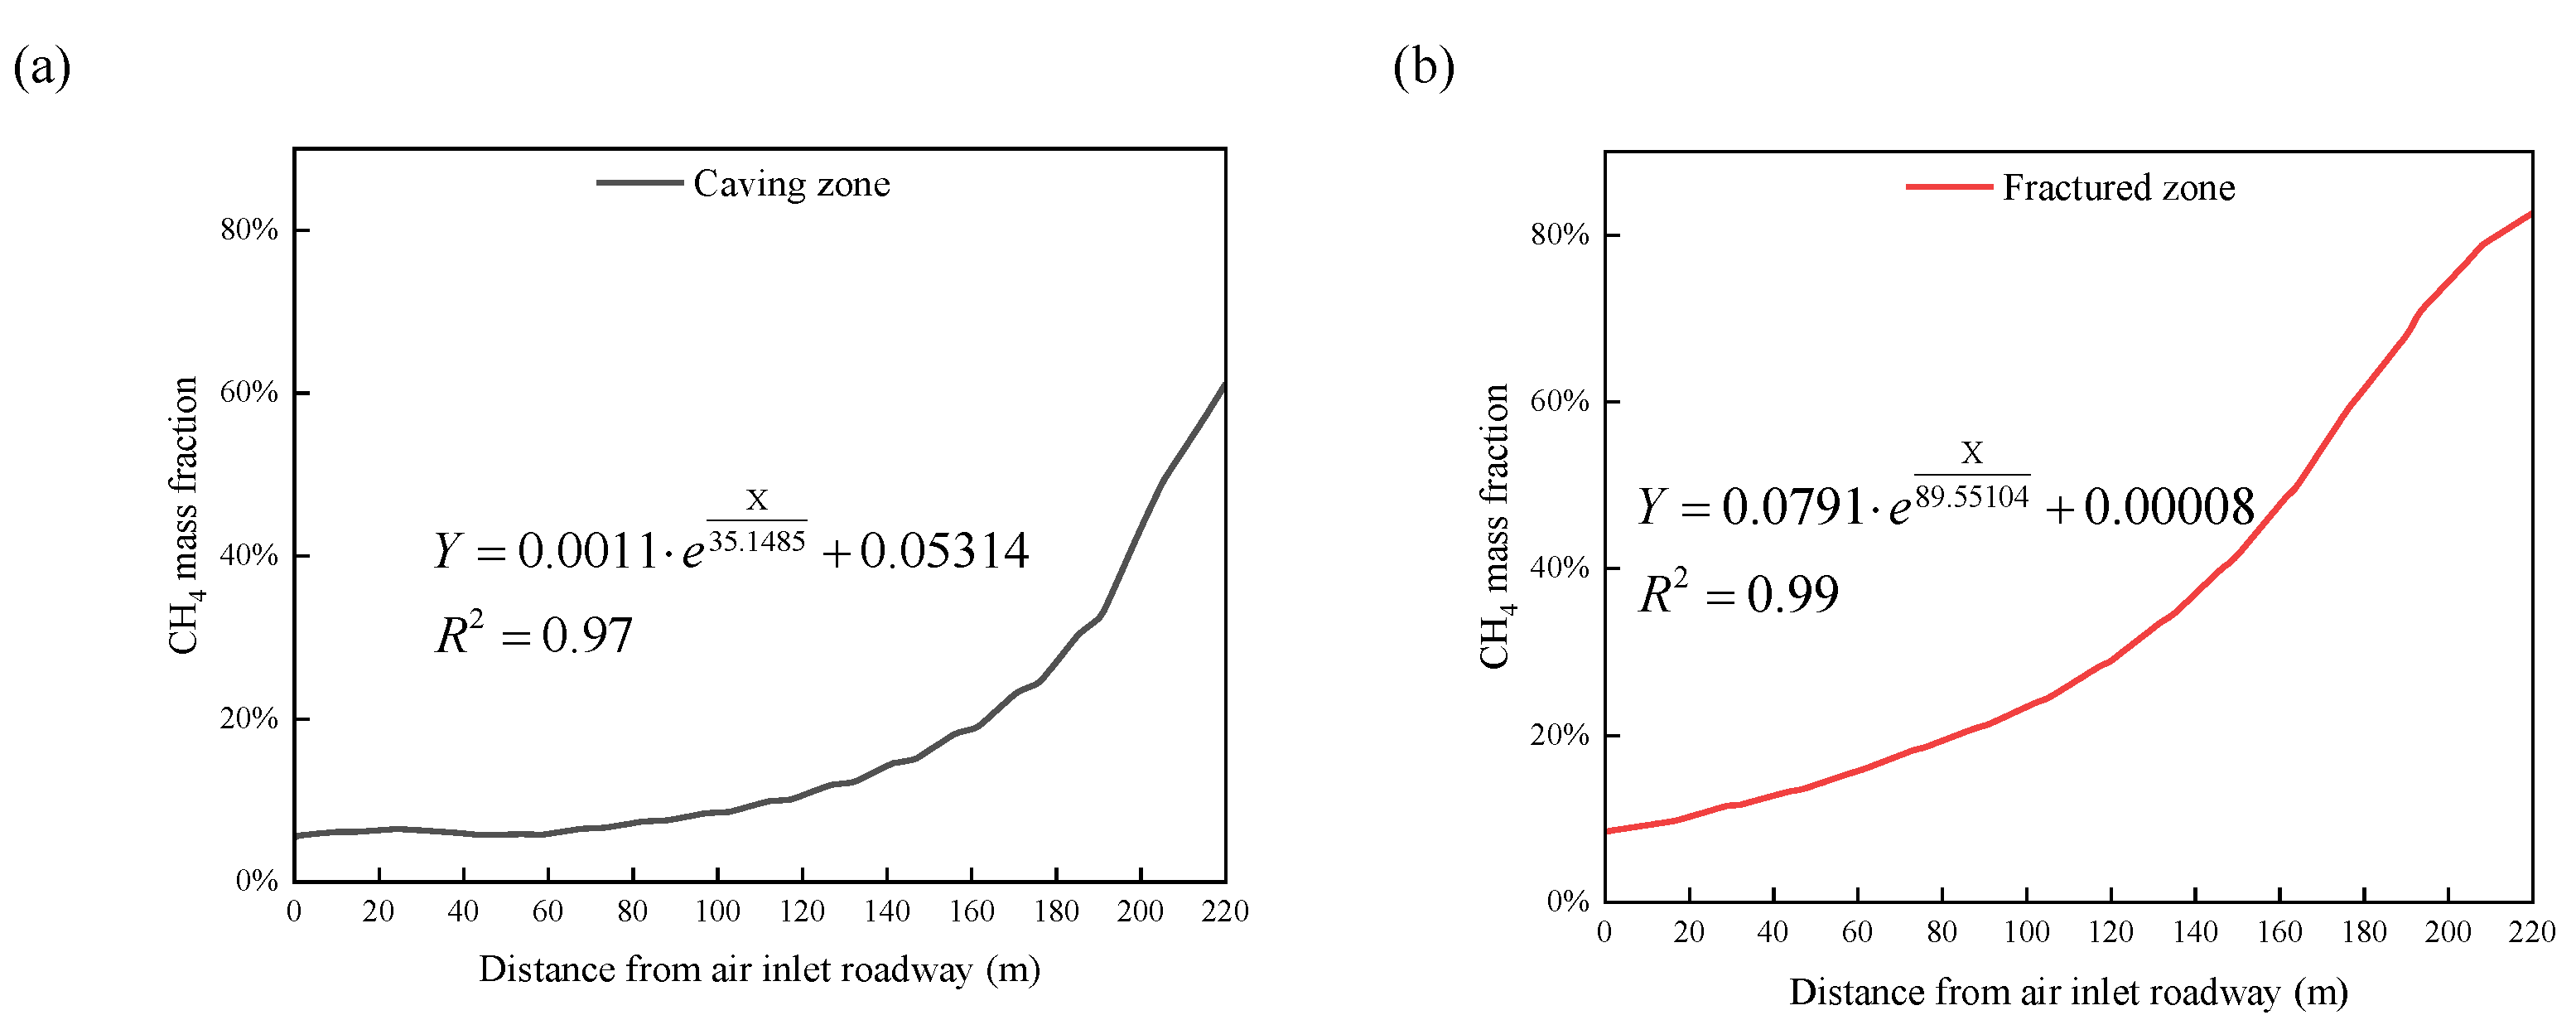
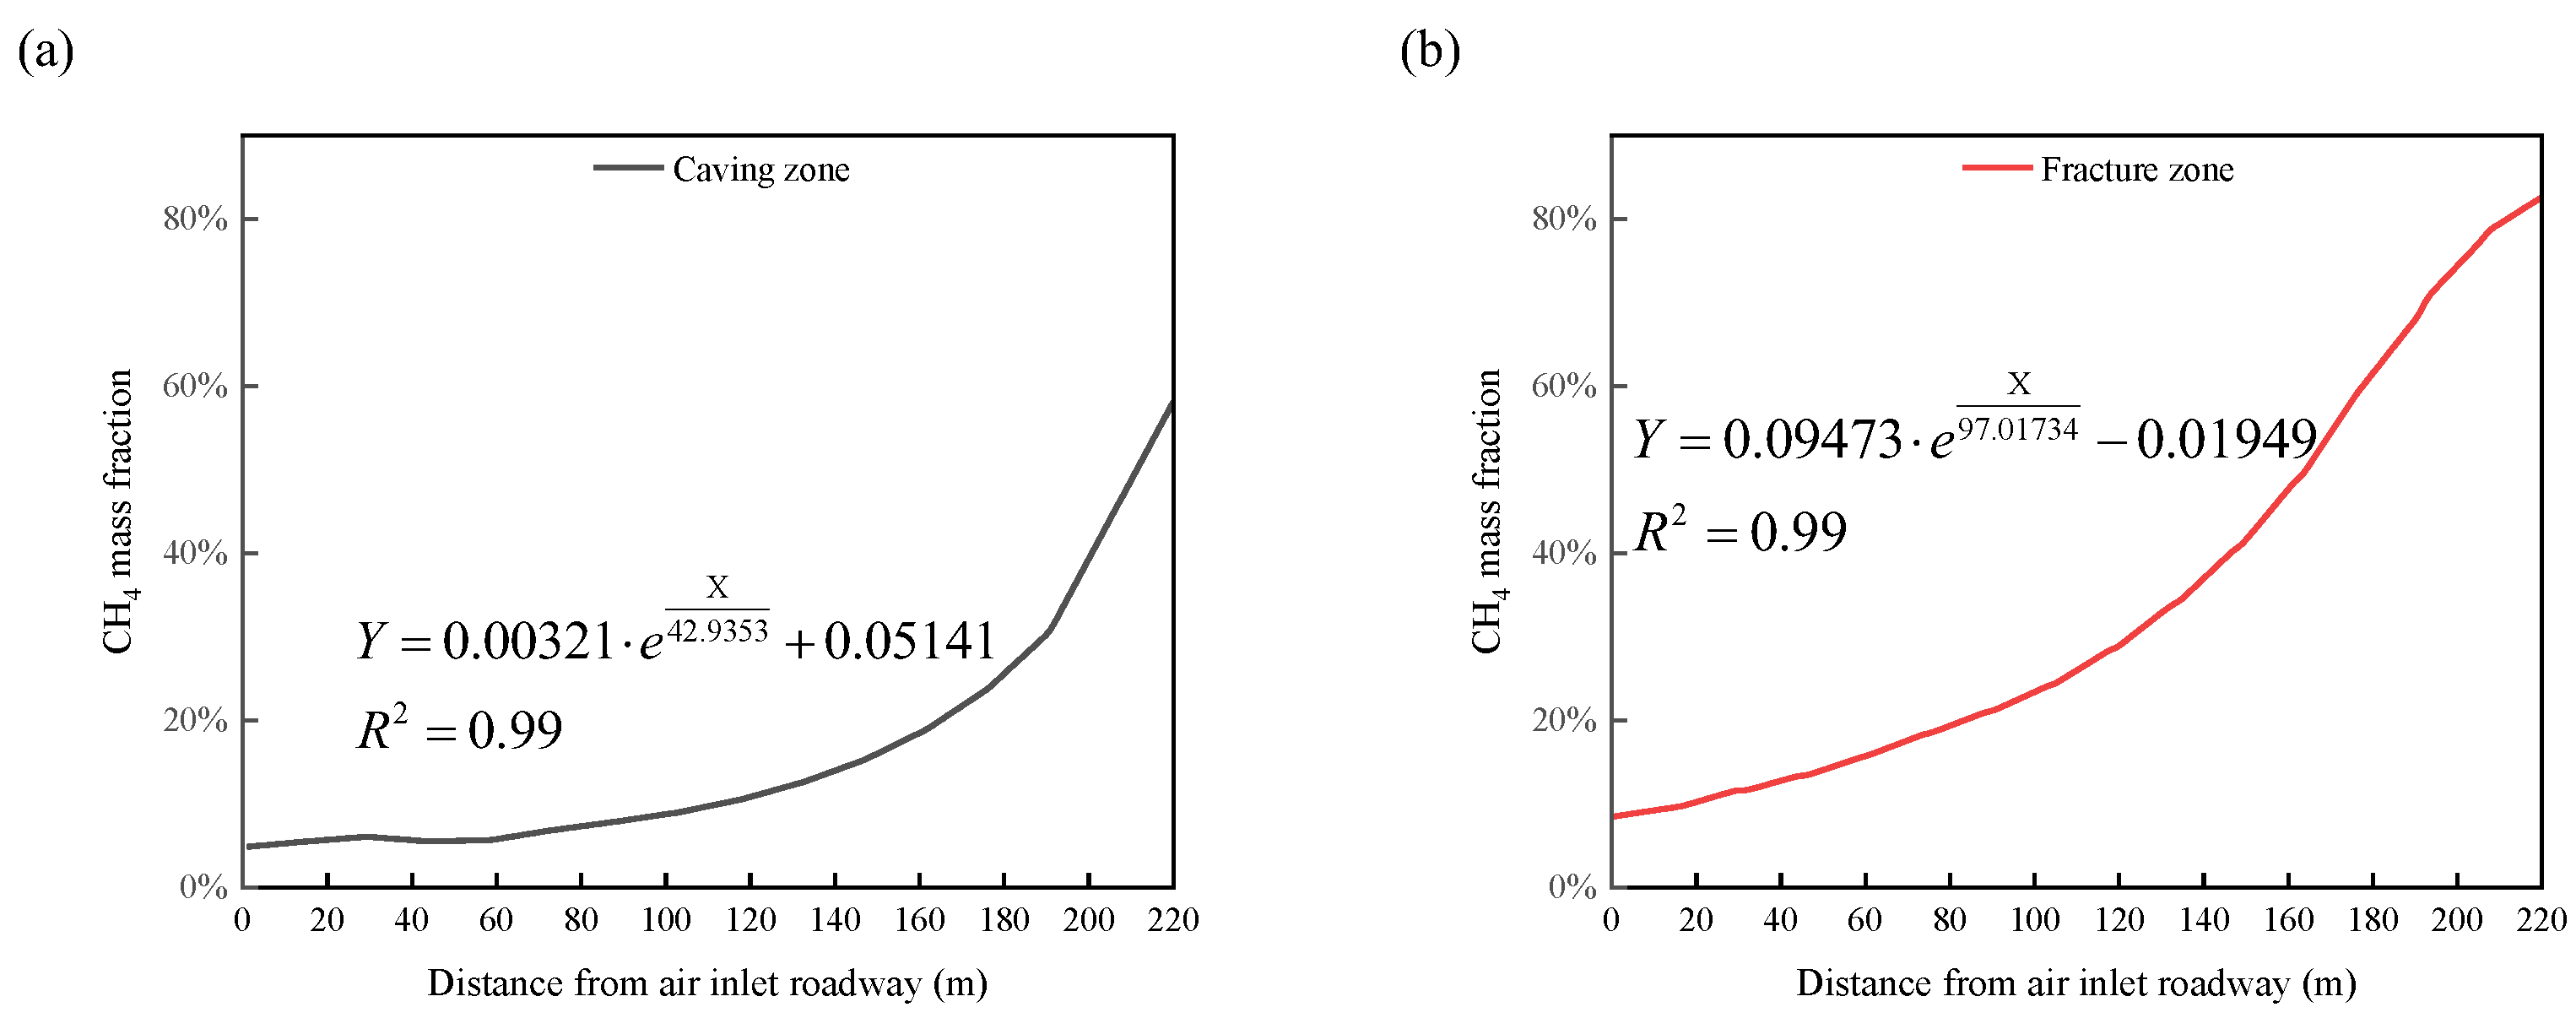
The variation curve of gas mass fraction in the caving zone and fracture zone in the inclination direction was drawn to explore the distribution characteristics of gas mass fraction in the inclination direction of the caving zone and fracture zone, as delineated in Figure 6.
According to Figure 6, the gas mass fraction distribution curve in the inclined direction exhibited the growth characteristics of “exponential function”.

4.2.3. Characteristics of Gas Migration and Storage in Different Layers of Goaf

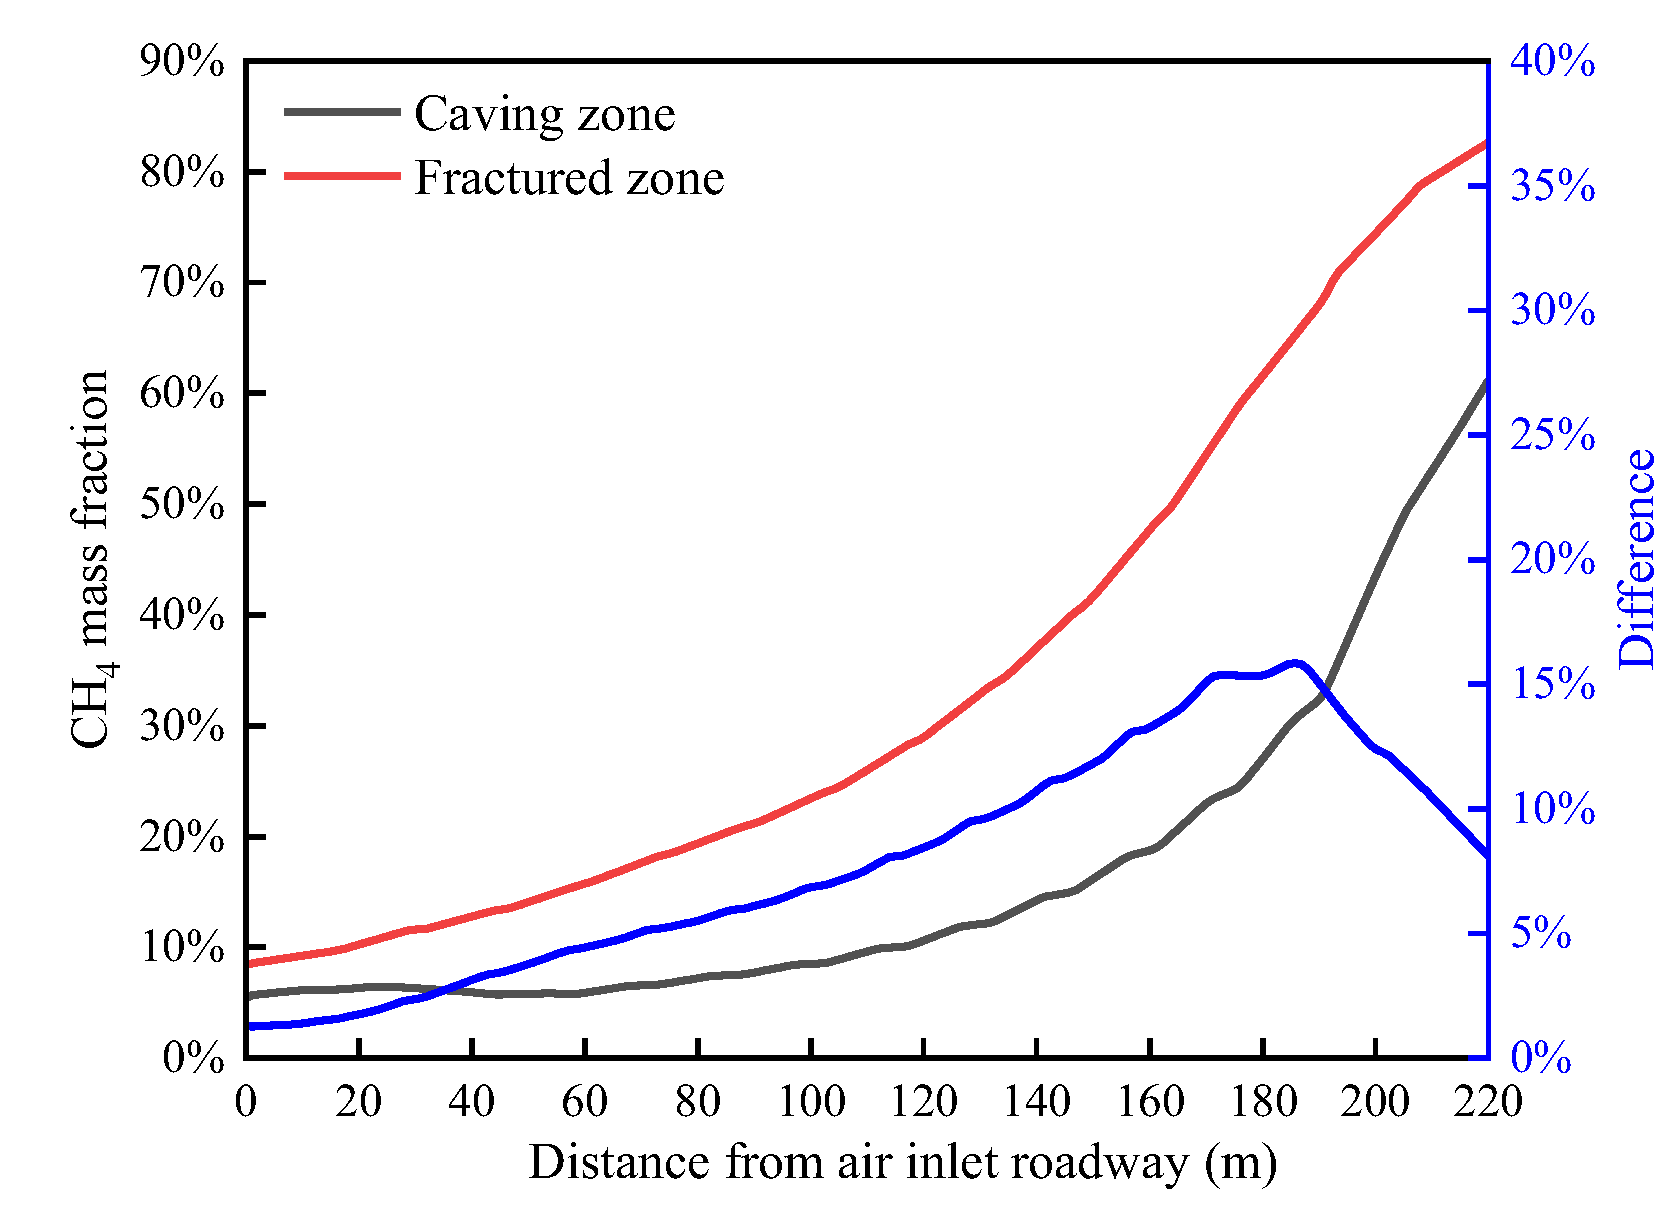
When delving into the characteristics of gas migration and storage in different layers, the difference between the gas mass fraction of the caving zone and the fracture zone are shown in Figure 7.
As can be seen from Figure 7, the gas mass fraction in the fracture zone was greater than that in the caving zone, which was caused by the rising and floating effect of the gas. The maximum value of the difference appeared at 185 m away from the air inlet roadway, rather than the side of the air outlet roadway, which was precisely caused by the maximum value of porosity of goaf would shrink to the middle of goaf with the increase of gob layer height.

4.3. Influencing Factors of Gas Migration and Reservoir Characteristics

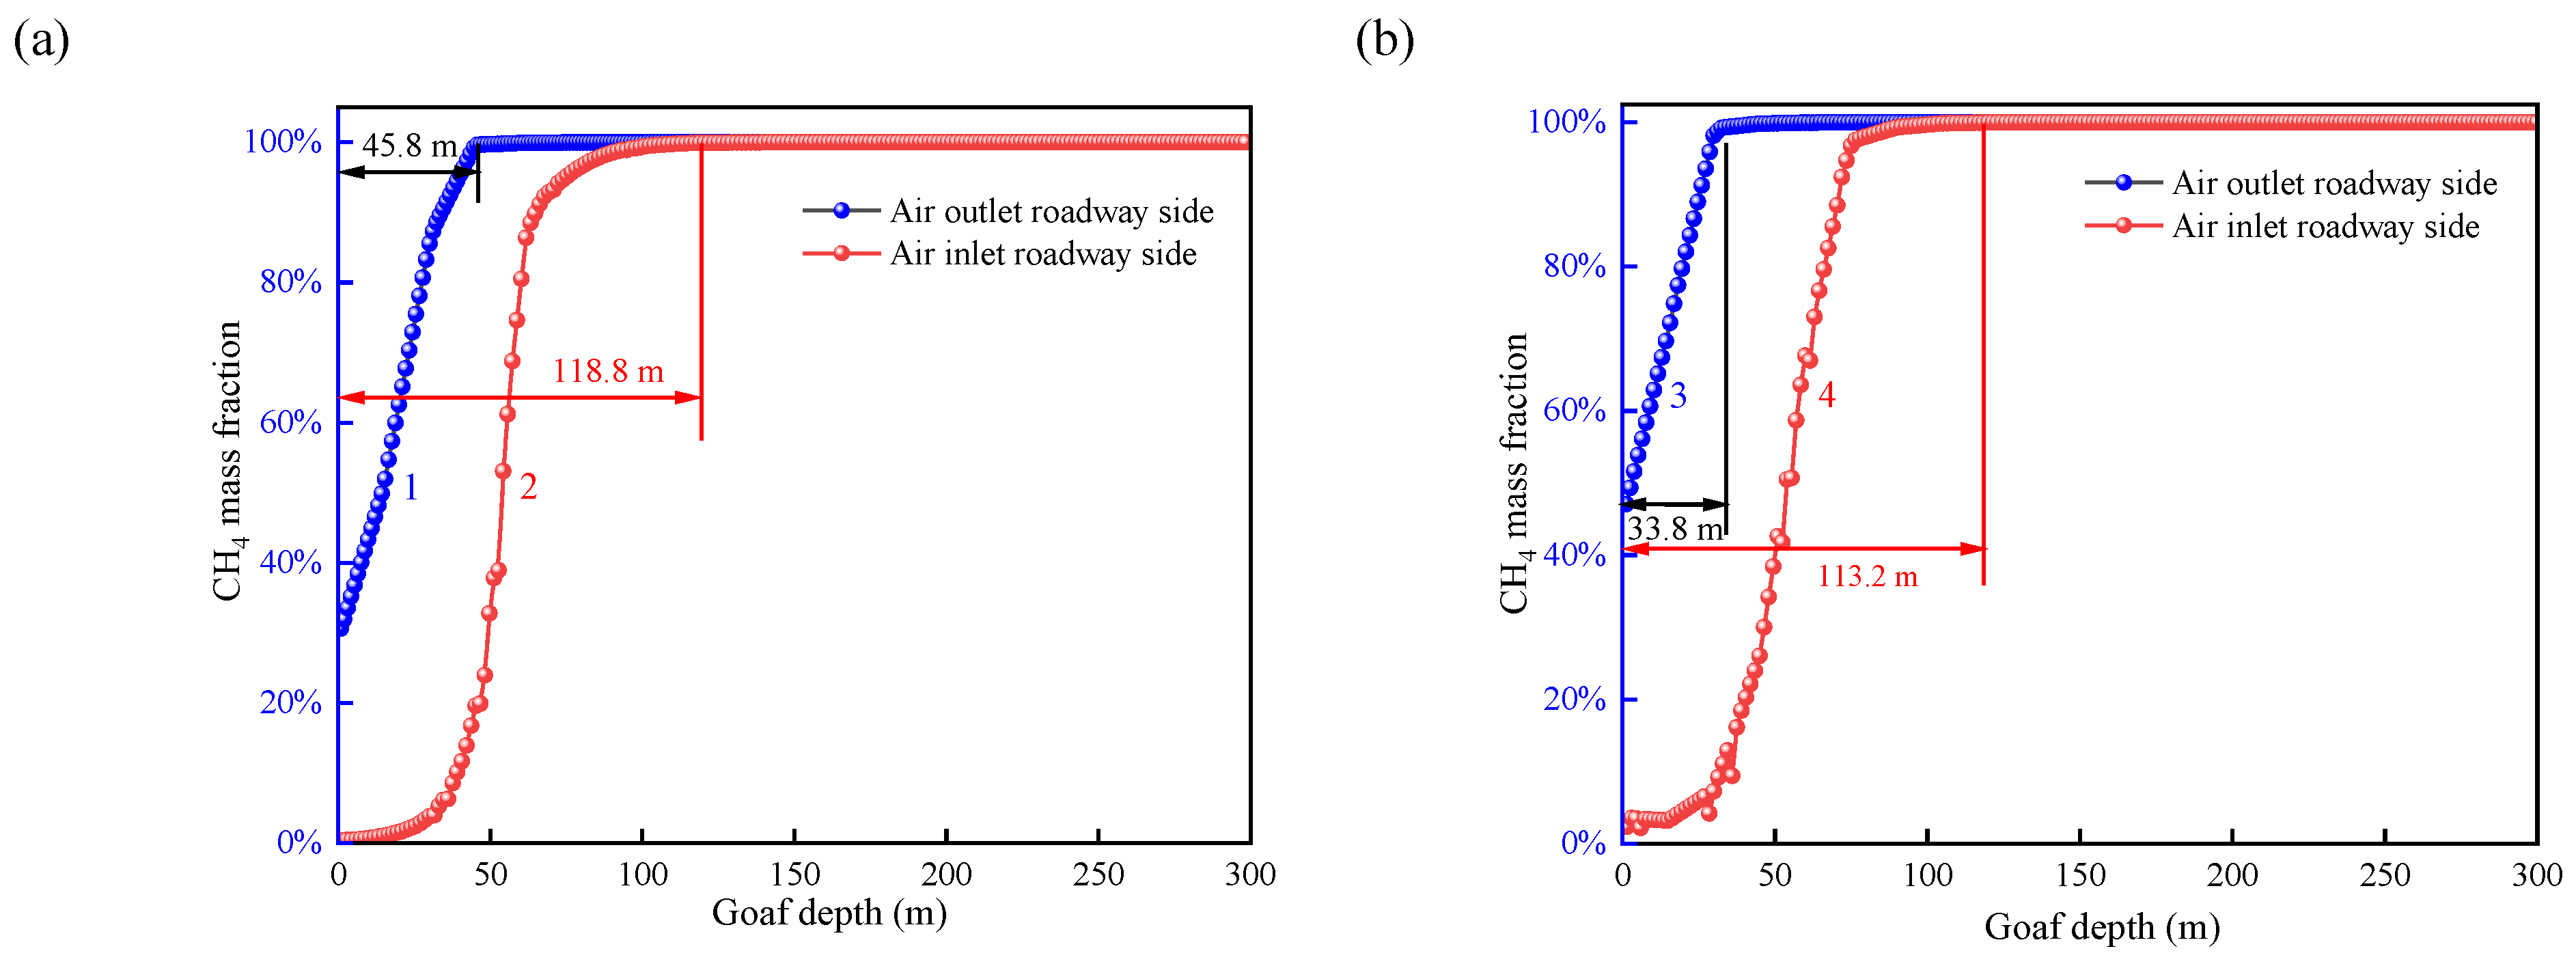
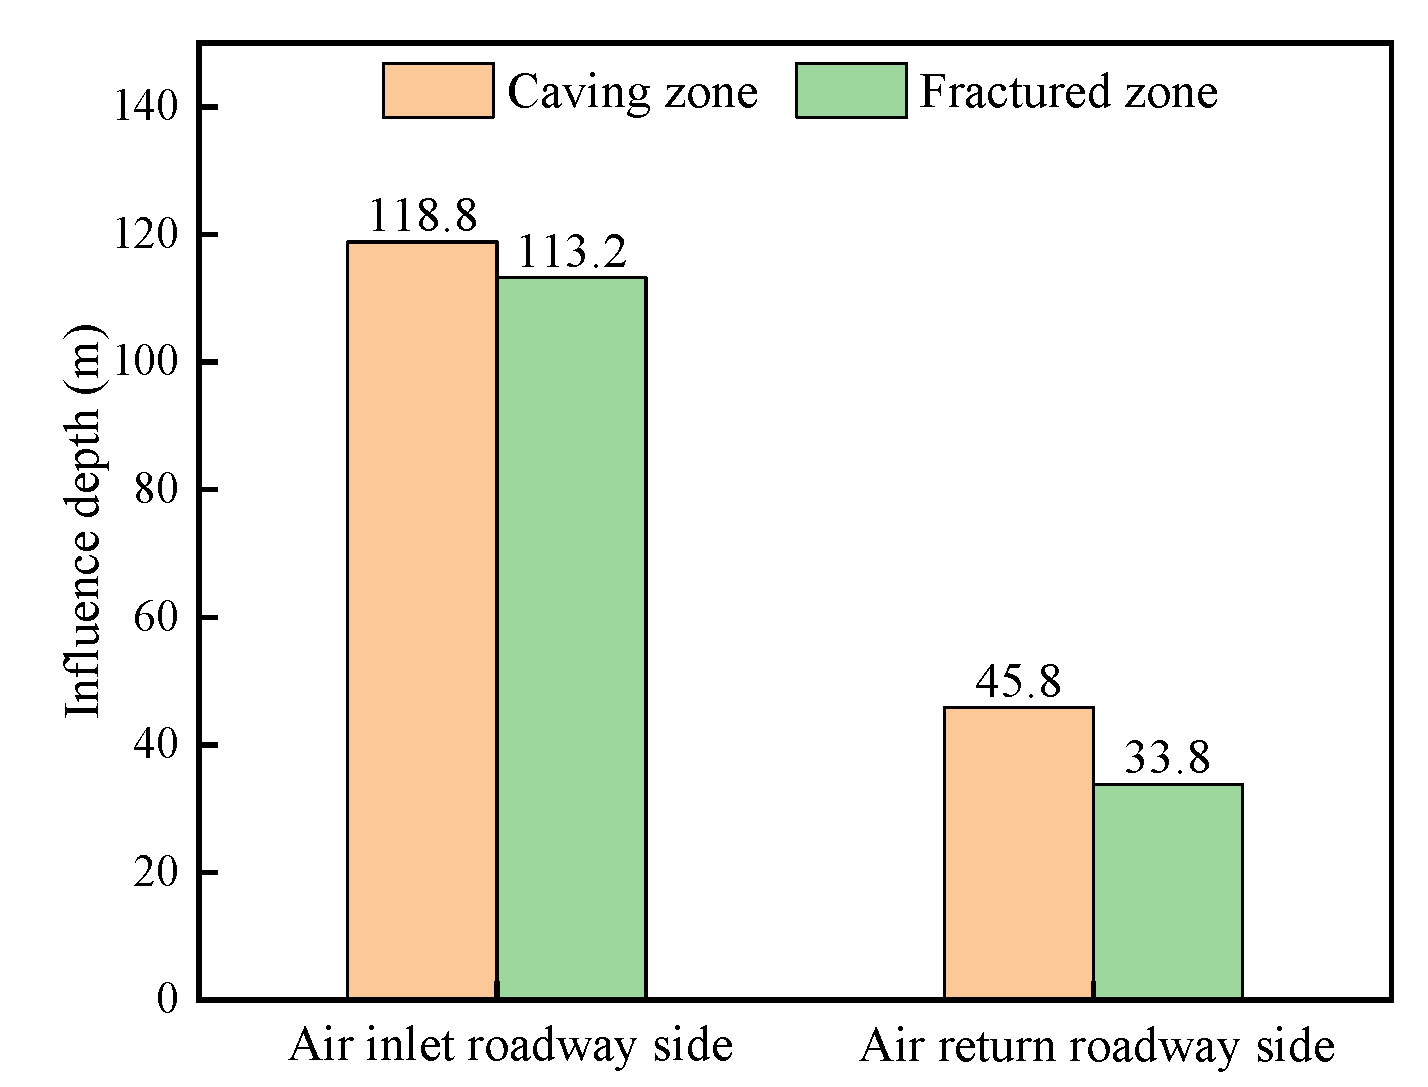
At this time, the influencing factors of gas migration and reservoir characteristics were analyzed by comparing the influence depth of gas mass fraction in the strike direction and the changes of gas mass fraction in the inclination direction.
According to Figure 8, the influence depth of the gas distribution characteristics of the caving zone at the side of the air inlet roadway was 118.8 m. The influence depth of the gas distribution characteristics of the fracture zone at the side of the air inlet roadway was 113.2 m, indicating that with the increase of the layers, the porosity decreased, and the influence of wind speed gradually weakened. The influence depth of the gas distribution characteristics of the caving zone at the side of the outlet air roadway was 45.8 m, and the influence depth of the gas distribution characteristics of the fracture zone at the side of the outlet air roadway was 33.8 m, indicating that, with the increase of the layers, the porosity decreased. The influence of negative pressure revealing weakened.
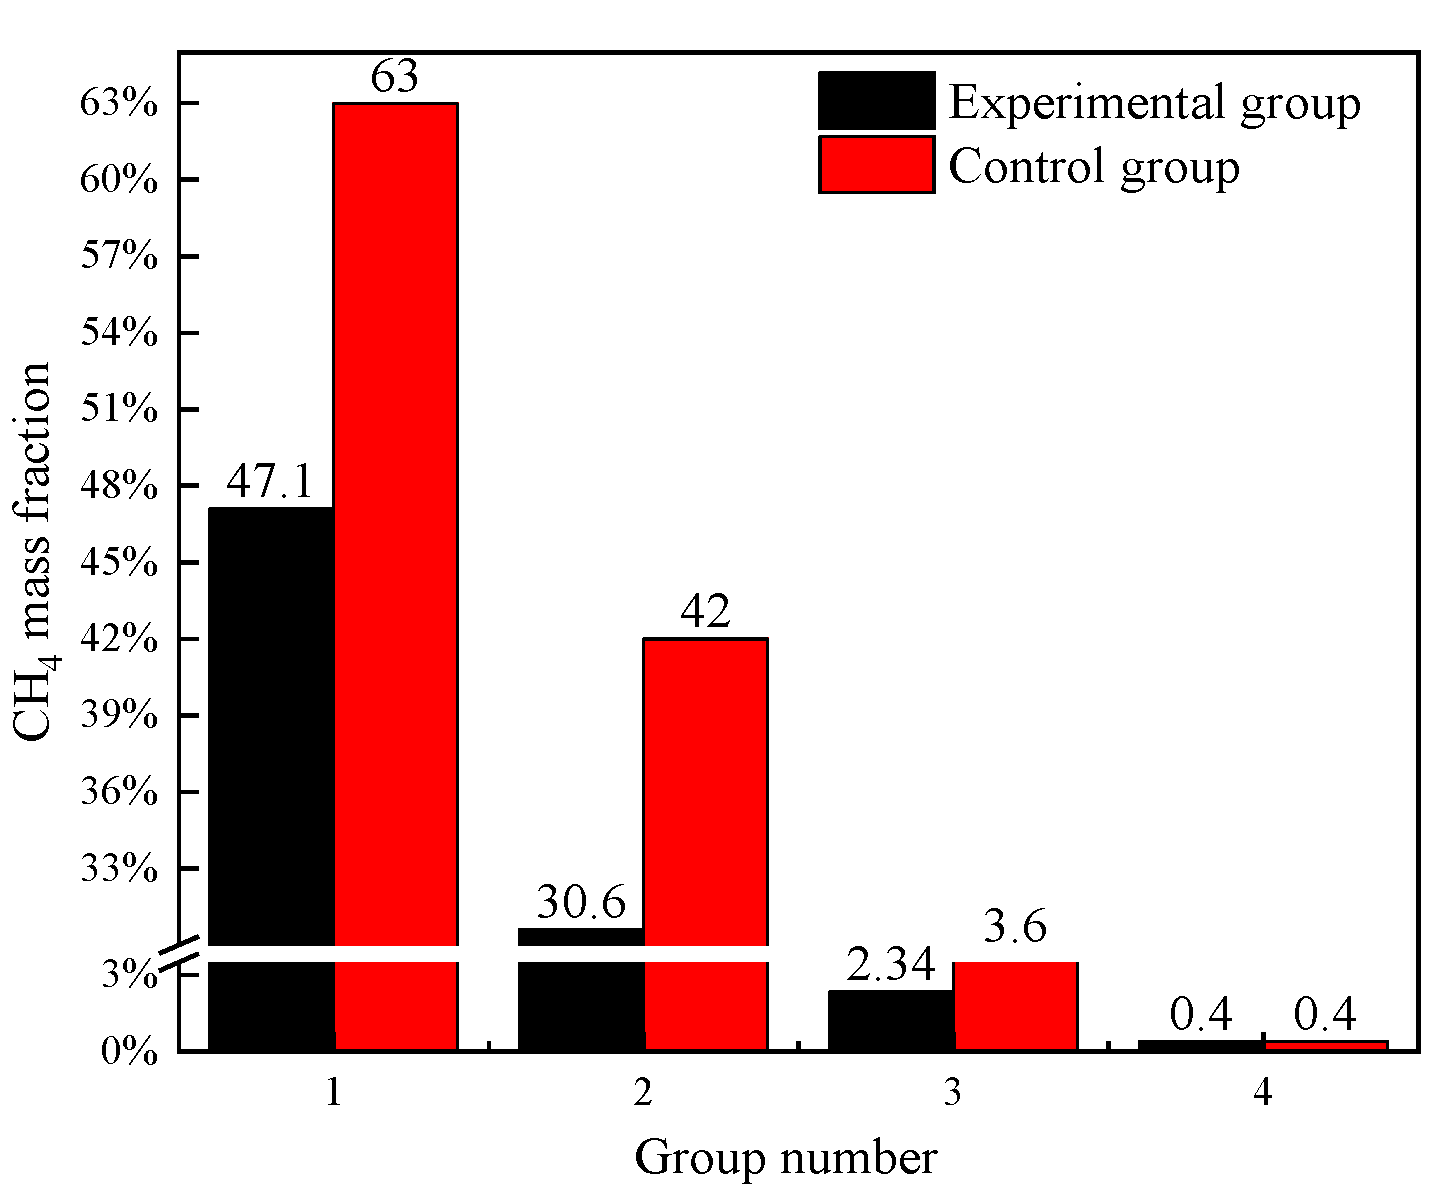
According to Figure 9, the gas mass fraction of the caving zone at the side of the air inlet roadway was 0.4%, the gas mass fraction of the fracture zone at the side of the air inlet roadway was 2.34%, the gas mass fraction of the caving zone at the side of the air outlet roadway was 30.6%, and the gas mass fraction of the caving zone at the side of the air outlet roadway was 47.1%. It can be seen that whether it was the side of the air inlet roadway or the side of the air outlet roadway, the gas mass fraction of the fracture zone was greater than that of the caving zone, indicating that the higher the layers, the higher the gas mass fraction. This was caused by the rising and floating of gas.
The main influencing factors affecting gas migration and storage characteristics were air leakage speed, negative pressure, and porosity distribution.

5. Results and Discussion

When studying gas migration, plenty of scholars would treat the goaf as a porous medium and render its porosity and permeability to study it to a deeper extent. Most of the selection of porosity was derived from the porosity of the caving zone. Therefore, this paper took the gas migration and reservoir characteristics simulated by the distribution characteristics of layered porosity as the experimental group and the gas migration and storage characteristics manufactured by the distribution characteristics of the porosity of the caving zone as the control group. This study discussed the similarities and differences between the two and analysed whether the distribution characteristics of layered porosity were suitable for simulating the aspects of gas migration and storage. The gas migration and reservoir characteristics simulated by the porosity distribution characteristics of the caving zone in the holistic goaf are shown in Figure 10.

5.1. Comparison of Gas Reservoir Characteristics in Goaf Strike Direction

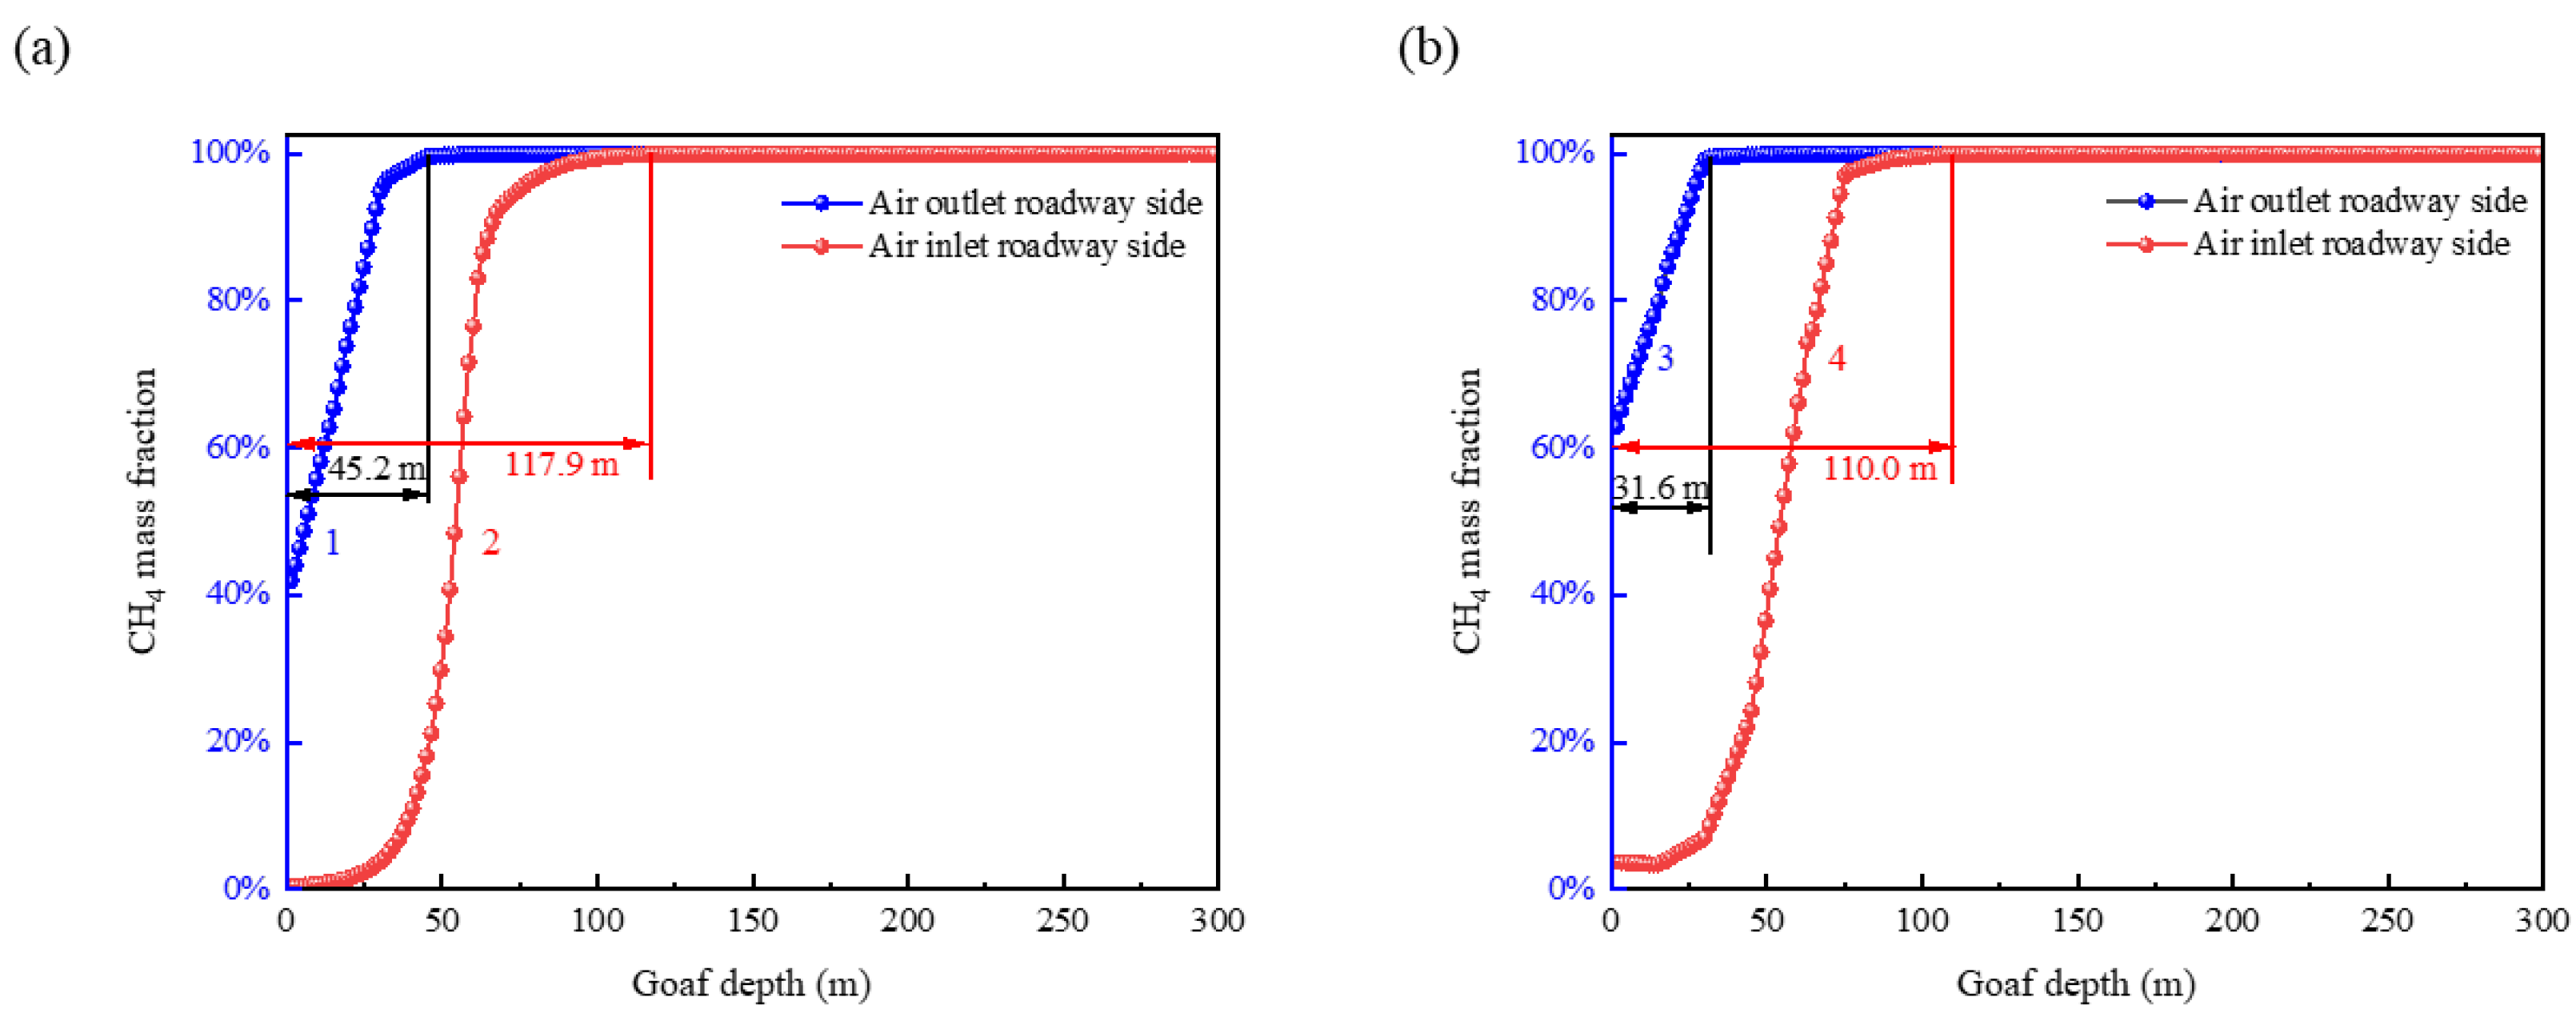
The change curve of the gas mass fraction at the air inlet and outlet roadway side of the caving zone in the control group is depicted in Figure 11a. Meanwhile, the change curve of the gas mass fraction at the air inlet and outlet roadway side of the fracture zone in the control group is shown in Figure 11b.
According to Figure 11a,b, The change of gas mass fraction in the strike direction of the experimental group and the control group was the same, connoting that it was appropriate and correct to use the distribution characteristics of layered porosity to simulate the gas migration and accumulation characteristics in the strike direction.
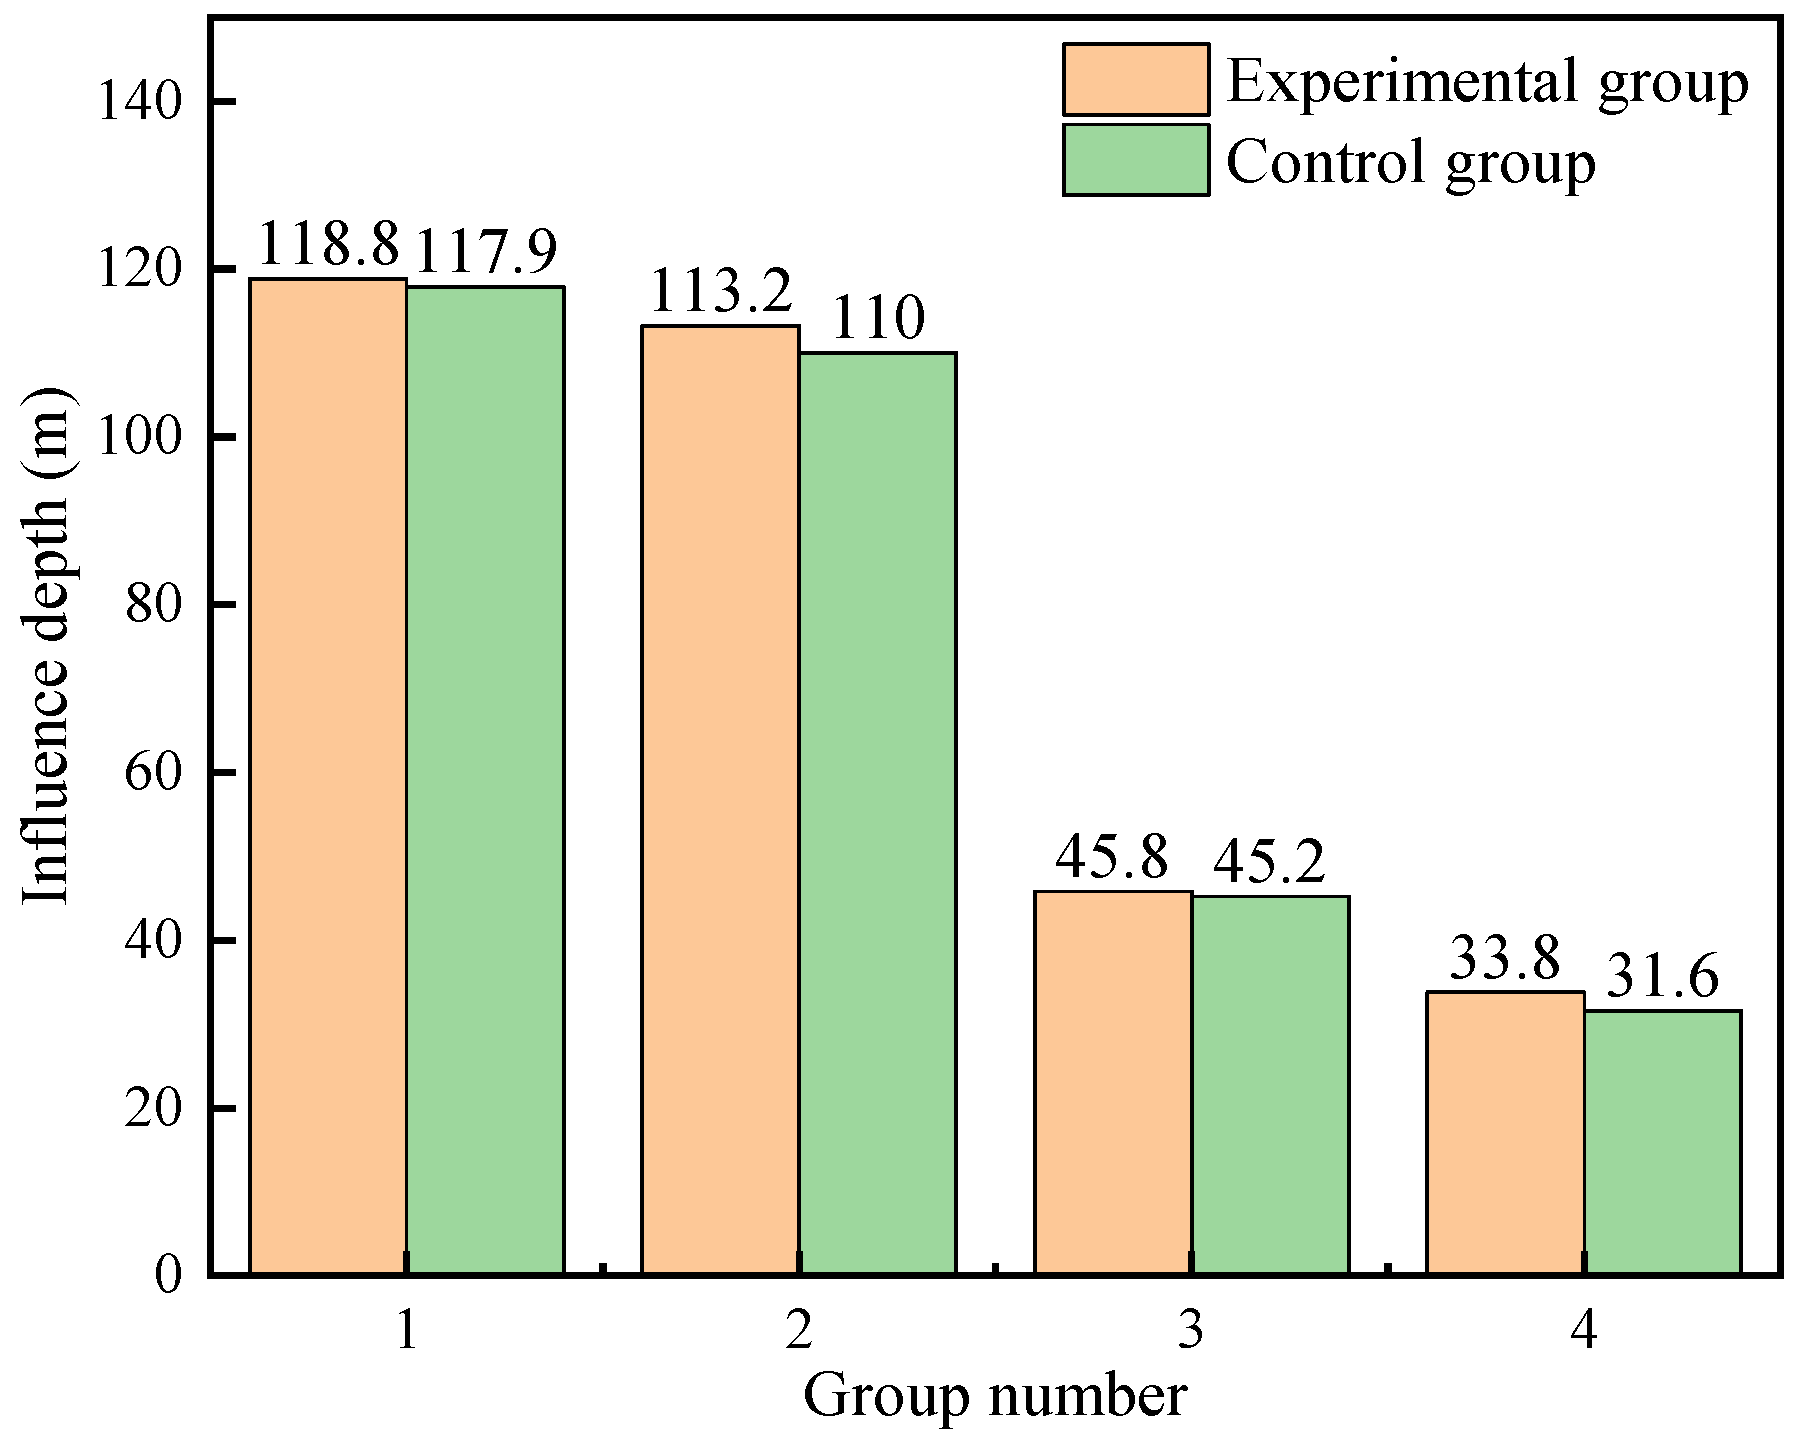
The comparison diagram of gas mass fraction influence depth was drawn to compare the difference of gas reservoir characteristics in the strike direction between the experimental group and the control group, as shown in Figure 12. The first group was the comparison results of the influence depth of the gas mass fraction in the caving zone of the air inlet roadway side, and the second group was the comparison results of the influence depth of the gas mass fraction in the fracture zone of the air inlet roadway side. The third group was the comparison results of the influence depth of the gas mass fraction in the caving zone of the air return roadway side, and the fourth group was the comparison results of the influence depth of the gas mass fraction in the fracture zone of the air return roadway side.
It can be seen from Figure 12 that the influence depth of the gas mass fraction in the experimental group was greater than that in the control group, but the porosity of the fracture zone in the experimental group was less than that in the control group. This was due to the fact that although the porosity around the fracture zone was small, when it retracted to the middle of the goaf, the porosity rose promptly, resulting in the influence depth of the gas mass fraction in the experimental group being greater than that in the control group, indicating that the gas was easy to migrate in the area with large porosity.

5.2. Comparison of Gas Reservoir Characteristics in Goaf Inclination Direction

The variation curve of the gas mass fraction in the inclination direction of the caving zone and the fracture zone is demonstrated in Figure 13 to investigate the gas reservoir characteristics in the inclination direction of the goaf in the control group.
According to the comparison between Figure 6 and Figure 13, the change of gas mass fraction in the inclination direction of the experimental group and the control group was basically the same, showing the characteristics of “exponential function” growth, and the fitting degree was generally above 0.99, denoting that it was appropriate and corrected to use the distribution characteristics of layered porosity to mimic the characteristics of gas migration and storage in the inclination direction.
The comparison diagram of the gas mass fraction was drawn to compare the difference in gas reservoir characteristics in the inclined direction between the experimental group and the control group, as delineated in Figure 14. The first group was the comparison results of the gas mass fraction at the side of the air outlet roadway in the fracture zone, and the second group was the comparison results of the gas mass fraction at the side of the air outlet roadway in the caving zone. The third group was the comparison results of the gas mass fraction at the side of the air inlet roadway in the fracture zone, and the fourth group was the comparison results of the gas mass fraction at the side of the air inlet roadway in the caving zone.
It can be seen from Figure 14 that the gas mass fraction of the experimental group was less than that of the control group. The porosity around the fracture zone of the experimental group was less than that of the control group, revealing that the larger the porosity, the more conducive to the gas migration in the fracture zone.

5.3. Comparison of Gas Migration and Reservoir Characteristics in Different Layers of Goaf

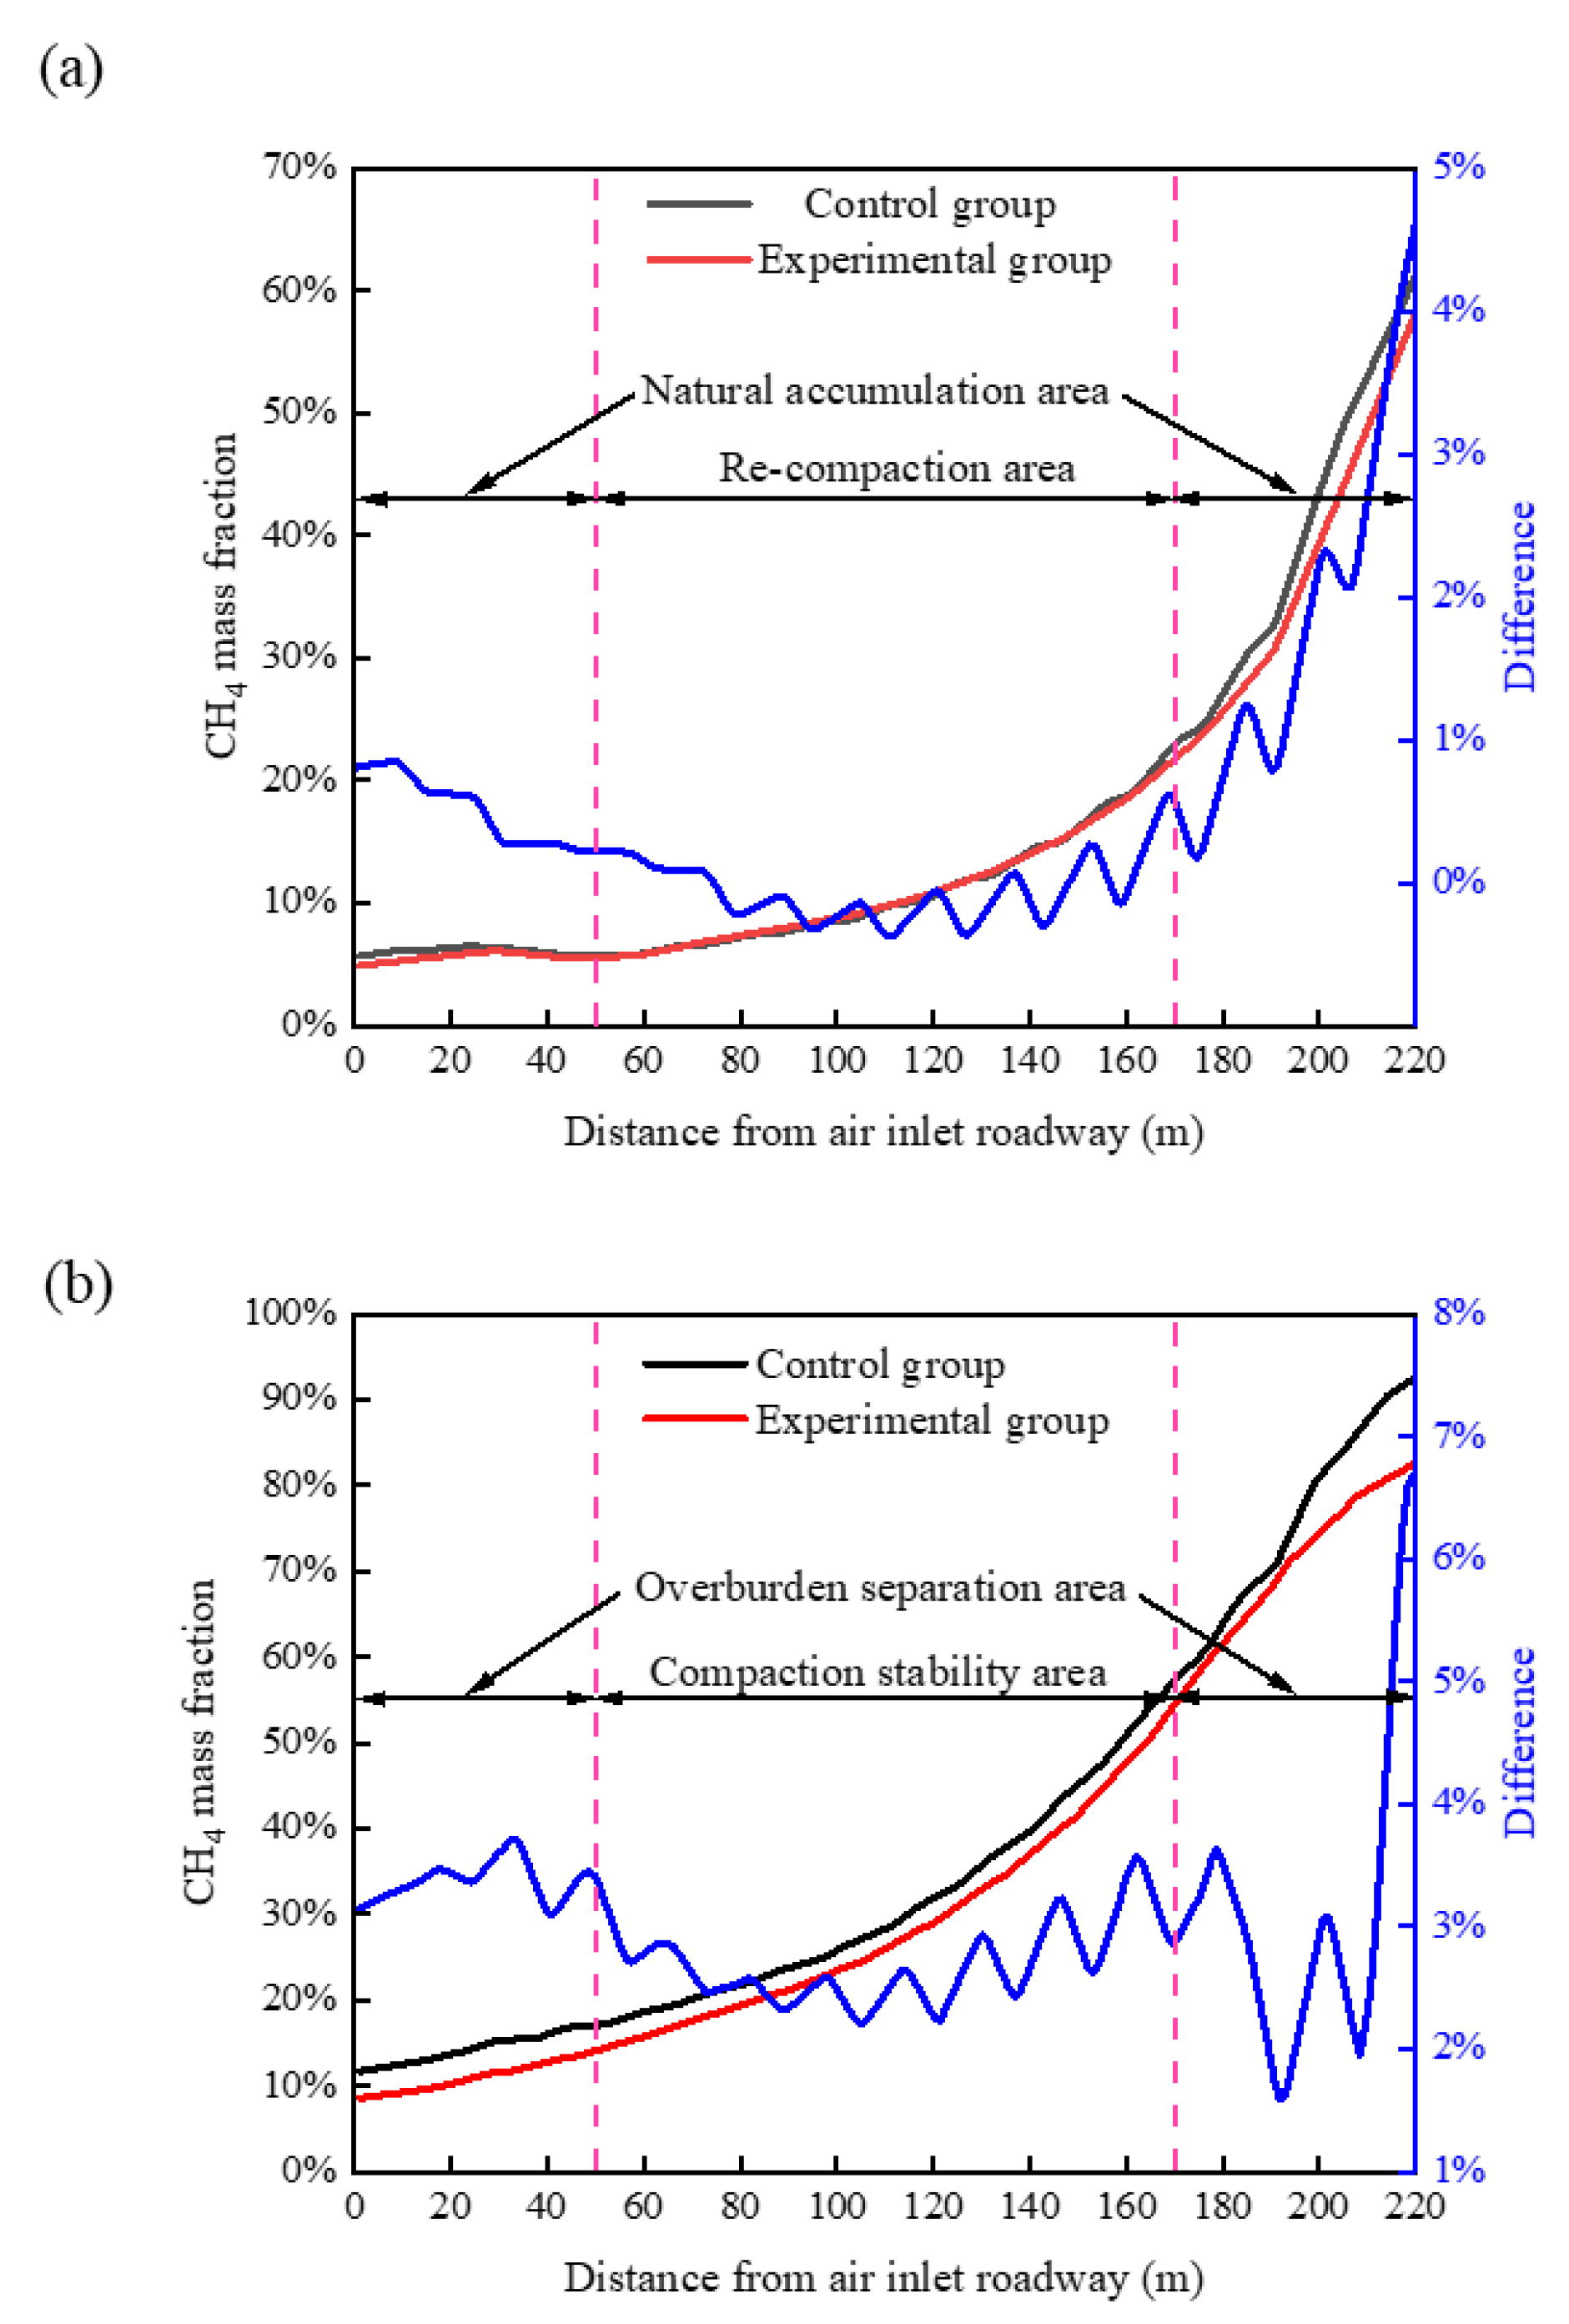
The comparison diagram of the gas mass fraction change curve along the inclined direction of the working face in the experimental and control groups’ caving zones is shown in Figure 15a. Meanwhile, the comparison diagram of the gas mass fraction change curve along the inclined direction of the working face in the experimental and control groups’ fracture zones is illustrated in Figure 15b.
It can be observed from Figure 15 that the gas mass fraction of the experimental group was generally smaller than that of the control group, and the porosity of the experimental group was also smaller than that of the control group, indicating that the greater the porosity was, the easier the gas was to migrate in it. There was little difference in the gas mass fraction between the re-compaction area in the caving zone and the compaction stability area in the fracture zone, but there was a large difference in the gas mass fraction between the natural accumulation area in the caving zone and the overburden separation area in the fracture zone, this was precisely due to the porosity distribution characteristics of the caving zone and fracture zone. This difference is consistent with the “Circular overlying zone for gas extraction” expressed in the literature [38]. Therefore, the layered porosity distribution characteristics can more accurately simulate the gas migration and reservoir characteristics.

6. Conclusions

In summary, three conclusions are drawn as follows:
Taking into account the distribution characteristics of the porosity in the goaf at the side of the cut eye and working face, the distribution characteristics of the porosity in the caving zone and the fracture zone were integrated. In the horizontal direction, the porosity distribution characteristics of the cut side were increased. In the vertical direction, different porosity distribution models were used for the caving zone and the fracture zone, and both models were used in the goaf.
The characteristics of gas migration and storage in goaf and its influencing factors were obtained. The gas mass fraction in the inclination direction of the goaf showed the growth characteristics of the “exponential function”, and the change of gas mass fraction in the strike direction of the air inlet roadway side demonstrated the growth characteristics of the “Boltzmann function”. The change of gas mass fraction in the strike direction of the air outlet roadway side illustrated the growth characteristics of the “linear function”. The main influencing factors were air leakage velocity, negative pressure, and porosity distribution.
The applicability of layered porosity in goaf to solve the characteristics of gas migration and a reservoir was analysed. The established model can better describe the characteristics of gas migration and storage in goaf, and the aspects of mining overburden fracture field and gas migration and storage in fracture field in comprehensive working face, which provided some references for the subsequent goaf gas control.

Author Contributions

Writing—original draft preparation, Q.M.; methodology, J.X.; data curation, Y.S.; data curation, X.Z. All authors have read and agreed to the published version of the manuscript.

Funding

This study was funded by a grant from the National Natural Science Foundation of China (Grant nos. 51974239 and 11802231).

Data Availability Statement

Data is available upon request due to restrictions.

Conflicts of Interest

The authors declare no conflict of interest.

References

  1. Chang, Y.; Shu, C.; You, M. Explosion prevention and weighting analysis on the inerting effect of methane via grey entropy model. J. Loss Prev. Process. Ind. 2021, 71, 104385. [Google Scholar] [CrossRef]
  2. Linghu, J.; Zhao, W.; Zhou, J.; Yan, Z.; Wang, K.; Xu, C. Influence of deep magma-induced thermal effects on the regional gas outburst risk of coal seams. Int. J. Coal Sci. Technol. 2021, 8, 1411–1422. [Google Scholar] [CrossRef]
  3. Du, X.; Xue, J.; Ma, Q.; Chen, Z.; Zhan, K. Energy evolution characteristics of coal–rock composite bodies based on unidirectional load. Nat. Resour. Res. 2022, 31, 1647–1663. [Google Scholar] [CrossRef]
  4. Shi, X.; Zhang, Y.; Chen, X.; Zhang, Y.; Rui, L.; Guo, R. Numerical simulation on response characteristics of coal ignition under the disturbance of fluctuating heat. Combust. Flame 2022, 237, 111870. [Google Scholar] [CrossRef]
  5. Valiulin, S.V.; Onischuk, A.A.; Baklanov, A.M.; Bazhina, A.A.; Paleev, D.Y.; Zamashchikov, V.V. Effect of coal mine organic aerosol on the methane/air lower explosive limit. Int. J. Coal Sci. Technol. 2020, 7, 778–786. [Google Scholar] [CrossRef] [Green Version]
  6. Gao, K.; Huang, P.; Liu, Z.G.; Liu, J.; Wang, F.; Shu, C.M. Pressure relief by blasting roof cutting in close seam group mining under thick sandstone to enhance gas extraction for mining safety. Processes 2021, 9, 603. [Google Scholar] [CrossRef]
  7. Zhang, L.; Huang, M.; Xue, J.; Li, M.; Li, J. Repetitive mining stress and pore pressure effects on permeability and pore pressure sensitivity of bituminous coal. Nat. Resour. Res. 2021, 30, 4457–4476. [Google Scholar] [CrossRef]
  8. Xiang, Z.; Si, G.; Wang, Y.; Belle, B.; Webb, D. Goaf gas drainage and its impact on coal oxidation behaviour: A conceptual model. Int. J. Coal Geol. 2021, 248, 103878. [Google Scholar] [CrossRef]
  9. Qin, J.; Qu, Q.; Guo, H. CFD simulations for longwall gas drainage design optimisation. Int. J. Min. Sci. Technol. 2017, 27, 777–782. [Google Scholar] [CrossRef]
  10. Wei, P.; Li, X.; Hu, Q.; Peng, S.; Liu, S. A Trapezoidal three-dimensional model for gas extraction based on shapes of caved overlying strata and numerical calculation. Nat. Resour. Res. 2020, 29, 4031–4051. [Google Scholar] [CrossRef]
  11. Si, G.; Belle, B. Performance analysis of vertical goaf gas drainage holes using gas indicators in Australian coal mines. Int. J. Coal Geol. 2019, 216, 103301. [Google Scholar] [CrossRef]
  12. Zhao, W.; Wang, K.; Zhang, R.; Dong, H.; Lou, Z.; An, F. Influence of combination forms of intact sub-layer and tectonically deformed sub-layer of coal on the gas drainage performance of boreholes: A numerical study. Int. J. Coal Sci. Technol. 2020, 7, 571–580. [Google Scholar] [CrossRef] [Green Version]
  13. Zhang, L.; Huang, M.; Li, M.; Lu, S.; Yuan, X.; Li, J. Experimental study on evolution of fracture network and permeability characteristics of bituminous coal under repeated mining effect. Nat. Resour. Res. 2022, 31, 463–486. [Google Scholar] [CrossRef]
  14. Han, D.; Hu, S.; Zhang, A.; Hao, G.; Hu, L. Study on voidage distribution regulation and formation mechanism of crushed rock mass in gob. Coal Sci. Technol. 2020, 48, 113–120. (In Chinese) [Google Scholar]
  15. Zhang, C.; Tu, S.; Zhang, L. Field measurements of compaction seepage characteristics in longwall mining goaf. Nat. Resour. Res. 2020, 29, 905–917. [Google Scholar] [CrossRef]
  16. Yi, M.; Wang, L.; Hao, C.; Liu, Q.; Wang, Z. Method for designing the optimal sealing depth in methane drainage boreholes to realize efficient drainage. Int. J. Coal Sci. Technol. 2021, 8, 1400–1410. [Google Scholar] [CrossRef]
  17. Shi, H.; Zhang, Y.; Tang, L. Physical test of fracture development in the overburden strata above the goaf and diffusion process of permeable grout slurry. Bull. Eng. Geol. Environ. 2021, 80, 4791–4802. [Google Scholar] [CrossRef]
  18. Xu, C.; Li, X.; Chen, Q.; Cao, M.; Shen, L. Optimization of precise extraction parameters in high-drainage roadway based on nonlinear permeability model. Coal Sci. Technol. 2021, 49, 100–109. (In Chinese) [Google Scholar] [CrossRef]
  19. Wang, Y. Three-dimensional spatial dynamic distribution model on porosity and permeability characteristics of porous media in goaf. J. Saf. Sci. Technol. 2020, 16, 40–46. (In Chinese) [Google Scholar] [CrossRef]
  20. Poulsen, B.A.; Adhikary, D.; Guo, H. Simulating mining-induced strata permeability changes. Eng. Geol. 2018, 237, 208–216. [Google Scholar] [CrossRef]
  21. Guo, D.; Lv, P.; Zhao, J.; Zhang, C. Research progress on permeability improvement mechanisms and technologies of coalbed deep-hole cumulative blasting. Int. J. Coal Sci. Technol. 2020, 7, 329–336. [Google Scholar] [CrossRef] [Green Version]
  22. Adhikary, D.P.; Guo, H. Modelling of longwall mining-induced strata permeability change. Rock Mech. Rock Eng. 2015, 48, 345–359. [Google Scholar] [CrossRef]
  23. Fan, L.; Liu, S. A conceptual model to characterize and model compaction behavior and permeability evolution of broken rock mass in coal mine gobs. Int. J. Coal Geol. 2017, 172, 60–70. [Google Scholar] [CrossRef]
  24. Song, J.; Deng, J.; Zhao, J.; Zhang, Y.; Wang, C.; Shu, C. Critical particle size analysis of gas emission under high-temperature oxidation of weathered coal. Energy 2021, 214, 118995. [Google Scholar] [CrossRef]
  25. Qu, Q.; Xu, J.; Wu, R.; Qin, W.; Hu, G. Three-zone characterisation of coupled strata and gas behaviour in multi-seam mining. Int. J. Rock Mech. Min. 2015, 78, 91–98. [Google Scholar] [CrossRef]
  26. Hu, B.; Wang, J.G.; Wu, D.; Wang, H. Impacts of zone fractal properties on shale gas productivity of a multiple fractured horizontal well. Fractals 2019, 27, 1950006. [Google Scholar] [CrossRef]
  27. Zhang, Y.; Niu, K.; Du, W.; Zhang, J.; Wang, H.; Zhang, J. A method to identify coal spontaneous combustion-prone regions based on goaf flow field under dynamic porosity. Fuel 2021, 288, 119690. [Google Scholar] [CrossRef]
  28. Liu, Q.; Lin, B.; Zhou, Y.; Li, Y. Porosity model of the goaf based on overlying strata movement and deformation. Environ. Earth Sci. 2022, 81, 214. [Google Scholar] [CrossRef]
  29. Bear, J. Dynamics of fluids in porous media. Soil Sci. 1975, 120, 162–163. [Google Scholar] [CrossRef] [Green Version]
  30. Ergun, S. Fluid flow through packed columns. J. Mater. Sci. Chem. Eng. 1952, 48, 89–94. [Google Scholar]
  31. Liu, Y.; Hinrichsen, O. Study on CFD–PBM turbulence closures based on k–ε and Reynolds stress models for heterogeneous bubble column flows. Comput. Fluids 2014, 105, 91–100. [Google Scholar] [CrossRef]
  32. Selma, B.; Bannari, R.; Proulx, P. A full integration of a dispersion and interface closures in the standard k–ε model of turbulence. Chem. Eng. Sci. 2010, 65, 5417–5428. [Google Scholar] [CrossRef]
  33. Jin, L.; Yao, W.; Zhang, J. CFD simulation of gas seepage regularity in goaf. J. China Coal Soc. 2010, 35, 1476–1480. (In Chinese) [Google Scholar] [CrossRef]
  34. Iqbal, N.; Rauh, C. Coupling of discrete element model (DEM) with computational fluid mechanics (CFD): A validation study. Appl. Math. Comput. 2016, 277, 154–163. [Google Scholar] [CrossRef]
  35. Gui, X.; Xue, H.; Zhan, X.; Hu, Z.; Song, X. Measurement and numerical simulation of coal spontaneous combustion in goaf under y-type ventilation mode. ACS Omega 2022, 7, 9406–9421. [Google Scholar] [CrossRef] [PubMed]
  36. Liu, T.; Lin, B.; Fu, X.; Liu, A. Mechanical criterion for coal and gas outburst: A perspective from multiphysics coupling. Int. J. Coal Sci. Technol. 2021, 8, 1423–1435. [Google Scholar] [CrossRef]
  37. Qian, M.; Xu, J. Study on the “O shape” circle distribution characteristics of mining induced fractures in the overlaying strata. J. China Coal Soc. 1998, 23, 466–469. (In Chinese) [Google Scholar]
  38. Qin, Z.; Yuan, L.; Guo, H.; Qu, Q. Investigation of longwall goaf gas flows and borehole drainage performance by CFD simulation. Int. J. Coal Geol. 2015, 150, 51–63. [Google Scholar] [CrossRef]
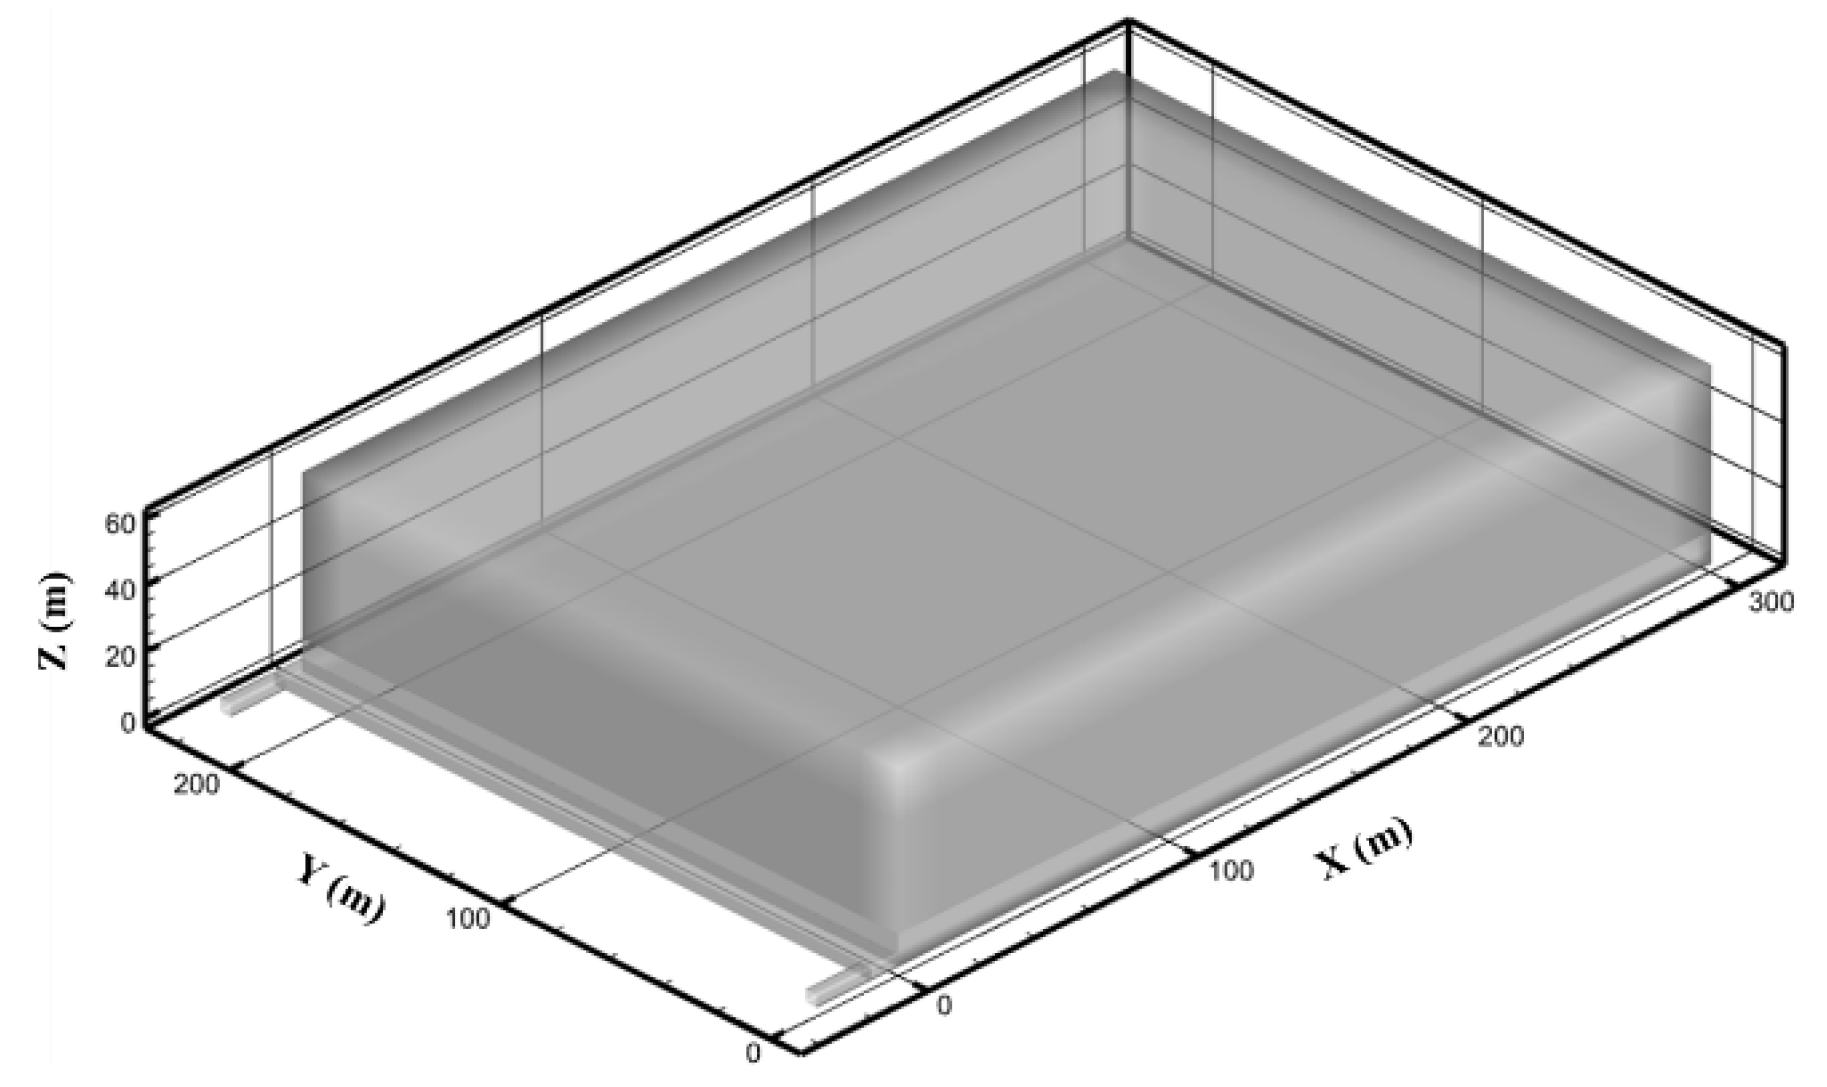
Figure 1. Model of goaf for the comprehensive working face.
Energies 16 02325 g001
Figure 2. Distribution of porosity in the caving zone of (a) global, (b) inclination, (c) plan, and (d) strike.
Energies 16 02325 g002
Figure 3. Distribution of porosity in the fracture zone of (a) global, (b) inclination, (c) plan, and (d) strike.
Energies 16 02325 g003
Figure 4. Characteristics of layered gas migration and accumulation of (a) caving zone and (b) fracture zone.
Energies 16 02325 g004
Figure 5. Comparison diagram of the gas mass fraction at the side of air outlet roadway and air inlet roadway (a) caving zone and (b) fractured zone.
Energies 16 02325 g005
Figure 6. Variation curve of gas mass fraction in the inclination direction (a) caving zone (b) fracture zone.
Energies 16 02325 g006
Figure 7. Comparison diagram of gas mass fraction variation curve in caving zone and fracture zone.
Energies 16 02325 g007
Figure 8. Comparison of influence depth of gas mass fraction in the caving zone and fracture zone in the strike direction.
Energies 16 02325 g008
Figure 9. Comparison of gas mass fraction in the caving zone and fracture zone in the inclination direction.
Energies 16 02325 g009
Figure 10. Gas migration and reservoir characteristics simulated by the distribution characteristics of porosity in the control group (a) caving zones and (b) fracture zones.
Energies 16 02325 g010
Figure 11. Comparison diagram of gas mass fraction change curve at the side of air inlet roadway and air outlet roadway in the control group (a) caving zone and (b) fracture zone.
Energies 16 02325 g011
Figure 12. Comparison of the influence depth of gas mass fraction in the strike direction between the experimental and the control groups.
Energies 16 02325 g012
Figure 13. Variation curve of gas mass fraction in the inclination direction of the control group (a) caving zone (b) fracture zone.
Energies 16 02325 g013
Figure 14. Comparison diagram of gas mass fraction in the inclined direction between the experimental and control groups.
Energies 16 02325 g014
Figure 15. Comparison of gas mass fraction in the inclined direction between the experimental group and the control group for (a) caving zone and (b) fracture zone.
Energies 16 02325 g015
Table 1. Characteristic parameters of overlying strata.
Number of Overlying StrataHeight of Strata from Floor (m)Thickness of Strata (m)Maximum Subsidence of Rock Strata (m)Average Length of Broken Rock (MPa)
11042.958
21992.86711
340212.5212
463231.48815
Table 2. Fitting relationship of gas mass fraction in the experimental group’s caving zone and fracture zone.
Group NumberFitting EquationCoefficient of Determinant (R2)
1 y = 0.25491 + 0.0191 x 0.98
2 y = 0.98821 + 0.01848 0.98821 1 + e x 53.61951 5.1546 0.99
3 y = 0.44408 + 0.01798 x 0.99
4 y = 1.0102 + 0.02926 1.0102 1 + e x 54.71861 8.39464 0.99
Disclaimer/Publisher’s Note: The statements, opinions and data contained in all publications are solely those of the individual author(s) and contributor(s) and not of MDPI and/or the editor(s). MDPI and/or the editor(s) disclaim responsibility for any injury to people or property resulting from any ideas, methods, instructions or products referred to in the content.