Abstract
Students require a comfortable thermal environment for better academic learning and health in general. In Nepal, the majority of school buildings are constructed using local materials, but little consideration is provided to the thermal environment required for comfort. Therefore, this study demonstrates the advantages of using passive design measures through a simulation that can be used either in the early stages or as a retrofit to determine how the building performs in terms of comfort and the thermal environment. First, the thermal environment of school buildings and thermal comfort of students were evaluated through field surveys. Subsequently, a simulation was performed to investigate the operative temperatures in the classroom of a school building in Kathmandu. DesignBuilder software was used to create the base model and the simulated operative temperature was validated using the measured globe temperature. Subsequently, passive strategies, such as natural ventilation, insulation, and thermal mass, were applied and analysed. The field survey showed that the indoor globe and outdoor air temperatures were correlated, and the students perceived a hotter environment and preferred a cooler environment. Within this context, the average comfort temperature was 26.9 °C. The simulation results showed that the operative temperature was reduced to below 27 °C with a maximum reduction of 3.3 °C due to the integrated design impact, which is within the comfortable limit required during school hours. This study helps to design Nepalese school buildings in a better way by considering passive design strategies during architectural design to make classrooms more thermally comfortable.
1. Introduction
1.1. Overview
Thermal comfort in school buildings has long been a subject of interest because the relationship between the immediate thermal environment and its impact on students’ learning abilities and health is not well-understood yet [1]. It is a significant factor in the quality of the indoor environment in school buildings, which is potentially linked to architectural building design [2,3] and personal factors, such as age and level of activity [4,5]. The “comfort temperature”, which is an index temperature that is calculated using either the measured globe temperature, measured air temperature, or calculated operative temperature at which the largest number of occupants will feel comfortable [6], evaluates the comfort level in a given environment based on these factors. Thermal comfort conditions are investigated and evaluated mainly using two approaches: climate chamber studies in environmental control conditions and field studies in real buildings with occupants. The former is based on a heat balance model [7] which outputs a predicted mean vote (PMV) and predicted percentage of dissatisfaction (PPD), where the occupants have no control over their thermal environment. The latter is an adaptive type of thermal comfort, where occupants have behavioural, physiological, and psychological adaptations [6,8,9]. Thermal comfort prediction using the PMV-PPD model underestimates or overestimates according to naturally ventilated buildings [10,11,12,13,14], and more emphasis is placed on the adaptive approach for assessing the thermal environment and comfort [4]. Therefore, this study followed the latter approach in real school buildings.
The built environment is the dominant source of energy use, which uses approximately 40% of global annual energy, along with the emission of greenhouse gases [15,16]. From the viewpoint of the global environment, in order to reduce the consequences of global warming, alternative ways of grasping the benefits of natural resources in the building sector are required that use less energy and are more sustainable. This can be possible by employing passive measures [17,18]. It adapts to local climatic conditions rather than using an active design. To achieve this, designers can examine a building’s performance and thermal comfort at the early stage of design and make rational decisions by utilising various design strategies with building simulation tools [17,19]. Unfortunately, these kinds of studies are overlooked in school buildings of Nepal. There is a need for awareness and implementation of the fact that the use of such a design can improve a building’s thermal performance and, therefore, its thermal comfort. For Nepal to follow the medium path which is a futuristic rational path of energy use that aims to provide a reasonably good quality of life for both developed and developing countries, it is important to consider passive design solutions as a means of improving the thermal environment of indoor spaces [20]. This approach connects building thermal comfort with human thermal comfort [21] and can contribute to sustainable development in terms of global environmental issues.
Nepal is a country with a slow-growing economy and is at a stage where it can rethink these opportunities to be used in the future that can reduce its dependency on the use of fossil fuels, natural gas, coal, and so on. A passive design strategy can be used based on the local area and climate conditions, which are appropriate for climate design adaptation to address indoor thermal issues [22,23,24]. Having sufficient knowledge of such factors plays a decisive role in potentiating energy-saving scenarios and thermal comfort [25,26,27,28,29,30]. From an economic perspective, heavy reliance on active systems such as mechanical equipment presently would be impossible; therefore, this study provides an idea of alternative paths for a sustainable built environment in Nepal, which is one of the major contributions of this research.
Before or after the building construction process for schools, offices, residences, and hotels, an important aspect is how it performs and thus provides a comfortable indoor thermal environment. The ultimate aim of either mechanically conditioned or passively designed indoor spaces should be to reduce fluctuations in indoor temperature, regardless of the outdoor temperature. If they are maintained by mechanical heating or cooling equipment, the variation in the indoor thermal environment would be small, but it can be different in naturally ventilated indoor spaces, even during peak summer or winter. Factors such as climate, location, orientation, the building’s materials, and so on, of course, significantly influence the indoors under such conditions [31,32]. Among indoor spaces, classrooms are an important part of school buildings because they must accommodate a large number of students for an extended period of time [33]. They have special characteristics compared with other buildings, as they are used mainly during the day for academic activities. There is a high possibility of outdoor influences on the indoor environment, such as solar radiation during the day. Therefore, the approach required to create a comfortable indoor environment while lowering the level of thermal discomfort is a key issue. It is thus important to evaluate and improve the thermal environment through field surveys and simulations. The originality of this study lies in the fact that it investigates the present condition of comfort temperature as an index of thermal comfort through a field survey, identifies the concerns of thermal comfort through statistical analysis, and uses passive design strategies to improve the thermal environment required for comfort using thermal simulation techniques simultaneously. Such research has not been conducted in previous studies that have focused on schools in the research history of Nepal.
1.2. Literature Review
Thermal comfort studies for students conducted so far have clarified its importance based on how school buildings perform in their local climate [34,35,36,37,38,39]. Table 1 shows the adaptive thermal comfort studies conducted in educational buildings in tropical [40,41], subtropical [34,42], hot and dry [13], warm–humid [43], temperate [5,44,45], Mediterranean [46,47], composite [1,48], mild [49,50], and cold [51] climates under the condition of free running or natural ventilation. Many studies have been conducted in various countries, climates, and seasons, and Table 1 presents that only a few of them have focused on hot season thermal comfort. A series of field studies conducted in naturally ventilated classrooms in Indonesia and Bangladesh found that students were comfortable up to approximately 33 °C during hot seasons [40,41].

Table 1.
Summary of previous thermal comfort research conducted in school/educational buildings with their major findings.
According to a study conducted in primary classrooms in Australia [34], students rated comfort temperature and preferred temperature at 22.5 °C, which was different from that of adults. Additionally, the study reported that factors such as the mode of operation, climate, and age affect adaptation to the thermal environment. Liang et al. [42] found a comfort temperature of 29.2 °C with a range of 24.4–29.2 °C. They investigated the effects of building envelope energy regulations on thermal comfort levels, and found a significant impact on thermal comfort levels in naturally ventilated primary and secondary schools.
A study conducted in an Iranian primary school found that students were slightly less sensitive to changes in indoor temperature compared with adults and that they felt comfortable at lower temperatures during the warm season [13]. They estimated the comfort temperature at 23.3 °C and a range of 22–25 °C. Munonye and Ji [43] conducted a field study in naturally ventilated primary school buildings in Nigeria to investigate the thermal comfort of students. The comfort temperature was 28.1 °C, with a comfortable range of 25.8–30.5 °C. Furthermore, this study concluded that such a high comfort temperature was probably due to the architectural characteristics of classrooms and buildings.
Aparicio-Ruiz et al. [44] predicted a comfort temperature of 24.5 °C in indoor temperature of 24–27 °C and detected a wide thermal comfort range compared with standards. A study conducted in Korea concluded that students were more sensitive to the indoor temperature than adults and their preferred temperature was lower [5]. Furthermore, it was found that the range of fluctuations in indoor temperature satisfied the ASHRAE criterion for thermal comfort of 23–26 °C during the summer. Shrestha et al. [45] found that approximately 76% of the students felt comfortable at an average globe temperature of 27 °C under the condition of natural ventilation in the autumn in school buildings in Nepal.
A field study in Portuguese secondary classrooms by Pereira et al. [46] found an acceptable temperature of 25.2 °C with a range of 22.1–25.2 °C. They also found that neutrality was not the preferred state for students. In another study conducted in a secondary school in Cyprus, Heracleous and Michael [47] found that the thermal comfort zone ranges from 23 to 29 °C for 80% acceptability and from 24 to 28 °C for 90% acceptability during the summer.
In a field study conducted in naturally ventilated school buildings in India [1], it was found that the adaptive opportunities available to students were clothing, window openings, and ceiling fans. Under these conditions, it was found that a comfort zone of 23–32 °C with an average comfort temperature of 29.8 °C is acceptable for their thermal environment in summer. In the same climate, Kumar et al. [48] found that the comfort temperature of students was 24.8 °C in autumn. Jowkar et al. [50] conducted a comfort temperature range investigation study in the UK in learning classrooms and found that the average comfort temperature was 23 °C, with an operative temperature range of 22–25 °C.
A field study in classrooms in China found that the summer comfort temperature is 26.2 °C [51]. In the summer, the acceptable range was 21–29.6 °C which was found based on the analysis of indoor measurements and subjective responses.
The above studies show that the comfort temperature and its range are wider under natural ventilation conditions, regardless of the climate and location during hot seasons. In the absence of a thermally comfortable indoor environment, the vulnerability of students towards their academic performance tends to be high in naturally ventilated school buildings. This can be improved by employing passive design techniques [31].
Previous simulation studies [17,26,52,53,54] found that improvements applied by passive strategies in existing buildings saved a significant amount of energy. Studies conducted on educational buildings have validated the efficacy of passive design strategies in their respective climatic conditions to maintain an indoor thermal environment as well as energy saving, as shown in Table 2 [26,27,28,29,30,31,32,39,55,56,57,58,59,60,61,62,63,64,65,66,67,68]. Lopez et al. [69] identified passive design intervention strategies such as green roofs, thermal insulation, natural ventilation, shading, orientation, thermal mass, solar walls, Trombe walls, evaporative cooling systems, solar chimneys, windcatchers, and so on in schools in 43 countries and Koppen climate zones from the literature. Subhashini and Thirumaran [64] explored a shading device design for warm and humid climates that reduced the heat gain from windows and walls and maintained the indoor air temperature. Galal [60] found that the north, north-east, and north-west orientations can provide the most efficient heat gain and daylighting conditions combined, for coastal areas with Lebanese climates. Mohamed et al. [55] revealed the reductions in indoor air temperature from 30.3 to 44.8 °C to 18.9–26.5 °C after activating a passive wall system. Alwetaishi et al. [39] observed that vertical shading is efficient from 7:00 to 9:00, after which 45° vertical shade is more efficient in maintaining classroom temperature in the local climate of a hot region. Park et al. [27] found that the phase change materials (PCMs) applied to the shading reduced the cooling energy use by 44% and improved the thermal comfort hours by 34% in educational buildings. Kükrer and Eskin [37] found that discomfort hours were decreased by 17.6% and productivity was increased by 46% because of ambient temperature, HVAC, airflow, and shading operation schedules. From an experimental and numerical assessment, Stavrakakis et al. [62] concluded that a cool roof improves summer thermal comfort and reduces energy consumption in school buildings in warm climates. Lakhdari et al. [70] found that the combined passive strategy of the window wall ratio (WWR), glass types, wall materials, and shading control can provide better thermal comfort in hot and dry regions. Carbonari [71] used simulations to find the effects of various passive solar control retrofit strategies, such as external slats, which significantly reduced solar gain and contributed to maintaining comfort conditions during the summer at an Italian school.
Table 2.
Summary of passive design strategies research in school/educational buildings with their major findings.
Thermal insulation plays an important role in changing the rate of heat flow through it, either by hindering conduction, convection, or radiation, based on the heat storage capacity of the materials. Proper selection of materials helps to avoid heat loss or gain and reduces the demand for energy. Insulating materials, such as expanded polystyrene (EPS), extruded polystyrene (XPS), and polyurethane-polyisocyanurate (PUR-PIR), are mostly used because of their low thermal conductivity, low cost, ease of handling, and installation [72]. Ali and Al-Hashlamun [73] investigated the effect of insulation on uninsulated old schools and thermally insulated new school buildings. They found that the new insulated school effectively contributed to reducing the average indoor air temperature. Through a literature review, Sadineni et al. [74] found that the use of thermal mass is more significant in reducing the indoor temperature in places where the night and daytime outdoor air temperature differences are high.
Based on the above-mentioned literature review, several passive strategies employed in educational buildings have been identified, that have improved the thermal environment, comfort, and energy savings. There have been a few thermal environment improvement simulation studies conducted in Nepal to improve the thermal comfort in residential buildings [75,76,77]. However, none of these studies have focused on school buildings hence these have been overlooked.
1.3. Nepalese School Buildings and Research Questions
An effective infrastructure, such as building envelopes with insulation, has not been developed in most school buildings of Nepal that can maintain thermal comfort in classrooms [45]. They are mostly constructed using a community-driven approach without considering the impact of outdoor thermal conditions on an incremental and non-engineering basis [78], which lacks adequate insulation, ventilation, solar control, and other key thermal comfort aspects. There are no mechanical heating or cooling systems, and natural ventilation through windows or doors is the only means of maintaining an indoor environment.
What is the thermal environment and thermal comfort in these buildings and how can they be effectively improved using natural resources and minimal energy; remains a question to be answered. Passive design strategies to improve thermal comfort in classrooms have not yet been studied or considered. Thus, it is necessary to conduct thermal performance studies to improve or ensure energy efficiency for thermal comfort so that the impact of passive design can be determined if school buildings are to be constructed or renovated in the future. Field investigations alone cannot predict future conditions; therefore, a simulation study would probably be a better way to investigate and analyse these aspects.
According to the school sector development plan 2016–2022 implemented by the Government of Nepal, the use of passive design strategies have not been mentioned or encouraged for improving the thermal environment and comfort of students in classrooms [79]. Moreover, the results and recommendations obtained from previous studies conducted in other countries and climates cannot be generalised to the Nepalese context because it has a very diverse type of climate and geography. Therefore, this study was conducted to fill this research gap and answer the above-mentioned questions, as well as to analyse and compare the impact of various passive design strategies on the indoor thermal environment through a case study of a school building. This study provides an insight into how passive improvement of the indoor thermal environment after evaluating its thermal comfort can best be used to ensure awareness of energy saving for future generations. This work contributes to minimising the use of a mechanical heating or cooling system that consumes high energy while maintaining the thermal environment and comfort in school buildings in the study area.
1.4. Objectives
From the literature review in the previous section, it was found that very few studies [31] are based on thermal comfort field studies, followed by simulation studies for the improvement of thermal environment using passive design strategies. Consequently, this study conducted field surveys and measurements in school buildings. This study analyses the effect of passive design strategies on the operative temperature as an index of thermal comfort through simulation. To the best of our knowledge, this is the first systematic simulation study to develop a comprehensive understanding of the indoor thermal environment for thermal comfort in free-running or naturally ventilated Nepalese school buildings. It aims to investigate the indoor thermal environment, the thermal comfort of students, and how passive design strategies are effective in improving the operative temperature at a level that is suitable for thermal comfort. Further, the research intention of this study is to demonstrate some of the design strategies that can be employed in existing and new school building designs.
2. Methodology
The flow chart presented in Figure 1 shows the methodology used in this study. These methods include field surveys and building simulations. The survey collected environmental quantities and thermal perceptions of students for the evaluation of thermal conditions as well as building information to develop a base model for simulation purposes. Subsequently, the impact of individual passive design strategies on operative temperature was evaluated. According to the literature review, we found that some studies employed an overlay of single optimal technology while running the simulation [31,80], and this study also used such technology. The base model was generated referring to a case study school, which is a representative school found around the Kathmandu valley and other places located in the temperate climates of Nepal [45]. The case study building has a similar structure, form, and materials as other school buildings.
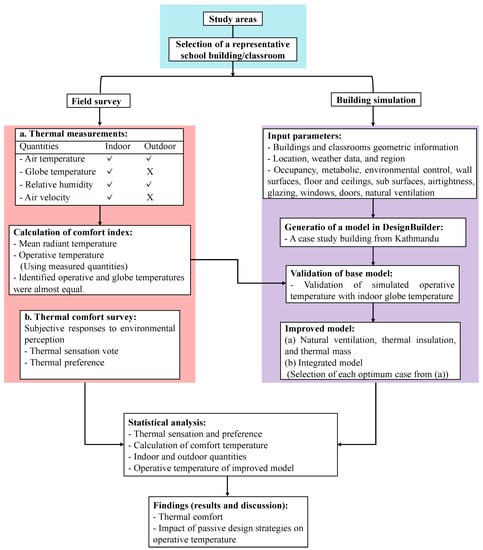
Figure 1.
Flow chart of the study.
2.1. Description of Geography, Climatic Conditions, and a Case Study Building
Nepal has a varied climate, owing to its geography and altitude. It is divided into three topographic regions: the Himalayan north has a cold climate, the hilly middle has a temperate climate, followed by the subtropical Terai south. The most dominant climate type is temperate, characterized by a dry winter and hot summer. Figure 2a shows the location of the investigated areas in a temperate climate region on the map of Nepal. The outdoor air temperatures in this area generally decrease in October and reach their minimum in January. June to September have the hottest temperatures, most rainfall, and highest humidity (70–83%) [45]. Field studies were conducted in three school buildings: one in Kathmandu (S1) and two in the Dhading district (S2 and S3). However, the focus of this study was on the S1 school building for simulation and depth analysis. Figure 2b–d shows a view of the case study school S1. It is a one-storey uninsulated, pitched-roof building with its main façade facing south, which is naturally ventilated by keeping windows and doors open, and no mechanical equipment is installed. The external walls are fabricated of bricks, and the inner wall surfaces are finished using plaster and mortar. It is a private secondary school building and representative of the commonly found school buildings around Kathmandu and other places in Nepal [45].
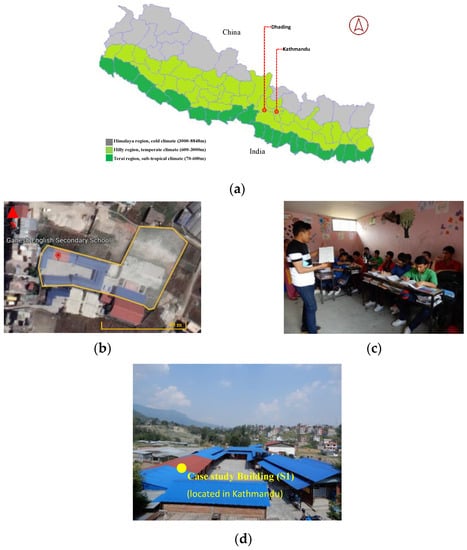
Figure 2.
(a) Location of the study area; (b) satellite image of the case study school building (S1); (c) internal view of the case study classroom, which is represented by zone 3 during the simulation; and (d) external view of S1. The building S1 is elevated above sea level at 1345 m and has a temperate climate. The location of the school building is 27.77348° N and 85.33081° E.
2.2. On-Site Measurement
The indoor and outdoor measurements of environmental quantities such as air temperature, globe temperature, and relative humidity were measured continuously in the classrooms of all buildings from 21 May to 12 July 2019 (from 29 May for S1). Figure 3 shows representative views of the setup instrument in the classroom for the measurements. Before beginning the survey, instruments with data loggers were set up and students were instructed not to interfere with the setup devices. The data were measured at 10 min intervals. The indoor measurement was performed in the middle of each classroom away from the doors and windows at a height of approximately 1.1 m [33]. The outdoor sensors of the data logger were protected from the effects of solar radiation and moisture sources around them. Table 3 lists the properties of the digital data loggers that were used in the study. The black-painted globe thermometer with a 75 mm diameter has a higher response time for temperature measurement and was therefore used in this study [6].
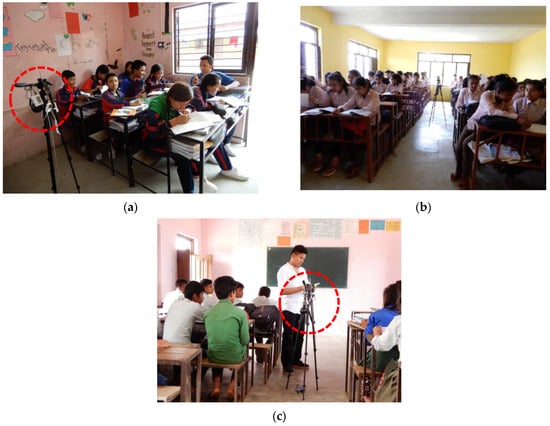
Figure 3.
Internal view shows the position of digital instruments with data loggers: (a) S1; (b) S2; and (c) S3.
Table 3.
Properties of the data logger used.
2.3. Thermal Comfort Survey
In addition, the thermal responses were determined based on thermal measurements. A total of 246 students, 40% male (n = 101) and 60% female (n = 145) of the age group 12–18 years, participated in the survey. The average height and weight were 1.5 m (male: 1.54 m and female: 1.48 m) and 42.6 kg (male: 43.5 kg and female: 42 kg), respectively. Altogether, seven classrooms were visited in three school buildings during the study. Students from Grade 9 and 10 participated in the case study building (S1), with 19 and 14 students accommodated, respectively. A seven-point thermal sensation scale and five-point preference scale with Nepali language translation was used for ease of response. The Nepali translation was previously validated in a study [81] and has been used widely in other studies conducted in Nepal [20,45,82,83]. We asked the students about their thermal sensations and preferences, as shown in Table 4. The students voted three times, as shown in Figure 4, and 737 responses were collected per question. Voting occurred in a sedentary condition without disrupting the normal lesson.
Table 4.
Scales used for questionnaire survey.
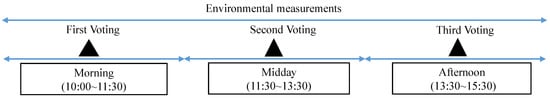
Figure 4.
The procedure of thermal comfort survey and environmental measurements. The voting time environmental quantities were also noted from the continuous measurement.
2.4. Comfort Index for Analysis
Measuring the indoor air temperature or mean radiant temperature (MRT), is not sufficient to determine the overall thermal environment and comfort level within a space. This is because these factors do not consider other important aspects of the thermal environment such as heat exchange, conduction, convection, and the effect of air velocity. All these factors can have an impact on thermal comfort and must be considered to accurately evaluate the indoor thermal environment. As a result, another decisive index, known as “operative temperature”, is required, which is a function of air temperature and mean radiant temperature, and is calculated using the following equations [20,45,84]:
where Tg is globe temperature (°C); Ta is indoor air temperature (°C), Va is air velocity (m/s), ε: is emissivity (=0.95 for a black globe), and D is diameter (=0.075 m for a globe).
Tmrt = [(Tg + 273)4 + (1.1 × 10⁸ × Va0.6 × εD−0.4) (Tg − Ta)]0.25 − 273
Top = (Ta + Tmrt)/2
Moreover, the adaptive comfort model suggests judging the indoor thermal comfort of a naturally ventilated space using operative temperature [85]. We measured the air velocity only during the voting time, so the operative temperature could not be calculated for the whole-day lesson period. Using the voting time measurements of indoor air temperature, indoor globe temperature, and air velocity on the survey day (28 May) in S1 building, the operative temperature was calculated. Figure 5 shows the correlation between the indoor globe and operative temperature, which indicates that they are equal. Bradshaw [86] reported that the globe temperature is approximately the same as the operative temperature. Kazkaz and Pavelek [87] found that the globe temperature is equal to the operative temperature (less than 0.6 K) in the range of air velocities higher than 0.2 m/s and the difference in MRT and air temperature is less than 10 K. This implies that globe temperature and operative temperature can be used interchangeably. The differences in MRT and air temperature in the case study classroom at 11:00, 13:00, and 15:00 were 0.2 °C, 2.2 °C, and 0.3 °C, where the five-minute average air velocity was recorded automatically by the data logger as 0.20 m/s, 0.32 m/s, and 0.38 m/s, respectively. Many studies [82,88] found that the globe and operative temperatures were numerically equal; therefore, we chose the operative temperature for the thermal comfort analysis.
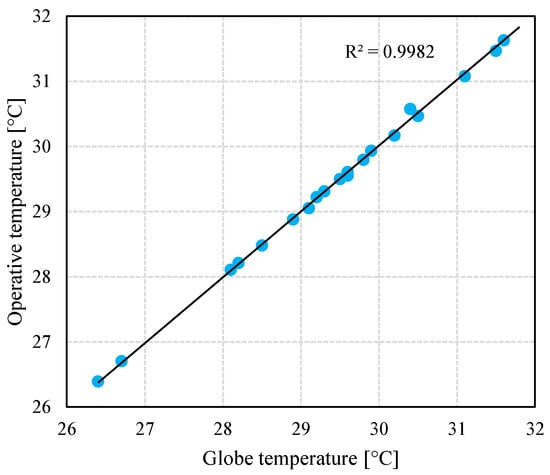
Figure 5.
Relationship between calculated operative temperature and measured globe temperature.
2.5. Simulation
Many building simulation software packages have been developed. Of these, this study used DesignBuilder in conjunction with EnergyPlus, one of the most recognised building energy and thermal performance simulation software programs, as an environmental analysis software to design buildings and carry out the simulation [89]. This is a powerful building simulation program that facilitates a three-dimensional (3D) graphical interface for EnergyPlus, which is used to model whole-building energy use, climate conditions, and thermal loads. Input data are inherited from the level above it in the hierarchy: block data from the building level, zone data from block data, and surface data from zone data [89]. This mechanism makes it easy to change the setting at any level but not in the reverse order. Weather data for a particular year cannot better predict future conditions because the weather varies from year to year. Meteorological data from multiple years have been compiled into a Typical Metrological Year (TMY), which is used in DesignBuilder. The Energy Plus Weather (EPW) data file of Kathmandu (Tribhuvan International Airport Station) was loaded into the software and used for the simulation. The case study building was located approximately 8 km from the weather station. Figure 6 shows the monthly mean (dry-bulb and dew point) outdoor temperature, wind speed, and solar radiation of Kathmandu obtained from the weather data file. Maximum airspeed was observed from March to June. The maximum diffuse and direct solar radiation were 95 kW/m2 and 175 kW/m2, respectively. The simulated data were analysed by exporting them to a spreadsheet.
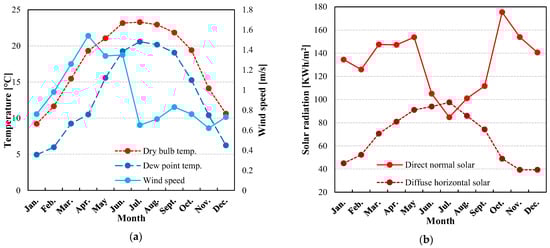
Figure 6.
Monthly average values of climatic data in Kathmandu: (a) outdoor temperature and wind speed and (b) direct normal and diffuse horizontal solar radiation.
2.6. Base Case Model
Figure 7 shows a 3D view of the simulated building (S1) and classroom (zone 3) generated in DesignBuilder using the collected information. Figure 7a shows the sun path around the simulated school building, whose main axis is oriented towards the south. Table 5 lists the characteristics and properties of building materials. The wall was composed of two layers: a cemented bonded outermost layer and an innermost layer. The pitched roof (corrugated) was fabricated of a zinc sheet with a thickness of 3 mm, and the roof was supported by an iron truss. The height of the pitched roof was set at 80 cm from the wall level. The ceiling was finished with plywood with a thickness of approximately 18 mm. The outermost layer of the floor was fabricated of cement/plaster/mortar. The partition wall was plastered on both the sides. The window wall ratio was kept at 20%, and a single 6 mm thick clear glass was selected. Shading options were not used. All the classrooms in this building have the same dimensions. A description of the simulated classroom is provided in Table 6. The minimum fresh air ventilation of 8 l/(s·p) was chosen as the recommendation of ASHRAE [90]. For airtightness, the minimum number of air change rates (ACH) of 1 per hour was considered to represent the unintended airflow through cracks. The ventilation was set to 59 ACH, which is the calculated value for the same classroom in the authors’ previous study [33]. We scheduled the natural ventilation ON for six days as the windows and doors were open, except Saturday. The lighting was set to 347 lux, as we took the average value of the measurements in the simulated school. Computers, office equipment, mechanical heating-cooling, miscellaneous, general lighting, and domestic hot water (DHW) were turned off. The activity levels of reading and sitting were chosen as the survey was conducted during regular lessons with no physical activities, and the CO2 generation rate was set to its default value. All the above-mentioned activities, materials, constructions, openings, and so on (Table 5 and Table 6) were input into the simulation software to generate the model, and base model zone 3 was selected for further analysis. Only two classrooms, zone 3 and 4, were investigated in the case-study building. Zone 2 was occupied for official purposes, which could have had a much higher solar radiation impact than the remaining classrooms. As a representative, we chose zone 3, which represents middle classrooms.
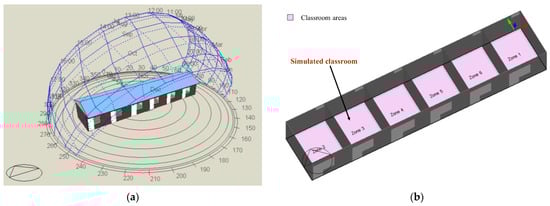
Figure 7.
Three-dimensional view of the simulation school building model (S1): (a) sun path diagram and (b) zones. No urban setting was included in the model.
Table 5.
Building materials and their corresponding properties assigned for the model.
Table 6.
Description of the simulated classroom.
2.7. Model Validation
The base model was validated using the measured globe temperature and simulated operative temperature. Model accuracy was checked using the root mean square error (RMSE) [30,56]. It measures the closeness between the measured and simulated data. For the reliability of the simulated model, the mean absolute error (MAE) [56,63] and standard deviation of the mean absolute error (MAESD) were employed [63]. Moreover, the percentage error was used to check accuracy.
where Top and Tg are the simulated operative temperature and the measured globe temperature at time I, respectively, and n is the total number of datasets.
3. Thermal Comfort of Students
3.1. Measurement Thermal Environment during the Voting Time
Indoor and outdoor environmental quantities were measured and investigated to observe their trends. The globe temperature was measured, which represents the combined effect of radiation from the inner surfaces and convection of indoor air. The measured indoor air temperature (Ta) and globe temperature (Tg) was similar and stable. Figure 8a shows the overall regression relationship between the continuously measured indoor globe temperature and outdoor air temperature (To) during voting time. The indoor globe temperature was between 29.6 and 31.5 °C in S1, while the outdoor air temperature was between 29.7 and 32.1 °C, which is higher than that of the other investigated buildings. Both the indoor globe and outdoor temperatures showed similar variation trends. The differing temperatures among buildings are probably due to their architectural characteristics, geography, climatic conditions, orientation, etc.
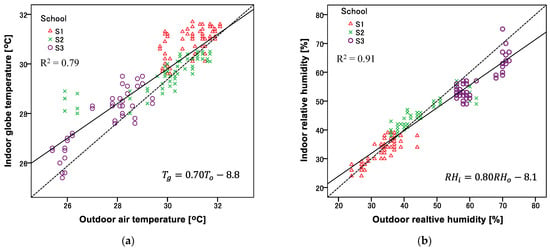
Figure 8.
Measurement during the voting time in S1, S2, and S3 buildings: (a) indoor globe and outdoor air temperatures and (b) indoor and outdoor relative humidity.
Figure 8b shows the overall regression relationship between the indoor (RHi) and outdoor relative humidity (RHo). The indoors followed the outdoors. S1 and S3 have the lowest and highest relative humidity, respectively, among all school buildings. The outdoor relative humidity was between 24 and 44% and for indoors between 27 and 39% during regular lessons of survey time in S1. These are correlated and similar to each other. This confirms that the natural ventilation was effective.
3.2. Thermal Sensation, Preference, and Comfort Temperature
This section presents students’ perceptions of the indoor thermal environment mentioned in the previous section. Figure 9a,b show the overall distribution of the thermal sensations and preferences of the students. This shows that 75.9% of the responses were towards the hotter side (responses for 5. slightly hot, 6. hot, and 7. very hot), preferring a cooler thermal environment. At neutral, there were few responses. The results showed that 63.6% of the responses fell within the central three categories (responses for 3. slightly cold, 4. neutral, and 5. slightly hot) in the comfort zone, which is representative of acceptance and satisfaction. The responses of the students in the simulated school building showed that 88.7% of them were towards the hotter side. A total of 54.5% of the responses were within the central three categories. Overall, the preference for “3. no change” was 21.8%. A total of 75.8% responses indicated a preference for low temperatures. In the simulated school building, 84.8% of students responded to a preference for cooler, with 15.2% for the response 3. no change. A significant number of responses on the hotter side were related to issues of thermal comfort and environment in school buildings. The indoor temperature should be improved to improve the responses of the students towards the comfort zone. Statistically, no significant differences were observed between males and females in their sensations and preferences.
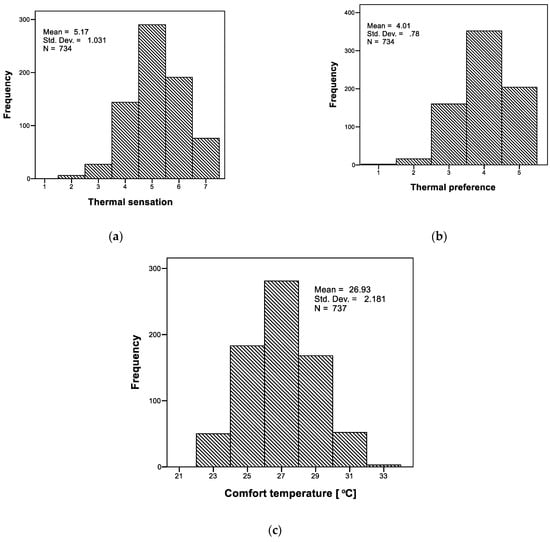
Figure 9.
Overall distribution of (a) thermal sensation, (b) preference, and (c) estimated comfort temperature.
The comfort temperature, based on the thermal sensation and measured indoor globe temperature, was estimated using the Griffiths method with a constant of 0.50 [45,91]. The estimation method is as follows:
where Tc is the comfort temperature (°C), Tg is the indoor globe temperature during the voting time (°C), TSV is thermal sensation vote, and a is a constant (a = 0.50, corresponding to a change in one subjective category per 2 °C change in globe temperature).
Tc = Tg + (4 − TSV)/a
Figure 9c shows the distribution of the estimated comfort temperature with an average of 26.9 °C. S1 in Kathmandu has a higher average comfort temperature at 28 °C than S2 and S3 at 27.5 °C and 25.5 °C, respectively. S3 was significantly lower than that of the remaining samples. Male and female average comfort temperatures were 27.2 °C and 26.7 °C, respectively, with no significant gender difference found overall. The estimated comfort temperatures were mostly between 25 °C and 29 °C, but they had a wide range overall. These findings are close to the studies conducted in naturally ventilated school buildings during the hot seasons [42,45,47]. The students perceived a comfort temperature owing to their greater adaptation status and tolerance to the indoor thermal environment.
4. Thermal Improvement of the Classroom Based on Simulation
4.1. Daily Variation in the Indoor and Outdoor Air Temperatures
Figure 10 shows the continuously measured indoor air temperature, globe temperature, and outdoor air temperature variations in the case study classroom (zone 3) for seven days. The indoor air and globe temperatures did not differ significantly and were quite similar on all seven days. However, the outdoor air temperature variations were slightly sharper than the corresponding indoor air and globe temperatures. Both the indoor and outdoor temperatures showed similar fluctuation patterns, with the highest temperature peaks occurring during the day. Indoor fluctuations were probably because there was not much effective thermal capacity of building materials or ventilation effect. The figure confirms that the maximum indoor temperatures that follow the outdoor air temperature begin to occur after 12:30, which is approximately 30 °C, and after a certain time, the temperature decreases. Furthermore, the outdoor air temperature amplitude during the day reaches a maximum of more than 35 °C, whereas it reaches a minimum of less than 20 °C at night. There are cases where the differences between the indoor globe and outdoor air temperatures were 5.4 °C during the daytime.
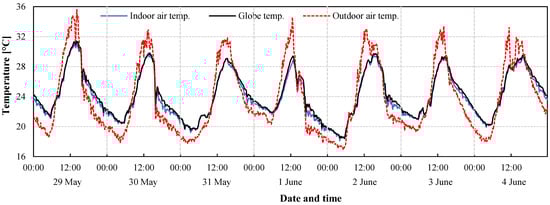
Figure 10.
Variation in measured indoor and outdoor temperatures in zone 3 of the S1 school building over a week (2019).
The average comfort temperature, as found in Section 3.2, was 26.9 °C. The average comfort temperature appears to be close to both the average school-hour (10:00–16:00) indoor air temperature (28.0 °C) and the globe temperature (28.1 °C). However, the indoor globe temperatures are higher than 28.0 °C, and improvement is needed to reduce them.
4.2. Validation of the Base Model
Simulations were performed for one week, but for the purpose of validation and analysis, we focused on one day in this study as a representative example. As shown in Figure 10, environmental measurements were taken continuously starting on 29 May, and the devices were allowed to adjust to the classroom environment for a week. From 30 May to 4 June, and on other days, the maximum temperature was approximately 29 °C. Therefore, we chose June 4th as the hottest day for further analysis and validation. Furthermore, on 4 June we observed a high accuracy of the simulated operative temperature with the measured globe temperature among the simulated days. The base model was validated using the measured globe and operative temperatures simulated using the simulation results of zone 3. The simulation was performed for multiple days, but the simulated temperature on 4 June was used for the model validation. Figure 11 shows the variation and relationship between them for a given day. Good agreement was found between the measured globe temperature and the simulated operative temperature, with a correlation coefficient of 0.96. The RMSE value was 0.074 °C. A mean absolute error (MAE) of 0.70 °C with a standard deviation of MAE of 0.55 °C was found, which shows the reliability of the simulated operative temperatures. Furthermore, the good agreement, with an average percentage error of 2.8%, is comparable to previous studies [32]. This confirms that the base model is applicable for investigating the operative temperature according to the passive design.
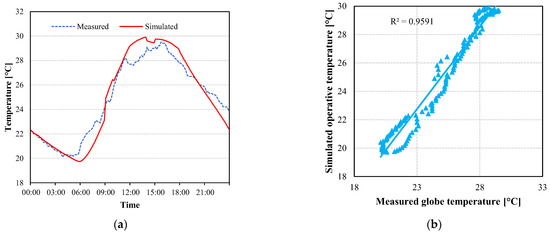
Figure 11.
Validation of the base model: (a) variation (b) relationship between the measured globe and simulated operative temperatures on 4 June 2019. A few other studies [67,92] used measured indoor air temperature and simulated operative temperature to validate models.
As discussed in the previous sections, students experienced thermal discomfort at high temperatures. Therefore, the following sections analyse how to reduce such discomfort by reducing high temperatures through use of passive design strategies, using the simulation results for zone 3 in the S1 school building in Kathmandu. The strategies such as natural ventilation, thermal insulation, and thermal mass, can be used as retrofit in practical situations or before construction. Individually, each strategy was investigated separately while keeping the other components unchanged. Subsequently, their impacts on the operative temperature were analysed to identify the optimum case for each strategy. The strategies were applied at the whole-building level, but we only analysed the simulated classroom (zone 3). We selected affordable passive refurbishment expanded polystyrene (EPS), glass wool (GW) as an insulating material, and cast concrete as a thermal mass for improvement, considering that they are found at the local level in the study area. The simulation was run at 10 min intervals.
4.3. Natural Ventilation in Terms of Number of Air Change Rate
The only way to keep an indoor environment cool in the absence of temperature or humidity control and prevent overheating is by providing natural ventilation [93]. Sufficient airflow can ensure good ventilation in indoor spaces, such as classrooms, depending on building orientation and window position. This makes the students feel more comfortable and maintains indoor air quality by increasing wind speed during school hours [47]. In the base model, 59 ACH was used for natural ventilation, which is the average ACH value for the classroom estimated in our previous study [33]. However, the time-variant ACH was estimated, and the range of ventilation for the classroom was 47.8–99 ACH. A numerical simulation method was developed based on the transient mass balance to estimate the ACH. Such high ventilation is probably due to the buoyancy effect and size of the room. The heat generated inside the classroom is not only due to solar radiation but also from the students, and this results in a temperature difference inside the classroom indicating that there is an effect of buoyancy in addition to cross ventilation. The air heated by the bodies of students, which is less dense and creates low pressure, rises and escapes from the window located at the upper part. The cooler air is sucked from the opening below or from the window on the opposite side from outside. This effect must have led to the high ACH. According to one study [94], different heights of windows at different positions create a significant buoyancy effect on ventilation, resulting in higher ventilation. They found that 45% and 100% of openings on opposite sides at different heights had a higher ACH. Furthermore, when the window openings are stacked one over the other, there is a greater chance of an air current short circuit occurring. This may create a high ventilation rate without sufficient mixing of the outdoor air throughout the room.
As mentioned in Table 6, the width of the case study classroom is just 3.8 m, and the classroom has a small volume. As a result, the air exchange takes less time. This can be confirmed by the measured five-minute mean air velocity (0.20 to 0.38 m/s during the regular lesson, as mentioned in Section 2.4). For these reasons, ACH is high in classrooms. Table 7 summarises the ACH used to maintain the summer indoor temperatures found in previous studies [33,75,80,95,96,97,98,99]. An ACH of 42–73 h−1 was found in a study conducted in traditional houses in Nepal for winter indoor thermal improvement during the day [75]. According to a study conducted by Chaulagain et al. [95] in twenty-five typical residential buildings in Nepal, an average ACH of 55.5 was obtained under natural ventilation at 50 Pa using the fan pressurisation method. Tong et al. [80] found that natural ventilation could reach up to 91 ACH in a free-running room, which is suitable for maintaining indoor air temperature. Yik et al. [96] found that in a well-ventilated indoor space with approximately 50 ACH, the indoor air temperature could be maintained below 28 °C without cooling. Park et al. [98] and Aguilar et al. [99] found that natural ventilation was greater than 20 ACH in educational buildings during the summer.
Table 7.
Summary of ACH and its range in previous studies conducted in various indoor spaces.
A series of air change rate (ACH) values of 20, 40, and 80 were applied to investigate the impact of ventilation on the operative temperature. Figure 12 shows that the operative temperature decreased as the ACH increased and became minimal beyond 59 ACH, mainly during the daytime. The maximum temperature for 80 ACH was approximately 1 °C lower than that of the base model. Owing to the high ACH, the heat in the classroom is carried away from the inner walls or ceilings by convection, thereby lowering the MRT and weakening the heat storage. Consequently, the operative temperature is lowered, which improves the perception of thermal comfort among students. Furthermore, the cooling effect of night ventilation can also reduce the indoor temperature of the following day. For security reasons, it may not be possible to leave the windows open during the night. A study conducted in a multi-storey school building in Japan found that the natural ventilation strategy effectively reduced energy use by approximately 30% compared with the mechanical ventilation [100].
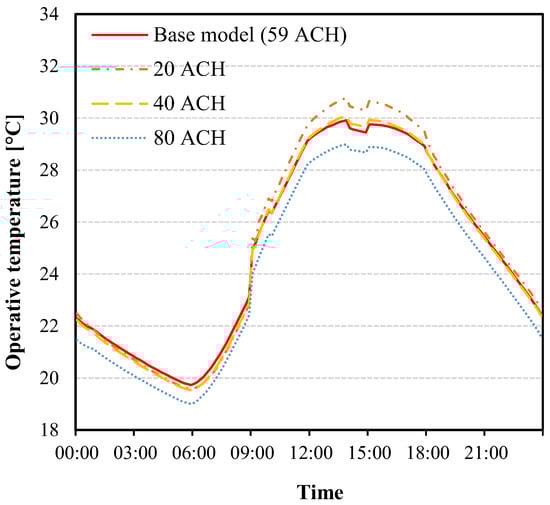
Figure 12.
Impact on operative temperature due to natural ventilation.
4.4. Thermal Insulation
4.4.1. Thermal Insulation in the External Wall
Insulation maintains an indoor temperature reduction, minimising the heat flow through walls and roofs exposed to direct sunlight during the summer. Well-insulated buildings reduce the transmission of heat flow rates, lower the thermal conductivity, and result in a more comfortable indoor thermal environment. It is said that insulation applied externally to an external wall is superior to that applied internally [101,102]. With the same thermal insulation, high thermal inertia tends to maintain a low MRT; therefore, it can improve the thermal comfort during summers [38]. Lu et al. [101] found that the outer insulation appears to be more effective than the inner insulation with the same thermal resistance. Kolaitis et al. [102] found in a numerical study that external insulation saves approximately 8% more energy than internal on an annual basis. Furthermore, Carbonari [71] found through a case study and simulation that external insulation always performs well.
Various thicknesses of EPS (lightweight) were applied to investigate their effects on operative temperature. It was applied to the external wall surfaces of various thicknesses, as shown in Table 8, and plastered on the external surface with gypsum of thickness 15 mm. In a real construction, a metal latch was placed over the EPS board, but it was kept constant during the simulation. Figure 13 shows the fluctuations in the operative temperature after thermal insulation. Thermal insulation with various thicknesses resulted in a low operative temperature because of the low total U-value compared with the base model (3.2 W/(m2·K)). As expected, the thicker the EPS insulation on the walls, the lower the U-value. This was due to a decrease in thermal conduction towards the interior surfaces of the walls. The maximum operative temperature for EPS 200 mm was 1.7 °C lower than that for the base model. This analysis indicates that the indoor temperature can be reduced.
Table 8.
External wall insulation fabricated of expanded polystyrene (EPS) and their thermal properties.
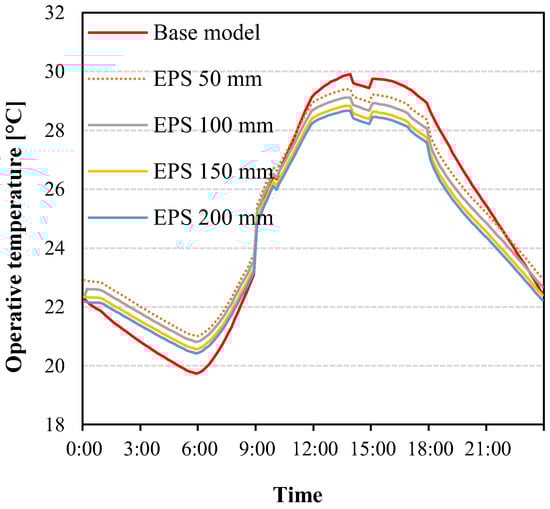
Figure 13.
Impact on operative temperature due to external EPS wall insulation.
4.4.2. Thermal Insulation in the Pitched Roof
Buildings with large roofs experience significant heat gains and losses [74]. In summer, the roof receives a longer, more intense, and higher amount of solar radiation owing to the path of the sun (Figure 7a), which creates the worst indoor thermal conditions. Because the simulated building has a pitched zinc roof, its U-value is higher than that of the other components owing to its lower insulating property. Consequently, more heat is transmitted through the roof and attic, as well as through the indoor space, becoming warmer throughout the day. Therefore, this section discusses the effects of insulation on the zinc roof to address this issue. Glass wool (GW) of various thicknesses was applied. Table 9 lists the roof properties for each case. GW insulation was applied internally below the pitched zinc roof, keeping the other structure constant. Figure 14 shows the impact on the operative temperature after applying various thicknesses of insulation to the inner surface of the pitched zinc roof. The maximum operative temperature for a GW of 200 mm is 2.0 °C lower than that for the base model. Even though the operative temperature was reduced, a time lag was observed around 17:00. The effect of the GW 200 mm insulation was higher than that of the other cases. Consequently, as the insulation becomes thicker, lower operative temperatures can be achieved during the day. According to Alghamdi et al. [2], the proper construction of roof reduced the operative temperature by 20% by lowering the U-value from 6.22 to 0.24 W/(m2·K), resulting in 3.25 times fewer thermal discomfort hours for students.
Table 9.
Zinc roof insulation fabricated of glass wood (GW) and their thermal properties.
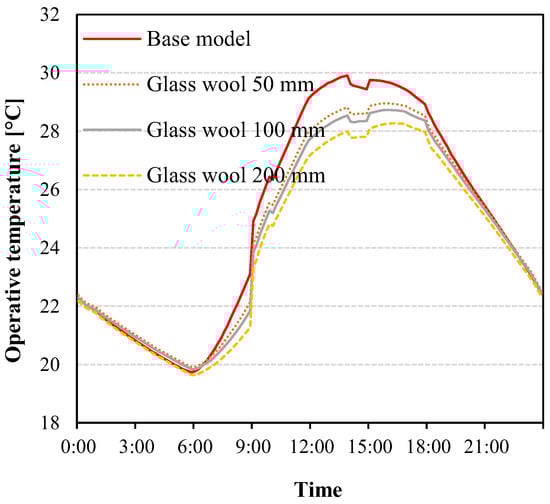
Figure 14.
Impact on operative temperature due to pitched roof insulation using glass wool (GW).
4.4.3. Thermal Insulation over the Plywood Ceiling
There are several ways and types of providing insulation below the rafters that minimise and prevent thermal bridges and stabilise the indoor temperature. The simulated building only had 18 mm of white-painted plywood below the pitched roof as its ceiling. Subsequently, we applied 50–200 mm of lightweight EPS (Table 10). It was applied on the outer side (pitched roof face) of the ceiling. Figure 15 shows the operative temperature fluctuation after applying insulation above the plywood ceiling. For the 50 mm EPS, the effects on the operative temperature were minor. This might be because 18 mm of lightweight plywood was used as the thermal insulating material. However, for the 100 mm, 150 mm, and 200 mm EPS, the temperature was reduced during the day. The maximum operative temperature for EPS-200 mm was 2.2 °C lower than that for the base model. In particular, during the daytime, owing to high solar radiation, the zinc roof is heated, and ultimately the inner roof surface temperature increases. The results showed that if a suitable insulation material was used, such as EPS, then the temperature indoor scan can be reduced during the day.
Table 10.
Ceiling insulation fabricated of expanded polystyrene (EPS) and their thermal properties.
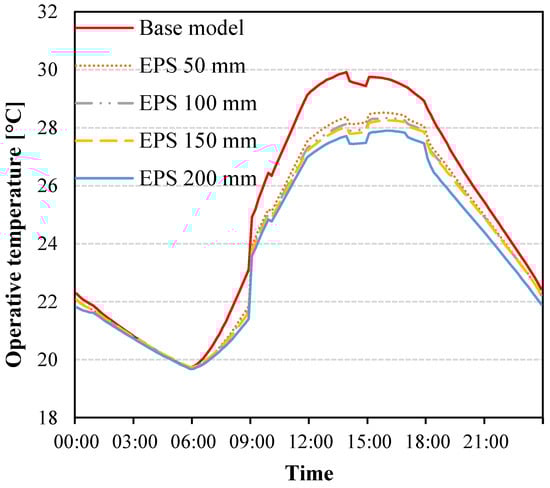
Figure 15.
Impact on operative temperature due to ceiling insulation using expanded polystyrene (EPS).
4.5. Thermal Mass in External Walls
This section analyses the impact of cast concrete as a thermal mass with different thicknesses employed for thermal improvement. Table 11 lists the cast concrete thickness and U-value of the improved wall. Figure 16 shows that the use of cast concrete (dense) as a thermal mass in external walls reduces the operative temperature. At 14:00, the maximum operative temperature is lowered by 2.4 °C more than the base model for cast concrete (150 mm). The impact of a thicker thermal mass has less swing than a low-thermal mass impact on the operative temperature, which follows the pattern of the outdoor air temperature. The operative temperature is shifted to a later time (thermal lag), which is due to the storage of heat in the walls and increases the time of heat transfer from the outside to the inside. Figure 16 shows that the temperature was high after 16:00, which is almost the end of the lectures in the school. Zahiri and Altan [31] suggested using a thick heavyweight thermal mass to reduce indoor air temperature in the warm season. Su et al. [38] found that adding thermal mass to an envelope can not only increase the winter indoor mean air temperature by more than 18 °C but can also reduce the fluctuation of indoor air temperatures and relative humidity in classrooms. Kuczynski et al. [103] found that increasing the thermal mass without night ventilation resulted in a reduction in the maximum daytime indoor temperature by 4.1–4.6 K. A bioclimatic study conducted in India [24] found that effective passive cooling is due to the thermal mass in temperate climates, where the results of this study also agreed.
Table 11.
Thermal mass applied to the base case and their thermal properties.
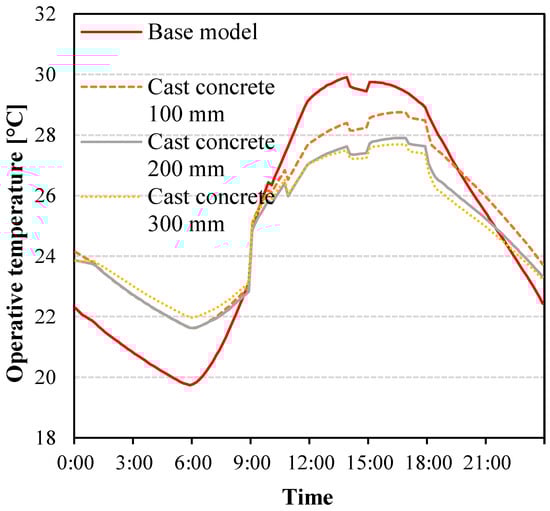
Figure 16.
Impact on operative temperature due to use of cast concrete as thermal mass.
4.6. Integrated Optimum Model
This study used the optimum design technology concept to investigate the effect of each passive design strategy on the thermal conditions (operative temperature) that are feasible, effective, and practical for application in existing and new school buildings. Increasing the insulation thickness or thermal mass can be effective in reducing the operative temperatures. However, it reduces the classroom area, and thus, the optimal selected case might be appropriate for improving the models. Therefore, this section investigates the impact of combined optimal passive strategies. They were selected from the previously analysed sections based on their maximum impact on reducing the operative temperature. Table 12 lists the optimal design cases for each strategy selected for the integrated design. Figure 17 shows the operating temperature of the integrated optimum model. The analysis showed that the maximum operative temperature decreased by 3.3 °C. The operative temperature was maintained at 24.6 °C at 10:00 and 26.7 °C at 16:00, showing that they fell within the 90% acceptability limits according to the ASHRAE adaptive standard [104]. Even at night, around 00:00–9:00, the operative temperature was lower than approximately 22.5 °C. Kuczynski et al. [103] also found that the combined effect of thermal mass, ventilation, and blind control resulted in lowering the temperature below the maximum limit by 7.4 K during summer. Zahiri and Altan [31] found that the combined optimum factors from the passive design strategies of orientation, shading, thermal mass, natural ventilation, and insulation decreased the indoor air temperature by approximately 5 K. Kang et al. [17] found that the integration of passive and active strategies in a Korean school building reduced the energy consumption to 21.82 kWh/(m2·year), which is close to the approximate energy-saving rate of 51%.
Table 12.
Structure of the base model and the integrated model.
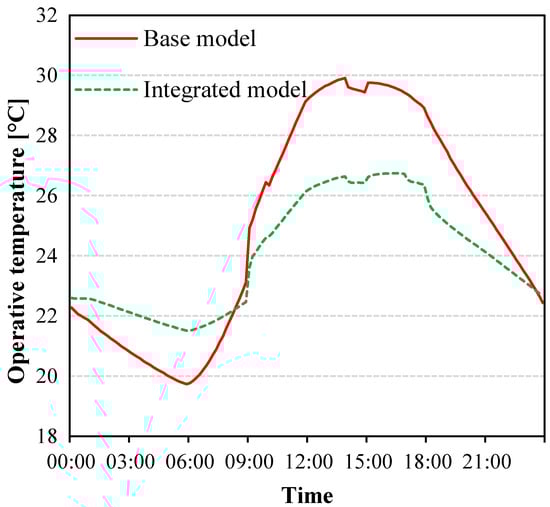
Figure 17.
Impact on operative temperature due to integrated design strategy.
5. Overall Discussion
This section presents discussions on the perceived thermal comfort of students and the improved operative temperature, as presented in Section 3 and Section 4. The indoor globe and air temperatures were very close and did not vary significantly when the outdoor air temperature was correlated with the indoor temperature, as shown in Figure 8a. Within this context, almost 63% of the students evaluated their responses in the central three categories according to ASHRAE 80% acceptability [104], and the remaining responses indicated that they were in discomfort and wanted improvement or more accessible adaptive behaviour. Using the thermal perceptions of the students, their respective comfort temperatures were calculated. The average globe and air temperatures were very close to the estimated average comfort temperature during school hours. The average comfort temperatures in the three schools differed slightly from each other. Rijal [105] also found a similar trend in the results within the same area in the extremely cold climate of Nepal, which was due to the exposed indoor temperature. However, the average comfort temperature in this study is close to the results of previous studies conducted under naturally ventilated conditions. Singh et al. [4] concluded that outdoor climatic conditions have a strong impact on indoor comfort temperatures, which are higher in the summer than in winter. Shrestha et al. [45] found that the students’ comfort temperature is higher and wider under the condition of natural ventilation in similar types of schools in the temperate climate of Nepal.
We simulated the indoor operative temperature by using various passive design strategies to determine the optimum case for each strategy. We employed passive designs that were practical for school buildings. If the improvements using individual passive designs are made, the maximum indoor operative temperature is found to be lowered by 1 to 2.4 °C from the base model and by 3.3 °C using the integrated optimum model. Figure 18 shows the impact of each strategy, quantifying how each passive strategy impacts the operative temperature during the main lecture time from 10:00 to 16:00. An improvement in the temperature was observed for the integrated case compared with the base model and a few other individual design strategies alone. The operative temperature is improved and maintained close to or below the comfort temperature of 27 °C, as discussed in Section 3.2. This indicates that the temperature was within the acceptable limit after the integrated design was allowed.
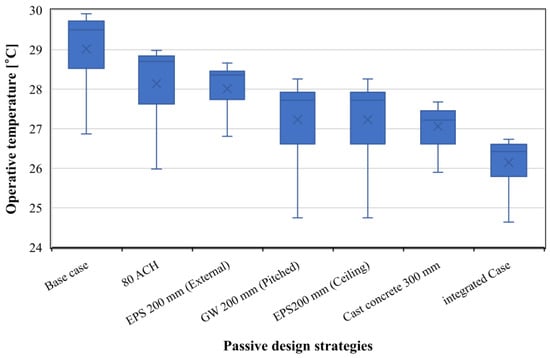
Figure 18.
Box plots of operative temperature at optimum and integrated passive strategy.
Previous simulation studies on school buildings also found a similar trend of reduction in indoor temperature when passive design strategies were employed [31,39,55,57]. Boutet and Hernández [56] found a reduction in indoor air temperature of up to 6 °C. An experiment in a naturally ventilated Indian school by Garg et al. [58] found that a cool roof coating improves the indoor air temperature by 1.5 to 2 °C. Park et al. [27] found that the retrofitting technology improves the thermal comfort of students by 34%. The zinc-roofed building creates the worst indoor thermal conditions during winter nights and summer days. In a simulation model of temporary zinc shelters in Nepal, Thapa et al. [106] found that by reducing the U-value of walls and roofs and adding insulation, such as clothes and cellular polyethylene foam, the indoor air temperature can be maintained above 11 °C. Another study by Shahi et al. [20] in residential buildings in Nepal found that the improvement of insulation and reduction in air leakage increased the indoor air temperature by 1.1–1.8 °C during winter. Therefore, the results and discussions above showed that the operative temperature obtained after using the passive design strategy would be acceptable to the students during the school hour which improves the thermal comfort.
Several studies have been conducted in free-running or naturally ventilated school buildings in various climates to assess the adaptability of students’ thermal comfort. From the above discussions, it can be confirmed that, by using passive design technology, it is possible to create a better, liveable, and more easily adaptable indoor temperature without using mechanical equipment that uses electricity or other types of energy sources. To compensate for the heating or cooling demand, adaptation to the environment created by passive design strategies is the best solution. Therefore, the improvement in indoor temperature using passive design is connected to providing sufficient thermal comfort conditions and rational energy-saving potential [74,107].
However, future studies should be conducted with caution. In Nepal, there are various types of schools with different designs because there is no strict design standard. Therefore, further studies are needed to identify the optimum and integrated cases for application in real design. It is recommended to conduct further research on other types of modern and multi-storey school buildings because this study was conducted for a specific type of school building. However, the methods employed can also be applied to other buildings and climates with similar characteristics. In general, the analysed strategies and their impacts on the indoor thermal environment are understood, but other measures of strategizing, such as window wall ratio (WWR), shading, glazing, etc., require further study to determine their impacts and hold scope for future research. The model was validated using the measured globe temperature and the simulated operative temperature. If we validated this with simulated air or radiant temperature, the result would be different. Thermal comfort was explained using the operative temperature, which could be different if we use air temperature or radiant temperature alone. The analysis was focused on one day, and the results would be different on cloudy summer days. The time lag owing to the effect of the thermal mass has not been shown for multiple days. The aim of this study was not to simulate and analyse the entire building for the whole year. However, energy-saving and cost analyses have not been discussed. To reduce the indoor temperature, there may be new generation thermal insulation materials with high reflection coefficients and high reflection coatings. Studies on such materials should be conducted in the future.
6. Conclusions
This study investigates the impact of passive strategies on thermal comfort in a naturally ventilated school building in Nepal through a field survey and simulations. It shows how thermal comfort can be improved using passive design strategies during summer. This concept can be used as a retrofit in case study buildings or similar types of school buildings, and the concept should work for school buildings that are going to be built in the future in study area or similar types of climates. The major findings are as follows:
- The indoor globe temperature and outdoor air temperature were correlated. The results showed that approximately 63% of the students perceived a hot environment as preferring a cooler environment. Within this context, the average comfort temperature for the summer was 26.9 °C;
- The based model was generated and validated using the measured globe temperature and simulated operative temperature. Subsequently, various types of passive strategies were implemented to identify the optimum and integrated design conditions for maintaining the operative temperature within acceptable limits. The individual simulation results of each strategy showed that the operative temperature was improved during regular school hours if passive design strategies were implemented, and the temperature was maintained at approximately 28 °C;
- The integrated design showed that the maximum operative temperature decreased by 3.3 °C and was maintained below 27 °C, which is the required comfort temperature for students during the hot summer. Therefore, it would be wise to prioritize such strategies to improve the thermal comfort in school buildings.
Therefore, selecting an appropriate passive design strategy during the design stage or retrofitting it provides significant opportunities to maintain a comfortable thermal environment and minimise the cost of energy use that is required to maintain a comfortable indoor temperature. The findings of this study and passive cooling strategies can be applied to similar types of school buildings in temperate climates. This study alone does not provide all the necessary and sufficient information on passive design improvements for thermal comfort conditions in naturally ventilated school buildings. Therefore, further studies should be conducted in different seasons and climates to better understand the impact of passive design improvements or the creation of comfortable environments in Nepalese school building designs. However, we believe that the findings of this study will lead to improvements in existing and new school buildings.
Author Contributions
M.S. and H.B.R.: Conceptualisation, Methodology; M.S.: Software, Data curation, Writing—Original draft preparation, H.B.R.: Supervision, review, and editing. All authors have read and agreed to the published version of the manuscript.
Funding
This research was funded by JST SPRING, grant number JPMJSP 2118.
Data Availability Statement
Not applicable.
Acknowledgments
We would like to thank all students and teachers for their cooperation in our field study, despite their regular lessons.
Conflicts of Interest
The authors declare no conflict of interest. The funders had no role in the study design; collection, analyses, or interpretation of data; writing of the manuscript; or decision to publish the results.
References
- Singh, M.K.; Kumar, S.; Ooka, R.; Rijal, H.B.; Gupta, G. Status of thermal comfort in naturally ventilated classrooms during the summer season in the composite climate of India. Build. Environ. 2018, 128, 287–304. [Google Scholar] [CrossRef]
- Alghamdi, S.; Tang, W.; Kanjanabootra, S.; Alterman, D. Effect of architectural building design parameters on thermal comfort and energy consumption in higher education buildings. Buildings 2022, 12, 329. [Google Scholar] [CrossRef]
- Lamberti, G.; Salvadori, G.; Leccese, F.; Fantozzi, F.; Bluyssen, P.M. Advancement on thermal comfort in educational buildings: Current issues and way forward. Sustainability 2021, 13, 10315. [Google Scholar] [CrossRef]
- Singh, M.K.; Ooka, R.; Rijal, H.B.; Kumar, S.; Kumar, A.; Mahapatra, S. Progress in thermal comfort studies in classrooms over last 50 years and way forward. Energy Build. 2019, 188–189, 149–174. [Google Scholar] [CrossRef]
- Yun, H.; Nam, I.; Kim, J.; Yang, J.; Lee, K.; Sohn, J. A field study of thermal comfort for kindergarten children in Korea: An assessment of existing models and preferences of children. Build. Environ. 2014, 75, 182–189. [Google Scholar] [CrossRef]
- Nicol, F.; Humphreys, M.; Roaf, S. Adaptive Thermal Comfort: Principles and Practice; Earthscan: London, UK, 2012. [Google Scholar]
- Fanger, P.O. Thermal Comfort, Analysis and Applications in Environmental Engineering; McGraw-Hill: New York, NY, USA, 1972. [Google Scholar]
- de Dear, R.J.; Brager, G.S. Developing an adaptive model of thermal comfort and preference. Build. Eng. 1998, 104, 145–167. [Google Scholar]
- Humphreys, M.A.; Nicol, J.F. Principles of Adaptive Thermal Comfort, Sustainable Houses and Living in the Hot-Humid Climates of Asia; Springer: Singapore, 2018. [Google Scholar] [CrossRef]
- ul Haq Gilani, S.I.; Khan, M.H.; Pao, W. Thermal Comfort Analysis of PMV Model Prediction in Air Conditioned and Naturally Ventilated Buildings. Energy Procedia 2015, 75, 1373–1379. [Google Scholar] [CrossRef]
- Cheung, T.; Schiavon, S.; Parkinson, T.; Li, P.; Brager, G. Analysis of the accuracy on PMV-PPD model using the ASHRAE global thermal comfort database II. Build. Environ. 2019, 153, 205–217. [Google Scholar] [CrossRef]
- Humphreys, M.A.; Nicol, J.F. The validity of ISO-PMV for predicting comfort votes in every-day thermal environments. Energy Build. 2002, 34, 667–684. [Google Scholar] [CrossRef]
- Haddad, S.; Osmond, P.; King, S. Revisiting thermal comfort models in Iranian classrooms during the warm season. Build. Res. Inf. 2016, 45, 457–473. [Google Scholar] [CrossRef]
- de Dear, R.J. Thermal Comfort in Air-Conditioned Office Buildings in the Tropics: Standards for Thermal Comfort; Nicol, F., Humphreys, M., Sykes, O., Roaf S.E. Spon, F.N., Eds.; Chapman & Hall: London, UK, 1995; pp. 122–131. [Google Scholar]
- Anderson, J.E.; Wulfhorst, G.; Lang, W. Energy analysis of the built environment—A review and outlook. Renew. Sustain. Energy Rev. 2015, 44, 149–158. [Google Scholar] [CrossRef]
- Global Status Report for Buildings and Construction: Towards a Zero-Emissions, Efficient and Resilient Buildings and Construction Sector, UN Environment Programme. 2021. Available online: https://www.unep.org/resources/report/2021-global-status-report-buildings-and-construction (accessed on 4 November 2022).
- Kang, J.E.; Ahn, K.U.; Park, C.S.; Schuetze, T. Assessment of passive vs. active strategies for a school building design. Sustainability 2015, 7, 15136–15151. [Google Scholar] [CrossRef]
- Wang, Y.; Kuckelkorn, J.; Zhaoc, F.Y.; Spliethoff, H.; Lang, W. A state of art of review on interactions between energy performance and indoor environment quality in Passive House buildings. Renew. Sustain. Energy Rev. 2016, 72, 1303–1319. [Google Scholar] [CrossRef]
- Belmonte, M.V.; López, C.D.; Gavilanes, J.; Millán, E. Introducing passive strategies in the initial stage of the design to reduce the energy demand in single-family dwellings. Build. Environ. 2021, 197, 107832. [Google Scholar] [CrossRef]
- Shahi, D.K.; Rijal, H.B.; Kayo, G.; Shukuya, M. Study on wintry comfort temperature and thermal improvement of houses in cold, temperate, and subtropical regions of Nepal. Build. Environ. 2021, 191, 107569. [Google Scholar] [CrossRef]
- Szokolay, S.V. Environmental Science Handbook for Architects and Builders; The Construction Press: London, UK, 1980. [Google Scholar]
- Daemei, A.B.; Eghbali, S.R.; Khotbehsara, E.M. Bioclimatic design strategies: A guideline to enhance human thermal comfort in Cfa climate zones. Jr. Build. Engr. 2019, 25, 100758. [Google Scholar] [CrossRef]
- Liu, S.; Kwok, Y.T.; Lau, K.K.; Ouyang, W.; Ng, E. Effectiveness of passive design strategies in responding to future climate change for residential buildings in hot and humid Hong Kong. Energy Build. 2020, 238, 110469. [Google Scholar] [CrossRef]
- Bhamare, D.K.; Rathod, M.K.; Banerjee, J. Evaluation of cooling potential of passive strategies using bioclimatic approach for different Indian climatic zones. Jr. Build. Engr. 2020, 31, 101356. [Google Scholar] [CrossRef]
- Yasiri, Q.A.; Szabo, M. Incorporation of phase change materials into building envelope for thermal comfort and energy saving: A comprehensive analysis. Jr. Build. Engr. 2021, 36, 102122. [Google Scholar] [CrossRef]
- Taleb, H.M. Using passive cooling strategies to improve thermal performance and reduce energy consumption of residential buildings in U.A.E. buildings. Frontiers of Arc. Res. 2014, 3, 154–165. [Google Scholar] [CrossRef]
- Park, J.H.; Yun, B.Y.; Chang, S.J.; Wi, S.; Jeon, J.; Kim, S. Impact of a passive retrofit shading system on educational building to improve thermal comfort and energy consumption. Energy Build. 2020, 216, 109930. [Google Scholar] [CrossRef]
- Emil, F.; Diab, A. Energy rationalization for an educational building in Egypt: Towards a zero energy building. Jr. Build. Engr. 2021, 44, 103247. [Google Scholar] [CrossRef]
- Randjelovic, D.; Vasov, M.; Ignjatovic, M.; Stojiljkovic, M.; Bogdanovic, V. Investigation of a passive design approach for a building facility: A case study. Energy Sources Part A Recovery Util. Environ. Eff. 2021, 1–19. [Google Scholar] [CrossRef]
- Ascione, F.; Bianco, N.; De Masi, R.F.; Mastellone, M.; Vanoli, G.P. Phase Change Materials for reducing cooling energy demand and improving indoor comfort: A step-by-step retrofit of a Mediterranean educational building. Energies 2019, 12, 3661. [Google Scholar] [CrossRef]
- Zahiri, S.; Altan, H. The effect of passive design strategies on thermal performance of female secondary school buildings during warm season in a hot and dry climate. Front. Built Environ. 2016, 2, 3. [Google Scholar] [CrossRef]
- Liu, Y.; Jiang, J.; Wang, D.; Liu, J. The passive solar heating technologies in rural school buildings in cold climates in China. Jr. Build. Phy. 2018, 41, 339–359. [Google Scholar] [CrossRef]
- Shrestha, M.; Rijal, H.B.; Kayo, G.; Shukuya, M. An investigation on CO2 concentration based on field survey and simulation in naturally ventilated Nepalese school buildings during summer. Build. Environ. 2022, 207, 108405. [Google Scholar] [CrossRef]
- de Dear, R.; Kim, J.; Candido, C.; Deuble, M. Adaptive thermal comfort in Australian school classrooms. Build. Res. Inf. 2015, 43, 383–398. [Google Scholar] [CrossRef]
- Corgnati, S.P.; Ansaldi, C.R.; Fllippi, M. Thermal comfort in Italian classrooms under free running conditions during mid seasons: Assessment through objective and subjective approaches. Build. Environ. 2009, 44, 785–792. [Google Scholar] [CrossRef]
- Adekunle, T.O. Thermal performance and apparent temperature in school buildings A case of cross-laminated timber (CLT) school development. Jr. Build. Engr. 2021, 33, 101731. [Google Scholar] [CrossRef]
- Kükrer, E.; Eskin, N. Effect of design and operational strategies on thermal comfort and productivity in a multipurpose school building. Jr. Build. Engr. 2021, 44, 102697. [Google Scholar] [CrossRef]
- Su, B.; Milic, R.J.; McPherson, P.; Wu, L. Thermal performance of school buildings: Impacts beyond thermal comfort. Int. J. Environ. Res. Public Health 2022, 19, 5811. [Google Scholar] [CrossRef] [PubMed]
- Alwetaishi, M.; Al-Khatri, H.; Benjeddou, O.; Shamseldin, A.; Alsehli, M.; Alghamdi, S.; Shrahily, R. An investigation of shading devices in a hot region: A case study in a school building. Ain Shams Eng. J. 2021, 12, 3229–3239. [Google Scholar] [CrossRef]
- Hamzah, B.; Gou, Z.; Mulyadi, R.; Amin, S. Thermal comfort analysis of secondary students in the tropics. Buildings 2018, 8, 56. [Google Scholar] [CrossRef]
- Talukdar, M.S.J.; Talukdar, T.H.; Singh, M.K.; Baten, M.A.; Hossen, M.S. Status of thermal comfort in naturally ventilated university classrooms of Bangladesh in hot and humid summer season. Jr. Build. Eng. 2020, 32, 101700. [Google Scholar] [CrossRef]
- Liang, H.H.; Lin, T.P.; Hwang, R.L. Linking occupants’ thermal perception and building thermal performance in naturally ventilated school buildings. Appl. Energy 2012, 94, 355–363. [Google Scholar] [CrossRef]
- Munonye, C.; Ji, Y. Evaluating the perception of thermal environment in naturally ventilated schools in a warm and humid climate in Nigeria. Build. Ser. Engr. Res. Tech. 2020, 42, 5–25. [Google Scholar] [CrossRef]
- Aparicio-Ruiz, P.; Barbadilla-Martín, E.; Guadix, J.; Munuzuri, J. A field study on adaptive thermal comfort in Spanish primary classrooms during summer season. Build. Environ. 2021, 203, 108089. [Google Scholar] [CrossRef]
- Shrestha, M.; Rijal, H.B.; Kayo, G.; Shukuya, M. A field investigation on adaptive thermal comfort in school buildings in the temperate climatic region of Nepal. Build. Environ. 2021, 190, 107523. [Google Scholar] [CrossRef]
- Pereira, L.D.; Raimondo, D.; Corgnati, S.P.; da Silva, M.G. Assessment of indoor air quality and thermal comfort in Portuguese secondary classrooms: Methodology and results. Build. Environ. 2014, 81, 69–80. [Google Scholar] [CrossRef]
- Heracleous, C.; Michael, A. Thermal comfort models and perception of users in free-running school buildings of East- Mediterranean region. Energy Build. 2020, 215, 109912. [Google Scholar] [CrossRef]
- Kumar, S.; Singh, M.K.; Mathur, A.; Kosir, M. Occupant’s thermal comfort expectations in naturally ventilated engineering workshop building: A case study at high metabolic rates. Energy Build. 2020, 217, 109970. [Google Scholar] [CrossRef]
- Korsavi, S.S.; Montazami, A. Children’s thermal comfort and adaptive behaviours; UK primary schools during non-heating and heating seasons. Energy Build. 2020, 214, 109857. [Google Scholar] [CrossRef]
- Jowkar, M.; Rijal, H.B.; Bruseya, J.; Montazami, A.; Carlucci, S.; Lansdown, T.C. Comfort temperature and preferred adaptive behaviour in various classroom types in the UK higher learning environments. Energy Build. 2020, 211, 109814. [Google Scholar] [CrossRef]
- Wang, X.; Yang, L.; Gao, S.; Zhao, S.; Zhai, Y. Thermal comfort in naturally ventilated university classrooms: A seasonal field study in Xi’an, China. Energy Build. 2021, 247, 111126. [Google Scholar] [CrossRef]
- Popescu, L.L.; Popescu, R.S.; Catalina, T. Improving the energy efficiency of an existing building by dynamic numerical simulation. Appl. Sci. 2021, 11, 12150. [Google Scholar] [CrossRef]
- Zilberberg, E.; Trapper, P.; Meir, I.A.; Isaac, S. The impact of thermal mass and insulation of building structure on energy efficiency. Energy Build. 2021, 241, 110954. [Google Scholar] [CrossRef]
- Tuck, W.N.; Zaki, S.A.; Hagishima, A.; Rijal, H.B.; Yakub, F. Affordable retrofitting methods to achieve thermal comfort for a terrace house in Malaysia with a hot–humid climate. Energy Build. 2020, 223, 110072. [Google Scholar] [CrossRef]
- Mohamed, S.; Khatri, H.A.; Calautit, J.; Omer, S.; Riffat, S. The impact of a passive wall combining natural ventilation and evaporative cooling on schools’ thermal conditions in a hot climate. Jr. Build. Engr. 2021, 44, 102624. [Google Scholar] [CrossRef]
- Boutet, M.L.; Hernández, A.L. Generic proposal for the determination of optimal glazed areas for school buildings in the Northeast Region of Argentina. Energy Build. 2021, 243, 110988. [Google Scholar] [CrossRef]
- Cuce, E.; Sher, F.; Sadiq, H.; Cuce, P.M.; Guclu, T.; Besir, A.B. Sustainable ventilation strategies in buildings: CFD research. Sustain. Energy Technol. Assess. 2019, 36, 100540. [Google Scholar] [CrossRef]
- Garg, V.; Kotharkar, R.; Sathaye, J.; Rallapalli, H.; Kulkarni, N.; Reddy, N.; Rao, P.; Sarkar, A. Assessment of the impact of cool roofs in rural buildings in India. Energy Build. 2016, 114, 156–163. [Google Scholar] [CrossRef]
- Trebilcock, M.; Piderit, B.; Soto, J.; Figueroa, R. A parametric analysis of simple passive strategies for improving thermal performance of school classrooms in Chile. Arc. Sci. Rev. 2016, 59, 385–399. [Google Scholar] [CrossRef]
- Galal, K.S. The impact of classroom orientation on daylight and heat-gain performance in the Lebanese Coastal zone. Alex. Eng. J. 2019, 58, 827–839. [Google Scholar] [CrossRef]
- Nejat, P.; Ferwati, M.S.; Calautit, J.; Ghahramani, A.; Sheikhshahrokhdehkordi, M. Passive cooling and natural ventilation by the windcatcher (Badgir): An experimental and simulation study of indoor air quality, thermal comfort and passive cooling power. Jr. Build. Engr. 2021, 44, 102436. [Google Scholar] [CrossRef]
- Stavrakakis, G.M.; Androutsopoulos, A.V.; Vyörykkä, J. Experimental and numerical assessment of cool-roof impact on thermal and energy performance of a school building in Greece. Energy Build. 2016, 130, 64–84. [Google Scholar] [CrossRef]
- Heracleous, C.; Michael, A.; Savvides, A.; Hayles, C. Climate change resilience of school premises in Cyprus: An examination of retrofit approaches and their implications on thermal and energy performance. Jr. Build. Engr. 2021, 44, 103358. [Google Scholar] [CrossRef]
- Subhashinia, S.; Thirumaran, K. A passive design solution to enhance thermal comfort in an educational building in the warm humid climatic zone of Madurai. Jr. Build. Engr. 2018, 18, 395–407. [Google Scholar] [CrossRef]
- Aksin, F.N.; Selçuk, S.A. Energy performance optimization of school buildings in different climates of Turkey. Future Cities Environ. 2021, 7, 1–11. [Google Scholar] [CrossRef]
- Ledesma, G.; Nikolic, J.; Valladares, O.P. Co-simulation for thermodynamic coupling of crops in buildings. Case study of free-running schools in Quito, Ecuador. Build. Environ. 2022, 207, 108407. [Google Scholar] [CrossRef]
- Camacho-Montano, S.C.; Cook, M.A. Wagner, Avoiding overheating in existing school buildings through optimized passive measures. Build. Res. Inf. 2020, 48, 349–363. [Google Scholar] [CrossRef]
- Mahmoodzadeh, M.; Mukhopadhyaya, P.; Valeo, C. Effects of extensive green roofs on energy performance of school buildings in four north American climates. Water 2020, 12, 6. [Google Scholar] [CrossRef]
- Lopez, C.D.; Jimenez, A.S.; Lizana, J.; García, E.L.; Huelva, M.M.; Padura, A.B. Passive action strategies in schools: A scientific mapping towards eco-efficiency in educational buildings. Jr. Build. Engr. 2022, 45, 103598. [Google Scholar] [CrossRef]
- Lakhdari, K.; Sriti, L.; Painter, B. Parametric optimization of daylight, thermal and energy performance of middle school classrooms, case of hot and dry regions. Build. Environ. 2021, 204, 108173. [Google Scholar] [CrossRef]
- Carbonari, A. Retrofit of Italian School Buildings. The Influence of Thermal Inertia and Solar Gains on Energy Demand and Comfort. Future Cities Environ. 2019, 5, 1–13. [Google Scholar] [CrossRef]
- Villasmil, W.; Fischer, L.J.; Worlitschek, J. A review and evaluation of thermal insulation materials and methods for thermal energy storage systems. Ren. Sus. Energy Rev. 2019, 103, 71–84. [Google Scholar] [CrossRef]
- Ali, H.H.; Hashlamun, R.A. Assessment of indoor thermal environment in different prototypical school buildings in Jordan. Alex. Eng. J. 2019, 58, 699–711. [Google Scholar] [CrossRef]
- Sadineni, S.B.; Madala, S.; Boehm, R.F. Passive building energy savings: A review of building envelope components. Ren. Sus. Energy. Rev. 2011, 15, 3617–3631. [Google Scholar] [CrossRef]
- Rijal, H.B.; Yoshida, H. Winter thermal improvement of a traditional house in Nepal. Proc. 9th Int. IBPSA Conf. Build. Simul. 2005, 1035–1042. [Google Scholar]
- Fuller, R.J.; Zahnd, A.; Thakuri, S. Improving comfort levels in a traditional high altitude Nepali house. Build. Environ. 2009, 44, 479–489. [Google Scholar] [CrossRef]
- Rashmi, M.; Jongho, Y. A Study on Passive Cooling Strategies for Buildings in Hot Humid Region of Nepal, Korea Institute of Ecological Architecture and Environment. KIEAE J. 2015, 15, 53–60. [Google Scholar] [CrossRef]
- Anwar, N.; Adhikari, S.; Shahid, M.; Shrestha, S. Making Schools Safer for Earthquakes Effectiveness of Retrofitting: Case Studies from Nepal, Technical Report, November 2016. Available online: http://solutions.ait.ac.th/wp-content/uploads/2017/02/AITS-Case-Studies-Nepal-Making-Schools-Safer-for-Earthquakes.pdf (accessed on 19 January 2022).
- School sector development plan—Government of Nepal, Ministry of Education (2016). Available online: http://nced.gov.np/files/multipleupload/0-20-Sep-2017-05-09-29SSDP%20English-School%20Sector%20Development%20Plan.pdf (accessed on 1 January 2022).
- Tong, S.; Wen, J.; Wong, N.H.; Tan, E. Impact of façade design on indoor air temperatures and cooling loads in residential buildings in the tropical climate. Energy Build. 2021, 243, 110972. [Google Scholar] [CrossRef]
- Rijal, H.B.; Yoshida, H.; Umemiya, N. Seasonal and regional differences in neutral temperatures in Nepalese traditional vernacular houses. Build. Environ. 2010, 45, 2743–2753. [Google Scholar] [CrossRef]
- Gautam, B.; Rijal, H.B.; Shukuya, M.; Imagawa, H. A field investigation on the wintry thermal comfort and clothing adjustment of residents in traditional Nepalese houses. Jr. Build. Engr. 2019, 26, 100886. [Google Scholar] [CrossRef]
- Thapa, R.; Rijal, H.B.; Shukuya, M. Field study on acceptable indoor temperature in temporary shelters built in Nepal after massive earthquake 2015. Build. Environ. 2018, 135, 330–343. [Google Scholar] [CrossRef]
- ISO. International Standard 7730, Moderate Thermal Environments -Determination of the PMV and PPD Indices and Specification of the Conditions for Thermal Comfort; International Organization for Standardization: Geneva, Switzerland, 2005. [Google Scholar]
- Huang, K.T.; Huang, W.P.; Lin, T.P.; Hwang, R.L. Implementation of green building specification credits for better thermal conditions in naturally ventilated school buildings. Build. Environ. 2015, 86, 141–150. [Google Scholar] [CrossRef]
- Bradshaw, V. The Building Environment: Active and Passive Control Systems; John Wiley & Sons. Inc.: Hoboken, NJ, USA, 2006. [Google Scholar]
- Kazkaz, M.; Pavelek, M. Operative temperature and globe temperature. Eng. Mech. 2013, 20, 319–326, ISSN: 1802-1484. [Google Scholar]
- Zaki, S.A.; Damiati, S.A.; Rijal, H.B.; Hagishima, A.; Razak, A.A. Adaptive thermal comfort in university classrooms in Malaysia and Japan. Build. Environ. 2017, 122, 294–306. [Google Scholar] [CrossRef]
- DesignBuilder Software. Available online: https://designbuilder.co.uk/ (accessed on 1 January 2022).
- ASHRAE 62; Ventilation for Acceptable Indoor Air Quality, American Society of Heating. Refrigerating and Air-Conditioning Engineers, Inc.: Atalanta, GA, USA, 2016.
- Griffiths, I.D. Thermal Comfort in Buildings with Passive Solar Features: Field Studies. Report to the Commission of the European Communities; University of Surrey: Guildford, UK, ENS 35-090; 1990. [Google Scholar]
- Khaksar, A.; Tabadkani, A.; Shemirani, S.M.M.; Hajirasouli, A.; Banihashemi, S.; Attia, S. Thermal comfort analysis of earth-sheltered buildings: The case of meymand village, Iran. Front. Arc. Res. 2022, 11, 1214–1238. [Google Scholar] [CrossRef]
- Pohl, J. Building Science: Concepts and Application; John Wiley & Sons: London, UK, 2011; pp. 33–48. [Google Scholar]
- Gratia, E.; Bruyere, I.; Herde, A.D. How to use natural ventilation to cool narrow office buildings. Build. Environ. 2004, 39, 1157–1170. [Google Scholar] [CrossRef]
- Chaulagain, N.; Baral, B.; Davidsson, H.; Burke, S. Airtightness of Nepalese residential buildings. Period. Polytech. Archit. 2022, 53, 1–7. [Google Scholar] [CrossRef]
- Yik, F.W.H.; Lun, Y.F. Energy Saving by Utilizing Natural Ventilation in Public Housing in Hong Kong. Indoor Built Environ. 2010, 19, 73–87. [Google Scholar] [CrossRef]
- Jin, R.; Hang, J.; Liu, S.; Wei, J.; Liu, Y.; Xie, J.; Sandberg, M. Numerical investigation of wind-driven natural ventilation performance in a multi-storey hospital by coupling indoor and outdoor airflow. Indoor Built Environ. 2015, 25, 1226–1247. [Google Scholar] [CrossRef]
- Park, S.; Choi, Y.; Song, D.; Kim, E.K. Natural ventilation strategy and related issues to prevent coronavirus disease 2019 (COVID-19) airborne transmission in a school building. Sci. Total Environ. 2021, 789, 147764. [Google Scholar] [CrossRef]
- Aguilar, A.J.; de la Hoz-Torres, M.L.; Costa, N.; Arezes, P.; Martínez-Aires, M.D.; Ruiz, D.P. Assessment of ventilation rates inside educational buildings in Southwestern Europe: Analysis of implemented strategic measures. Jr. Build Engr. 2022, 51, 104204. [Google Scholar] [CrossRef]
- Park, B.; Lee, S. Investigation of the energy saving efficiency of a natural ventilation strategy in a multistory school building. Energies 2020, 13, 1746. [Google Scholar] [CrossRef]
- Lu, Y.; Yang, Z.; Yu, J.; Chen, B.; Zhong, K. Development of a second-order dynamic model for quantifying impact of thermal mass on indoor thermal environment. Jr. Build. Engr. 2021, 42, 102496. [Google Scholar] [CrossRef]
- Kolaitis, D.I.; Malliotakis, E.; Kontogeorgos, D.A.; Mandilaras, I.; Katsourinis, D.I.; Founti, M.A. Comparative assessment of internal and external thermal insulation systems for energy efficient retrofitting for residential buildings. Energy Build. 2013, 64, 123–131. [Google Scholar] [CrossRef]
- Kuczynski, T.; Staszczuk, A.; Gortych, M.; Stryjski, R. Effect of thermal mass, night ventilation and window shading on summer thermal comfort of buildings in a temperate climate. Build. Environ. 2021, 204, 108126. [Google Scholar] [CrossRef]
- ASHRAE 55; Thermal Environmental Conditions for Human Occupancy. American Society of Heating and Air-Conditioning Engineers: Atlanta, USA, 2017; ASHRAE Standard 55-2017.
- Rijal, H.B. Thermal adaptation of buildings and people for energy saving in extreme cold climate of Nepal. Energy Build. 2021, 230, 110551. [Google Scholar] [CrossRef]
- Thapa, R.; Rijal, H.B.; Shukuya, M.; Imagawa, H. Study on the wintry thermal improvement of makeshift shelters built after Nepal earthquake 2015. Energy Build. 2019, 199, 62–71. [Google Scholar] [CrossRef]
- Chen, X.; Yang, H.; Lu, L. A comprehensive review on passive design approaches in green building rating tools. Ren. Sus. Energy Rev. 2015, 50, 1425–1436. [Google Scholar] [CrossRef]
Disclaimer/Publisher’s Note: The statements, opinions and data contained in all publications are solely those of the individual author(s) and contributor(s) and not of MDPI and/or the editor(s). MDPI and/or the editor(s) disclaim responsibility for any injury to people or property resulting from any ideas, methods, instructions or products referred to in the content. |
© 2023 by the authors. Licensee MDPI, Basel, Switzerland. This article is an open access article distributed under the terms and conditions of the Creative Commons Attribution (CC BY) license (https://creativecommons.org/licenses/by/4.0/).