Abstract
Power-grid investment (PGI) optimization is crucial for boosting investment performance, lowering investment risks, and assuring the sustainable development of power-grid businesses. However, existing studies, which primarily concentrate on financial aspects, have not adequately considered the risk and benefit factors in the process of PGI. In this context, this research suggests a novel hybrid PGI optimization model that collaboratively accounts for the risks and benefits. In the first step, risk and benefit indicator systems for PGI are built, and a comprehensive evaluation model based on the Bayesian best–worst method and TOPSIS is suggested. In the second stage, a PGI optimization model considering the investment amount, power demand, and low-carbon restrictions is further developed based on the evaluation results. Furthermore, the incomprehensible but intelligible-in-time logic algorithm is adopted to solve the problem. By conducting an empirical analysis of ten projects within a power-grid company, the optimal investment plan and a differentiated investment portfolio strategy are obtained by adjusting the key elements.
1. Introduction
Investment, consumption, and export are the troika driving China’s economic development [1]. As one of China’s key pillar industries, strengthening infrastructure development and improving investment in the power sector is of the utmost importance. According to the National Energy Administration, China’s investment in power engineering construction exceeded CNY 1222 billion in 2022, including CNY 720.8 billion for power supply and CNY 501.2 billion for power grids (National Energy Administration: http://www.nea.gov.cn/2023-01/18/c_1310691509.htm (accessed on 29 July 2023). However, the investors face various risks on a technical level and from policies, management, and environmental protection requirements during the electrical infrastructure investment process. As a result, unreasonable investment planning will harm economic performance and compromise the sustainable development of the power-grid enterprises [2]. Hence, it is of great significance to propose a more scientific and reasonable investment optimization model that balances the risks and benefits. The power-grid investment (PGI) optimization models can help to implement sophisticated management and enhance the risk response ability of power-grid enterprises [3].
Investment optimization is also a critical problem for academics, having numerous applications in agriculture [4], manufacturing [5], and energy-related industries [6]. Table 1 depicts the recent studies on investment optimization in the power sector.

Table 1.
Recent studies on investment optimization in the power sector.
As shown in Table 1, the investment demand and capacity are the main factors affecting the investment portfolio. In other words, the power-grid projects should provide solutions to regional issues like poor power supply quality and capacity [13]. However, the PGI cannot steadily expand without constraints. The total investment amount must be below a specific level due to the enterprise’s total investment cap [14]. From the investment benefits perspective, most published studies primarily focus on financial hazards and frequently use the VaR or CVaR models [15]. Furthermore, financial benefits concern scholars the most, with other benefits receiving less attention, such as operational [16], social [17], and environmental benefits [18].
In addition, some scholars will simultaneously consider the potential risks and benefits of the PGI, and the common approach is to transform it into a multi-objective problem [19]. However, with the growing number of indicators, the model’s computation time is frequently increased, and the ideal solution sometimes cannot be found. Hence, it is more practical to convert various risk and benefit indicators into “comprehensive risk” and “comprehensive benefit” using multi-criteria decision-making (MCDM) models. Table 2 depicts the recent studies on comprehensive risk/benefit evaluation for power industries based on MCDM models.
Table 2.
Recent studies on comprehensive risk/benefit evaluation for power industries based on MCDM models.
As shown in Table 2, there are three types of indicator weighting methods: objective; subjective; and hybrid. The objective methods can avoid subjective expert judgments. However, these methods are highly affected by the sample of data. In other words, the indicator weights may also adjust when the sample size changes. The widely utilized methods mainly include the entropy weighting method [29], criteria importance via the inter-criteria correlation model [30], and the principal component analysis method [31]. In contrast, the subjective weighting approach primarily relies on the expertise of experts, which is independent of the data’s qualities. The typical methods mainly include the analytic hierarchy process [32], analytic network process (AHP) [33], best–worst method (BWM) [34], and a few fuzzy improved ones [35]. However, objective weighting methods are inappropriate when the indicators are qualitative, such as some risk and benefit indicators outlined in our research. Nevertheless, the hybrid weighting models must adhere to the guidelines and specifications of objective weighting methods (for instance, the data must be quantitative).
There are primarily two types of comprehensive evaluation methodologies. One is the ranking-type model frequently applied to situations involving multiple schemes. The most employed models are the technique for order preference by similarity to an ideal solution (TOPSIS) [36], measurement of alternatives and ranking according to compromise solution [37], and VIseKriterijumska Optimizacija I Kompromisno Resenje [38]. Another is the rating-type model, which is frequently applied when only one scheme is evaluated (e.g., the matter–element extension model [39]). Its fundamental tenet is to provide a range of levels to identify the evaluated scheme level. This type of model can also be applied to multiple schemes. But, in essence, it is equivalent to the mechanical repetition of the rating of one scheme, and each scheme does not interfere with the other.
In this context, this paper creates a two-stage PGI optimization model. The first step, which assesses the investment risks and benefits for power-grid projects, is based on the MCDM model, and the second stage further picks projects based on the evaluation results. Furthermore, we select ten projects from the PGI project library in a power-grid company as empirical analysis, and several comparative scenarios are then constructed for the model effectiveness verification and sensitivity analysis. Figure 1 depicts the research framework of this paper. Additionally, the following three points make up the bulk of this paper’s contributions:
- (1)
- A two-stage PGI optimization model is developed in this study by considering both risk and benefit factors simultaneously, which can help address the problem of inadequate evaluations of the investment risks and benefits in previous research. Through the sensitivity analysis of three elements, multiple investment portfolios are presented for different situations;
- (2)
- Two comprehensive multidimensional evaluation index systems are constructed in this paper around the two key characteristics of risk and benefit in PGI projects. One is composed of policy, management, technical, and environmental risks, and the other is mainly constructed from the dimensions of operational, financial, cleanliness, and social benefits;
- (3)
- An enhanced Bayesian BWM model has been used in the initial step of the PGI risk and benefit assessment to produce more dependable indicator weights by introducing group decision-making. Moreover, the state-of-the-art incomprehensible but intelligible-in-time logic algorithm (ILA) with higher efficiency and accuracy is used to solve the optimization problem in the second stage of PGI optimization.
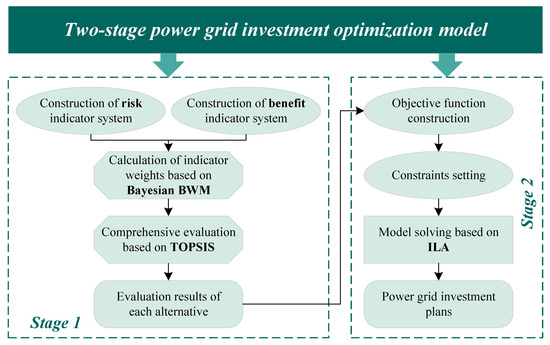
Figure 1.
The research framework of this paper.
The structure of this study is as follows. After the introduction, the comprehensive evaluation index system for the risks and benefits of PGI is constructed in Section 2. Section 3 elaborates on the methodology applied in this paper, and Section 4 presents the empirical analysis. The discussion and conclusions are given in Section 5 and Section 6, respectively.
2. Evaluation Index System for Risks and Benefits of PGI
Five experts engaged in related fields are invited to form an expert group to comprehensively evaluate the risks and benefits of the PGI, as shown in Table 3.
Table 3.
The information of the expert group.
In addition to constructing the indicator systems, the expert group also needs to complete the subsequent indicator scoring (weight determination) process.
2.1. Comprehensive Risk Evaluation Index System for PGI
This paper primarily focuses on four types of risks: policy risk; management risk; technical risk; and environmental risk.
- (1)
- Policy Risk (R1)
One of the primary risks to PGI is policy risk, and power-grid enterprises must adhere strictly to national regulations and laws. When macroeconomic policies are changed, enterprises must also change the direction of their investments. It is simple for enterprises to halt and restrict investment when it veers from or opposes policies. As a result, the risks associated with project approval (R11) and energy/electricity policy adjustment (R12) are chosen for this work [40,41]. Regarding the assessment of policy risks, experts mainly rely on whether the relevant policy documents issued contain similar content. The degree of risk mainly depends on the frequency with which the relevant content is mentioned;
- (2)
- Management risk (R2)
Management risk refers to the hazards that develop over the whole project cycle due to information asymmetry, bad judgment, and insufficient response mechanisms. The risks mostly relate to the feasibility study planning (R21), engineering design (R22), and bidding (R23) stages of the power-grid project [42,43,44]. For the management risk evaluation, experts need to analyze process compliance and document standardization. At the same time, accidents caused by the insufficient training of management personnel and deviations in the implementation of management regulations are also important criteria for evaluating management risks;
- (3)
- Technical risk (R3)
Technical risk refers to the risk of losses caused by inadequately qualified technical equipment and ambiguous technical situations. The power-grid project typically has strict criteria for construction tools, labor force qualifications, and material specifications. In other words, carelessness compromises the project’s quality, safety, and progress. The two main issues of concern are equipment installation risk (R31) and material transportation risk (R32) [45,46];
- (4)
- Environmental risk (R4)
Environmental risk refers to the complexity and unpredictability of the natural environment at engineering construction sites. Thus, the risks of geologically unfavorable conditions (R41) and natural disasters (R42) are considered [47,48]. Regarding environmental risks, experts must examine the reliability of the construction sites and evaluate the carrying capacity of engineering construction for natural disaster issues.
The comprehensive risk evaluation index system for PGI is shown in Figure 2.
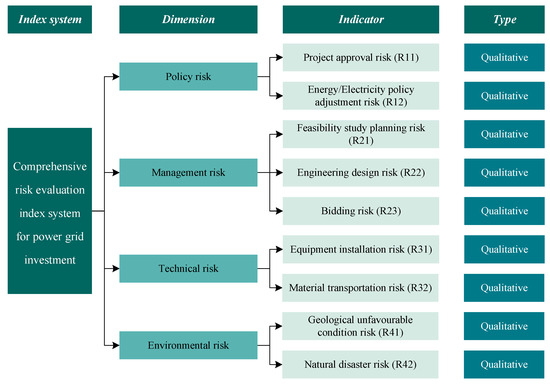
Figure 2.
The comprehensive risk evaluation index system for PGI.
2.2. Comprehensive Benefit Evaluation Index System for PGI
Along with the risks, the benefits are another important consideration for the PGI. This paper primarily focuses on four types of benefits: operational; financial; cleanliness; and social.
- (1)
- Operational benefit (B1)
The operational benefit is the factor that most directly reflects the purpose of constructing a power-grid project to improve the capacity and quality of the power supply. Thus, the benefits of electricity transmission (B11), the power supply reliability (B12), and the load rate (B13) are considered [49,50,51]. Equation (1) can be used to determine B12 and B13. When evaluating the operational benefit, experts should first collect the above data from the responsible entity of the power-grid project.
where PSR represents the power supply reliability; Tpo represents the duration of power outage; T represents the duration of the statistical period; LR represents the load rate; L represents the average load, and CAP represents the equipment capacity;
- (2)
- Financial benefit (B2)
The financial benefits of a project are primarily determined using its profitability and ability to pay off debt. Therefore, the debt service coverage ratio (B21) and internal rate of return (B22) are used to evaluate the financial benefits [52]. This part of the benefit indicators can be obtained from the project feasibility study report;
- (3)
- Cleanliness benefit (B3)
Low-carbon and clean development is a common aspiration for everyone, which is also a major path for PGI. The proposal of carbon peak and carbon neutrality targets is a crucial step in addressing the increasingly serious issue of climate change in China [53]. As the primary source of carbon emissions, accelerating the deep decarbonization of the energy and power sector is of great significance. To reflect the cleanliness benefit of PGI, two indicators—carbon dioxide emission reduction (B31) and coal consumption reduction (B32)—are chosen [54];
- (4)
- Social benefit (B4)
In addition to the aforementioned benefits, constructing power-grid projects also provides certain social advantages. On the one hand, utilizing new methods and technology can serve as a good technical demonstration (B41). On the other hand, it also has a significant supporting effect on the local GDP development (B42).
The comprehensive benefit evaluation index system for PGI is shown in Figure 3.
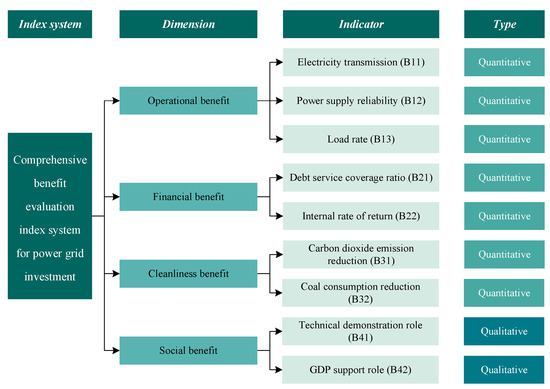
Figure 3.
The comprehensive benefit evaluation index system for PGI.
3. Methodology
3.1. MCDM Models for Comprehensive Evaluation of Power-Grid Projects
3.1.1. Bayesian BWM Model
Compared with the AHP model, the BWM model proposed by Rezaei has fewer comparison times and higher efficiency (n(n – 1)/2 comparisons in the former and 2n − 3 in the latter) [34]. Furthermore, Mohammadi and Rezaei originally put forth the Bayesian BWM approach in 2020 based on the traditional BWM model [55]. The fundamental concept of this technique is to introduce probability distribution via the Bayesian theory, which more accurately captures the process of numerous experts’ collaborative decision-making and weighing in a group environment [56]. The following are the fundamental Bayesian BWM steps:
- (1)
- Determine the best and worst indicators
K experts are invited to empower the indicators (K = 5 in this paper). After thorough discussion, the expert group should determine the best indicator CB and the worst indicator CW from all indicators ;
- (2)
- Establish the best-to-others (BO) vector, others-to-worst (OW) vector, and multinomial probability distribution function
After determining the best and worst indicators, the importance of the indicators should be further given by the expert group. In particular, CB should be compared with Cj, and values from 1 to 9 should be used to reflect the importance degree between these two indicators, where 1 represents the importance of CB being equal to Cj, and 9 represents the importance of CB being much higher than Ci. Then, the BO vector AB can be obtained as follows:
where represents the importance comparison between CB and Cj.
Similarly, the OW vector AW can be obtained as follows:
where ajW represents the importance comparison between Cj and CW.
After determining the BO and OW vectors, the multinomial probability distribution function is constructed. In contrast to the traditional BWM model, the Bayesian BWM model further considers the probability distribution of model inputs and outputs [57]. In other words, each evaluation indicator is regarded as a randomly occurring event, and the probability of each occurrence represents the weight of the indicator. Taking the worst indicator CW as an example, the multinomial probability distribution can be expressed as follows:
where ω represents the probability distribution of indicators;
- (3)
- Calculate the occurrence probability of indicators (or events)
For event j, there is a positive correlation between the occurrence probability ωj and the number of occurrences as follows:
The multinomial probability distribution of CB is the opposite. The occurrence probability of CB and CW can be expressed as follows:
Then, Equation (7) can be obtained as follows:
- (4)
- Determine the indicator weights
Through Equation (7), the indicator weighting process can be transformed into the probability distribution estimation, and the hierarchical Bayesian method can be used to solve the problem. Among the K experts, the best and worst indicator determined by the k-th expert can be expressed as and , and the weights of indicators can be expressed as . Then, the probability distribution of the final weights determined by the expert group can be expressed as follows:
Furthermore, the probability of any random variable can be expressed as follows:
where x and y represent random variables.
3.1.2. The TOPSIS Method
The TOPSIS model was first proposed by Hwang and Yoon in 1981, which can be used to rank the risks and benefits of each power-grid project in this paper [58]. The steps are as follows:
- (1)
- Calculate the distance between each alternative and the ideal/anti-ideal alternative.
The ideal alternative and anti-ideal alternative are constructed, and the Euclidean distance between each alternative and the ideal/anti-ideal alternative is calculated as follows:
- (2)
- Calculate the evaluation results of each alternative as follows:
3.2. PGI Optimization Model
3.2.1. Objective Function
The PGI optimization model designed in this paper mainly includes two objectives: risk minimization and benefit maximization. Since the former is a cost-type indicator (the smaller, the better) and the latter is a benefit-type indicator (the larger, the better), the two targets present opposite optimization directions. Hence, a new objective, “benefit per unit risk”, is proposed in this paper to simultaneously consider both factors as follows:
where Bi and Ri represent the comprehensive benefit and risk of the i-th project, and represents the decision variables (if investing in this project, ; otherwise, ).
3.2.2. Constraints
- (1)
- Investment amount constraints
- (2)
- Power demand constraints
- (3)
- Low-carbon constraints
3.2.3. ILA Solver
The ILA model was first proposed by Mirrashid and Naderpour in 2023, which has a higher accuracy and reasonable computation time than the other 19 algorithms when dealing with 73 constrained, unconstrained, small, and large problems [59]. The basic steps are as follows:
- ➢
- Groupwork stage
- (1)
- Determine the parameters for experts
In this stage, the global search is achieved to find the best non-logics (NL) in the specific section, and all the experts need to improve the initial fitness based on their knowledge. There are the three following parameters for each expert:
where COMk, DEGk, and PROk represent the comprehensibility, degree, and probability of the k-th expert, Ek. L represents the logic of the current iteration; represents the value of Ek in the previous iteration, and represents the best expert in the group;
- (2)
- Normalization
The MinMax method is applied to limit the parameters above between 0 and 1 as follows:
- (3)
- Determine the knowledge of each expert
- (4)
- Update the expert knowledge
Then, Equation (20) can be obtained as follows:
- ➢
- Integration stage
- (1)
- Integrate all the groups
In the first stage, we determined the knowledge and parameters of each expert group. Now, we will integrate the various groups and bring all the experts together, and the PROk should be replaced with Equation (21) as follows:
where EK represents the best expert of all the groups;
- (2)
- Re-determine the knowledge
- (3)
- Re-update the expert knowledge
The work of the first and second stages is generally similar, with the difference being that the former focuses on the situation within each expert group, while the latter focuses on the results after aggregating all expert groups.
- ➢
- Logic search stage
In this stage, we aim to improve the knowledge of each member using the average collective knowledge obtained by all experts as follows:
where and represent the new knowledge updated in the second stage; δ7 and δ8 are the random numbers ranging from −0.25 to 0.25, and δ9 is a random number between 0 and 1.
We have achieved three processes of intra-group optimization, inter-group optimization, and overall optimization thus far, which can solve the PGI optimization problem in this paper. For more details, interested readers can refer to Ref. [59].
4. Empirical Analysis
4.1. Basic Information
To verify the effectiveness and feasibility of the model proposed in this paper, ten projects from a power-grid company’s investment project database are selected for analysis. The performance of each project in various indicators is shown in Table 4.
Table 4.
The performance of each project in various indicators.
4.2. Comprehensive Risk Evaluation of Power-Grid Projects
4.2.1. Indicator Weight Determination
The best and worst risk indicators are first determined by the expert group, as shown in the Table 5 below.
Table 5.
The best and worst risk indicators determined by the expert group.
Then, the BO and OW vectors are given by the expert group as follows:
The values of the weights for nine risk indicators are listed in Table 6 using the Bayesian BWM model.
Table 6.
Values of weights for nine risk indicators.
As shown in Table 6, the weight of project approval risk (R11) is the highest, followed by the energy/electricity policy adjustment risk (R12). In other words, policy risks are considered the most important risk factors affecting the PGI by the expert group. In contrast, the weight of bidding risk (R23) is the lowest, indicating that the bidding process for power-grid projects has strict regulations and supervision, which does not easily lead to risks.
4.2.2. Comprehensive Evaluation of the Alternatives
The comprehensive risks of each power-grid project are further evaluated using the TOPSIS model, as shown in Figure 4.
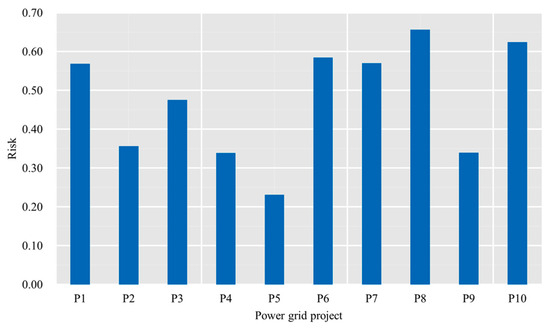
Figure 4.
The comprehensive risk of each power-grid project.
As shown in Figure 4, the risks of P8 and P10 are higher than those of other power-grid projects. The reason for this phenomenon may be due to the high-risk performance of important indicators. In particular, the values of R11 and R12 for P10 are the highest among all the ten projects, and the weights of R11 and R12 are 0.1955 and 0.1861, respectively (higher weights than the other indicators). Although P8 performs better in R12 than in some other projects, the risks in R21 and R22 of P8 are the highest of all the projects (although the weights of R21 and R22 are slightly lower than the previous two indicators, they also reach 0.1560 and 0.1271).
4.3. Comprehensive Benefit Evaluation of Power-Grid Projects
4.3.1. Indicator Weights Determination
Similar to Section 4.2.1, the best and worst benefit indicators are first determined by the expert group, as shown in the Table 7 below.
Table 7.
The best and worst benefit indicators determined by the expert group.
Then, the BO and OW vectors are given by the expert group as follows:
The values of the weights for nine benefit indicators are listed in Table 8 using the Bayesian BWM model.
Table 8.
Values of weights for nine benefit indicators.
As shown in Table 8, the weight of electricity transmission (B11) is the highest, followed by the load rate (B13) and power supply reliability (B12). In other words, the operational benefits are considered the most important benefit factors of the PGI by the expert group. In contrast, the weight of the technical demonstrate role (B41) and GDP support role (B42) are the lowest, indicating that experts pay relatively low attention to the social benefits of PGI.
4.3.2. Comprehensive Evaluation of the Alternatives
The comprehensive benefit of each power-grid project is further evaluated using the TOPSIS model, as shown in Figure 5.
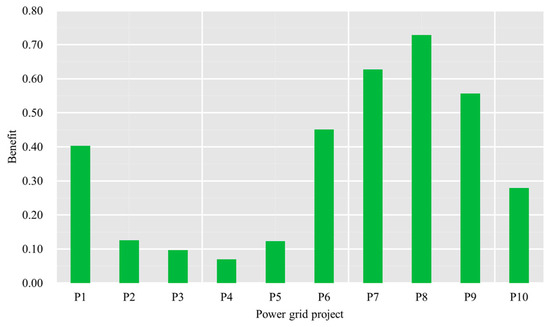
Figure 5.
The comprehensive benefit of each power-grid project.
As shown in Figure 5, the benefit of P8 is higher than that of other power-grid projects. The reason for this phenomenon may be due to the high-benefit performance of most indicators. In particular, the values of B11, B12, B21, B31, B32, B41, and B42 for P8 are all ranked among the top three in various projects. In contrast, the benefits of P2, P3, P4, and P5 are relatively low. The main reason for these results is that the above projects not only have poor operational effects but also have low environmental benefits, resulting in a low overall benefit score.
4.4. PGI Optimization Results
The parameter setting of the ILA solver follows the setting in Ref. [59], and the required variables setting are listed in Table 9:
Table 9.
The required variable settings.
Then, the optimal solution can be found using the ILA solver, as shown in the Table 10 below.
Table 10.
The optimal solution and project investment status.
5. Discussion
We held discussions on the following two aspects shown in Figure 6 to verify the rationality of the results obtained in this paper and the superiority of the proposed model.
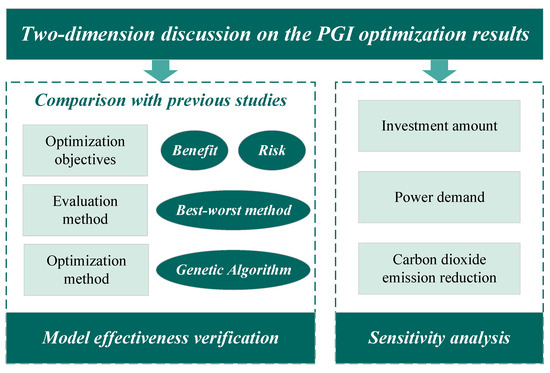
Figure 6.
Two-dimensional discussion of the PGI optimization results.
5.1. Model Effectiveness Verification
Three scenarios are designed from the perspectives of optimization objectives, evaluation method, and optimization method to verify the effectiveness of the constructed two-stage PGI optimization model. However, due to data limitations, we are unable to use data from the literature for comparative analysis. Therefore, we mainly refer to the methods and model settings used in the literature and conduct scenario analysis using the dataset presented in this paper.
5.1.1. Model Effectiveness Verification on the Optimization Objectives
Unlike the collaborative consideration of risks and benefits in this paper, some research only focuses on a single dimension [60,61]. Therefore, we construct scenario 1a (minimizing risk as the objective) and scenario 1b (maximizing benefit as the objective) in this section, and the optimization results are shown in Table 11.
Table 11.
The optimization results by adjusting the optimization objectives.
As shown in Table 11, if the decision-makers blindly reduce investment risks, the comprehensive investment benefit will decrease by 37.27% compared to scenario 0. On the contrary, if decision-makers focus more on investment benefits, the overall investment risk will increase by 89.86%. Therefore, the optimization objective designed in this paper balances both risks and benefits, resulting in a more rational investment portfolio than previous studies.
5.1.2. Model Effectiveness Verification on the Evaluation Method
In Ref. [62], Wu et al. proposed a BWM-based model for investment portfolio selection. However, compared with the Bayesian BWM used in this paper, it does not consider group decision-making. Hence, we construct scenario 2 (BWM-based indicator weighting) in this section, and the indicator weights are shown in Table 12 and Table 13.
Table 12.
The risk indicator weights by adjusting weighting models.
Table 13.
The risk indicator weights by adjusting weighting models.
As shown in Table 12 and Table 13, the weight range of the risk and benefit indicators obtained via the traditional BWM method is significantly larger than that obtained via the Bayesian BWM method used in this paper. In particular, the weight difference between the most important and least important risk indicators is 0.2197 using the BWM method, which is 48.15% higher than the weight difference calculated using the Bayesian BWM method. Similarly, the weight difference between the most important and least important benefit indicators is 0.2133 using the BWM method, which is 40.42% higher than the weight difference calculated using the Bayesian BWM method.
Without considering group decision-making, extreme weight phenomena can easily occur via mechanized weight-averaging processing. In other words, some indicators may have a nearly decisive impact on PGI, while some indicators seem to become meaningless.
5.1.3. Model Effectiveness Verification on the Optimization Method
The genetic algorithm (GA) is selected as the benchmark model to compare the effectiveness of the optimization algorithms to verify the effectiveness and superiority of the ILA model used in this paper [63]. The running process of the GA model is implemented using MATLAB’s built-in toolbox, and the parameter settings are based on system defaults. Table 14 depicts the optimization results by adjusting the optimization method.
Table 14.
The optimization results by adjusting the optimization method.
As shown in Table 14, the applicability of the ILA model used in this paper is sufficient in solving PGI optimization problems, and the optimal obtained results are 9.8% higher than traditional GA models, with a 61.57% reduction in computational time.
5.2. Sensitivity Analysis
To further determine the PGI selection under different conditions, this section conducts a sensitivity analysis, which adjusts the constraints to determine the investment portfolio under different circumstances.
5.2.1. Sensitivity Analysis of Investment Amount
On the premise of ensuring that other constraints do not change, we adjust the upper limit of the total investment amount to determine the PGI optimization results, as shown in the following figure.
As shown in Figure 7, when the investment amount remains between 300 and 900, it is unable to meet the electricity demand or low-carbon constraints. When the investment amount exceeds 1200, P7 and P9 with high benefit–risk ratios are the preferred choices for PGI. Although P8 has a relatively high benefit–risk ratio, its investment amount is also relatively high, which cannot meet expectations when the total investment amount is 1200.
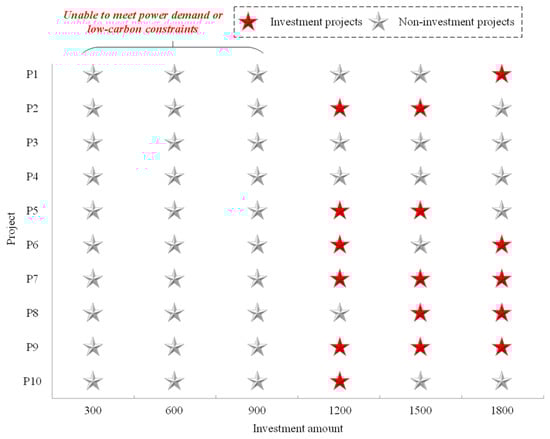
Figure 7.
Sensitivity analysis of investment amount.
5.2.2. Sensitivity Analysis of Power Demand
With continuous economic development, the electricity demand of power users is steadily increasing. For this purpose, we simulated the optimal combination of PGI under different power demand constraints as follows.
As shown in Figure 8, when the growth rate of electricity consumption is slow, the power demand constraint does not exceed 900; P7, P8, and P9 are essential investment directions, and P2, P3, and P5 can also be used as alternative solutions. However, when the power demand exceeds 1200, the existing investment amount is no longer able to support this constraint.
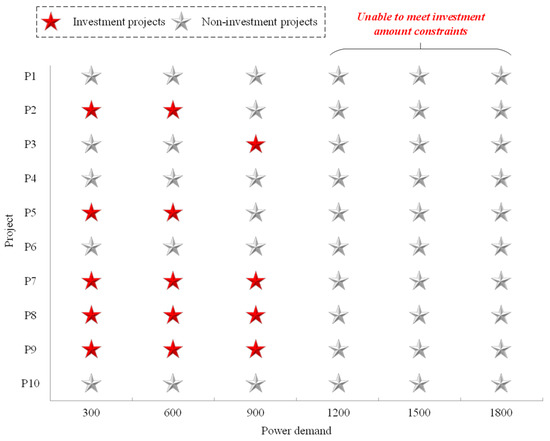
Figure 8.
Sensitivity analysis of power demand.
5.2.3. Sensitivity Analysis of Carbon Dioxide Emission Reduction
With the goal of carbon neutrality, China is vigorously carrying out deep decarbonization in the energy and power industry. The third sensitivity analysis is conducted on carbon dioxide emission reduction constraints to explore potential investment plans for PGI considering different environmental goals.
As shown in Figure 9, when environmental constraints are slack, P7, P8, and P9 are stable PGI directions. However, when environmental constraints are tight, it is difficult to continue the P7 project, which trades high investment for higher environmental benefits. When the carbon dioxide emission reduction constraint reaches 7000, the existing investment amount is difficult to support the achievement of environmental goals.
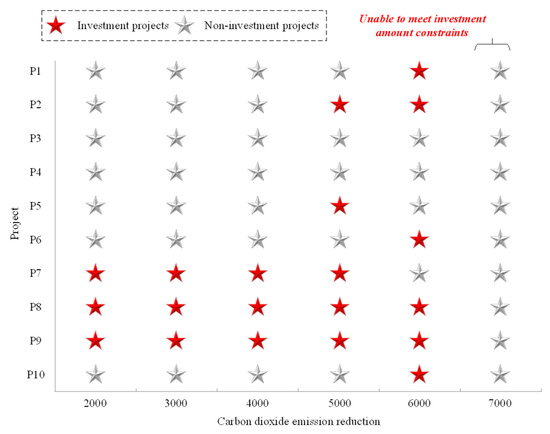
Figure 9.
Sensitivity analysis of carbon dioxide emission reduction.
6. Conclusions and Future Directions
6.1. Conclusions and Suggestions
Investment optimization has always been one of the research hotspots for scholars, and the optimization of PGI around the power industry is an important task to ensure the ongoing development of power-grid enterprises. Therefore, investment optimization for power-grid enterprises is important from a theoretical and practical standpoint. In light of these findings, this paper suggests a two-stage PGI optimization model that accounts for risks and benefits, the two major elements, in concert. Following the studies mentioned above, several conclusions can be obtained:
- (1)
- From the risk perspective, policy and management risks are the most important risk factors that power-grid enterprises should pay attention to when investing in new projects. The most significant factor that influences investment decisions is whether the project can be approved for construction without major issues;
- (2)
- From the benefit perspective, operational and financial benefits are the most important benefit factors that reflect the multidimensional values of the power-grid projects. The first benefit indicators that require attention are the transmission capacity and quality of the power supply. In contrast, investments in the electricity system are not primarily motivated by cleanliness or social benefits. However, power-grid enterprises should also consider these two factors to conduct responsible businesses;
- (3)
- After balancing the risks and benefits of each project, we suggest carefully considering the PGI objective of maximizing “benefit per unit risk” and constraints on the investment amount, power demand, and low-carbon requirements. According to our findings, the best investment portfolios under the benchmark scenario are P2, P5, P7, P8, and P9. In addition, when the constraint conditions change, P7, P8, and P9 projects with high benefit–risk ratios are typically still included in the ideal investment portfolio;
- (4)
- Compared with the previous studies that only consider the minimization of risks or the maximization of benefits, the investment portfolios proposed in this paper can enhance benefits by 37.27% and decrease risks by 89.86%, respectively, which proves the superiority of the newly proposed objective. In addition, the proposed Bayesian BWM approach and ILA method can provide more rational weighting results and better optimization results than the traditional BWM and GA algorithms, which also proves the model effectiveness of the proposed weighting and optimization method.
Based on the aforementioned conclusions, several suggestions are further presented as follows:
- (1)
- For investors, it is necessary to rapidly establish a closed-loop risk control mechanism and benefit improvement measures. On the one hand, power-grid enterprises must strengthen risk prevention and control, especially on policy risks. With the proposal of carbon neutrality goals, China is accelerating the low-carbon transformation of the power industry, forcing the clean development of PGI. Hence, decision-makers need to actively monitor macro policy dynamics and pay attention to whether projects under construction or to be built contradict policies. On the other hand, as another key factor in PGI, power-grid enterprises should regularly conduct a "look back" to evaluate whether the benefit of each project has met the expectations;
- (2)
- Power-grid enterprises must design dynamic investment planning adjustment mechanisms and focus on key factors that affect efficiency and benefit, such as the economic development level and the electricity consumption scale. Before conducting the risk and benefit evaluation of PGI projects, it is necessary to enhance the predicting accuracy of various external factors to obtain more reliable investment portfolios.
6.2. Limitations and Future Directions
It should be highlighted that the size of the power-grid enterprises examined in this study is rather small, with only 10 planned investment projects. During the 14th Five Year Plan period, the total investment in the national power grid is expected to be nearly CNY 3 trillion, which is far higher than the investment amount of projects analyzed in this paper. When the investment scale expands, power-grid enterprises have a larger project library for screening, resulting in more complex investment portfolios. In addition, when the sample size increases, the investment direction of power-grid enterprises must also be considered a key factor (e.g., the direction of grid reinforcement, power supply, and channel construction). In the future, we will broaden the scope of our research and consider more factors to yield more precise and logical results.
Author Contributions
Conceptualization, C.G. and X.W.; methodology, D.L.; software, D.L.; validation, C.H. and W.Y.; resources, C.H.; writing—original draft preparation, Y.Z.; writing—review and editing, C.G. and X.W; visualization, Y.Z.; supervision, C.H. and W.Y.; project administration, C.G.; All authors have read and agreed to the published version of the manuscript.
Funding
This research received no external funding.
Data Availability Statement
Not applicable.
Acknowledgments
The authors are grateful to the editor and anonymous reviewers for their work.
Conflicts of Interest
We declare that we do not have any commercial or associative interests that represent conflicts of interest in connection with the submitted work.
References
- Hu, C.; Shen, Z.; Yu, H.; Xu, B. Uncertainty shocks and monetary policy: Evidence from the troika of China’s economy. Econ. Res.-Ekon. Istraživanja 2022, 35, 971–985. [Google Scholar] [CrossRef]
- Davidov, S.; Pantos, M. Stochastic assessment of investment efficiency in a power system. Energy 2017, 119, 1047–1056. [Google Scholar] [CrossRef]
- Niu, D.; Li, Y.; Dai, S.; Kang, H.; Xue, Z.; Jin, X.; Song, Y. Sustainability Evaluation of Power Grid Construction Projects Using Improved TOPSIS and Least Square Support Vector Machine with Modified Fly Optimization Algorithm. Sustainability 2018, 10, 231. [Google Scholar] [CrossRef]
- Pal, B.; Kumar, S.; Patan, E. Investment planning to minimize climate risk in agricultural production: An optimization model for a semi-arid region in India. Clim. Policy 2021, 23, 477–494. [Google Scholar]
- Kulkarni, S.; Francas, D. Capacity investment and the value of operational flexibility in manufacturing systems with product blending. Int. J. Prod. Res. 2018, 56, 3563–3589. [Google Scholar] [CrossRef]
- Cunico, M.; Flores, J.; Vecchietti, A. Investment in the energy sector: An optimization model that contemplates several uncertain parameters. Energy 2017, 138, 831–845. [Google Scholar] [CrossRef]
- Sha, Y.; Ma, Q.; Xu, C.; Tan, X.; Yan, J.; Zhang, Y. Research on the balance optimization of investment demand and investment capability of power grid enterprises. Energy Rep. 2023, 9, 943–950. [Google Scholar] [CrossRef]
- Gao, L.; Zhao, Z.; Li, C. An Investment Decision-Making Approach for Power Grid Projects: A Multi-Objective Optimization Model. Energies 2022, 15, 1112. [Google Scholar] [CrossRef]
- He, Y.; Jiao, J.; Chen, R.; Shu, H. The optimization of Chinese power grid investment based on transmission and distribution tariff policy: A system dynamics approach. Energy Policy 2018, 113, 112–122. [Google Scholar] [CrossRef]
- Xu, L.; Tang, S.; Deng, Y.; Yuan, Y. Sustainable operation-oriented investment risk evaluation and optimization for renewable energy project: A case study of wind power in China. Ann. Oper. Res. 2020, 290, 223–241. [Google Scholar]
- Sha, Y.; Li, W.; Yan, J.; Li, W.; Huang, X. Research on Investment Scale Calculation and Accurate Management of Power Grid Projects Based on Three-Level Strategy. IEEE Access 2021, 9, 67176–67185. [Google Scholar] [CrossRef]
- Li, Y.; Wang, J.; Gu, C.; Liu, J.; Li, Z. Investment optimization of grid-scale energy storage for supporting different wind power utilization levels. J. Mod. Power Syst. Clean Energy 2020, 7, 1721–1734. [Google Scholar] [CrossRef]
- Wang, Y.; Zhou, M.; Zhang, F.; Zhang, Y.; Ma, Y.; Dong, H.; Zhang, D.; Liu, L. Chinese grid investment based on transmission and distribution tariff policy: An optimal coordination between capacity and demand. Energy 2021, 219, 119589. [Google Scholar] [CrossRef]
- Wang, Y.; Li, R.; Dong, H.; Ma, Y.; Yang, J.; Zhang, F.; Zhu, J.; Li, S. Capacity planning and optimization of business park-level integrated energy system based on investment constraints. Energy 2020, 189, 116345. [Google Scholar] [CrossRef]
- Saldarriaga-Loaiza, J.; Saldarriaga-Zuluaga, S.; López-Lezama, J.; Villada-Duque, F.; Muñoz-Galeano, N. Optimal Structuring of Investments in Electricity Generation Projects in Colombia with Non-Conventional Energy Sources. Sustainability 2022, 14, 15123. [Google Scholar] [CrossRef]
- Gu, C.; Wang, J.; Yang, Q.; Wang, X. Assessing operational benefits of large-scale energy storage in power system: Comprehensive framework, quantitative analysis, and decoupling method. Int. J. Energy Res. 2021, 45, 10191–10207. [Google Scholar] [CrossRef]
- Chinmoy, L.; Iniyan, S.; Goic, R. Modeling wind power investments, policies and social benefits for deregulated electricity market—A review. Appl. Energy 2019, 242, 364–377. [Google Scholar] [CrossRef]
- Zhu, W.; Wang, C.; Wang, L.; Wu, X.; Yue, Q. Analysis of energy-saving and environmental benefits from power structure adjustment in China: A comparative study from 2020 to 2060. Sustain. Prod. Consum. 2022, 31, 750–761. [Google Scholar] [CrossRef]
- Xue, Q.; Wang, Z.; Zhang, Y. Environmental Benefit and Investment Value of Hydrogen-Based Wind-Energy Storage System. Front. Energy Res. 2021, 9, 629136. [Google Scholar] [CrossRef]
- Rehman, O.; Ali, Y.; Sabir, M. Risk assessment and mitigation for electric power sectors: A developing country’s perspective. Int. J. Crit. Infrastruct. Prot. 2022, 36, 100507. [Google Scholar] [CrossRef]
- Duan, Y.; Sun, Y.; Zhang, Y.; Fan, X.; Dong, Q.; Guo, S. Risk Evaluation of Electric Power Grid Investment in China Employing a Hybrid Novel MCDM Method. Mathematics 2021, 9, 473. [Google Scholar] [CrossRef]
- Zhao, H.; Guo, S.; Zhao, H. Comprehensive assessment for battery energy storage systems based on fuzzy-MCDM considering risk preferences. Energy 2019, 168, 450–461. [Google Scholar] [CrossRef]
- Maihemuti, S.; Wang, W.; Wu, J.; Wang, H. New energy power system operation security evaluation based on the SWOT analysis. Sci. Rep. 2022, 12, 12680. [Google Scholar] [CrossRef]
- Yuan, J.; Li, X.; Xu, C.; Zhao, C.; Liu, Y. Investment risk assessment of coal-fired power plants in countries along the Belt and Road initiative based on ANP-Entropy-TODIM method. Energy 2019, 176, 623–640. [Google Scholar] [CrossRef]
- Mohsen, O.; Fereshteh, N. An extended VIKOR method based on entropy measure for the failure modes risk assessment—A case study of the geothermal power plant (GPP). Saf. Sci. 2017, 92, 160–172. [Google Scholar] [CrossRef]
- Chisale, S.; Eliya, S.; Taulo, J. Optimization and design of hybrid power system using HOMER pro and integrated CRITIC-PROMETHEE II approaches. Green Technol. Sustain. 2023, 1, 100005. [Google Scholar] [CrossRef]
- Dong, J.; Liu, D.; Liu, Y.; Huo, H.; Dou, X.; Bao, A. Trading performance evaluation for traditional power generation group based on an integrated matter-element extension cloud model. Energy Rep. 2021, 7, 3074–3089. [Google Scholar] [CrossRef]
- You, P.; Liu, S.; Guo, S. A Hybrid Novel Fuzzy MCDM Method for Comprehensive Performance Evaluation of Pumped Storage Power Station in China. Mathematics 2021, 10, 71. [Google Scholar] [CrossRef]
- Kumar, R.; Singh, S.; Bilga, P.; Jatin; Singh, J.; Singh, S.; Scutaru, M.; Pruncu, C. Revealing the benefits of entropy weights method for multi-objective optimization in machining operations: A critical review. J. Mater. Res. Technol. 2021, 10, 1471–1492. [Google Scholar] [CrossRef]
- Diakoulaki, D.; Mavrotas, G.; Papayannakis, L. Determining objective weights in multiple criteria problems: The critic method. Comput. Oper. Res. 1995, 22, 763–770. [Google Scholar] [CrossRef]
- Lever, J.; Krzywinski, M.; Altman, N. Principal component analysis. Nat. Methods 2017, 14, 641–642. [Google Scholar] [CrossRef]
- Saaty, R. The analytic hierarchy process—What it is and how it is used. Math. Model. 1987, 9, 161–176. [Google Scholar] [CrossRef]
- Kheybari, S.; Rezaie, F.; Farazmand, H. Analytic network process: An overview of applications. Appl. Math. Comput. 2020, 367, 124780. [Google Scholar] [CrossRef]
- Rezaei, J. Best-worst multi-criteria decision-making method: Some properties and a linear model. Omega 2016, 64, 126–130. [Google Scholar] [CrossRef]
- Guo, S.; Zhao, H. Fuzzy best-worst multi-criteria decision-making method and its applications. Knowl.-Based Syst. 2017, 121, 23–31. [Google Scholar] [CrossRef]
- Yuan, Z.; Yang, Z.; Jin, L.; Zhou, G.; Zhang, Y.; Wang, H.; Wang, C.; Tu, Y. Technique for Order Preference by Similarity to an Ideal Solution-based comprehensive health assessment of composite insulators for overhead transmission lines. High Volt. 2023, 8, 149–157. [Google Scholar] [CrossRef]
- Stević, Ž.; Pamučar, D.; Puška, A.; Chatterjee, P. Sustainable supplier selection in healthcare industries using a new MCDM method: Measurement of alternatives and ranking according to COmpromise solution (MARCOS). Comput. Ind. Eng. 2020, 140, 106231. [Google Scholar] [CrossRef]
- Luthra, S.; Govindan, K.; Kannan, D.; Mangla, S.; Garg, C. An integrated framework for sustainable supplier selection and evaluation in supply chains. J. Clean. Prod. 2017, 140, 1686–1698. [Google Scholar] [CrossRef]
- Wang, Q.; Li, S.; He, G.; Li, R.; Wang, X. Evaluating sustainability of water-energy-food (WEF) nexus using an improved matter-element extension model: A case study of China. J. Clean. Prod. 2018, 202, 1087–1106. [Google Scholar] [CrossRef]
- Serrano-Gomez, L.; Munoz-Hernandez, J. Risk Influence Analysis Assessing the Profitability of Large Photovoltaic Plant Construction Projects. Sustainability 2020, 12, 9127. [Google Scholar] [CrossRef]
- Xie, Y.; Xia, D.; Ji, L.; Zhou, W.; Huang, G. An inexact cost-risk balanced model for regional energy structure adjustment management and resources environmental effect analysis-a case study of Shandong province, China. Energy 2017, 126, 374–391. [Google Scholar] [CrossRef]
- Arranz-Piera, P.; Kemausuor, F.; Darkwah, L.; Edjekumhene, I.; Cortés, J.; Velo, E. Mini-grid electricity service based on local agricultural residues: Feasibility study in rural Ghana. Energy 2018, 153, 443–454. [Google Scholar] [CrossRef]
- Jiang, Q.; Huang, R.; Huang, Y.; Chen, S.; He, Y.; Lan, L.; Liu, C. Application of BP Neural Network Based on Genetic Algorithm Optimization in Evaluation of Power Grid Investment Risk. IEEE Access 2019, 7, 154827–154835. [Google Scholar] [CrossRef]
- Peng, F.; Tao, J.; Zhang, H. Modeling for wind-thermal combined bidding considering bilateral tail information. Energy Rep. 2023, 9, 260–268. [Google Scholar] [CrossRef]
- Zhang, S.; Liu, L. A Mitigation Method Based on the Principle of GIC-Even Distribution in Whole Power Grids. IEEE Access 2020, 8, 65096–65103. [Google Scholar] [CrossRef]
- Rouse, J.; Garvey, S.; Cárdenas, B.; Hoskin, A.; Swinfen-Styles, L.; Xu, W. A case study investigation into the risk of fatigue in synchronous flywheel energy stores and ramifications for the design of inertia replacement systems. J. Energy Storage 2021, 39, 102651. [Google Scholar] [CrossRef]
- Wang, Y.; Yin, X.; Geng, F.; Jing, H.; Su, H.; Liu, R. Risk Assessment of Water Inrush in Karst Tunnels Based on the Efficacy Coefficient Method. Pol. J. Environ. Stud. 2017, 26, 1765–1775. [Google Scholar] [CrossRef]
- Mohagheghi, S. Reinforcement of energy delivery network against natural disaster events. Int. J. Disaster Risk Reduct. 2014, 10, 315–326. [Google Scholar] [CrossRef]
- Burgholzer, B.; Auer, H. Cost/benefit analysis of transmission grid expansion to enable further integration of renewable electricity generation in Austria. Renew. Energy 2016, 97, 189–196. [Google Scholar] [CrossRef]
- Li, H.; Li, B.; Luo, Z.; Li, H.; Zhao, Y.; Wang, T.; Sun, Y. Power Supply Reliability Enhancement for Low-Voltage Distribution Area With Power Quality Improvement Function. IEEE Access 2022, 10, 130619–130631. [Google Scholar] [CrossRef]
- Wang, J.; Xiao, L.; He, Y. Exploration of Operation Modes of a Thermal Power Unit across Two Power Grids. Electr. Power Compon. Syst. 2023, 51, 694–705. [Google Scholar] [CrossRef]
- Zhang, R.; Shimada, K.; Ni, M.; Shen, G.; Wong, J. Low or No subsidy? Proposing a regional power grid based wind power feed-in tariff benchmark price mechanism in China. Energy Policy 2020, 146, 111758. [Google Scholar] [CrossRef]
- Zhao, Y.; Su, Q.; Li, B.; Zhang, Y.; Wang, X.; Zhao, H.; Guo, S. Have those countries declaring “zero carbon” or “carbon neutral” climate goals achieved carbon emissions-economic growth decoupling? J. Clean. Prod. 2022, 363, 132450. [Google Scholar] [CrossRef]
- Li, J.; Sun, Z.; Lu, S. Assessment of carbon emission reduction contribution of Chinese power grid enterprises based on MCS-GA-ELM method. Environ. Sci. Pollut. Res. 2023, 30, 23422–23436. [Google Scholar] [CrossRef] [PubMed]
- Mohammadi, M.; Rezaei, J. Bayesian best-worst method: A probabilistic group decision making model. Omega 2020, 96, 102075. [Google Scholar] [CrossRef]
- Zhang, Z.; Lin, S.; Ye, Y.; Xu, Z.; Zhao, Y.; Zhao, H.; Sun, J. A Hybrid MCDM Model for Evaluating the Market-Oriented Business Regulatory Risk of Power Grid Enterprises Based on the Bayesian Best-Worst Method and MARCOS Approach. Energies 2022, 15, 2978. [Google Scholar] [CrossRef]
- Zhang, Y.; Zhao, H.; Li, B.; Zhao, Y.; Qi, Z. Research on credit rating and risk measurement of electricity retailers based on Bayesian Best Worst Method-Cloud Model and improved Credit Metrics model in China’s power market. Energy 2022, 252, 124088. [Google Scholar] [CrossRef]
- Shao, C.; Wei, B.; Liu, W.; Yang, Y.; Zhao, Y.; Wu, Z. Multi-Dimensional Value Evaluation of Energy Storage Systems in New Power System Based on Multi-Criteria Decision-Making. Processes 2023, 11, 1565. [Google Scholar] [CrossRef]
- Mirrashid, M.; Naderpour, H. Incomprehensible but Intelligible-in-time logics: Theory and optimization algorithm. Knowl.-Based Syst. 2023, 264, 110305. [Google Scholar] [CrossRef]
- Wang, Z.; Zheng, J.; Li, H. The Risk Evaluation Model of Mining Project Investment Based on Fuzzy Comprehensive Method. Appl. Mech. Mater. 2013, 295–298, 2928–2934. [Google Scholar] [CrossRef]
- Yang, J.; Xiang, Y.; Wang, Z.; Dai, J.; Wang, Y. Optimal Investment Decision of Distribution Network With Investment Ability and Project Correlation Constraints. Front. Energy Res. 2021, 9, 728834. [Google Scholar] [CrossRef]
- Wu, Q.; Liu, X.; Qin, J.; Zhou, L.; Mardani, A.; Deveci, M. An integrated multi-criteria decision-making and multi-objective optimization model for socially responsible portfolio selection. Technol. Forecast. Soc. Change 2022, 184, 121977. [Google Scholar] [CrossRef]
- Li, H.; Shi, N. Application of Genetic Optimization Algorithm in Financial Portfolio Problem. Comput. Intell. Neurosci. 2022, 2022, 5246309. [Google Scholar] [CrossRef] [PubMed]
Disclaimer/Publisher’s Note: The statements, opinions and data contained in all publications are solely those of the individual author(s) and contributor(s) and not of MDPI and/or the editor(s). MDPI and/or the editor(s) disclaim responsibility for any injury to people or property resulting from any ideas, methods, instructions or products referred to in the content. |
© 2023 by the authors. Licensee MDPI, Basel, Switzerland. This article is an open access article distributed under the terms and conditions of the Creative Commons Attribution (CC BY) license (https://creativecommons.org/licenses/by/4.0/).