Abstract
The purpose of this research work was to examine the hydroelectric potential of wastewater treatment plants by harnessing the kinetic and/or potential energy of treated wastewater for electricity generation. Such a concept encapsulates the essence of renewable energy and resonates with international sustainable development mandates and climate change adaptation strategies. The primary objective was to analyze the performance parameters of the Francis turbine, a key component of this energy generation system. An experimental analysis encompassed model tests on the Francis turbine, simulating varied flow conditions using the GUNT turbine. Additionally, historical data from the Toruń Wastewater Treatment Plant (WWTP) 2018 annual wastewater discharge were employed to validate the findings and shed light on real-world applications. The tested efficiency of the Francis turbine peaked at 64.76%, notably below the literature-reported 80%. The turbine system’s overall efficiency was approximately 53%, juxtaposed against the theoretical value of 66.35%. With respect to the Toruń WWTP data, the turbine’s power output was highest at 24.82 kW during maximum wastewater flow, resulting in a power production of 150.29 MWh per year. The observed turbine efficiencies were consistent with the previously documented range of 30% to 96%. The turbine displayed optimal outputs during heightened flow rates and maximized production at more frequent, lower flow rates throughout the year. Implementing such turbines in wastewater treatment plants not only aligns with global renewable energy goals but also boasts lower construction costs and environmental impacts, primarily due to the utilization of existing infrastructure. Furthermore, wastewater flow consistency counters the seasonal variability seen in conventional water treatment plants. These findings pave the way for more energy-efficient design recommendations for turbines within wastewater treatment and hydropower plants.
1. Introduction
Hydroelectric power plants use the energy of flowing watercourses (run of river), the energy stored in water reservoirs (storage), the difference in water level between reservoirs (pumped storage), or the energy of ocean waves and tides to generate electricity [1,2]. This water is sent each time to the turbine and then to the generator and the transmission network, where it is passed on to the power grid and delivered to consumers [3].
These facilities are usually located directly on rivers, above (upstream) or below (downstream) water reservoirs (i.e., natural or man-made dams), in the form of a system of upper and lower reservoirs, in a cascade of water reservoirs, in diversion (energy) channels, as underground power plants, or in seas and oceans [4]. Water sources used in this type of facilities can be natural (watercourses, reservoirs, seas, and oceans, among others) or anthropogenic: industrial (e.g., flushing systems in industrial plants), agricultural (e.g., irrigation systems) and municipal (e.g., water treatment plants, sewage treatment plants, rainwater tanks in urban areas, landfills) [5,6]. The major advantage of using hydropower systems that use anthropogenic water sources is their predictability. For example, in wastewater treatment plants (WWTPs), in most cases, water flows to the plant constantly, which ensures the stability of the operation of such a system, in contrast to the use of natural water flow in rivers, which is variable in time [7,8]. Another advantage is the reduction in greenhouse gas emissions in such plants, which can use water energy as a supplement to conventional sources based on non-renewable fuels, e.g., hard coal and lignite, natural gas, and petroleum [9]. Moreover, in contrast to hydropower plants located on rivers or water reservoirs, siting such a solution in an existing anthropogenic facility limits several environmental impacts, for example, the migration of aquatic organisms, alteration of conditions for transport, and accumulation of bottom sediments, resettlement of people, or effects on oxygen and thermal conditions of water within hydropower plants [10,11]. Anthropogenic objects are also usually monitored in the context of various water quality parameters and environmental impacts, which facilitates using such a solution [12].
Globally, there is great potential for the use of wastewater flow in WWTPs to generate electricity through hydropower plants; about 360 km3 of municipal wastewater is generated annually, of which 11.4% is treated and reused in WWTPs (equivalent equal 78,082.19 m3 s−1). Another 41.4% is treated and discharged to receiving waters (283,561.6 m3 s−1) [13]. For comparison, the average annual water discharge from the Amazon River basin ranges from about 10,000 to 225,000 m3 s−1 [14]. In 2022, total hydropower generation worldwide was 4326.76 TWh (Europe: 697.70 TWh, Poland: 2.06 TWh) [15,16]; assuming that an average of 82.8 m3 is needed to generate 1 MWh (example of U.S. gross electricity consumption for hydropower) [17], that is a total of 358.26 km3 of water. This means that wastewater has great potential for electricity generation: on average, similar to all the water used for hydropower worldwide in 2022, or 4347.77 TWh (estimated values). In 2020, the amount of municipal wastewater produced in Europe was 55 km3, the largest amount in Russia, Spain, and France (12.32, 5.68, and 5.12 km3, respectively), and in Poland—2.17 km3 [13]. The potential for electricity production from sewage in this region with the above assumptions was equal to 664.24 TWh (Poland: 26.21 TWh). The calculated values are indicative only and would require separate scientific research.
Hydropower investments align with international energy policies. In the European Union, for example, the European Green Deal aims to achieve at least 42.5% renewable energy share of final energy consumption by 2030 [18]. In addition, hydropower development is part of the International Energy Agency’s goal of net zero carbon dioxide emissions by 2050 [19], or the United Nations Sustainable Development Goals; in particular, “affordable and clean energy” (goal 7), “climate action” (goal 13), and “clean water and sanitation” (goal 6) [20], among others. For the above reasons, research on the use of hydropower in WWTPs may become more important soon.
As mentioned, turbines play an important role in a hydroelectric power plant’s generation capacity. A water turbine is an engine that converts the energy of flowing water (kinetic and/or potential) into useful work (rotational energy) [21]. The whirlpool created by the water flow generates torque, which is used to generate electricity by generators in a hydroelectric power plant [22].
Turbines can be subdivided into, e.g., based on their type and system [23]. The first subdivision refers to the diversification of energy conversion. It distinguishes impulse turbines (splash turbines), which use the energy of the velocity hitting the shells attached to the circumference of the rotor (e.g., Pelton, Turgo, and Banki), and reaction turbines (thrust turbines), which use the pressure energy exerting pressure on the rotor of the blades (e.g., Francis, Kaplan, and propeller) [24,25]. The second division results from the chosen design solutions, e.g., (a) based on the location of the turbine in an open chamber, in a spiral, in a tube, in a siphon, with bell inlet, twin, (b) based on the location of the turbine shaft: horizontal, diagonal, vertical (c) based on the number of rotors: single rotor and multirotor [26].
The Francis turbine is one of the most commonly used turbines in hydroelectric power plants; it was invented in 1948 by James Francis based on his improved designs by other engineers: Benoît Fourneyron and Jean-Victor Poncelet [27]. The Francis turbine consists of a rotor, an intake tube, a control wheel, and a specially made casing, usually in the shape of a spiral. During the operation of the device, the flow changes its direction from radial to axial, and the water leaves the turbine through the intake pipe [28]. The classification of the Francis turbine according to the range of speed characteristics is as follows: slow speed—speed ratio from 50 to 150 and hydraulic gradient >110 m; medium speed—151–250 and 50–110 m; and high speed—251–450 and <50 m [29]. The device is suitable for a wide range of flows and hydraulic heads; according to a review of technologies used in low-head hydropower plants by Loots et al. (2015) [30], the Francis turbine operates in the range of flows from 0.05 m3 s−1 to 60 m3 s−1, a hydraulic head from 2 to 500 m, with an output power (capacity) of the turbine from 1 kW to 1000 MW. The efficiency of this type of solution is assumed to be about 80% when the flow is used from 50 to 100%, while it is 0% when the flow is used up to 20% [31].
An important aspect of the operation of hydropower plants is their profitability [32]. It is estimated that the cost of electrical and mechanical components ranges from 20% in large hydropower plants up to as much as 60–70% in some cases [33] (especially in micro hydropower plants with a capacity below 100 kW and a head less than 10 m [34]). The operating costs of water turbines decrease with the capacity and head. Among the Kaplan, Pelton, and Francis turbines tested, Francis turbines are considered the most profitable in micro hydropower plants [24]. Also gaining importance are, among others, axial flow pumps as turbines due to their low price and easier implementation compared to other types of turbines [35]. Important aspects in the operation of this turbine are energy performance, tip leakage flow, and cavitation performance [36,37]. The use of hydropower energy technology in wastewater treatment plants can also be a way to recover energy [8,38], in addition to, among others, the following solutions: rainwater collection systems, hybrid water supply systems, co-digestion and cogeneration systems, and use of sewage sludge [39,40,41].
This study aims to determine the hydropower potential of using treated wastewater discharged from the WWTP. This paper presents a model study using a Francis turbine from GUNT Geraetebau GmbH–Barsbüttel, Germany (catalog number HM 150.20), an analysis of the turbine’s operating parameters based on model and literature tests, and a determination of the energy potential of using this solution using the example of the central WWTP in Toruń (i.e., northern Poland, Central Europe). This plant was selected because it uses a Francis turbine in a small hydroelectric power plant. It utilizes the top water from the secondary sedimentation tanks, which is discharged into a system of top and bottom water basins. It is one of the few plants in Poland that uses treated wastewater to generate energy. Our findings show that it is possible to verify the profitability of such solutions and formulate recommendations and guidelines for their operation.
The findings of this study can serve as a foundation for crafting turbine design recommendations in both hydropower plants and WWTPs. This aligns with the goals of sustainable development and international energy policy, which envisage increasing the share of renewable energy sources and reducing greenhouse gas emissions. Additionally, this type of analysis of the functioning of micro hydro turbine performance installed in a wastewater treatment plant based on model studies in Poland has not been performed so far, which is an innovative element. As mentioned, this research has potential due to the possibility of using wastewater for hydropower purposes on a larger scale.
The rest of the manuscript is organized as follows: Section 2 presents brief information about the study site, experimental campaign, and overall methodological approach; Section 3 presents the main results and discusses their relevance regarding the benefit of recovering clean energy from the waste treatment plants. Finally, the main conclusions drawn from this study are presented in Section 4.
2. Materials and Methods
2.1. Francis Turbine Model Tests
The results of tests performed on a hydro turbine and mathematical formulas were used to calculate the hydropower potential for the selected research facility. For the model tests conducted in the water laboratory of Prof. Julian Wołoszyn at the Institute of Environmental Engineering of the Wrocław University of Environmental and Life Sciences, an experimental Francis turbine from GUNT Geraetebau GmbH (Barsbüttel, Germany) with the catalog number HM 150.20 (Figure 1) was used [42].
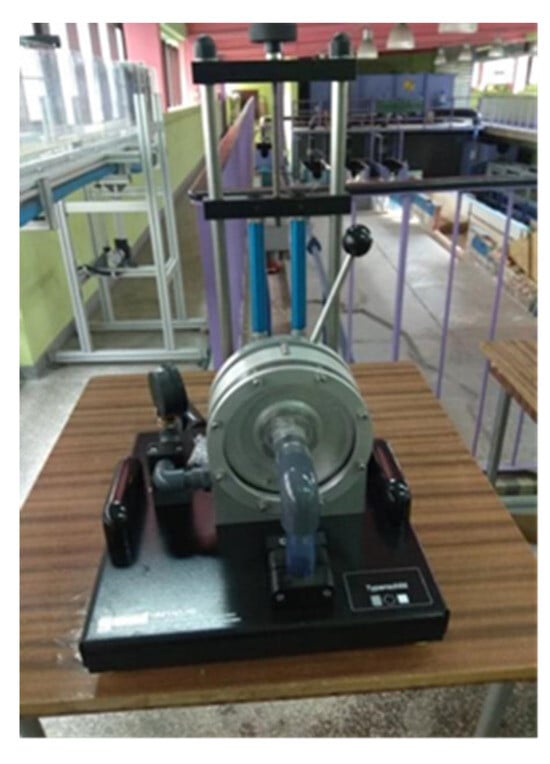
Figure 1.
Francis turbine GUNT HM 150.20 (GUNT Geraetebau GmbH, Barsbüttel, Germany) used in model tests (K. Mastalerek).
The main elements of the turbine are:
- Inlet pipe with a manometer mounted on it (Figure 2a);
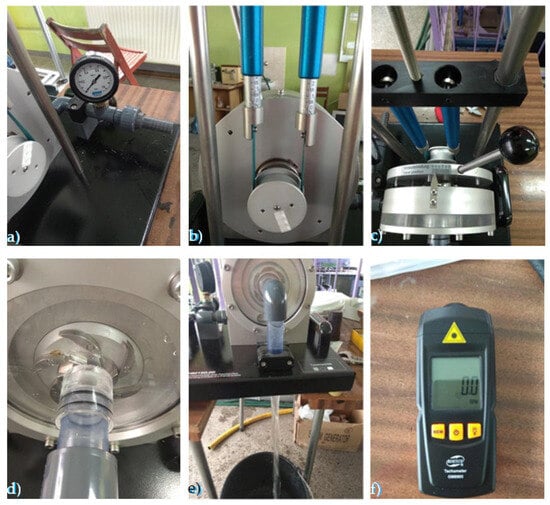 Figure 2. Turbine components used in the model tests: (a) inlet pipe with pressure gauge, (b) rotating shaft with weights, (c) control system, (d) impeller, (e) outlet pipe (K. Mastalerek), and (f) Benetech GM8905 laser tachometer (K. Mastalerek).
 - Rotating shaft with weights (Figure 2b);
- Steering system (Figure 2c);
- Impeller (Figure 2d);
- Outlet pipe (Figure 2e).
Turbine rotational speed was measured using a Benetech GM8905 (Benetech Poland, Kalisz, Poland) laser tachometer (Figure 2f) pointed at the rotating shaft. The instrument makes measurements in the range of 2.5–99,999 rpm. The measurement error is 0.1% in the 2.5–999.9 rpm (resolution 0.1 rpm) and 1% in the range of 1000–99,999 rpm (resolution 1 rpm). The sampling time is 1 s, and the laser power is 2–5 mW [43]. The error of the laboratory measuring equipment used was a maximum of 5%.
The model experiments consisted of flowing water through a turbine. The fluid pressure was read from a manometer attached to the inlet pipe. The hydraulic head can be calculated (Formula (1)) [44].
where:
- H—hydraulic head (m);
- p—pressure (Pa);
- ς—liquid density (ς = 1000 kg·m−3 was assumed, kg·m−3);
- g—gravitational acceleration (g = 9.81 m·s−2 was assumed, m·s−2).
Then, through the appropriate setting of the steering wheel and the weights placed at the shaft, the appropriate rotational speed of the turbine is obtained (Formula (2)) [45].
where:
- T—torque (Nm);
- F—the force of the weight acting on the shaft (F = F1 − F2; F1—force read from the right weight, N, F2—force read from the left weight, N) (N);
- D—shaft diameter (D = 0.05 m was assumed, m).
The output power (capacity) can be calculated from the previously obtained data (Formula (3)) [46]:
where:
- Pout—output power (capacity), W;
- n—number of rotations, -.
The hydraulic power is then calculated (Formulas (4) and (5)) [47]:
where:
Phyd = V · H · ς · g
- Phyd—hydraulic power (capacity) (W);
- V—volumetric flow through the turbine (m3·s−1);
- H—hydraulic head (m);
- ς—liquid density (ς = 1000 kg·m−3 was assumed, kg·m−3);
- g—gravitational acceleration (g = 9.81 m·s−2 was assumed, m·s−2);
- p—gauge pressure (bar).
Determination of turbine efficiency from Formula (6) [48]:
where:
- ηturb—turbine efficiency, -.
In addition to model tests, the work aims to calculate the theoretical energy potential in the WWTP in Toruń.
Calculation of turbine set efficiency (Formula (7)) [23]:
where:
ηt = ηturb · ηtransm · ηgen · ηpout,
- ηt—turbine set efficiency (-);
- ηturb—turbine efficiency (ηturb = 0.80 was assumed, -);
- ηtransm—transmission efficiency (ηtransm= 0.95 was assumed, -);
- ηgen—generator efficiency (ηgen= 0.90 was assumed, -);
- ηpout—power output efficiency (ηpout = 0.97 was assumed, -).
Calculation of generated power (Formula (8)) [37]:
where:
Pgen = H · V · ηt · g,
- Pgen—generated power (kW);
- H—hydraulic head (m);
- V—flow through the turbine (m3·s−1);
- ηt—turbine set efficiency (-);
- g—gravitational acceleration (g = 9.81 m·s−2 was assumed, m·s−2).
Calculation of the final power (Formula (9)) [44]:
where:
Pfinal = Pgen − (Pgen · Pown),
- Pfinal—final power (kW);
- Pgen—generated power (kW);
- Pown—own power consumption (Pown = 0.02 was assumed, -).
Calculation of the possible annual electricity production (Formula (10)) [49]:
where:
Pprod = Pfinal · t,
- Pprod—annual electricity production (kWh);
- Pfinal—final power (kW);
- t—operating time of the hydropower plant in the WWTP, h.
The article also performed the non-parametric Wilcoxon signed-rank test, comparing statistical significance between two groups of data based on the assigned sum of ranks, expressed by the z score (p < 0.05). The null hypothesis is that the differences in single-sample cases are distributed centered about zero. Absolute values are ranked [50]. In this case, these are paired model and literature data for the final turbine capacity (power) obtained and the annual electricity production depending on the hydraulic head.
2.2. Study Case and Research Facility
The “Centralna” municipal WWTP in Toruń was selected as a case study facility. It is in northern Poland, in the Kujawsko–Pomorskie voivodeship, in the western part of Toruń. It is a mechanical–biological WWTP with a maximum capacity of 90,000 m3/day. Taking into account data on annual amounts of wastewater from the period 2018–2022, the average was 15.56 million m3 and ranged from 15.15 million m3 in 2019 to 16.50 million m3 in 2021 (from 97.54% to 106.01% of the average amount of wastewater; normal years). This object treats domestic and industrial wastewater, infiltration, and stormwater from Toruń [51]. Its location is shown in Figure 3.
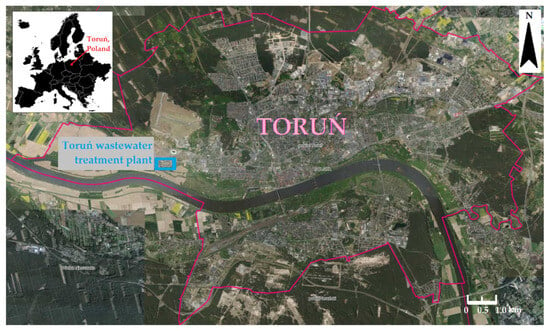
Figure 3.
Location of the “Centralna” WWTP in Toruń in Poland (map background from https://mapy.geoportal.gov.pl/imap/Imgp_2.html?gpmap=gp0, (accessed on 24 August 2023)).
The technological process (Figure 4) consists of three stages: mechanical treatment, biological treatment, and sludge treatment. In the first stage, the mechanical treatment of the wastewater, supplied through the sewage network and transported by septic tank trucks, is carried out by passing through grates and sand traps. Then, the impurities enter biological reactors, where they undergo the processes of dephosphorization, nitrification, and denitrification. Later, the wastewater enters secondary sedimentation tanks, where the activated sludge is separated by sedimentation. The effluent from the secondary sedimentation tanks is discharged into the Vistula River through a metering channel [52,53].
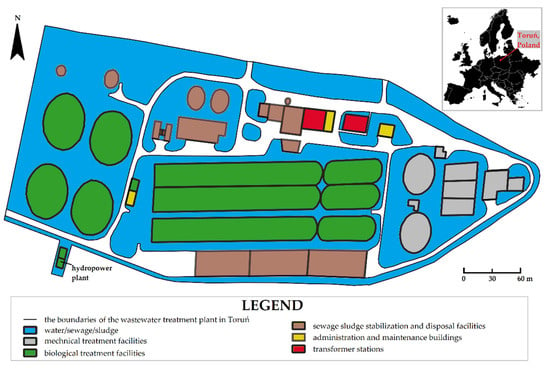
Figure 4.
Scheme of the Central Wastewater Treatment Plant in Toruń (own elaboration based on [51,53].
An innovative device that distinguishes Toruń’s WWTP from the other treatment plants in the country is the Francis water turbine, powered by the outflowing treated wastewater (overflow water from the secondary sedimentation tanks). Its operation is possible because of the current difference in elevation between the upper and lower basins. The hydroelectric power plant is located at the outflow of the WWTP before the outflow channel to the Vistula River. The turbine set used in the treatment plant is automated; it enables the control of the processes in the hydropower plant. This applies to the automatic adjustment of the guide vanes, keeping the upstream water level constant, control of the upstream and downstream water level, automatic switching on and off of the turbine after a power failure, as well as maintenance and display of the turbine parameters in real time, online [54]. The installed capacity of the hydropower plant is 55 kW [51,52,53,54]. Examples of the turbine’s operating parameters can be found in Table 1.

Table 1.
Turbine operating parameters on 25 May 2018 [51,52,53,54].
Figure 5a–c show photos of the turbine and the hydropower building and an illustrative diagram of the hydropower plant operation used in the WWTP.
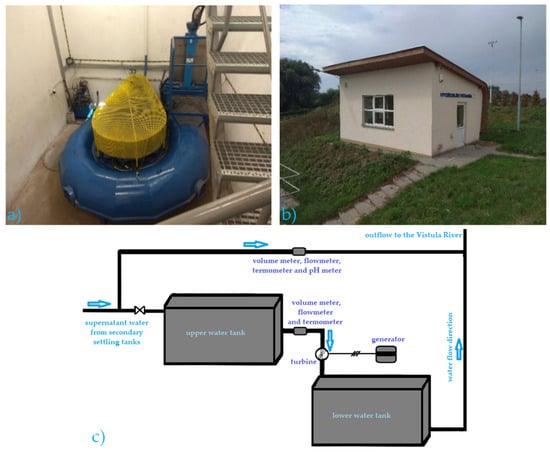
Figure 5.
Small hydroelectric power plant at the sewage treatment plant in Toruń: (a) view of the Francis turbine (K. Mastelerek); (b) view of the building of the hydroelectric power plant (K. Mastalerek); (c) preview of the operation of the plant (own elaboration based on [53]).
3. Results and Discussion
3.1. Model Tests
Table 2 shows examples of water turbine test results during tests conducted in the Water Laboratory of the Institute of Environmental Engineering of the Wroclaw University of Environmental and Life Sciences in Wrocław. The laboratory tests were aimed at checking the operation of the turbine and its subsequent verification in real conditions in Toruń’s WWTP.

Table 2.
Results of research on a model Francis turbine.
Seventeen tests were performed at a flow rate of 17.7 L/min (i.e., the maximum possible value under laboratory conditions) and a variable number of turbine revolutions. As the number of revolutions decreased, the torque and load increased in most cases. The maximum power and efficiency were obtained at 94 rpm (0.492 W and 11.911%, respectively) and the lowest at 135 rpm (0.106 W and 2.566%). These two variables change directly proportional to the number of revolutions up to 94 rpm and inversely proportional to this value (i.e., diagram in the form of an inverted parabola). The average values were: torque = 0.0453 Nm, output power = 0.335 W, and efficiency = 8.24%. The relationships between the characteristics of the model turbine, i.e., revolutions and torque and power, and revolutions and efficiency, are shown in Figure 6a–c.
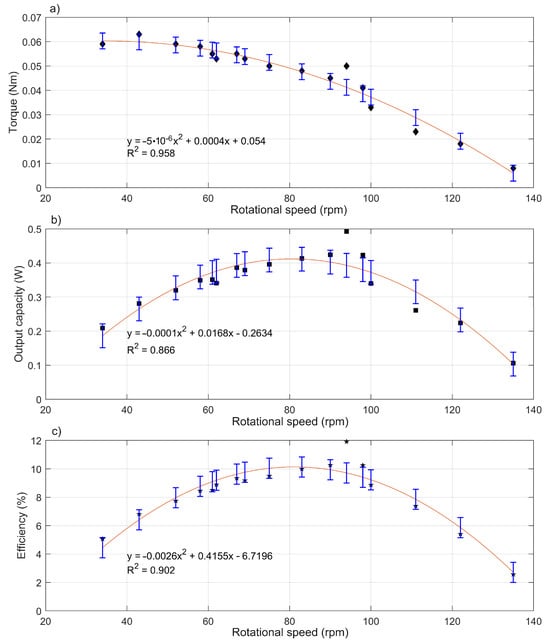
Figure 6.
Relationship between turbine parameters in model conditions: (a) torque and rotational speed; (b) output capacity (power) and rotational speed; (c) efficiency and rotational speed; error bars equal the standard deviation between observed and estimated values; markers indicate recorded observations.
3.2. Research Facility
Based on data obtained from Toruńskie Wodociągi Sp. z o. o. In Toruń, a hydrograph of discharges from 2018 (Figure 7a) and a flow–duration–sum curve (Figure 7b) were prepared on the volume of wastewater discharged from the WWTP. The minimum daily volume of wastewater discharged from the WWTP in 2018 was 33,415.92 m3 (1 November), the average was 42,742,327 m3, and the maximum was 76,073.59 m3 (13 July). This means that the maximum capacity of the treatment plant, i.e., 90,000 m3, was not exceeded on any day. The total annual volume of effluents discharged exceeded 15.6 million m3 (average for the period 2018–2022: 15.56 million m3), with the highest value in January (1.541 million m3) and the lowest in November and June (1.156 and 1.196 million m3, respectively).
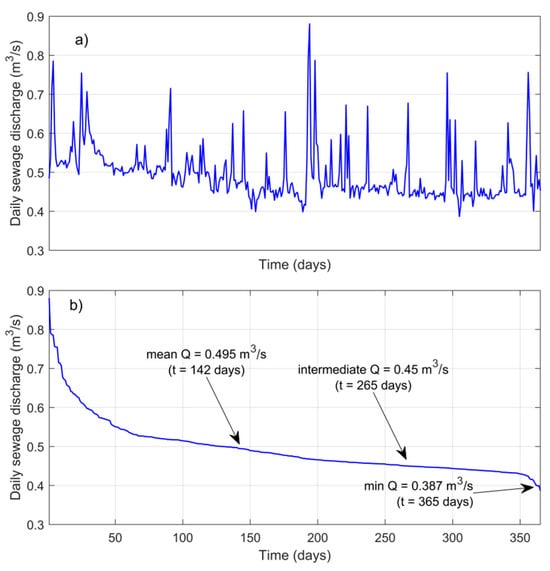
Figure 7.
(a) Hydrograph of treated wastewater flow from the “Centralna” wastewater treatment plant in Toruń in 2018; (b) curve of treated wastewater flow duration sums in 2018 with identified characteristic flows.
In using the flow curve, three characteristic flows of treated wastewater were considered in estimating the energy potential:
- Mean annual flow of 0.495 m3·s−1 (duration t = 142 days);
- Minimum annual flow of 0.387 m3·s−1 (duration t = 365 days);
- Intermediate annual flow of 0.450 m3·s−1 (duration t = 265 days).
Thanks to the model tests, it was also possible to estimate the efficiency of the Francis turbine under simulated real conditions in a WWTP. Figure 8 shows the relationship between turbine speed and efficiency. The turbine started its operation at 700 rpm (30% flow utilization) with an efficiency of about 54% and reached its maximum efficiency at 1200 rpm (64.76%), then gradually dropped to an efficiency of almost 10% at 2300 rpm (100% flow utilization).
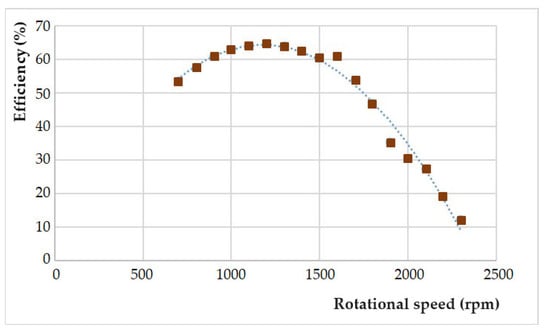
Figure 8.
Relationship between turbine efficiency and rotational speed.
Therefore, in the calculations of the energy potential of the enterprise for the model conditions, the turbine efficiency was assumed to be 64.76% for the flow of 0.495 m3 s−1 and 63.88% for 0.387 m3 s−1 and 0.45 m3 s−1 (according to the data in the turbine manual Francis GUNT HM 150.20), and the efficiency according to the literature at the level of 80% for all values of the characteristic flows.
Figure 9 and Figure 10 show the variability of final turbine output (capacity) and annual electricity production as a function of the hydraulic head for the above model assumptions (according to the instructions accompanying the unit) and the literature efficiency and characteristic flows of the WWTPs. For all flow variations, the final power and annual power production increase directly to the hydraulic head. The highest final turbine power (i.e., 23.68 kW) was obtained for the variant of average annual wastewater flow (Q = 0.495 m3 s−1), with the assumed efficiency of the system (ηt = 66.348% [31]) and the maximum hydraulic head (H = 7.5 m). As for the annual electricity production, the highest value (over 162.18 MWh) was also obtained in the variant with the literature efficiency and for the highest hydraulic head, but for the lowest flow (Q = 0.387 m3 s−1), since it occurred 365 days a year, unlike the other two variants. The lowest performance values were observed for the variant with the model efficiency (ηt = 53.717% and 52.979%, respectively) for the lowest flow, in terms of energy production for the average flow and model efficiency (for H = 7.5 m, respectively: 14.78 kW and 65.38 MWh). The maximum differences in the achieved performances between the different flow variants were: for the literature efficiency [31]—28.59%; for the model efficiency—29.79%; and between the efficiencies—60.39%. For annual electricity production, these differences were about two times for a given efficiency (101.03% and 98.82%) and about 2.5 times between efficiencies (148.36%). In addition, the power consumption for own use was about 2% in each case.
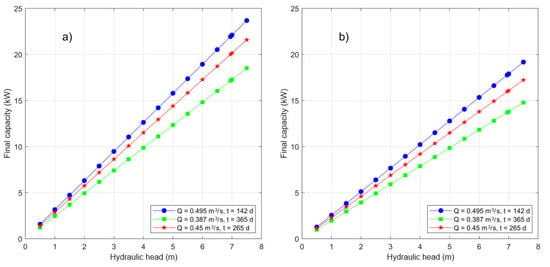
Figure 9.
Relation between the hydraulic head and the final capacity of the turbine: (a) according to the literature efficiency (ηturb = 80%); (b) according to the model efficiency (for Q = 0.495 m3 s−1 − ηturb = 64.76%, for Q = 0.45 and 0.387 m3 s−1 − ηturb = 63.88%).
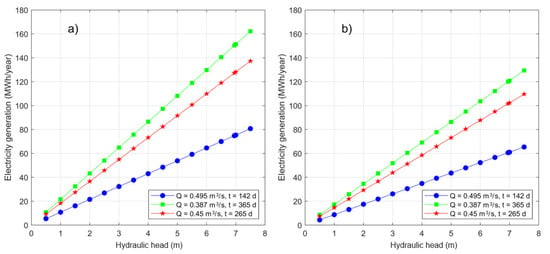
Figure 10.
Relationship between hydraulic head and annual electricity production: (a) according to literature efficiency (ηturb = 80%); (b) according to model efficiency (for Q = 0.495 m3 s−1 − ηturb = 64.76%, for Q = 0.45 i 0.387 m3 s−1 − ηturb = 63.88%).
Figure 11 shows the variability of final turbine output and annual electricity production as a function of the hydraulic head for the above model assumptions (according to the instructions included with the instrument) and the literature efficiency [31] and characteristic flows of the WWTPs. For all flow variations, the final power and annual power production increase directly to the hydraulic head. The highest final turbine power (i.e., 23.68 kW) was obtained for the variant of average annual wastewater flow (Q = 0.495 m3 s−1), with the assumed literature efficiency of the system (ηt = 66.348%) and the maximum hydraulic head (H = 7.5 m). As for the annual electricity production, the highest value (over 162.18 MWh) was also obtained in the variant with the literature efficiency and for the highest hydraulic head, but for the lowest flow (Q = 0.387 m3 s−1), since it occurred 365 days a year, unlike the other two variants. The lowest performance values were observed in the variant with model efficiency (ηt = 53.72% and 52.98%, respectively) for the lowest flow, in terms of energy production for the average flow and model efficiency (for H = 7.5 m, respectively: 14.78 kW and 65.38 MWh). The maximum differences in the achieved performances between the different flow variants were as follows: for the literature efficiency—28.59%; the model efficiency—29.79%; and between the efficiencies—60.39%. For annual electricity production, these differences were about two times for a given efficiency (101.03% and 98.82%) and about 2.5 times between efficiencies (148.36%). In addition, the power consumption for own use was about 2% in each case. By comparing the obtained literature and model values for the analyzed parameters, statistical significance was obtained (p < 0.05), carried out using the Wilcoxon signed-rank test. The values of the z variable were −2.44701 for the final capacity (average difference = 9.3 MW) and for the annual electricity production, −6.0308 (average difference = 61.98217 MWh).
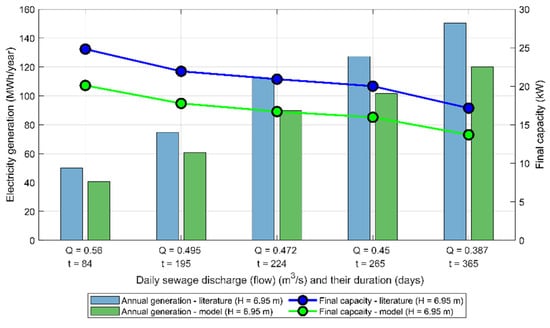
Figure 11.
Final capacity and energy potential of the treatment plant for five characteristic flows and a hydraulic head of H = 6.95 m.
The results obtained in connection with the efficiency of the Francis turbine follow the research carried out by other researchers. They show that the efficiency of this type of turbine is within wide limits, between 30% and 96% [55]. The rotors greatly influence the operating parameters of the turbine, and the methods of optimizing them and the design principles are of interest to researchers [52]. The methods to increase the efficiency of Francis turbines are based on the theory of the hodograph, mathematical modeling using computational fluid dynamics (CFD) software, and the use of a system of multiple turbines or adjustable guide vanes, among others [56]. For example, the following solutions are used to increase the efficiency of other turbines: needle and multi-nozzle systems in Pelton turbine, adjustable runner blades in Kaplan turbine, guide vanes and flap systems in Banki turbines, the use of a system with several pumps as turbines [57].
A study by Power et al. (2014) [58] compared the parameters of Kaplan, Francis, propeller, and pump turbines as turbines at the outlet of the Ringsend WWTP. It shows that Francis and Kaplan turbines produce the most energy on average and per year but exceed the cost of the other turbines overall and per unit of output (the pump as the turbine is the most cost-effective, even though it produces the least energy). In turn, Bousquet et al. (2017) [59] and Darries et al. (2022) [60] found that the turbine installed at the outlet of a WWTP is the most suitable due to its low cost and technological adaptation to a low head; they also identified 19 sites suitable for the use of hydropower in WWTPs in Switzerland, with a total annual capacity of 9.3 GWh. Also, according to Ak et al. (2017) [61], the Archimedean screw was identified as the most suitable for installation at the outlet of a WWTP due to its cost efficiency and low environmental impact (however, they require more space than Francis turbines); the payback period of the investment in Tatlar WWTP (Turkey) was estimated at 2.6 years. For comparison, according to data cited by Chae et al. (2015) [7], the hydropower potential of 15 WWTPs in South Korea with a daily wastewater volume of more than 20,000 m3 and a head of more than 2 m is 11 GW. From a review study by Llácer-Iglesias (2021) [62], which considered 49 hydropower plants in WWTPs, it appears that the installed capacity of operating hydropower plants in WWTPs is low, up to 4.5 MW. The dominant countries in the application of these technologies are Switzerland and South Korea, as mentioned above. The most common turbines are Pelton and Kaplan turbines. The efficiency of such systems in terms of electricity production (capacity factor) ranges from 15.5% to 52.7% (production from 0.06 to 5.5 GWh per year). In Poland, there are only two hydropower plants in WWTPs with a total capacity of 81 kW (Toruń–Francis turbine with a capacity of 21 kW and Kraków–Kaplan turbine with a capacity of 60 kW) [63].
The problem affecting this volatility of power generation is, in some cases, the varying inflow and outflow of effluents, both hourly and in the daily and seasonal systems. As pointed out by researchers (e.g., Power et al., 2016 [64]; Kumar et al., 2011 [65]; Bousquet et al., 2017 [59]), this problem is important from the point of view of optimizing the operation of the turbines in the systems under consideration. This factor should be considered, among others, when building models to increase the efficiency of the systems [66]. On a broader scale, this problem mainly affects areas in climates with dry and rainy seasons and on a smaller scale, e.g., areas with seasonal tourism or even with periodically migrating communities (such as college towns) [59]. Fluctuations in flow are also affected by external strategies that reduce water demand, e.g., leakage control and automated metering [67].
The construction of hydropower plants at the inlet or outlet of the WWTP is one of the ways to meet the high energy demand for this type of plant. Chen and Chen (2013) [68] reported that wastewater treatment is responsible for about 3% to 5% of electricity demand in countries with different levels of development. Aeration processes account for the highest percentage of energy consumption; according to Cakir (2014) [69], it accounts for about 50% of energy costs in WWTPs, and according to Gandiglio et al. (2017) [70]—50–70%. In South Korea, WWTPs consume 2800 GWh of energy annually, and the demand for electricity increases by about 10% each year [71]. At the same time, in 2010, only 0.8% of WWTPs in South Korea used their source of electricity, such as hydropower plants (Chae et al., 2015) [7]. According to Bousquet et al. (2017) [59], it amounted to 0.5 TWh per year in Switzerland (1% of the country’s total electricity consumption). In the United States, it amounted to 15 TWh per year, 25–40% of the operating costs of WWTPs (U.S. EPA, 2013) [72]. Venkatesh and Brattebø (2011) [73] report that wastewater treatment requires twice as much energy (0.8 kWh per 1 m3) to provide the same amount as drinking water. Sinagra et al. (2022) [74] report energy requirements in the range of 0.3–2.1 kWh per cubic meter of treated wastewater. Another argument for meeting the electricity demand from own, preferably renewable sources, and optimizing its use is that electricity in WWTPs is responsible for up to 80% of greenhouse gas emissions [75]. In this regard, national and international strategies are being implemented, such as a plan in South Korea to reduce greenhouse gas emissions in WWTPs [76,77] or to improve efficiency in water and wastewater management in Spain [78]. Implementing these programs requires the participation of various stakeholders, e.g., national governments or agencies involved in the management of water services [76].
Considering the above problems, the need to increase energy efficiency and sustainable wastewater treatment is obvious [64]. Therefore, the introduction of hydroelectric plants using raw wastewater (at the inlet of the WWTP) or treated wastewater (at the outlet of the WWTP) is becoming more and more important [79]. In addition, to improve the energy efficiency of WWTPs, the following methods are used: anaerobic digestion [80], cogeneration systems that produce both heat and energy [41], and energy-saving treatment processes [81].
4. Conclusions
Considering the carried-out analysis of Francis turbine efficiency and determination of the energy potential of this solution on the example of the WWTP in Toruń in Poland, the following conclusions can be drawn:
The Francis turbine’s efficiency in model tests was 64.76%, lower than the 80% reported in the literature. The overall model efficiency for the entire turbine set was approximately 53%, which aligns with other research findings ranging from 30% to 96% but lower than the theoretical literature efficiency of 66.35%. The calculated final power and hydraulic head changed proportionally with power production. The highest turbine power reached 24.82 kW, resulting in a total production of 150.29 MWh, based on 2018 wastewater discharge data from Toruń WWTP and the included hydraulic head. The literature-based power variant exceeded the model-based power. The turbine achieved its peak output at the highest flows (Q = 0.56 m3 s−1), while the highest production occurred at the lowest flows, which were the most frequent throughout the year (Q = 0.387 m3 s−1). In summary, the issues discussed in this article are part of research aimed at improving the energy efficiency of WWTPs. This energy-intensive industry also contributes to greenhouse gas emissions. Compared to hydroelectric plants on rivers and reservoirs, this solution offers advantages such as lower construction costs, a smaller environmental footprint (thanks to existing infrastructure), and a generally steady wastewater inflow, with fewer seasonal fluctuations compared to treatment plants on watercourses or reservoirs. Furthermore, the findings from this study can serve as a foundation for crafting turbine design recommendations in both hydropower plants and WWTPs. This aligns with international energy policy directives that emphasize the need to boost the utilization of renewable energy sources, enhance energy efficiency, and curtail greenhouse gas emissions that contribute to climate change.
Future research could focus on the economic analysis of the proposed solution, including other turbine types in the study, increase the number of comparators (e.g., WWTPs in different climates, in areas with intensive tourism, and others characterized by seasonal variations in wastewater inflow), or consider a broader time perspective of wastewater flow to capture their variability (e.g., dry, normal, and wet years). In addition, modifications could be made to the turbines that affect their efficiency and allow optimization of their operation, such as using adaptable guide vanes, a system with multiple turbines, or mathematical modeling using computational fluid dynamics software. The research could also include the second type of hydropower plants in WWTPs, i.e., those located at the intake of the plant and using raw sewage to generate energy. The described results apply to WWTPs with similar capacity receiving wastewater from urban agglomerations in comparable quantities throughout the year and without clear seasonality (e.g., increase in wastewater volume in summer in coastal tourist resorts or the occurrence of dry and rainy seasons), where the Francis turbine used is located at the outlet of the WWTP with low power (21 kW).
Author Contributions
Conceptualization, K.M., P.T. and M.W.; methodology, K.M., P.T. and M.W.; software, K.M. and P.T.; validation, K.M., P.T. and M.W.; formal analysis, K.M., P.T. and M.W.; investigation, K.M. and M.W.; resources, K.M. and M.W.; data curation, K.M. and P.T.; writing—original draft preparation, P.T.; writing—review and editing, J.J., A.K., K.M. and M.W.; visualization, J.J., K.M. and P.T.; supervision, M.W. All authors have read and agreed to the published version of the manuscript.
Funding
This research received no external funding.
Data Availability Statement
The data presented in this study are available on request from the corresponding author.
Acknowledgments
We would like to thank GUNT Gerätebau GmbH in Barsbüttel, represented by Wojciech Szwed, for the opportunity to use the Francis HM 150.20 turbine for its model tests, which were used in the article. We would also like to thank Toruńskie Wodociągi Sp. z o. o. for providing data on technologies used in the WWTP in Toruń (including those related to the hydropower plant) and wastewater flow in 2018. Alban Kuriqi is grateful for the Foundation for Science and Technology’s support through funding UIDB/04625/2020 from the research unit CERIS.
Conflicts of Interest
The authors declare no conflict of interest.
References
- Singh, V.K.; Singal, S.K. Operation of hydro power plants-a review. Renew. Sustain. Energy Rev. 2017, 69, 610–619. [Google Scholar] [CrossRef]
- Tomczyk, P.; Wiatkowski, M.; Kuriqi, A. Small Hydropower Plants’ Impacts on the Ecological Status Indicators of Urban Rivers. Appl. Sci. 2022, 12, 12882. [Google Scholar] [CrossRef]
- Okot, D.K. Review of small hydropower technology. Renew. Sustain. Energy Rev. 2013, 26, 515–520. [Google Scholar] [CrossRef]
- Kuriqi, A.; Pinheiro, A.N.; Sordo-Ward, A.; Garrote, L. Flow regime aspects in determining environmental flows and maximising energy production at run-of-river hydropower plants. Appl. Energy 2019, 256, 113980. [Google Scholar] [CrossRef]
- Wdowczyk, A.; Szymańska-Pulikowska, A. Micro- and Macroelements Content of Plants Used for Landfill Leachate Treatment Based on Phragmites australis and Ceratophyllum demersum. Int. J. Environ. Res. Public Health 2022, 19, 6035. [Google Scholar] [CrossRef] [PubMed]
- Wdowczyk, A.; Szymańska-Pulikowska, A. Effect of substrates on the potential of Phragmites australis to accumulate and translocate selected contaminants from landfill leachate. Water Resour. Ind. 2023, 29, 100203. [Google Scholar] [CrossRef]
- Chae, K.J.; Kim, I.S.; Ren, X.; Cheon, K.H. Reliable energy recovery in an existing municipal wastewater treatment plant with a flow-variable micro-hydropower system. Energy Convers. Manag. 2015, 101, 681–688. [Google Scholar] [CrossRef]
- García, A.M.; Díaz JA, R.; Morillo, J.G.; McNabola, A. Energy Recovery Potential in Industrial and Municipal Wastewater Networks Using Micro-Hydropower in Spain. Water 2021, 13, 691. [Google Scholar] [CrossRef]
- Yüksel, I. Hydropower for sustainable water and energy development. Renew. Sustain. Energy Rev. 2010, 14, 462–469. [Google Scholar] [CrossRef]
- Andrade AD, L.; dos Santos, M.A. Hydroelectric plants environmental viability: Strategic environmental assessment application in Brazil. Renew. Sustain. Energy Rev. 2015, 52, 1413–1423. [Google Scholar] [CrossRef]
- Punys, P.; Jurevičius, L. Assessment of Hydropower Potential in Wastewater Systems and Application in a Lowland Country, Lithuania. Energies 2022, 15, 5173. [Google Scholar] [CrossRef]
- Sari, M.A.; Badruzzaman, M.; Cherchi, C.; Swindle, M.; Ajami, N.; Jacangelo, J.G. Recent innovations and trends in in-conduit hydropower technologies and their applications in water distribution systems. J. Environ. Manag. 2018, 228, 416–428. [Google Scholar] [CrossRef] [PubMed]
- Macedo, H.E.; Lehner, B.; Nicell, J.; Grill, G.; Li, J.; Limtong, A.; Shakya, R. Global distribution of wastewater treatment plants and their released effluents into rivers and streams. Earth Syst. Sci. Data Discuss. 2021. [Google Scholar] [CrossRef]
- Mikhailov, V.N. Water and sediment runoff at the Amazon River mouth. Water Resour. 2010, 37, 145–159. [Google Scholar] [CrossRef]
- Hydropower Generation. Available online: https://ourworldindata.org/grapher/hydropower-consumption?tab=table (accessed on 27 August 2023).
- International Hydropower Association. Hydropower Status Report Contents Contents; International Hydropower Association: London, UK, 2022. [Google Scholar]
- Grubert, E.A. Water consumption from hydroelectricity in the United States. Adv. Water Resour. 2016, 96, 88–94. [Google Scholar] [CrossRef]
- Da Graça Carvalho, M. EU energy and climate change strategy. Energy 2012, 40, 19–22. [Google Scholar] [CrossRef]
- International Energy Agency. Net Zero by 2050—A Roadmap for the Global Energy Sector. Available online: www.iea.org/t&c/ (accessed on 18 August 2023).
- Sibtain, M.; Li, X.; Bashir, H.; Azam, M.I. Hydropower exploitation for Pakistan’s sustainable development: A SWOT analysis considering current situation, challenges, and prospects. Energy Strategy Rev. 2021, 38, 100728. [Google Scholar] [CrossRef]
- Jawahar, C.P.; Michael, P.A. A review on turbines for micro hydro power plant. Renew. Sustain. Energy Rev. 2017, 72, 882–887. [Google Scholar] [CrossRef]
- Timilsina, A.B.; Mulligan, S.; Bajracharya, T.R. Water vortex hydropower technology: A state-of-the-art review of developmental trends. Clean Technol. Environ. Policy 2018, 20, 1737–1760. [Google Scholar] [CrossRef]
- Adhikari, R.; Wood, D. The Design of High Efficiency Crossflow Hydro Turbines: A Review and Extension. Energies 2018, 11, 267. [Google Scholar] [CrossRef]
- Elbatran, A.H.; Yaakob, O.B.; Ahmed, Y.M.; Shabara, H.M. Operation, performance and economic analysis of low head micro-hydropower turbines for rural and remote areas: A review. Renew. Sustain. Energy Rev. 2015, 43, 40–50. [Google Scholar] [CrossRef]
- Hatata, A.Y.; El-Saadawi, M.M.; Saad, S. A feasibility study of small hydro Power for selected locations in Egypt. Energy Strategy Rev. 2019, 24, 300–313. [Google Scholar] [CrossRef]
- Wu, H.N.; Chen, L.J.; Yu, M.H.; Li, W.Y.; Chen, B.F. On design and performance prediction of the horizontal-axis water turbine. Ocean Eng. 2012, 50, 23–30. [Google Scholar] [CrossRef]
- Lewis, B.J.; Cimbala, J.M.; Wouden, A.M. Major historical developments in the design of water wheels and Francis hydroturbines. IOP Conf. Ser. Earth Environ. Sci. 2014, 22, 012020. [Google Scholar] [CrossRef]
- Fu, T.; Deng, Z.D.; Duncan, J.P.; Zhou, D.; Carlson, T.J.; Johnson, G.E.; Hou, H. Assessing hydraulic conditions through Francis turbines using an autonomous sensor device. Renew. Energy 2016, 99, 1244–1252. [Google Scholar] [CrossRef]
- Tomczyk, P.; Wiatkowski, M. Shaping changes in the ecological status of watercourses within barrages with hydropower schemes—Literature review. Arch. Environ. Prot. 2020, 46, 78–94. [Google Scholar] [CrossRef]
- Loots, I.; van Dijk, M.; Barta, B.; van Vuuren, S.J.; Bhagwan, J.N. A review of low head hydropower technologies and applications in a South African context. Renew. Sustain. Energy Rev. 2015, 50, 1254–1268. [Google Scholar] [CrossRef]
- Tiwari, G.; Kumar, J.; Prasad, V.; Patel, V.K. Derivation of cavitation characteristics of a 3MW prototype Francis turbine through numerical hydrodynamic analysis. Mater. Today Proc. 2020, 26, 1439–1448. [Google Scholar] [CrossRef]
- Daneshgar, S.; Zahedi, R. Investigating the hydropower plants production and profitability using system dynamics approach. J. Energy Storage 2022, 46, 103919. [Google Scholar] [CrossRef]
- Liu, M.; Tan, L.; Cao, S. Performance prediction and geometry optimization for application of pump as turbine: A review. Front. Energy Res. 2022, 9, 818118. [Google Scholar] [CrossRef]
- Quaranta, E.; Bódis, K.; Kasiulis, E.; McNabola, A.; Pistocchi, A. Is there a residual and hidden potential for small and micro hydropower in Europe? A screening-level regional assessment. Water Resour. Manag. 2022, 36, 1745–1762. [Google Scholar] [CrossRef]
- Qian, Z.; Wang, F.; Guo, Z.; Lu, J. Performance evaluation of an axial-flow pump with adjustable guide vanes in turbine mode. Renew. Energy 2016, 99, 1146–1152. [Google Scholar] [CrossRef]
- Liu, Y.; Han, Y.; Tan, L.; Wang, Y. Blade rotation angle on energy performance and tip leakage vortex in a mixed flow pump as turbine at pump mode. Energy 2020, 206, 118084. [Google Scholar] [CrossRef]
- Kan, K.; Zhang, Q.; Xu, Z.; Zheng, Y.; Gao, Q.; Shen, L. Energy loss mechanism due to tip leakage flow of axial flow pump as turbine under various operating conditions. Energy 2022, 255, 124532. [Google Scholar] [CrossRef]
- McNabola, A.; Coughlan, P.; Corcoran, L.; Power, P.; Williams, A.P.; Harris, I.; Gallagher, J.; Styles, D. Energy recovery in the water industry using micro-hydropower: An opportunity to improve sustainability. Water Policy 2014, 16, 168–183. [Google Scholar] [CrossRef]
- Tsiakiri, E.P.; Mpougali, A.; Lemonidis, I.; Tzenos, C.A.; Kalamaras, S.D.; Kotsopoulos, T.A.; Samaras, P. Estimation of Energy Recovery Potential from Primary Residues of Four Municipal Wastewater Treatment Plants. Sustainability 2021, 13, 7198. [Google Scholar] [CrossRef]
- Singh, V.; Phuleria, H.C.; Chandel, M.K. Estimation of energy recovery potential of sewage sludge in India: Waste to watt approach. J. Clean. Prod. 2020, 276, 122538. [Google Scholar] [CrossRef]
- Sarpong, G.; Gude, V.G.; Magbanua, B.S.; Truax, D.D. Evaluation of energy recovery potential in wastewater treatment based on codigestion and combined heat and power schemes. Energy Convers. Manag. 2020, 222, 113147. [Google Scholar] [CrossRef]
- GUNT Geraetebau GmbH, HM 150.20—Operating principle of a Francis turbine. Hamburg, Germany. Available online: https://www.gunt.de/images/datasheet/567/HM-150.20-Operating-principle-of-a-Francis-turbine-gunt-567-pdf_1_en-GB.pdf (accessed on 24 September 2023).
- Lee, D.; Cho, S.; Jang, S.; Ra, Y.; Jang, Y.; Yun, Y.; Choi, D. Toward effective irregular wind energy harvesting: Self-adaptive mechanical design strategy of triboelectric-electromagnetic hybrid wind energy harvester for wireless environmental monitoring and green hydrogen production. Nano Energy 2022, 102, 107638. [Google Scholar] [CrossRef]
- Rojas, J.; Verde, C. Adaptive estimation of the hydraulic gradient for the location of multiple leaks in pipelines. Control Eng. Pract. 2020, 95, 104226. [Google Scholar] [CrossRef]
- El-Din, M.G.; Rabi, M. Fluid Power Engineering; McGraw-Hill Education: New York City, NY, USA, 2009; Available online: https://www.accessengineeringlibrary.com/content/book/9780071622462 (accessed on 18 August 2023).
- Trivedi, C.; Agnalt, E.; Dahlhaug, O.G. Experimental study of a Francis turbine under variable-speed and discharge conditions. Renew. Energy 2018, 119, 447–458. [Google Scholar] [CrossRef]
- Khan, M.A.; Badshah, S. Research Article Design and Analysis of Cross Flow Turbine for Micro Hydro Power Application using Sewerage Water. Res. J. Appl. Sci. Eng. Technol. 2014, 8, 821–828. [Google Scholar] [CrossRef]
- Kim, S.J.; Choi, Y.S.; Cho, Y.; Choi, J.W.; Kim, J.H. Effect of blade thickness on the hydraulic performance of a Francis hydro turbine model. Renew. Energy 2019, 134, 807–817. [Google Scholar] [CrossRef]
- Margeta, J.; Glasnovic, Z. Feasibility of the green energy production by hybrid solar+ hydro power system in Europe and similar climate areas. Renew. Sustain. Energy Rev. 2010, 14, 1580–1590. [Google Scholar] [CrossRef]
- Woolson, R.F. Wilcoxon signed-rank test. In Wiley Encyclopedia of Clinical Trials; Wiley: Hoboken, NJ, USA, 2007; pp. 1–3. [Google Scholar] [CrossRef]
- Breza-Boruta, B.; Paluszak, Z. Influence of Water Treatment Plant on Microbiological Composition of Air Bioaerosol. Pol. J. Environ. Stud. 2007, 16, 663–670. [Google Scholar]
- Paluszak, Z.; Ligocka, A.; Breza-Boruta, B. Effectiveness of Sewage Treatment Based on Selected Faecal Bacteria Elimination in Municipal Wastewater Treatment Plant in Toruń. Pol. J. Environ. Stud. 2003, 12, 345–349. [Google Scholar]
- Rączkowska, M. Wastewater Treatment Analysis at Wastewater Treatment Plant “Centralna” in Toruń in Years between 2012 and 2014. Master Thesis, Warsaw University of Technology, Faculty of Building Services, Hydro and Environmental Engineering, Warsaw, Poland, 2016. (In Polish). [Google Scholar]
- Igliński, B. Hydro energy in Poland: The history, current state, potential, SWOT analysis, environmental aspects. Int. J. Energy Water Resour. 2019, 3, 61–72. [Google Scholar] [CrossRef]
- Du, J.; Ge, Z.; Wu, H.; Shi, X.; Yuan, F.; Yu, W.; Wang, D.; Yang, X. Study on the effects of runner geometric parameters on the performance of micro Francis turbines used in water supply system of high-rise buildings. Energy 2022, 256, 124616. [Google Scholar] [CrossRef]
- Krzemianowski, Z.; Steller, J. High specific speed Francis turbine for small hydro purposes—Design methodology based on solving the inverse problem in fluid mechanics and the cavitation test experience. Renew. Energy 2021, 169, 1210–1228. [Google Scholar] [CrossRef]
- Sammartano, V.; Morreale, G.; Sinagra, M.; Tucciarelli, T. Numerical and experimental investigation of a cross-flow water turbine. J. Hydraul. Res. 2016, 54, 321–331. [Google Scholar] [CrossRef]
- Power, C.; McNabola, A.; Coughlan, P. Development of an evaluation method for hydropower energy recovery in wastewater treatment plants: Case studies in Ireland and the UK. Sustain. Energy Technol. Assess. 2014, 7, 166–177. [Google Scholar] [CrossRef]
- Bousquet, C.; Samora, I.; Manso, P.; Rossi, L.; Heller, P.; Schleiss, A.J. Assessment of hydropower potential in wastewater systems and application to Switzerland. Renew. Energy 2017, 113, 64–73. [Google Scholar] [CrossRef]
- Darries, G.; Ayeleso, A.; Raji, A. Exploring Hydropower Options at A Wastewater Treatment Plant-A Case Study. In Proceedings of the 30th Southern African Universities Power Engineering Conference, SAUPEC 2022, Durban, South Africa, 25–27 January 2022. [Google Scholar] [CrossRef]
- Ak, M.; Kentel, E.; Kucukali, S. A fuzzy logic tool to evaluate low-head hydropower technologies at the outlet of wastewater treatment plants. Renew. Sustain. Energy Rev. 2017, 68, 727–737. [Google Scholar] [CrossRef]
- Llácer-Iglesias, R.M.; Amparo López-Jiménez, P.; Pérez-Sánchez, M.; Álvarez-García, J.; Durán-Sánchez, A.; de La Cruz Del Río-Rama, M. Hydropower Technology for Sustainable Energy Generation in Wastewater Systems: Learning from the Experience. Water 2021, 13, 3259. [Google Scholar] [CrossRef]
- Górka, J.; Cimochowicz-Rybicka, M.; Poproch, D. Sludge Management at the Kraków-Płaszów WWTP—Case Study. Sustainability 2022, 14, 7982. [Google Scholar] [CrossRef]
- Power, C.; Coughlan, P.; McNabola, A. Microhydropower Energy Recovery at Wastewater-Treatment Plants: Turbine Selection and Optimization. J. Energy Eng. 2016, 143, 04016036. [Google Scholar] [CrossRef]
- Ottmar, E.; Pichs-Madruga, R.; Sokona, Y.; Seyboth, K.; Matschoss, P.; Kadner, S.; Zwickel, T.; Eickemeier, P.; Hansen, G.; Schloemer, S.; et al. “Hydropower” Renewable Energy Sources Climate Change Mitigation IPCC Special Report on Renewable Energy Sources Climate Change Mitigation; Ottmar, E., Pichs-Madruga, R., Sokona, Y., Seyboth, K., Matschoss, P., Kadner, S., Zwickel, T., Eickemeier, P., Hansen, G., Schloemer, S., et al., Eds.; Cambridge University Press: Cambridge, UK, 2011. [Google Scholar]
- Guzmán-Avalos, P.; Molinero-Hernández, D.; Galván-González, S.; Herrera-Sandoval, N.; Solorio-Díaz, G.; Rubio-Maya, C. Numerical design and optimization of a hydraulic micro-turbine adapted to a wastewater treatment plant. Alex. Eng. J. 2023, 62, 555–565. [Google Scholar] [CrossRef]
- Gallagher, J.; Harris, I.M.; Packwood, A.J.; McNabola, A.; Williams, A.P. A strategic assessment of micro-hydropower in the UK and Irish water industry: Identifying technical and economic constraints. Renew. Energy 2015, 81, 808–815. [Google Scholar] [CrossRef]
- Chen, S.; Chen, B. Net energy production and emissions mitigation of domestic wastewater treatment system: A comparison of different biogas–sludge use alternatives. Bioresour. Technol. 2013, 144, 296–303. [Google Scholar] [CrossRef]
- Akmirza, Z.A.; Ersahin, M.E.; Dereli, R.K.; Ozgun, H.; Ozturk, İ. Atıksu arıtma tesislerinde enerji verimliliğinin incelenmesi (Investigation of Energy Efficiency in Wastewater Treatment Plants). Süleyman Demirel Üniversitesi Fen Bilimleri Enstitüsü Dergisi 2017, 21, 380–387. (In Turkish) [Google Scholar] [CrossRef]
- Gandiglio, M.; Lanzini, A.; Soto, A.; Leone, P.; Santarelli, M. Enhancing the energy efficiency of wastewater treatment plants through co-digestion and fuel cell systems. Front. Environ. Sci. 2017, 5, 289034. [Google Scholar] [CrossRef]
- Kim, J.; Choi, H.; Kim, S.; Yu, J. Feasibility analysis of introducing renewable energy systems in environmental basic facilities: A case study in Busan, South Korea. Energy 2018, 150, 702–708. [Google Scholar] [CrossRef]
- USEPA Energy Efficiency in Water and Wastewater Facilities. A Guide to Developing and Implementing Greenhouse Gas Reduction Programs; USEPA: Washington, DC, USA, 2013.
- Venkatesh, G.; Brattebø, H. Energy consumption, costs and environmental impacts for urban water cycle services: Case study of Oslo (Norway). Energy 2011, 36, 792–800. [Google Scholar] [CrossRef]
- Sinagra, M.; Picone, C.; Picone, P.; Aricò, C.; Tucciarelli, T.; Ramos, H.M. Low-Head Hydropower for Energy Recovery in Wastewater Systems. Water 2022, 14, 1649. [Google Scholar] [CrossRef]
- Shen, Y.; Linville, J.L.; Urgun-Demirtas, M.; Mintz, M.M.; Snyder, S.W. An overview of biogas production and utilization at full-scale wastewater treatment plants (WWTPs) in the United States: Challenges and opportunities towards energy-neutral WWTPs. Renew. Sustain. Energy Rev. 2015, 50, 346–362. [Google Scholar] [CrossRef]
- Södergren, K.; Palm, J.; Gerino, M.; Harmand, J.; le Bars, M.; Huyen, N.T.; Breil, P. How Organization Models Impact the Governing of Industrial Symbiosis in Public Wastewater Management. An Explorative Study in Sweden. Water 2021, 13, 824. [Google Scholar] [CrossRef]
- Chae, K.J.; Kang, J. Estimating the energy independence of a municipal wastewater treatment plant incorporating green energy resources. Energy Convers. Manag. 2013, 75, 664–672. [Google Scholar] [CrossRef]
- Dirección General del Agua—Secretaría de Estado de Medio Ambiente—Ministerio para la Transición Ecológica y el Reto Demográfico, Plan Nacional de Depuración, Saneamiento, Eficiencia, Ahorro y Reutilización PLAN DSEAR. Madrid, Spain. 2021. Available online: https://www.boe.es/diario_boe/txt.php?id=BOE-B-2020-36826 (accessed on 27 August 2023).
- Zhou, D.; Deng, Z. Ultra-low-head hydroelectric technology: A review. Renew. Sustain. Energy Rev. 2017, 78, 23–30. [Google Scholar] [CrossRef]
- Zhou, Y.; Schideman, L.; Zheng, M.; Martin-Ryals, A.; Li, P.; Tommaso, G.; Zhang, Y. Anaerobic digestion of post-hydrothermal liquefaction wastewater for improved energy efficiency of hydrothermal bioenergy processes. Water Sci. Technol. 2015, 72, 2139–2147. [Google Scholar] [CrossRef] [PubMed]
- Borzooei, S.; Campo, G.; Cerutti, A.; Meucci, L.; Panepinto, D.; Ravina, M.; Riggio, V.; Ruffino, B.; Scibilia, G.; Zanetti, M. Optimization of the wastewater treatment plant: From energy saving to environmental impact mitigation. Sci. Total Environ. 2019, 691, 1182–1189. [Google Scholar] [CrossRef] [PubMed]
Disclaimer/Publisher’s Note: The statements, opinions and data contained in all publications are solely those of the individual author(s) and contributor(s) and not of MDPI and/or the editor(s). MDPI and/or the editor(s) disclaim responsibility for any injury to people or property resulting from any ideas, methods, instructions or products referred to in the content. |
© 2023 by the authors. Licensee MDPI, Basel, Switzerland. This article is an open access article distributed under the terms and conditions of the Creative Commons Attribution (CC BY) license (https://creativecommons.org/licenses/by/4.0/).