Abstract
Energy efficiency plays an important role in energy systems all over the world, representing the most available and cheapest source of energy. Progress in energy efficiency translates into reduced consumption, reduced dependency on external suppliers of fossil fuels, mitigation of climate change, and improvement of quality of life. Given its tremendous importance for energy systems and national economies, this paper aims to offer salient insights on the performance of the countries of the European Union (EU-27) towards an energy-efficient future, bearing in mind the quantitative milestones of sustainable development goal 7 (SDG7) of the Agenda for Sustainable Development of the United Nations. The current research offers a new perspective and delivers a comprehensive, robust, and succinct model which provides insights on the performance of EU-27 member states based on appropriate quantitative key performance indicators related to energy efficiency. The results show that about 19% of EU-27 member states are in a leading position, while about 41% of EU-27 member states have modest performance, and about 14% are still lagging. The findings of this paper may open discussions to find better ways to valorise energy efficiency, and may offer support for legislators and other stakeholders in energy systems. Moreover, by benchmarking different types of national practices, the countries which are still struggling to use energy-efficiency measures may find suitable ways to accelerate transition to a more energy-efficient future.
1. Introduction
The Agenda for Sustainable Development adopted by the United Nations (UN) in 2015 contains 17 sustainable development goals (SDGs) to be reached by 2030 [1]. Affordable and clean energy was formulated as a stand-alone goal (SDG7), but is also linked with other SDGs (SDG9, industry, innovation, and infrastructure; SDG11, sustainable cities and communities; SDG12, responsible consumption and production; SDG13, climate action, etc.).
SDG7 has four milestones which are synergically linked, which have not yet been accomplished, although there are only eight years to the target year:
- 7.1: “universal access to affordable, reliable and modern energy services” [1]. Unfortunately, 733 million people still have no access to electrical energy and 2.4 billion have no access to clean cooking areas [2], and there are few chances to achieve this goal by 2030.
- 7.2: “increase substantially the share of renewable energy in the global energy mix” [1]. The pace of renewable energy should increase in total final energy consumption if this goal is to be correlated with energy emissions belonging to SDG13, which, presently, seems out of reach.
- 7.3: “double the global rate of improvement in energy efficiency” [1] in comparison with the period 1990–2010. The primary energy intensity should increase in the remaining years till 2030, with 3.2% per year, and this is still far from the actual 1.9% achieved [2].
- 7.A: “enhance international cooperation to facilitate access to clean energy research and technology”, and 7.B: “expand infrastructure and upgrade technology for supplying modern and sustainable energy services for all in developing countries” [1,2]. The achievement of these targets, even though they are qualitatively formulated, requires more investment from public and private sectors, which, instead of increasing, dropped within recent years [2].
Among the milestones above listed, only one is quantitatively formulated (goal 7.3), referring to energy efficiency and its tremendous potential, and represents the key to improve wellbeing around the world. Energy efficiency should be improved in all aspects, from production to consumption, to reduce consumption, reduce the national dependency on external suppliers of fossil fuels, mitigate climate change. and improve quality of life. In this respect, the European Union (EU) set very ambitious targets for 2030 of 36% and 39% reduction in final and primary energy consumption, respectively. This translates into final and primary energy consumption of 787 Mtoe and 1023 Mtoe, respectively, by 2030 [3]. By 2050, the EU has an ambition to be “the first climate neutral continent” [3] and to reduce emissions by 50% compared with those registered in 1990. Major energy access programs were developed to succeed in milestone 7.1, but less effort was devoted to the efficient and productive use of energy [4].
Energy efficiency was defined by EU as “the ratio of output of performance, service, goods or energy, to input of energy” [5]. Energy efficiency represents the cheapest energy source, and most available one, for all countries around the globe, being considered “the most cost-effective means to supply energy in a sustainable manner” [6]. Many studies discussed the benefits of energy efficiency and its long-term advantages [7,8], but with no major results.
Energy efficiency was the subject of a specific EU directive adopted in 2012, which acknowledged that improvement in this area should be at least 20% by 2020 [5]. In 2018, this target was revised to at least 32.5% improvement, but the target year was changed to 2030. Moreover, the European Green Deal, with its ambitious goal to reduce greenhouse gases emissions by 55% by 2050 [3], led to further revision of the energy efficiency directive in 2021 [9]. Although the energy efficiency target of 20% by 2020 was achieved at the EU level in 2020 due to circumstances of COVID-19, there is a major gap between the national contributions communicated by the member states and the ambition of 32.5% by 2030 [9,10].
While energy savings are considered to be the greatest opportunity, there are major challenges, especially in energy losses in energy transformation, heating and cooling, the transport sector, buildings, and, lately, the information and communication sector (ITC) [11,12].
At the global level, a plethora of policies have been thought of for energy efficiency, and more than 2800 national policies are already in force in different countries, with 1383 in European countries issued within the period 1951–2022 [13]. The story of energy efficiency policies in Europe started with the electricity tax in Norway in 1951, while the most recent is the France 2030 Investment Plan issued by France in 2022 [13]. For Europe, the EU created an energy dashboard [14], but energy efficiency is judged only in terms of consumption of energy, without considering the innovation aspect (the possibility of creating opportunities through R&D and patents related to energy efficiency). Moreover, the EU created a tool to monitor a portion of energy-efficiency measurements—energy savings [15]—but developed no common methodology for the evaluation and measurement of these savings. A devoted family of standards for energy management was created by the ISO organization through its ISO 50001 [16], but is not yet widely used.
Energy efficiency requires technological solutions, but also better management and motivation of consumers [17]. Powerful ways to lower energy usage, such as higher efficiency engines, increased heat recovery, better process design, and new breakthrough technology, are a necessity, but not a sufficient solution on their own. This sufficiency can be acquired by also taking into consideration the behaviour of businesses, individual consumers, and the state. For corporations, the journey to zero-economy and energy transition brings additional pressure concerning their competitiveness. Despite the high potential of energy-efficiency measures, an energy paradox has been shown by many researchers [18,19], pointing that there is a large gap between theoretical cost-effective energy-efficient measures and actually implemented measures. The barriers to energy efficiency, which are undermining the energy-efficiency goals and measures, vary from economic (cost of production disruption, lack of time, and lack of capital), to institutional (lack of regulations and limitations of infrastructure), to behavioural (lack of culture of savings, inertia, and mistrust) [20,21]. The barriers to energy efficiency must be broken down by a transformative change, and this has, as its core, the revision of how performance, or progress, is measured.
Despite the pledges on sustainable transformation of economies, the focus is still on gross domestic product, and ever-increasing production and consumption fails to consider the improvements in efficient resources use. Furthermore, the extreme events correlated with climate change, pandemics, and military conflicts will determine a surge in the use of fossil fuels, especially of coal, gas (in gaseous and liquid form), and nuclear fuel [22,23,24,25,26,27]. Moreover, in energy efficiency and climate-friendly investments, better decision-support tools are a necessity, and they must be based on transparent metrics and ranking [28].
The Internet of Thing concept (IoT) refers, in brief, to the things which are connected to automatically communicate, the aim being to provide services for human benefit [29]. The IoT concept has recently been connected with energy-related problems to monitor energy consumption and prevent energy losses [30]. Digitalization offers new possibilities to enhance energy efficiency, and the IoT provides the opportunity to decrease energy consumption. The devices used to monitor energy consumption (examples include sensors for temperature, electricity, solar incidence, and humidity) helped to achieve an important reduction in energy consumption [31], and therefore must be considered when an analysis regarding energy efficiency is performed.
The aim of this research is to offer important insights on the assessment of the performance of EU-27 member states on their road towards an energy-efficient future by the creation and application of a decision-support tool based on a multidimensional and comprehensive framework. To this end, the most appropriate and available key performance indicators (KPIs) were selected and applied through a step-by-step methodology to create a metric and assess a ranking of performance within EU-27 member states. The assessment of energy efficiency performance calls for the identification and subsequent implementation of KPIs that help evaluate progress towards an energy-efficient future. Despite the relevance of the topic of energy efficiency, knowledge about the benefits of fully quantitative terms is scattered [32], and none is included the IoT, to the best knowledge of the author. Furthermore, several initiatives developed very overcrowded and complex models, or had a focus set on a qualitative scoring [33,34,35], which is difficult to apply and interpret, and several authors limited their analysis to specific industries [36].
This research aims to bridge the identified gaps through the proposal of an original, easy to understand and apply, yet comprehensible and multidimensional framework which offers a quintessence of energy efficiency. This framework is to be used for the assessment of the performance of the EU member states on the road towards an energy-efficient future. The contributions of this research are:
- Identification of suitable and available quantitative KPIs relevant to energy efficiency, the focus being the quantitative representation of the milestones of SDG7.
- Building of a comprehensive model which implies a robust, yet succinct, framework based on quantification (normalization, weighting depending on the conferred importance, and design of clusters on a balanced score).
- Applying the model to the EU-27 to identify the status of each member state on the road towards an energy-efficient future (ranked from best to worst).
2. Methodological Steps
One of the most powerful key measures aimed to transform the energy system into a more sustainable one is energy efficiency. This research aims to identify the proper ways of transforming the energy systems within the EU-27 into more efficient ones, by considering the actual quantitative outcomes of each member state.
The methodology has as its core the quantitative representation of the milestones of SDG7, and is based on an original design developed by the author. It aims to monitor consumption, with a focus on primary consumption and the use of the IoT by enterprises, to target effectiveness, with regards to energy intensity and the share of renewable energy sources (RES) used in final consumption, and to consider opportunities through access to technology by investment in research and development (R&D) and patents related to energy. In this way, the identification of the main gaps in progress towards an energy-efficient future moves beyond the required energy resources to effectiveness and opportunities, to reflect the needed effort.
This research develops an original framework developed on three factors, the Consumption-Effectiveness-Opportunities (CEO) framework (see Figure 1). The framework considers three factors, each with three KPIs, specifically designed to capture the quintessence of energy efficiency (matrix 3 × 2). Each factor carries specific key performance indicators (KPI), equally balanced to reflect the importance of each factor (see Table 1). The data were collected from internationally reliable centralized sources such as Eurostat and SETIS.
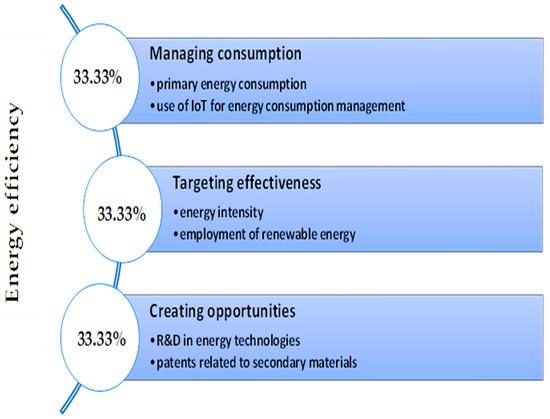
Figure 1.
Consumption-Effectiveness-Opportunities (CEO) framework.

Table 1.
Factors and KPIs for CEO framework.
The three factors were considered equally important, as the best results will be obtained by synergically considering managing consumption, targeting effectiveness, and creating opportunities. The three factors, regardless of the number of KPIs considered, must consider the reconciliation of the needs of society in terms of energy consumption with sustainable economic growth. In this way, the current model moves away from the dominant global economic paradigm and does not subordinate energy efficiency to economic growth at all costs. Moreover, the original operational framework has in view that simplicity is a virtue in science [37,38,39], and considers comprehensive KPIs to accurately render the energy-efficiency quintessence, based on safe and rational consumption.
The CEO model consists of identification of a CEO composite index (ICEO) to be further used to identify the best and worst performances on the road towards an energy-efficient future. The ICEO brings together a mix of determinants which are mathematically linked to result in one single number which reflects the quintessence of energy efficiency. The ICEO allows the identification of differences across the EU-27 space, and facilitates the identification of further interventions.
The CEO model implies five phases, and the logical scheme is presented in Figure 2:
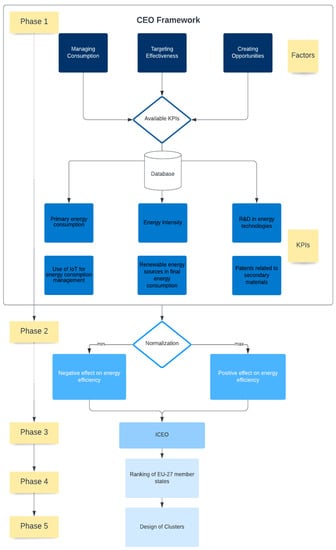
Figure 2.
Logical scheme of the phases of research. Source: author’s own representation using Lucidchart.
Phase 1. Design of the framework of the model. Selection of suitable and available indicators for each factor (matrix 3 × 2). Last available year for all countries and factors was employed, and the research does not include the effects of COVID-19.
Phase 2. Normalization of the KPIs, given the fact that they use different units. The population of each country was considered, to make possible comparisons among large and small countries [40]. The data were normalized by their transposition into dimensionless units to make them comparable [41] according to their effect on energy efficiency:
where i = KPIs (6), j = number of countries (27), Nij = normalized value for factor for country j, and KPI i (0 ≤ N ≤ 1).
Phase 3. Calculation of the CEO composite index (ICEO) which gives equal weigh to factors:
Phase 4. Application of the model to EU-27 member states and organization of states from best to worst in terms of energy efficiency.
Phase 5. Design of four clusters, depending on the distance to the energy efficiency target, in increments of 0.1.
Cluster I: ICEO > 0.5
Cluster II: 0.4 < ICEO < 0.5
Cluster III: 0.3 < ICEO < 0.4
Cluster IV: ICEO < 0.3.
3. Results
The evolution of the EU-27 in terms of key energy efficiency indicators was evaluated within the interval of 2000–2020, and the results are shown in Table 2. Primary energy consumption decreased over the 2000–2020 interval by more than 15%, while final energy consumption decreased by 11%. In terms of energy intensity, the EU-27 acquired a total decrease of 52% within the 2000–2020 interval. A major contribution of the decrease in consumption might be attributed to the effects of COVID-19, as the values of energy consumption decreased sharply, by about 8%, from 2019 to 2020. Therefore, the data for the CEO model only included data up to 2019, to exclude the effects of COVID-19, which put forward an important disturbance of markets.
Table 2.
Evolution of energy-efficiency indicators within the EU-27.
The convergence analysis was also investigated for the EU-27, within the interval of 2000–2020. Statistical tools were employed to analyse the data sets: mean, standard deviation, and the variation coefficient, which indicates the size of standard deviation relative to the mean. The values of the variation coefficient indicate that convergence towards the mean was higher.
The phases presented in Figure 2 were applied, and the results are shown in Table 3, Table 4 and Table 5. Table 3 contains data about the KPIs, with values retrieved from [42,44,45,46,47,48,49]. The statistical tools employed showed that the average lies far from the mean in the case of I3 and I5, whereas the dispersion is higher around the mean for I4 and I6.
Table 3.
KPIs of the factors of the CEO model.
Table 4.
Normalized values of the KPI of each factor of CEO model.
Table 5.
ICEO, ranking and clusters of countries.
For I1, the best performer was Romania, with 1.66 toe/capita of primary energy consumption, while the worst performer was Luxemburg, with 7.26 toe/capita of primary energy consumption. Luxemburg consumed more than four times the energy consumed by Romania (toe = tons of oil equivalent = 41.868 MJ).
For I2, the best performer was Slovenia, with 19% of its small, medium sized, and large manufacturing enterprises using the IoT for monitoring energy consumption, while the worst performer was Bulgaria, with only 2%. Slovenia was more than nine times more involved in the IoT in manufacturing enterprises than Bulgaria.
This indicator was considered in relation to the value added from manufacturing for EU-27 countries [49,50]. Slovenia had a value added by manufacturing of 5.38 mil USD/capita, and 19% of its manufacturing enterprises used the IoT. Bulgaria had a value added by manufacturing of 2.64 mil USD/capita, but only 2% of its manufacturing enterprises used the IoT. Within the EU-27, Ireland had the largest value added by manufacturing, 26.05 mil USD/capita, but the IoT was implemented in only 7% of its manufacturing enterprises.
For I3, the best performer was Ireland, with an energy intensity of about 52 Kgoe/1000 EUR-PPS, while the worst was Malta, with an energy intensity of about 195 Kgoe/1000 EUR-PPS. Ireland was about four times less energy intensive than Malta (Kgoe/1000 EUR PPS = kilograms of oil equivalent per thousand euros in purchasing power standards).
For I4, the best performer was Denmark, with about 24 Mil EUR/100,000 inhabitants devoted to R&D, while the worst was Greece, with only 0.01 Mil EUR/100,000 inhabitants. Denmark invested 2400 times more than Greece in R&D.
For I5, the best performer was Sweden, with about 56% of its energy mix coming from RES, while the worst was Luxemburg, with only about 7%. Sweden had eight times more RES in its energy mix than Luxemburg.
For I6, the best performer was Finland, with approximately three patents/1000,000 inhabitants, while the worst were Bulgaria, Estonia, Greece, Croatia, Cyprus, Latvia, and Malta, with no patents.
Table 4 shows the results obtained by applying Phase 2 of this study, and shows the best and worst performers for each individual KPI.
Table 5 contains the results of the aggregation of KPIs after applying the last phases of this study, and allows the identification of three clusters.
Figure 3 contains the values of the ICEO, ranked from best to worst, and allows the identification of a variable gap between the leader and other member states, which ranges from 4% to 204%.
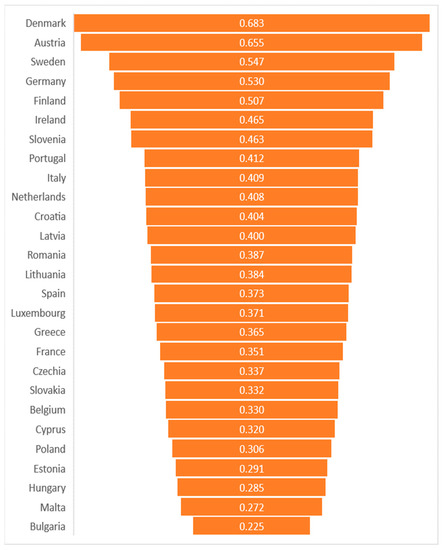
Figure 3.
ICEO for EU-27 revealing the variability of both the ICEO and the gap behind the leading country.
4. Discussion
Unfortunately, the word still heavily relies on fossil fuels, which represented about 82% of primary energy consumption in 2021 [51], with only minor changes over the last decade. In the EU, the situation is slightly better, with only 70% of primary energy consumption coming from fossil fuels [51], but is still far from sustainable consumption. This leads to decisions related to production and consumption which are unstainable. Therefore, there is an increased need to develop, contextualize, and implement new multidimensional indicators to better track performance and progress. The ICEO may offer salient insights on the energy efficiency performance of the EU-27. The assessment is based on available indicators, as several possible KPIs have limited data availability.
The three factors of the CEO framework were considered equally important, as the best results will be obtained by considering managing consumption, targeting effectiveness, and creating opportunities in synergy. The three factors, regardless of the number of KPIs considered, must consider the reconciliation of the needs of society in terms of energy consumption with sustainable economic growth. In this way, the current model moves away from the dominant global economic paradigm and does not subordinate energy efficiency to economic growth at all costs. The study was restricted to the best few available KPIs which avoided redundancy, overcrowding, and difficulty in application. The method identifies a single number (ICEO composite index) which captures the six included KPIs to synergically render an energy-efficiency ranking of each country belonging to the EU-27 space. The ICEO encapsulates the multi-dimensional concepts introduced by KPIs, different in meaning and units, allowing a ranking of EU-27 member states.
The values of the ICEO indicate that all EU-27 member states need to improve their energy systems. The average value of the ICEO was 0.400, less than half of the theoretical maximum of 1.00. Even the leading countries are far from the theoretical maximum value, except Denmark, which is the best performing country. The gap from the leader country, which is Denmark, varies from 4% (to the second country) to 204% (to the last country), showing that many countries lag behind and have an acute need for improvement.
Even if some countries are the leader for a given KPI, the overall result shows a balanced national approach is the key to an energy-efficient future. The present research identifies four clusters of countries:
Cluster I: Countries with significant performance, very actively involved on the road to an energy-efficient future (ICEO > 0.5). Five countries of the EU-27 are in this group, representing 19% of the EU-27 and being situated mostly in the northern part of EU-27: Denmark, Austria, Sweden, Germany, and Finland.
Cluster II: Countries with moderate performance (0.4 < ICEO < 0.5). Seven countries of the EU-27 are in this group, representing 25% of the EU-27: Ireland, Slovenia, Portugal, Italy, Netherlands, Croatia, and Latvia.
Cluster III: Countries with modest performance (0.3 < ICEO < 0.4). Eleven countries of the EU-27 are in this group, representing 41% of the EU-27, this cluster being the largest cluster: Romania, Lithuania, Spain, Luxembourg, Greece, France, Czechia, Slovakia, Belgium, Cyprus, and Poland.
Cluster IV: Countries with very modest performance (ICEO < 0.3). Four countries of the EU-27 are in this group, representing 14% of the EU-27: Estonia, Hungary, Malta, and Bulgaria.
From the best practice of the best performing countries, the slow performers should find suitable ways to accelerate transition to a more energy-efficient future. For instance, Denmark policy makers are declaring their country as “a laboratory for green solutions” [52], with a strong potential to share knowledge, especially in the field of wind energy and appropriate regulations. Learning from others means a faster pace of improvement, and is the best way to avoid making the same mistakes. Although the process of improvement takes time and cannot be achieved over night, it can be achieved faster. For instance, the countries belonging to Cluster IV should not wait as long as Denmark did to improve their energy system. Denmark started to take important steps towards its current status in 1970s, more than 50 years ago. This step-by-step process led to continuous growth over the last 40 years, with equal or lesser energy consumption. Every country must find the most appropriate mix of measures, but they must take into consideration the tackling of all possibilities in different degrees, appropriate to their economic structure, which range from the enhancement of energy intensity to the deployment of appropriate RES mix, and from increased investments to new regulations.
The main findings of this research are:
- In the EU-27, there are four clusters of countries, ranked based on their involvement in the transformation of their economies into more energy-efficient ones: active performers (Cluster I), moderate performers (Cluster II), modest performers (Cluster III), and slow performers (Cluster IV). Only 19% of EU-27 member states are in cluster I, showing a great need of improvement.
- Governance needs a deep reformation, as solutions must be applied systemically, at the needed pace and scale, by learning from the best practices already in effect in active performer countries.
- Energy-efficient measures must be tailored to regional and national contexts, bearing in mind best practices within countries with similar economic structure.
- Statistical monitoring related to energy savings and capital must be expanded.
- A European surveillance system of energy efficiency, which may share information and actions throughout EU-27, should be created.
- The effects of security crises on supply chains must be addressed, such as the recent invasion of Ukraine, by considering energy efficiency as a component of energy security.
- New technologies which are based on more efficient technologies, not linked to rebound effects that lead to more energy use, must be promoted.
The author acknowledges that energy efficiency may be evaluated in many ways, and that the performed analysis is subjective and not perfect. A holistic model for assessing energy efficiency, containing numerous KPIs, is difficult to consider, given the lack of availability of many data sets for all the countries of the EU-27, as well as to use, as many KPIs may overlap. The effectiveness of the proposed model rests in its straightforward application, based on a multidimensional framework which offers a quintessence of energy efficiency for all EU-27 member states, equally based on managing consumption, targeting effectiveness, and creating opportunities. The model best serves the question raised by the present study, which aims to offer important insights on the actual status of EU-27 member states on their road towards an energy-efficient future. Furthermore, the data were quantitatively expressed and retrieved from reliable international databases, without any overlap, while the methodology was based on data normalization and aggregation, and was unbiased and scientifically grounded.
The current study has limitations, most referring to the lack of available data. Moreover, this study does not apply to individual business, but judges as a whole the national systems. The proposed framework is suitable to analyse management and economic matters at aggregate level, but leaves out the complex performance tools used for businesses. This might constitute a direction for future research, as the topic needs further exploration. Energy performance tools are available for businesses, and they span from simple, based on energy monitoring, to complex, based on simulation [53]. However, these are mainly used in power generation sectors, as most of the manufacturing sector lacks data. Several real-time tools are available for businesses, such as continuous performance optimization [54] and energy management dashboards [55], but they are mainly process- or equipment-based tools. Moreover, artificial intelligence is also being considered for the self-optimization of plants, but such applications are not yet fully developed or available [53].
The conceptual foundation of the model reflects the author’s personal view and crystallises the quintessence of the energy efficiency in three factors. The operational framework is not perfect, but allows valuable opinions which are context specific. The topic of energy efficiency is very complex and remains ontologically open. There are still research gaps to be filled, and a more in-depth analysis conducted by the actual providers of energy efficiency should be ascertained, as existing publications on SDG7 energy efficiency are mainly authored by international bodies [56,57]. The recent events of 2022 might boost awareness of energy efficiency, both for corporations and individual consumers, given the higher energy prices [56], but there are still major hurdles to be overcome, as much of the recorded decrease in energy consumption comes from a negative slowing of businesses. The topic of interwinding crises and their short- and long-term effects on energy efficiency may be a direction for future research, as this topic deserves additional exploration.
5. Conclusions
The present turbulent times, in which the world is still recovering from the COVID-19 pandemic, the invasion of Ukraine is ongoing, energy prices are volatile, and inflationary pressures are menacing political stability [57], it is up to governments to tackle the energy crisis as an opportunity or as a threat.
There is a great need for the transformation of the economies of the EU-27 to achieve the targets established by Agenda 2030 in terms of SDG7, given the current constraints. The EU-27 tends to be very differentiated and complex regarding the energy-efficiency future of each member state, but very similar in challenges: shortage of supply, climate change, increased prices, and dependency on imports. By spurring the best examples and avoiding the worst practices, learnt from the leading countries, the management of the whole energy system can be improved.
The findings of this research allow the ranking of countries from best to worst in terms of energy efficiency, and, by further studying the measures taken by leading countries, the identification of the best set of practices required by each country judged against its energy endowment; this knowledge may be a great tool in acquiring the targets which seem out of reach today. Moreover, the findings of this paper may launch new discussions among stakeholders in energy systems to find better ways to valorise energy efficiency.
Funding
This research received no external funding.
Data Availability Statement
Not applicable.
Acknowledgments
I am grateful to the perceptive reviewers for their insightful comments which have transformed the manuscript into a better one.
Conflicts of Interest
The author declares no conflict of interest.
References
- United Nations (UN). Transforming Our World: The 2030 Agenda for Sustainable Development. 2015. Available online: https://documents-dds-ny.un.org/doc/UNDOC/GEN/N15/291/89/PDF/N1529189.pdf?OpenElement (accessed on 2 November 2022).
- International Energy Agency; International Renewable Energy Agency; United Nations Statistics Division; World Bank; World Health Organization. Tracking SDG 7: The Energy Progress Report; World Bank: Washington, DC, USA, 2022. [Google Scholar]
- European Commission. European Green Deal—Delivering on Our Targets; Publications Office of the European Union: Luxembourg, 2021. [Google Scholar]
- Rue du Can, S.; Letschert, V.; Agarwal, S.; Park, W.Y.; Kaggwa, U. Energy efficiency improves energy access affordability. Energy Sustain. Dev. 2022, 70, 560–568. [Google Scholar] [CrossRef]
- European Parliament and of the European Council, Directive 2012/27/EU of the European Parliament and of the European Council on Energy Efficiency, 25 October 2012. Available online: https://eur-lex.europa.eu/LexUriServ/LexUriServ.do?uri=OJ:L:2012:315:0001:0056:en:PDF (accessed on 15 November 2022).
- Islam, M.M.; Hasanuzzaman, M.D. Introduction to energy and sustainable development. In Energy for Sustainable Development; Hasanuzzaman, M.D., Rahim, N.A., Eds.; Academic Press: Cambridge, MA, USA, 2020; pp. 1–18. [Google Scholar] [CrossRef]
- Chen, K.-H.; Cheng, J.-C.; Lee, J.-M.; Li, L.-Y.; Peng, S.-Y. Energy Efficiency: Indicator, Estimation, and a New Idea. Sustainability 2020, 12, 4944. [Google Scholar] [CrossRef]
- Abu Bakar, N.N.; Hassan, M.Y.; Abdullah, H.; Rahman, H.A.; Abdullah, P.; Hussin, F.; Bandi, M. Energy efficiency index as an indicator for measuring building energy performance: A review. Renew. Sustain. Energy Rev. 2015, 44, 1–11. [Google Scholar] [CrossRef]
- European Parliament. Proposal for a Directive of the European Parliament and of the Council on Energy Efficiency, Brussels, 14.7.2021 COM(2021) 558 Final; Publications Office of the European Union: Luxembourg, 2021. [Google Scholar]
- European Commission. Sustainable Development in the European Union—Monitoring Report on Progress Towards the SDGs in an EU Context; Publications Office of the European Union: Luxembourg, 2022. [Google Scholar]
- Council of European Energy Regulators, 2nd CEER Report on Power Losses, C19-EQS-101-03, 23 March 2020. Available online: https://www.ceer.eu/documents/104400/-/-/fd4178b4-ed00-6d06-5f4b-8b87d630b060 (accessed on 23 November 2022).
- Dean, N. Gains and losses across Europe. Nat. Energy 2019, 4, 92. [Google Scholar] [CrossRef]
- International Energy Agency, Policies Database. 2022. Available online: https://www.iea.org/policies?topic[]=Energy+Efficiency (accessed on 28 November 2022).
- Eurostat, Energy Dashboard. 2022. Available online: https://ec.europa.eu/eurostat/cache/infographs/energy_dashboard/endash.html (accessed on 28 November 2022).
- Wuppertal Institute, EMEEES Project—Measuring and Reporting Energy Savings for the Energy Services Directive—How It Can Be Done. 2009. Available online: https://wupperinst.org/en/p/wi/p/s/pd/155 (accessed on 8 November 2022).
- ISO 50001; ISO Organization: Geneva, Switzerland, 2018. Available online: https://www.iso.org/iso-50001-energy-management.html (accessed on 8 November 2022).
- Rossiter, A.; Jones, B. (Eds.) Energy Management and Efficiency for the Process Industries; John Wiley & Sons, Inc.: Hoboken, NJ, USA, 2015; p. xi. [Google Scholar]
- Johansson, M.; Thollander, P. A review of barriers to and driving forces for improved energy efficiency in Swedish industry—Recommendations for successful in-house energy management. Renew. Sustain. Energy Rev. 2018, 82, 618–628. [Google Scholar] [CrossRef]
- Hasan, A.S.M.M.; Rokonuzzaman, M.; Tuhin, R.A.; Salimullah, S.M.; Ullah, M.; Sakib, T.H.; Thollander, P. Drivers and Barriers to Industrial Energy Efficiency in Textile Industries of Bangladesh. Energies 2019, 12, 1775. [Google Scholar] [CrossRef]
- Bagaini, A.; Colelli, F.; Croci, E.; Molteni, T. Assessing the relevance of barriers to energy efficiency implementation in the building and transport sectors in eight European countries. Electr. J. 2020, 33, 106820. [Google Scholar] [CrossRef]
- Cai, X.; Wang, W.; Rao, A.; Rahim, S.; Zhao, X. Regional Sustainable Development and Spatial Effects from the Perspective of Renewable Energy. Front. Environ. Sci. 2022, 10, 859523. [Google Scholar] [CrossRef]
- Economist Intelligence, Energy Outlook 2023, Surviving the Energy Crisis. 2022. Available online: https://www.eiu.com/. (accessed on 30 November 2022).
- International Energy Agency. Tracking Public Investment in Energy Technology Research—A Roadmap; IEA: Paris, France, 2021. [Google Scholar]
- European Commission. Communication from the Commission to the European Parliament, the European Council, the Council, the European Economic and Social Committee and the Committee of the Regions REPowerEU Plan; COM(2022) 230 Final; European Commission: Brussels, Belgium, 2022. [Google Scholar]
- European Commission. Communication from the Commission to the European Parliament, the Council, the European Economic and Social Committee and the Committee of the Regions EU ‘Save Energy’; COM(2022) 240 Final; European Commission: Brussels, Belgium, 2022. [Google Scholar]
- European Commission. Report from the Commission to the European Parliament, the Council, the European Economic and Social Committee and the Committee of the Regions State of the Energy Union 2022; COM(2022) 547 Final; European Commission: Brussels, Belgium, 2022. [Google Scholar]
- Holechek, J.L.; Geli, H.M.E.; Sawalhah, M.N.; Valdez, R. A Global, Assessment: Can Renewable Energy Replace Fossil Fuels by 2050? Sustainability 2022, 14, 4792. [Google Scholar] [CrossRef]
- Future Earth; The Earth League; WCRP. 10 New Insights in Climate Science 2022; WCRP: Stockholm, Sweden, 2022. [Google Scholar]
- Gil, D.; Ferrández, A.; Mora-Mora, H.; Peral, J. Internet of Things: A Review of Surveys Based on Context Aware Intelligent Services. Sensors 2016, 16, 1069. [Google Scholar] [CrossRef] [PubMed]
- Ramallo-González, A.P.; Bardaki, C.; Kotsopoulos, D.; Tomat, V.; González Vidal, A.; Fernandez Ruiz, P.J.; Skarmeta Gómez, A. Reducing Energy Consumption in the Workplace via IoT-Allowed Behavioural Change Interventions. Buildings 2022, 12, 708. [Google Scholar] [CrossRef]
- Al-Obaidi, K.M.; Hossain, M.; Alduais, N.A.M.; Al-Duais, H.S.; Omrany, H.; Ghaffarianhoseini, A. A Review of Using IoT for Energy Efficient Buildings and Cities: A Built Environment Perspective. Energies 2022, 15, 5991. [Google Scholar] [CrossRef]
- Reuter, M.; Patel, M.; Eichhammer, W.; Lapillonne, B.; Pollier, K. A comprehensive indicator set for measuring multiple benefits of energy efficiency. Energy Policy 2020, 139, 111284. Available online: https://www.sciencedirect.com/science/article/pii/S0301421520300434 (accessed on 11 January 2023). [CrossRef]
- Subramanian, S.; Bastian, H.; Hoffmeister, A.; Jennings, B.; Tolentino, C.; Vaidyanathan, S.; Nadel, S. International Energy Efficiency Scorecard; American, Council for an Energy-Efficient Economy: Washington, DC, USA, 2022; Available online: www.aceee.org/research-report/i2201 (accessed on 3 November 2022).
- Lapillonne, B. Monitoring EU Energy Efficiency First Principle and Policy Implementation—ODYSSEE MURE; Enerdata: Grenoble, France, 2020. [Google Scholar]
- Singh, H.V.; Bocca, R.; Gomez, P.; Dahlke, S.; Bazilian, M. The energy transitions index: An analytic framework for understanding the evolving global energy system. Energy Strategy Rev. 2019, 26, 100382. [Google Scholar] [CrossRef]
- Bruni, G.; De Santis, A.; Herce, C.; Leto, L.; Martini, C.; Martini, F.; Salvio, M.; Tocchetti, F.A.; Toro, C. From Energy Audit to Energy Performance Indicators (EnPI): A Methodology to Characterize Productive Sectors. The Italian Cement Industry Case Study. Energies 2021, 14, 8436. [Google Scholar] [CrossRef]
- Purvis, B.; Mao, Y.; Robinson, D. Three pillars of sustainability: In search of conceptual origins. Sustain. Sci. 2019, 14, 681–695. [Google Scholar] [CrossRef]
- Nolting, L.; Steiger, S.; Praktiknjo, A. Assessing the validity of European labels for energy efficiency of heat pumps. J. Build. Eng. 2018, 18, 476–486. [Google Scholar] [CrossRef]
- Marshall, E.; Steinberger, J.; Dupont, V.; Foxon, T. Combining energy efficiency measure approaches and occupancy patterns in building modelling in the UK residential context. Energy Build. 2016, 111, 98–108. [Google Scholar] [CrossRef]
- Momete, D.C. Measuring Renewable Energy Development in the Eastern Bloc of the European Union. Energies 2017, 10, 2120. [Google Scholar] [CrossRef]
- Momete, D.C. A unified framework for assessing the readiness of European Union economies to migrate to a circular modelling. Sci. Total Environ. 2020, 718, 137375. [Google Scholar] [CrossRef] [PubMed]
- Eurostat. Online Data Base, Primary Energy Consumption, Code [SDG_07_10], Last Update 11 of July 2022. Available online: https://ec.europa.eu/eurostat/cache/metadata/en/sdg_07_10_esmsip2.htm (accessed on 5 November 2022).
- Eurostat. Online Data Base, Final Energy Consumption [SDG_07_11] Last Update 11 of July 2022. Available online: https://ec.europa.eu/eurostat/cache/metadata/en/sdg_07_11_esmsip2.htm (accessed on 5 November 2022).
- Eurostat. Online Data Base, Energy Intensity, Code [NRG_IND_EI], Last Update 11 April 2022. Available online: https://ec.europa.eu/eurostat/cache/metadata/en/nrg_ind_ei_esmsip2.htm (accessed on 30 October 2022).
- Eurostat. Online Data Base, Internet of Things Code [ISOC_EB_IOT$DEFAULTVIEW], Last Update 17 of March 2022. Available online: https://ec.europa.eu/eurostat/cache/metadata/en/isoc_e_esms.htm (accessed on 30 October 2022).
- SETIS Research and Innovation Data. Available online: https://setis.ec.europa.eu/publications/setis-research-and-innovation-data_en (accessed on 30 October 2022).
- Eurostat. Online Data Base, Share of Renewable Energy in Gross Final Energy Consumption by Sector Code [SDG_07_40], Last Update 19 April 2022. Available online: https://ec.europa.eu/eurostat/cache/metadata/en/sdg_07_40_esmsip2.htm (accessed on 30 October 2022).
- Eurostat. Online Data Base, Patents Related to Recycling and Secondary Raw Material, Code [CEI_CIE020], Last Update 5 July 20222. Available online: https://ec.europa.eu/eurostat/cache/metadata/en/cei_cie020_esmsip2.htm (accessed on 30 October 2022).
- Eurostat. Online Data Base, Population on 1 January, Code [TPS00001], Last Update 29 October 2022. Available online: https://ec.europa.eu/eurostat/databrowser/view/tps00001/default/table (accessed on 30 October 2022).
- World Bank Online Data Base, Manufacturing, Value Added (Current US$). Available online: https://data.worldbank.org/indicator/NV.IND.MANF.CD (accessed on 22 December 2022).
- British Petroleum. BP Statistical Review of World Energy 2022; BP: London, UK, 2020; Available online: https://www.bp.com/en/global/corporate/energy-economics/statistical-review-of-world-energy.html (accessed on 2 December 2022).
- Official Website of Denmark. Available online: https://denmark.dk/ (accessed on 30 November 2022).
- Australian Government and Advisian, Energy Efficiency Tools Review, Australia. 2020. Available online: https://www.energy.gov.au/sites/default/files/Energy%20Efficiency%20Tools%20Review_1.pdf (accessed on 30 November 2022).
- Siemens, Continuous Performance Optimization. Available online: https://www.siemens-energy.com/global/en/offerings/services/digital-services/continuous-performance-optimization.html (accessed on 30 October 2022).
- Antsolutions, Energy Management Dashboard. Available online: https://antsolutions.eu/products/energy-management-system-ems/ (accessed on 30 November 2022).
- International Energy Agency. Energy Efficiency 2022; International Energy Agency: Paris, France, 2022. [Google Scholar]
- Cozzi, L.; Gould, T. (Eds.) World Energy Outlook 2022; International Energy Agency: Paris, France, 2022. [Google Scholar]
Disclaimer/Publisher’s Note: The statements, opinions and data contained in all publications are solely those of the individual author(s) and contributor(s) and not of MDPI and/or the editor(s). MDPI and/or the editor(s) disclaim responsibility for any injury to people or property resulting from any ideas, methods, instructions or products referred to in the content. |
© 2023 by the author. Licensee MDPI, Basel, Switzerland. This article is an open access article distributed under the terms and conditions of the Creative Commons Attribution (CC BY) license (https://creativecommons.org/licenses/by/4.0/).