Abstract
This paper presents the results of a calculation code approach providing a solution to the point kinetics problem for the IVG.1M research reactor of the National Nuclear Center of the Republic of Kazakhstan and allowing the simulation of dynamic processes going on during reactor start-ups, including changes in the thermal state of all its elements, reactor regulator displacement, accumulation of absorbers in the fuel, and the beryllium reflector. A mathematical description of the IVG.1M point kinetics model is presented, which provides a calculation of the reactor neutron parameters, taking into account the dependence of reactivity effects on the temperature, changes in the isotopic composition of materials, and thermal expansion of core structural elements. An array of data values was formed of reactivity added by separate elements of the core when changing their thermal state and other reactor parameters, as well as an array of data with the parameters of heat exchange of coolant-based reactor structural elements. These are used in the process of solving the point kinetics problem to directly replace formal parameters, eliminating the need to calculate the values of these parameters at each calculation step. Preliminary calculations to form an array of values of reactivity effects was applied to the reactor by separate structural elements when their temperature changes were performed using the IVG.1M precision reactor calculation model. The model was validated by the reactor parameters in the critical state. Preliminary calculations to form an array of data with the parameters of heat exchange of coolant-based reactor structural elements were performed in ANSYS Fluent software using the calculation model that describes the IVG.1M reactor fuel element in detail. Validation of the developed calculation code based on the results of two start-ups of the IVG.1M reactor was performed and its applicability for the analysis of transient and emergency modes of reactor operation and evaluation of its safe operation limits was confirmed.
1. Introduction
IVG.1M is a research water-cooled heterogeneous thermal reactor with a light-water moderator and coolant and a beryllium neutron reflector. The IVG.1M reactor was constructed as a result of IVG.1 reactor modification, the main purpose of which was the replacement of gas-cooled technological channels for water-cooled ones and the creation of technological systems of water used in IVG.1M as a coolant [1]. The nominal power of the reactor is 6 MW (maximum up to 10 MW). The IVG.1M reactor is cooled with limited volume of water circulating in a closed loop, whereas the water from the storage tank enters the core cooling and then returns to this tank. The initial coolant temperature corresponds to the ambient temperature. Conventionally, it can be in the range from 10 °C to 50 °C. The outlet water temperature under normal conditions does not exceed 95 °C. The average temperature in the water container must not exceed 55 °C. U-Zr alloy is used as a fuel with an enrichment of 90% by 235U. Figure 1 shows the IVG.1M reactor core which consists of 30 water-cooled fuel channels located in three rows on concentric circles of different radii: 156 mm (I row), 163.5 mm (II row), and 239 mm (III row). There are 468 twisted-type fuel elements in each fuel channel. The reactor is controlled by a group of 10 rotating control drums (CD) located around the fuel channels in the beryllium reflector. The rotation of the control drums is carried out counterclockwise with a maximum angle of rotation of 180°. The turn of the control drums is counted in “steps” using a stepper motor, where one step is 0.3°. In addition, there are reactivity compensation rods (RCR) in the central beryllium displacer. The core diameter is 535 mm and its height is 800 mm. The IVG.1M reactor is used for materials irradiation by neutrons and photons in various research programs, with the experiments being performed mainly in dynamic power change modes. In this regard, it is highly preferable to have a tool for calculation modeling of the reactor dynamics, which provides an opportunity to select and substantiate the modes of its operation in the range of safe values of operational parameters, as well as a possible assessment of the reactor parameters during the accident processes’ progression.
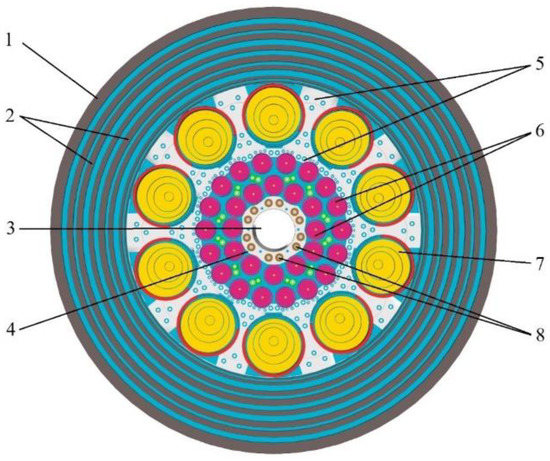
Figure 1.
Scheme of the cross-section of the IVG.1M reactor. (1) Vessel; (2) Side shields; (3) Loop channel; (4) Central displacer; (5) Reflector; (6) Fuel channels; (7) Control drum; (8) Reactivity compensation rods.
There are many programs designed to perform modeling of nuclear reactor dynamics, for example the RADAR, TRIGEX, COREMELT [2], and COSINE code package [3,4]. However, large-scale modeling [5] is still not widespread because of the complexity of modeling all of the physical processes occurring and the need to maintain substantial calculation capabilities. One possible solution to these problems is to optimize the calculation processes by improving the computational algorithm.
When developing the IVG.1M reactor point kinetics model, two resource-intensive fragments were identified in the calculation algorithm, for which it was decided to reject calculations of particular values of outlet parameters at each step of algorithm implementation, replacing these calculations with procedures of the main solver to access previously prepared arrays of these parameters’ values. In our case, we are considering an array of data on the reactivity values added by separate reactor core elements when their thermal state and other reactor parameters change, as well as an array of data with the heat-exchange parameters of the coolant-based reactor structure elements.
The array of reactivity responses to temperature changes in various core elements, to the reactor regulator displacement, and to the accumulation of absorbers in the fuel and in the beryllium reflector, was formed as a result of massive neutron-physical calculations performed using the computational reactor model [6] in the program MCNP6.1 [7] with ENDF/B-VII.0 libraries of evaluated nuclear data [8].
The available capabilities of hydrodynamics modeling in ANSYS Fluent calculation code [9] were used to form an array of parameters that characterize the heat exchange of the coolant-based reactor structure elements under various initial and boundary conditions of calculation.
The validation results of the calculation code of the point kinetics model, created by the implementation of this approach, confirmed the eligibility of its application to solve multi-physics tasks of dynamic processes modeling in the reactor, taking into account changes in the thermal state of all its elements, the movement of reactor control bodies, and the accumulation of absorbers in the fuel and the beryllium reflector (such as 3He and 6Li).
The analogue of the developed IVG.1M reactor kinetics model can be considered a model developed for analyzing the dynamics of nuclear rocket engine reactors [10]. A distinctive feature of the IVG.1M reactor kinetics model compared to its analogue is its main purpose—obtaining data on reactor power changes under conditions of constantly changing reactivity in the process of accident progression. At the same time, modeling of transient processes is provided by calculation tools combined within a single code, whereas the approach with modeling of various emergency events in nuclear reactors using a combination of different codes can be considered traditional [11].
Validation of the developed calculation code was performed on the parameters of transient processes of the IVG.1M reactor with relatively slow power generation rates, which is caused by restrictions on the value of the power doubling period that cannot be less than 20 s based on safety considerations. Nevertheless, there is clear evidence that the description of dynamic processes in impulse nuclear reactors using similar models is correct. Examples include studies of the IGR reactor [12], the Griffin computer application for modeling and simulation of TREAT reactor transients [13], and the use of this application for multi-physics simulations of nuclear thermal propulsion for interplanetary missions (NTP—Nuclear Thermal Propulsion for interplanetary missions) [14].
2. Description of Reactor Kinetics Model
To simulate the kinetics of the IVG.1M reactor, it is necessary to consider the release of thermal energy in the elements of the core, the movement of the coolant in the reactor, and the transfer of heat by the coolant. The coolant enters the reactor through two main channels from the bottom. Part of the water enters the side reflector, passes through it, cooling the beryllium elements and control drums, then enters under the reactor lid. Another part of the water enters the space between the channels with fuel assemblies (FA), cools the beryllium parts of the core, and enters under the reactor lid. Part of the heat enters the inter-channel space through the walls of the channels from hotter FAs. It is also important to take into account that in these places, water and beryllium parts are heated when neutrons are slowed down and gamma rays are absorbed. In the upper part of the channels under the reactor lid, there are holes for supplying water to cool the FAs. Water flows through the FA from top to bottom and then water is removed from the reactor.
The calculation model of the IVG.1M reactor is represented by several groups of elements containing the main characteristics on which the reactivity depends (Table 1). The first group of elements is the materials that are part of the core. A change in the temperature or density of these elements causes a change in the breeding properties of the reactor and predetermines the value of the reactivity temperature and vapor effects. The elements have either zero or one-dimensional sizes. Point elements average the parameters of the described materials over the entire volume of the core. One-dimensional elements average the parameters of the described materials only over the cross-section of the core at a certain height and therefore have a distribution of some parameters over the height. The second group of elements are reactor regulators. As mentioned before, the IVG.1M reactor has two types of regulators: reactivity compensation rods (RCR) and control drums (CD). RCR are not used in reactor control, which is why they will not be described in the kinetics model.

Table 1.
Elements used for point kinetics calculations.
The third group of elements is fission products, which have a great influence on reactivity. These include iodine I135 and xenon Xe135.
For solving the point kinetics equation, it is, therefore, necessary to have data on the change in reactivity associated with changes in the element temperature, position of regulators, and Xe135 concentrations. To obtain these reaction rates, well-known methods are used [15,16,17].
For modeling the kinetics of the IVG.1M reactor, the point kinetics equation with six groups of delayed neutrons is solved:
where:
is the intensity of neutron source radiation;
is the reactivity;
is the neutron density;
is the density of nuclei-precursors;
is the neutron lifetime;
is the time;
is the delayed neutron fraction;
is the decay constant of precursor nuclei.
The reactivity input with CD is modeled according to the real law of CD motion and taking into account the calculated value of the temperature effect of reactivity:
The change in reactivity within a time interval dt is described by the expression:
where:
is the differential characteristic of CD efficiency depending on its turning angle;
is the angular speed of CD rotation.
The change in reactivity when the temperature changes is the sum of such particular temperature effects associated with changes in the temperature of separate elements of the core:
where:
is the temperature coefficient of —element reactivity;
is the rate of temperature change that depends on the reactor power and the heat transfer conditions at a given time.
The reactivity change due to reactor poisoning effect can be estimated by formula:
where is the reactor power;
The is a scalar value which is used to add change in the reactivity due to influence of postulated event on the reactivity. By default it is equal to 0.
The reactor power is proportional to the thermal neutron density:
where is the coefficient used to convert neutron density to the reactor power.
The methodology of solving the problem of heat energy transfer from element to element will be shown in the example of solving the problem of heat energy transfer from the fuel element to water.
The FA element cell of the IVG.1M reactor is represented as two one-dimensional elements that model a single fuel element and its surrounding water. The elements can exchange energy at the interaction boundary, which is formed from the points of the elements that are at an equal height. The law of heat exchange at the interaction boundary is described by the following parameters: (1) —fuel element temperature in the interaction region; (2) —water temperature in the interaction region; (3) —interaction area; (4) —heat transfer coefficient, which depends on element temperature at heat exchange boundary.
Figure 2 shows the elementary layer in the path of which the water is heated into a value . The middle area represents a twisted type fuel element. Different regions’ colors are used to show the coolant temperature levels (blue = cold water, green = slightly heated water, yellow = heated water). The power release at the elementary fuel element, heat exchange with neighboring sections of the fuel element, heated to a greater or lesser degree, and heat transfer to the coolant by means of heat transfer are carried out through the area:
where is the coefficient correlating the interaction surface area with the length of the corresponding section.
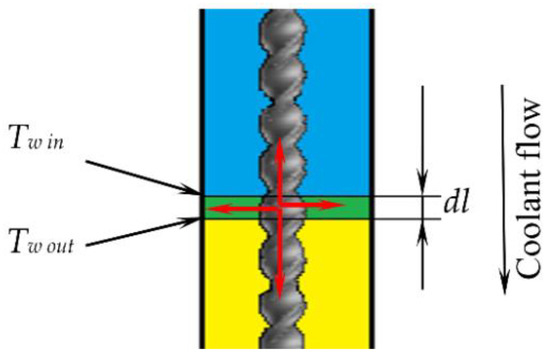
Figure 2.
Scheme of Heat Transfer (blue = cold water, green = slightly heated water, yellow = heated water).
The heating of water in the section dl is described by the heat balance equation, whereby the following ratio is correct:
where:
is the coolant mass flow rate through the cell;
is the heat capacity of the coolant;
is the heat transfer coefficient;
is the water temperature at the inlet to the layer ;
is the water temperature at the outlet of the layer .
Accepting that all the coefficients of Equation (8) keep their values on the section , we obtain:
where is the average velocity of the coolant.
The fuel element heating is described by the heat balance equation. The power, allocated at the “i” section of the fuel element, is spent to maintain the heat flow from the fuel element to the coolant and to heat the fuel element section itself, taking into account the heat exchange with neighboring sections.
where:
is the length-dependent power density at the “i” section of the fuel element;
is the time interval;
is the fuel rod cross-sectional area;
is the heat capacity of the fuel element material;
is the fuel element material density;
is the thermal conductivity of the fuel element material;
is the fuel element temperature at section.
Assuming that all the constituent coefficients of the equation keep their values on the section , we can find the change in the fuel element temperature for a certain period of time:
To implement the software solution of the problem, it is necessary to bring Formulas (9) and (11) into finite-difference form:
Equations (12) and (13) are used to solve the heat transfer problem in the IVG.1M reactor kinetics model and to obtain data on the temperature distribution in the fuel element and over the coolant in FA.
Heat transfer at the boundaries of other core elements and water is similarly described.
3. Calculation of Power Distribution upon the Core Volume
The MCNP model of the IVG.1M reactor core [6] describes its geometrical configuration and material composition in detail. Figure 3 shows the core computational model cross-sections.
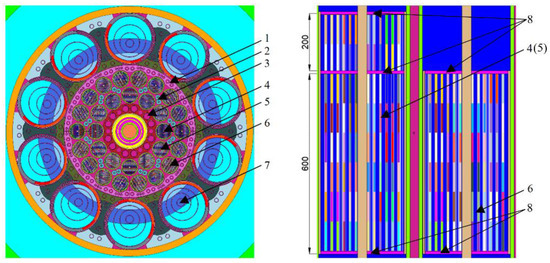
Figure 3.
Horizontal (left) and vertical (right) cross-sections of the IVG.1M reactor computational model. (1) Lateral beryllium displacers; (2) Intra-channel beryllium displacers; (3) Reactivity compensation rods; (4) Fuel channels of the first row (600 + 200 mm); (5) Fuel channels of the second row (600 + 200 mm); (6) Fuel channels of the third row (600 mm); (7) Control drums; (8) End grates.
Using the MCNP6.1 program, the distribution of prompt and delayed reactor power was calculated. Two types of calculations were carried out; in the first, the prompt energy release in the core elements was calculated, and in the second, the total energy release with its delayed component was taken into account. To obtain the results of the energy release distribution along the height of the fuel rod, it was split with a step of 1 mm. The following conditions are set for the calculation: number of neutrons per cycle—2 × 10⁶; number of inactive cycles—10; and total number of cycles—1000. The distribution of the delayed component of energy release was determined from the difference in these values. The total energy released per born neutron in the reactor model is 78.7 MeV. The total prompt energy is 74.7 MeV.
The power distribution is calculated for all core elements—fuel elements, beryllium elements, coolant, and others. For example, Figure 4 shows the calculated dependences of the linear power of fuel elements in I, II, and III rows of FA. The results were obtained with an error of no more than 1%. The discontinuity in the blue line in the Figure 4 refers to the end grate, which is located in this place and separates the upper part of the fuel assembly from the lower one (see Figure 4). The increase in specific power at the ends of the fuel rods is associated with the action of the reflector.
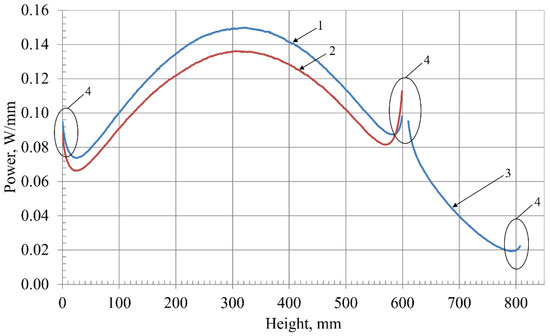
Figure 4.
Distribution of average power by fuel elements layers in 1 mm increment at a reactor power rating of 1 MW. (1) Lower part of the I and II row fuel assemblies; (2) Fuel assembly of the III row; (3) Upper part of the I and II row fuel assemblies; (4) Specific power increase at the ends of fuel elements caused by the presence of the reflector and water.
To create diagrams of the time dependence of energy release, we assume that the delayed power is released after the decay of delayed power sources, which are formed during the fission of uranium nuclei or during the absorption of neutrons by other elements. The reactor power is the sum of the prompt power released in nuclear fission reactions and the power released in the decay of fission fragments. The final balance equation for the power released and the sources of delayed power is as follows.
where is the total power; is the prompt power; are the decay constants of the j-group; is the share of delayed energy release groups; is the potential power released in the decay of fission fragments; is time, 0.0483 is the fraction of the delayed energy release from the total energy release in the reactor.
Delayed power sources are divided into three groups, each characterized by the power output fraction and the decay constant (Table 2):

Table 2.
Sources of delayed power.
To test the system of Equation (14), we can use Wei–Wigner formula [18,19], which describes the reduction in power when the reactor is shut down after operating at a stationary level:
where:
is the reactor power before shutdown;
is the reactor residual heat release capacity;
is the reactor operating time before shutdown;
is the time after reactor shutdown.
The system of Equation (14) has been tested in the range of powers from 1 to 9 MW, in the range of values up to 600 s, and in the range of values up to 500 s. Figure 5 shows a graph of the change in residual energy release power for an initial power of 9 MW, for which the reactor was operated for 300 s. The blue line shows the change in residual energy release power calculated using Formula (15). The orange line shows the change in residual energy release power calculated using the system of Equation (6).
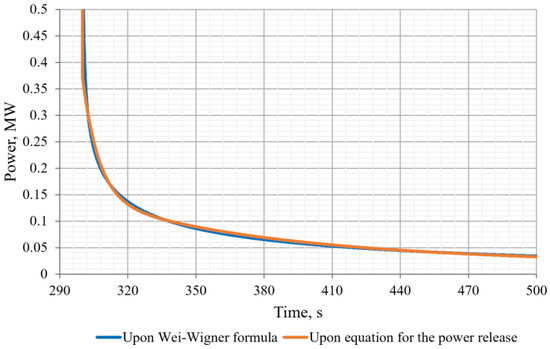
Figure 5.
Diagram of Reactor Power Decrease after Shutdown.
4. Calculation of Reactivity Effects
4.1. Determination of Regulating Characteristics of the Drums System
To detect the efficiency of a single control drum, neutron-physical calculations were performed with the turning of CD system in the range from 0° to 180°. The results are fitted by a polynomial and are shown in Figure 6.
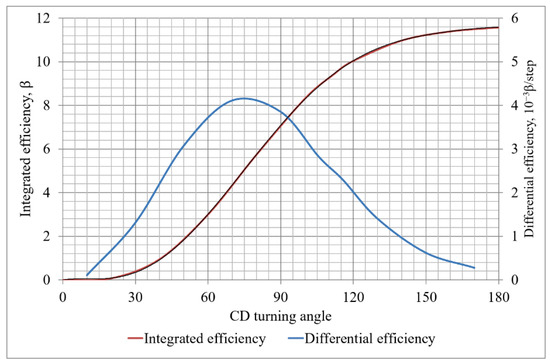
Figure 6.
Regulating Characteristics of CD System.
4.2. Temperature Reactivity Effect
The temperature reactivity effect in the IVG.1M reactor is the total reactivity effect of changes in the temperature and density of separate details of the core. This paper additionally adopts the concept of the net temperature reactivity effect and net density reactivity effect. The net reactivity temperature effect is a calculation characteristic that does not take into account the change in water density during heating. Correspondingly, the net density reactivity effect is a calculated characteristic that takes into account the change in reactivity when the density of water changes.
During the calculations, the parameters of variables were the temperature and density of water, beryllium, and fuel. As a result of the calculations, the values of the effective neutron multiplication factor (), reactivity (), and reactivity temperature coefficient () for water and beryllium were determined.
The reactivity is defined by the Formula (16):
where:
is the neutron multiplication factor;
is the effective delayed neutron fraction.
The temperature coefficient of reactivity α is calculated as:
where:
is the average temperature of element, K
is the reactivity, .
The results of the calculations of the multiplication factor and reactivity values depending on water parameters in the inter-channel space, in FA, in the loop channel, and in beryllium are presented in Table 3. These values are derived from the MCNP simulations.

Table 3.
Calculated values of water reactivity effects for FA.
To determine the change in reactivity when water within the core heats up, the water in the inter-channel space was divided by height and by belonging to the central assembly or the reflector. To assess the effect of an individual water layer in the fuel assembly on reactivity, a layer-by-layer description of the IVG.1M reactivity effect was applied.
All height elements, including beryllium elements, were divided into five layers. Calculations were made for three temperature ranges. In addition, calculations of the effect of coolant evaporation in FA were made. The obtained results were fitted by polynomials. Thus, when calculating the effects of reactivity in the kinetics model, it is possible to differentiate by height the inverse relationship between temperature and reactivity.
The temperature reactivity effects depending on the position of coolant layers in FA are described by the following correlations:
where a is the coefficients of the equations obtained by analyzing the results of neutron-physical calculations made for different coolant temperatures.
Figure 7 shows the reactivity effect caused by the heating of the coolant. The blue line shows the calculated value of the total reactivity effect when all the water in the core is heated equally. The green line shows the calculated value of the sum of individual reactivity effects of water heating in FA, inter-channel space, and in the loop channel. It can be seen that the reactivity effect calculated as the sum of individual reactivity effects does not coincide with the reactivity effect calculated for an evenly heated core. Therefore, a coefficient was introduced to take into account the deviation in summing the reactivity effects from core element heating, which is equal to +0.00209 βeff per 1 K.
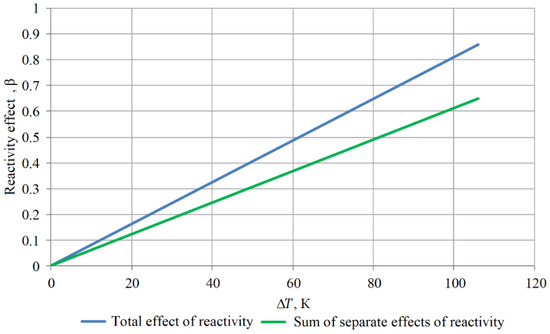
Figure 7.
Dependence of Water Temperature Change from Reactivity Effect.
4.3. Influence of Core Structural Elements Expansion on Reactivity
Expansion of beryllium blocks and fuel elements caused by temperature changes results in the displacement of some mass of water from the core. The consequence of this will be a change in reactor reactivity.
Because of the smallness of the expansion coefficients (for beryllium and fuel are equal to 1.15 × 10⁻⁵ K−1 and 5.6 × 10⁻⁶ K−1, respectively), it is practically impossible to estimate this effect in a direct way. Since the amount of water also changes when its density changes, this effect was estimated using data on the reactivity effect when the density of water changes.
As a result, the temperature reactivity effect caused by the expansion of beryllium in the core, calculated from the change in the amount of water due to the expansion of beryllium blocks in the core, is equal to +5.886 × 10⁻⁴ β/K.
The reactivity effect from a 1% decrease in the mass of water in FA is −0.09937 β. The cross-sectional area of fuel elements in FA is 0.0558 m2, and that of the coolant is 0.0433 m2. When fuel elements are heated, their area will increase by 6.25 × 10⁻⁷ m2, with 0.00144% of water displaced. Thus, the reactivity effect from the expansion of fuel elements in the core is −1.4 × 10⁻⁴ β/K.
5. Thermal–Hydraulic Calculations
Calculation of Heat Transfer Coefficient from Fuel Element to Water and Steam
A calculation model of the twisted type fuel element (Figure 8) with a fuel kernel, fuel element cladding, and coolant is created.
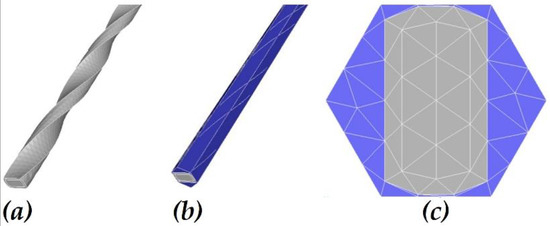
Figure 8.
Calculation Model of Fuel Element Cell of IVG.1M Reactor. (a) Fuel element with cladding; (b) Fuel element with cladding and coolant; (c) Cross-section view.
When solving the problem, it is accepted that the heat transfer depends only on the temperature of the fuel and coolant. Since the coolant flow rate usually does not change during startup, the dependence of heat transfer parameters on the flow rate is not taken into account. In order to determine the heat transfer coefficient in the studied range of fuel and coolant temperature, thermal–hydraulic calculations have been performed for different stationary power levels of the IVG.1M reactor, from 1 MW to 100 MW, using the entire temperature field dataset over the model volume. To calculate the heat transfer coefficient, the temperature values were averaged for a narrow layer and resulted in the average temperature of some narrow layer of fuel element and coolant. Below are the results of the heat transfer coefficient calculation depending on water and steam temperatures (Figure 9 and Figure 10).
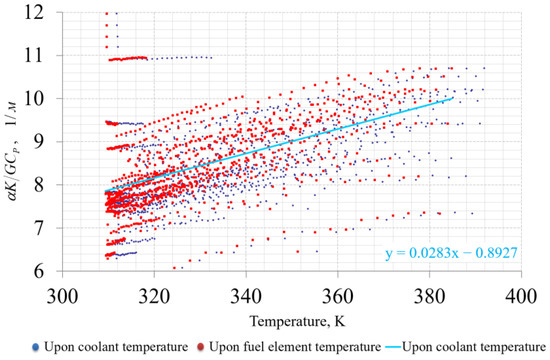
Figure 9.
Heat transfer coefficient values depending on water temperature.
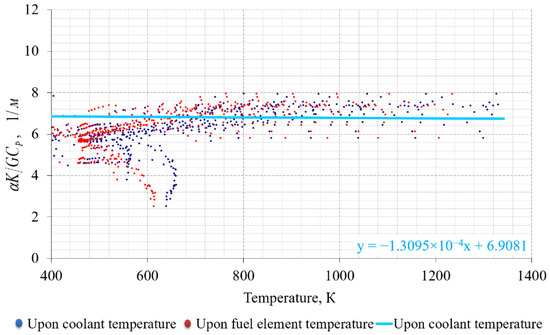
Figure 10.
Heat transfer coefficient values depending on steam temperature.
Similarly, the heat transfer from the beryllium elements of the core to the coolant is calculated.
6. Validation of Calculation Code
6.1. Assessment of the Reactivity Calculation Error in Stationary Mode
To determine the methodological error of the reactivity calculation, a procedure was deactivated in the IVG.1M reactor kinetics model that calculates the power change considering the current reactivity. This method can be used to estimate the excess or deficiency of reactivity in a certain stationary mode at a steady temperature of all core elements. Stationary mode calculations were performed at 3, 6, and 9 MW power according to the reactor start-up data, and reactivity effects were calculated for separate zones of the reactor.
Table 4 presents the reactivity effects from the heating of different core areas and the total effect caused by the steady distribution of the temperature field. The deviation of reactivity from the zero value can be seen in the last column of the table. The deviation occurs both positively and negatively and does not exceed 0.016 βeff.

Table 4.
Values of reactivity effects (βeff).
Table 5 shows the temperature values. Temperature deviations from the experimental values do not exceed 1.5 °C.

Table 5.
Coolant temperature calculated by kinetics model / experimental data.
6.2. Comparison of Temperature Calculation Results in Beryllium Blocks of the Kinetics Model and ANSYS Thermal Model
As a result of thermal–hydraulic calculations, the values of heat flow, heat transfer coefficients, washed surface area, and temperature were obtained. All the obtained values were entered into the reactor kinetics model.
Figure 11, Figure 12 and Figure 13 demonstrate the dependences of temperature changes in the beryllium blocks for the central assembly, spacers block, and control drums, calculated using ANSYS Fluent software and the developed kinetic calculation code. It can be seen that, in stationary mode, there is good compliance with the results. In the dynamics, the core element temperature calculated using the kinetic model is delayed from that calculated using Ansys Fluent. The discrepancy exists because in the ANSYS Fluent calculation code, the heat transfer is calculated using boundary layer parameters, whereas in the developed calculation code, it is calculated using the average mass temperature of beryllium. To eliminate the discrepancy, it is possible to complicate the heat transfer function depending on the average temperature of the element, taking into account the thermal conductivity of beryllium.
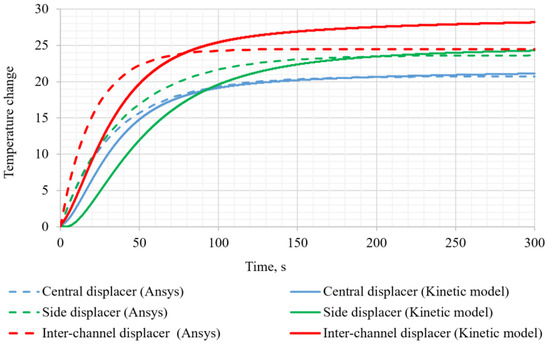
Figure 11.
Diagram of temperature changes of the beryllium blocks of the central assembly by time.
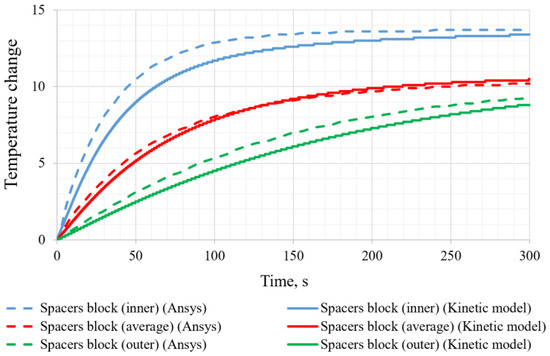
Figure 12.
Diagram of temperature changes in beryllium blocks of the spacer block by time.
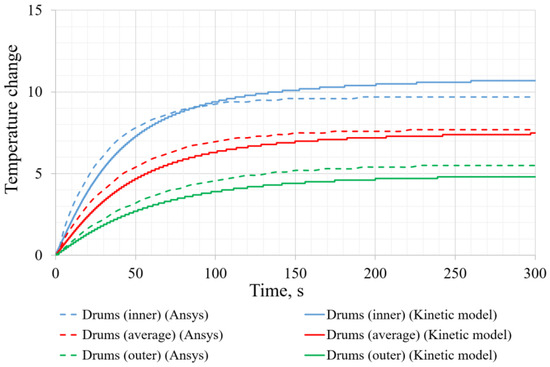
Figure 13.
Diagram of temperature changes of CD beryllium blocks by time.
6.3. Consistency of Stationary States According to Experimental Data
To test the kinetics model, a calculation of the reactor core transition from one stationary state in startup No. 1 to another state corresponding to startup No. 2 was made. Two critical states of the reactor differ in the position of the CD system and the reactor core temperature. When modeling the transition between states, the effect of changes in the position of CD and core temperature should be equal to zero.
For this purpose, it is accepted that the reactor was operated in stationary mode at a low power level with a core temperature of 294.75 K and CD position of 4444 steps. At a time of 120 s, CD is turned to the 4545 steps position and water with a temperature of 288.19 K is supplied to the core. Within a thousand seconds, the reactor core takes the new inlet water temperature.
The calculations show that the reactor does not return to a critical state. The reactivity effect is 0.012 β, which corresponds to a difference in CD position of about 12 steps. This discrepancy can be explained by a temperature registration error of 0.5 K or by an error in the measurement of the CD position of 0.5°.
6.4. Dynamic Mode
Verification of the kinetic model on parameters of the beginning of start-up is possible for the reactor accelerating period. In this case, only the CD position impacts the reactor reactivity; the temperature of core elements remains constant because of the reactor’s low power. A comparison of experimental and calculated results shows good consistency (Figure 14).
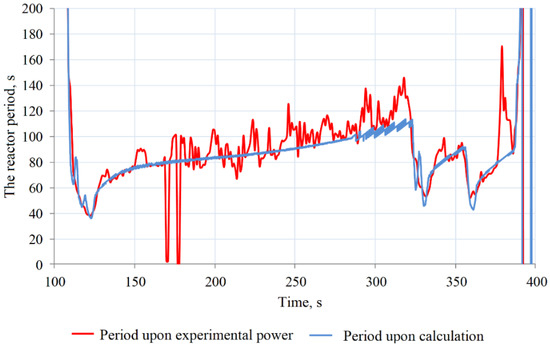
Figure 14.
Period of reactor at the beginning of start-up.
6.5. Validation of Calculation Code by Startup Parameters
The reactor kinetics program performed calculations to simulate the reactor state in real startup modes. The startup parameters are shown in Table 6.

Table 6.
Start-up parameters.
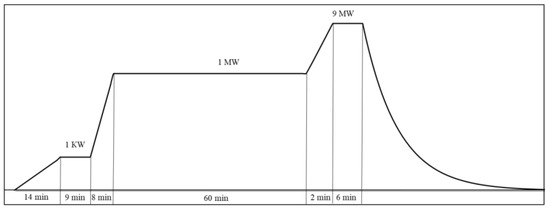
Figure 15.
Diagram of Start-Up No. 1.
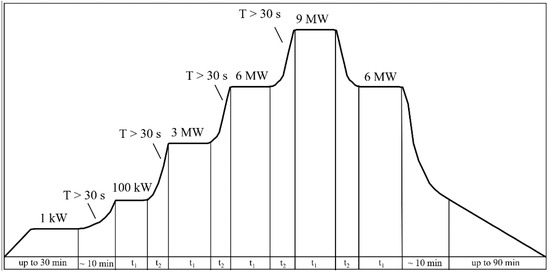
Figure 16.
Diagram of Start-Up No. 2.
Figure 17 and Figure 18 present calculated and measured power values in two start-ups of the IVG.1M reactor.
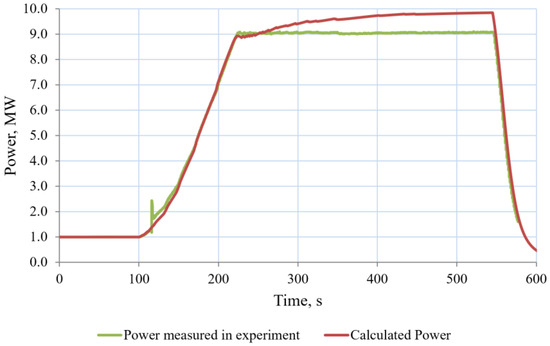
Figure 17.
Diagram of Power Change in Start-Up No. 1.
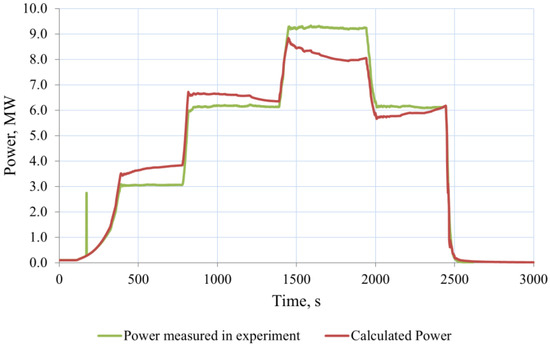
Figure 18.
Diagram of Power Change in Start-Up No. 2.
It should be noted that the difference in the position of CD between MCRP and 9 MW stationary power in both cases reached 134 and 137 steps. However, the reactor inlet water temperature practically remained unchanged in startup No. 1, whereas it increased by 1.5 K in startup No. 2. Additionally, startup No. 2 is characterized by a more expressed effect of xenon poisoning.
In general, it can be considered that the kinetics model satisfactorily describes the operation of the IVG.1M reactor in transient modes, despite the fact that, in stationary modes, there are discrepancies, which correspond to an error of up to 0.016 β.
7. Conclusions
The IVG.1M reactor model describing transient processes during the reactor operation has been developed. The processes of heat transfer in the core and the effect of the temperature of various elements for reactor reactivity are taken into account. The parameters of heat transfer and feedback were calculated using MCNP6.1 and ANSYS Fluent programs.
Neutron-physical calculations were made using the MCNP6.1 program. The reactivity affects different conditions of the core heating, which was accompanied by heating and density changes in separate parts of the IVG.1M reactor core; beryllium blocks, loop channel, different layers of water coolant in the inter-channel space of the central assembly, in the reflector, and in the FA were calculated. The calculated values qualitatively converge to the experimental results. Quantitative assessment of the convergence is not possible.
Thermal–hydraulic calculations were performed using the ANSYS Fluent program. The cooling parameters of beryllium blocks were estimated. The estimation of the temperature of beryllium blocks in stationary modes at the level of 3 MW, 6 MW, and 9 MW was carried out.
According to the results of validation of the point kinetics model based on the results of IVG.1M reactor start-ups, it can be stated that the calculation results are in good correlation with the experimental data for transient modes, whereas there are discrepancies up to 0.016 β in reactivity, up to 1.5 °C in coolant temperature, and up to 10% in reactor power.
In general, experimental methods for determining power in various elements of the core also have an error of about 10% [20].
Author Contributions
Conceptualization, R.I. and A.V.; Formal analysis, R.I., A.V. and G.V.; Methodology, R.I. and G.V.; Project administration, R.I.; Software, R.I. and O.Z.; Validation, R.I., O.Z. and Z.K.; Visualization, O.Z. and Z.K.; Writing—original draft, A.V. and A.S.; Writing—review and editing, R.I. and A.S. All authors have read and agreed to the published version of the manuscript.
Funding
This research is funded by the Science Committee of the Ministry of Education and Science of the Republic of Kazakhstan (Grant No. AP08856242).
Institutional Review Board Statement
Not applicable.
Informed Consent Statement
Not applicable.
Data Availability Statement
Not applicable.
Conflicts of Interest
The authors declare no conflict of interest. The funders had no role in the design of the study; in the collection, analyses, or interpretation of data; in the writing of the manuscript; or in the decision to publish the results.
References
- Nazarbayev, N.A.; Shkolnik, V.S.; Batyrbekov, E.G.; Berezin, S.A.; Lukashenko, S.N.; Skakov, M.K. Scientific, Technical and Engineering Work to Ensure the Safety of the Former Semipalatinsk Test Site. London, 548p. III. 469. Available online: https://irse.nnc.kz/wp-content/uploads/2019/06/Vol-3_web_Final.pdf (accessed on 27 October 2022).
- Ashurko, Y.M.; Volkov, A.V.; Raskach, K.F. Development of program modules with space-time kinetics for calculating unanticipated accidents in fast reactors. Atom. Energy 2013, 114, 77–82. [Google Scholar] [CrossRef]
- Yu, H.; Wang, S.; Liu, Z.; Wang, C.; Chen, Y. Design and development of neutron kinetics code KIND in COSINE code package. Yuanzineng Kexue Jishu/Atom. Energy Sci. Technol. 2013, 47 Suppl. S1, 318–322. [Google Scholar] [CrossRef]
- Xu, L.; Ma, D.; Shi, G.; Yu, H.; Li, Z. Parallel computation research of neutron time-spatial kinetics program for fast reactor. Yuanzineng Kexue Jishu/Atom. Energy Sci. Technol. 2013, 47 Suppl. S1, 369–371. [Google Scholar] [CrossRef]
- Zhang, H.; Guo, X.-W.; Li, C.; Liu, Q.; Xu, H.; Liu, J. Accelerated Parallel Numerical Simulation of Large-Scale Nuclear Reactor Thermal Hydraulic Models by Renumbering Methods. Appl. Sci. 2022, 12, 10193. [Google Scholar] [CrossRef]
- Irkimbekov, R.A.; Zhagiparova, L.K.; Kotov, V.M.; Vurim, A.D.; Gnyrya, V.S. Neutronics Model of IVG.1M Reactor: Development and Critical-State Verification. At. Energy 2019, 127, 69–76. [Google Scholar] [CrossRef]
- Goorley, T.; James, M.; Booth, T.; Brown, F.; Bull, J.; Cox, L.J.; Durkee, J.; Elson, J.; Fensin, M.; Forster, R.A.; et al. Initial MCNP6 release overview. Nucl. Technol. 2012, 180, 298–315. [Google Scholar] [CrossRef]
- Chadwick, M.B.; Obložinský, P.; Herman, M.; Greene, N.M.; McKnight, R.D.; Smith, D.L.; Young, P.G.; MacFarlane, R.E.; Hale, G.M.; Frankle, S.C.; et al. ENDF/B-VII.0: Next generation evaluated nuclear data library for nuclear science and technology. Nucl. Data Sheets 2006, 107, 2931–3059. [Google Scholar] [CrossRef]
- Fluent, I. Fluent 14.5 User Guide; Fluent Inc.: Lebanon, NT, USA, 2002. [Google Scholar]
- Krecicki, M.; Kotlyar, D. Full-Core Coupled Neutronic, Thermal-Hydraulic, and Thermo-Mechanical Analysis of Low-Enriched Uranium Nuclear Thermal Propulsion Reactors. Energies 2022, 15, 7007. [Google Scholar] [CrossRef]
- Wu, J.; Chen, J.; Zou, C.; Li, X. Accident Modeling and Analysis of Nuclear Reactors. Energies 2022, 15, 5790. [Google Scholar] [CrossRef]
- Zhanbolatov, O.M.; Irkimbekov, R.A.; Mukhamedov, N.E. Calculation of the power diagram of an experimental device with a neutron converter. NNC RK Bull. 2020, 82–87. Available online: https://journals.nnc.kz/jour/article/view/295/0 (accessed on 27 October 2022). (In Russia).
- Ortensi, J.; Baker, B.A.; Johnson, M.P.; Wang, Y.; Labouré, V.M.; Schunert, S.; Gleicher, F.N.; DeHart, M.D. Validation of the Griffin application for TREAT transient modeling and simulation. Nucl. Eng. Des. 2021, 385, 111478. [Google Scholar] [CrossRef]
- Jing, T.; Schunert, S.; Labouré, V.M.; DeHart, M.D.; Lin, C.-S.; Ortensi, J. Multiphysics Simulation of the NASA SIRIUS-CAL Fuel Experiment in the Transient Test Reactor Using Griffin. Energies 2022, 15, 6181. [Google Scholar] [CrossRef]
- Stanisz, P.; Oettingen, M.; Cetnar, J. Development of a trajectory period folding method for burnup calculations. Energies 2022, 15, 2245. [Google Scholar] [CrossRef]
- Cetnar, J.; Stanisz, P.; Oettingen, M. Linear chain method for numerical modelling of burnup systems. Energies 2021, 14, 1520. [Google Scholar] [CrossRef]
- Wilson, W.B.; Cowell, S.T.; England, T.R.; Hayes, A.C.; Moller, P. A Manual for CINDER90 Version 07.4 Codes and Data LA-UR-07-8412; Los Alamos National Laboratory: New Mexico, Mexico, 2008. [Google Scholar]
- Way, K.; Wigner, E. Radiation from Fission Products. Phys. Rev. 1946, 70, 115–116. [Google Scholar]
- Pond, R.B.; Matos, J.E. Nuclear Mass Inventory, Photon Dose Rate and Thermal Decay Heat of Spent Research Reactor Fuel Assemblies (Rev. 1). RERTR Program. ANL/RERTR/TM-26. 1996. Available online: https://www.rertr.anl.gov/FRRSNF/TM26REV1.PDF (accessed on 27 October 2022).
- Sabitova, R.R.; Prozorova, I.V.; Irkimbekov, R.A.; Popov, Y.A.; Bedenko, S.V.; Prozorov, A.A.; Mukhamediyev, A.K. Methods to study power density distribution in the IVG.1M research reactor after conversion. Appl. Radiat. Isot. 2022, 185, 110259. [Google Scholar] [CrossRef] [PubMed]
Disclaimer/Publisher’s Note: The statements, opinions and data contained in all publications are solely those of the individual author(s) and contributor(s) and not of MDPI and/or the editor(s). MDPI and/or the editor(s) disclaim responsibility for any injury to people or property resulting from any ideas, methods, instructions or products referred to in the content. |
© 2023 by the authors. Licensee MDPI, Basel, Switzerland. This article is an open access article distributed under the terms and conditions of the Creative Commons Attribution (CC BY) license (https://creativecommons.org/licenses/by/4.0/).