Abstract
In order to harmonizFranziska Hönige the supply and demand of green energy, new future-proof technologies are needed. Here, hydrogen plays a key role. Within the current framework conditions, the production of green hydrogen is not yet economically viable. The use of the oxygen produced and the possible increase in efficiency associated with it mostly remain unconsidered. The aim is to demonstrate that the economic efficiency of a power-to-gas (PtG) project can be increased by using the byproduct oxygen. In this research project, a water electrolyzer connected to grid is powered to supply hydrogen to a hydrogen refueling station. By utilizing the byproduct oxygen from water electrolysis for a wastewater treatment plant (WWTP), it is shown that the net present value (NPV) of the project can be improved by up to 13% compared to the initial scenario. If a photovoltaic (PV) system is used in addition to grid electricity for higher green hydrogen production, the NPV can be further improved by up to 58%. The levelized cost of hydrogen (LCOH) is calculated for different scenarios with and without oxygen configuration. A sensitivity analysis is then performed to find important parameters.
1. Introduction
With the continuous increase in renewable energy sources (RES) in the power grid, the question of fully efficient use of these energies becomes increasingly important. The biggest challenge here is to balance the supply and demand of energy. With power-to-gas (PtG), i.e., the conversion of electrical energy (electricity) into chemical energy (gas) by means of water electrolysis, the renewable energy generated in the electricity sector is made storable in large quantities and can be further used as gas (green hydrogen). In this way, hydrogen can be used as an energy storage system to buffer RES in a supply-oriented and flexible manner and contributes to balancing supply and demand. As an essential element of sector coupling to mobility and the chemical industry, green hydrogen and its downstream products open up new defossilization paths.
In order to promote the switch from fossil fuels to hydrogen and to achieve the goals of the Paris Climate Agreement, the German government adopted a National Hydrogen Strategy in June 2020 and provided an action plan that is to be continuously updated. It describes hydrogen as a “key element of the energy change” [1]. So far, hydrogen production from fossil fuels has been more economical than production by means of water electrolysis. From the Federal Government’s point of view, however, only hydrogen produced from renewable energies (i.e., green hydrogen) is sustainable in the long run [2,3]. Green hydrogen can also be produced from biomass and wastewater. For instance, a group of Indian researchers developed a sustainable technology to produce 100 g of green hydrogen from 1 kg of biomass [4]. Wastewater can also be used as feedstock to produce hydrogen through photo-fermentation, dark fermentation, and aqueous phase reforming processes [5]. However, these technologies are still in the early development phase and have not yet been upscaled for industrial production. Hence, this paper focuses on green hydrogen production from water electrolysis only.
In addition, investments in PtG projects require a nondiscriminatory regulatory framework and an open-market model. In the recent literature on the topic of power-to-X, hardly any attention has been paid to the equally important byproduct from water electrolysis, oxygen [2,6]. Thus, in most cases, it is only mentioned that hydrogen and oxygen are produced from water with the help of electrical energy, although electrolysis produces 8 kg of oxygen for every 1 kg of hydrogen [7].
The German Hydrogen Strategy aims to achieve a rapid market ramp-up of hydrogen. Domestic production on the basis of renewable energies will have first priority. For a rapid ramp-up and until a cheap supply of green hydrogen can be achieved, the hydrogen regulatory system will be designed in a way that is open to all technologies. An electrolysis capacity of around 10 GW is to be achieved in Germany by 2030, and European cooperation is to be strengthened [8]. The planned expansion corridor of 137 to 275 GW of installed electrolysis capacity by 2050 in Germany [9] could produce up to 23,000 tons of oxygen per hour.
This article proposes to accelerate the expansion of the hydrogen basis promoting the sales of oxygen byproduct from electrolysis. This would help to reduce the high electricity consumption in oxygen production by air separation technologies, such as cryogenic air separation or pressure swing absorption [10]. By supporting the market ramp-up in the form of market activation measures, significantly higher electrolysis capacities for storing surplus RES can be achieved, thus also making the purchase of the byproduct oxygen interesting. Opportunities must be created to establish hydrogen as a defossilization option while using both products from water electrolysis. There are many markets for PtG. Oxygen is used in the food sector, metal production and processing, recycling, water and wastewater treatment [11,12,13], waste processing, paper production, the chemical and pharmaceutical industry, open-cast lakes and aquacultures, and medicine with appropriate purification [7,10,14,15]. Globally, the oxygen market had a value of 35 million USD in 2022 and a growth rate of 12.2%. According to purity grade, it can be majorly classified into medical oxygen and industrial oxygen, with industrial oxygen accounting for 73.8 % of the market share. Metallurgical industry has the largest share of oxygen market with 32.2% of the total demand [16]. Germany alone produces around 6000 to 7000 million m3 of oxygen to meet the demand [17]. Hence, there is a huge demand in the market for oxygen—both medical- and industrial-grade purity. Rivarolo et al. [18], for instance, highlighted the application of oxygen for use in thermochemical processes such as biomass gasification to produce methane and methanol.
This study aims to demonstrate that the additional use of the byproduct from water electrolysis, oxygen, can make the electrolytic production of hydrogen more economical. Various factors play a role in the economically efficient dimensioning the energy system. Some of them include the size and workload of the electrolyzer (production capacity), the discount rate/weighted average cost of capital (WACC), investment costs, operation costs of the systems, and sale price of hydrogen and oxygen. A sensitivity analysis was performed for all the scenarios by varying different parameters in the simulation model to identify the important parameters influencing the economics of the system. It was found that electricity prices play a major role in deciding the economic viability of the project.
2. Literature Research and Overview of Simulation Software
In general, to produce large quantities of oxygen and other gases such as nitrogen and argon, cryogenic air separation units are commonly used. The energy requirement is about 0.464 kWh/Nm3 of oxygen [19]. Here, the purity of the oxygen produced can be over 99%, which is why oxygen for medical purposes is usually produced using a cryogenic process due to the high purity requirements. No technique, with the exception of water electrolysis, is expected to challenge cryogenic air separation for the production of large quantities of oxygen in terms of purity. Pure and clean oxygen produced by electrolysis is suitable for medical use. Because of the high price of medical oxygen, effective marketing of this byproduct oxygen would reduce the high cost of hydrogen production from electrolysis [10]. When using the electrolytically produced oxygen in wastewater treatment, impurities, which tend to be less than 1 % in electrolysis, basically have no influence [20]. In this case study, the byproduct oxygen was used in the wastewater treatment plant as it does not have high purity requirements.
In order to simulate this electrolyzer energy system with hydrogen- and oxygen-sided configuration, a suitable simulation software was needed. There are several simulation applications that can be used for the dimensioning of water electrolyzers and the simulation of a PtG system. Some of the software programs are described below. TRNSYS, a software environment used to simulate the behavior of transient systems, includes a standard library with various components, such as electrolyzers [21]. Matlab Simulink is a block diagram environment and can also be used to simulate electrolyzers and hydrogen refueling stations (HRS) [22]. Aspen Custom Modeler is suitable for developing a dynamic model of an electrolyzer including a detailed description of the various phenomena involved in the electrochemical process [23]. Aspen Plus contains a variety of standard operation units that can be used, for instance, to evaluate and optimize electrolysis systems for hydrogen production [24]. INSEL is also a block diagram simulation system for programming and visualization of energy systems. The electrolysis block (electrolysis cell voltage) can be found under the category of storage [25]. EDGAR is a technoeconomic simulation and optimization software, also used for power-to-X and sector coupling [26]. EnergyPLAN simulates the operation of national energy systems, including different sectors [27]. In most projects, as described, only the hydrogen product was of interest, which is why previous simulation software for modeling a PtG system with the focus on hydrogen could be used. The path of the byproduct oxygen was not considered. The oxygen produced simultaneously plays a subordinate role, but it can lead to an optimization of benefits in certain areas of application. In particular, for the technoeconomic design of an electrolyzer with hydrogen and oxygen users with diverse requirements, there was no precast solution. This was needed for the project “LocalHy”, one of the Hydrogen Power Storage and Solutions East Germany (HYPOS) projects within the BMBF Twenty20 program [12,13,28,29,30,31,32,33]. Hence, an innovative software application called GHOST (Green Hydrogen Oxygen Simulation Tool), version 1, was developed at Fraunhofer CSP. The user-friendly software application was utilized in this study for all simulations.
The hydrogen production costs are one of the most important indicators for evaluating such decentralized systems and making them comparable among each other. They represent a constant price over the entire lifetime that would have to be paid by a user for the hydrogen provided in order for the net present value (NPV) of the investment to be exactly zero. Above this price for hydrogen, the investment would have to be valued positively. A greater production capacity of hydrogen results in a lower levelized cost of hydrogen (LCOH) [34]. In the study of Minutillo et al. [34] the system configuration with a medium capacity of 200 kg/day with a 50% electricity grid reached the lowest value of 9.29 EUR/kg hydrogen. If the calculations of the hydrogen production costs in the current literature are compared, it can be seen that the liquidation proceeds (residual value of the individual components through sale after the project) were not taken into account.
A larger electrolyzer and, thus, a greater hydrogen production capacity lead to a lower LCOH. In addition, it can be found that when no grid electricity is used, the LCOH is also reduced. It was also shown that the LCOH decreases when the project duration is increased [35]. In the same way, the NPV increases when the project duration is increased. Squadrito et al. [36] outlined in their paper the positive influence of the byproduct oxygen from electrolysis on the NPV. Their results confirmed that the oxygen market price, far more than the hydrogen sales price, is the decisive factor for the profitability of the plants studied. Following the calculations in [37], a positive influence of the byproduct was predicted, which can help to make the competitive position of green hydrogen comparable with that of gray hydrogen. In the currently ongoing “Wind Hydrogen” project of Salzgitter AG [38] and in the EU project “GrInHy2.0” (GreenIndustrialHydrogen) [39], the use of hydrogen and oxygen from electrolysis for steel production is being investigated. In addition, the oxygen in the gasification reactor is used to produce synthesis gas in the “GreenHydroChem” real laboratory. This can improve the business model for the electrolyzer [40]. Moreover, the “Westküste 100” real laboratory will test whether the oxygen produced during electrolysis can be injected into the combustion process of a regional cement plant with the help of a so-called oxyfuel process, which could significantly reduce the factory’s nitrogen oxide (NOx) emissions at the same time [41].
Completed projects that have dealt with the further use of electrolytically produced oxygen at WWTPs are the HYPOS project “LocalHy” [12,13,28,29,30,31,32,33], the project of ARGE Hydrogen Initiative Western Pomerania in Barth [42], and the project “WaStraK NRW” [43]. The potential of WWTPs for water electrolyzers could be confirmed in all projects and offered nationwide transferability. Schäfer et al. [44] also described in their study the positive influence of electrolytically produced oxygen in WWTPs and the role of these in the context of sector coupling.
This research focuses on decentralized energy systems for renewable hydrogen and oxygen supply. Decentralized systems offer quicker, reliable access to energy supply, are less capital-intense, and require less infrastructure than centralized systems. These systems also have huge potential in reducing greenhouse gas emissions [45]. The current project aims to supply hydrogen and oxygen economically from decentralized energy system consisting of PV, water electrolyzer, storage, and compression systems.
In Table 1, the LCOH of different selected publications is listed, showing a similar scenario with a water electrolyzer as the core. This is powered by grid electricity and/or solar energy. In some cases, compressors, storage, and additional components such as a battery, a pre-cooling system, and dispensers with remote monitoring are also included. In order to compare the costs better, all LCOH values in the literature were converted into EUR per kg. In a few publications, very low LCOH values were achieved but without considering all the energy system components. On the other hand, high LCOH values were evaluated for the energy systems with additional components. As hydrogen has to be utilized in a refueling station in this research, all energy systems have to be considered for technoeconomic analysis. Moreover, hydrogen production from water electrolysis can cost between 3.90 and 5 EUR per kg H2 [46]. It is also expected to drop to 3.50 EUR per kg in Germany [47]. Compressed hydrogen up to 900 bar for use in refueling stations is sold for a price of 9.50 EUR/kg H2 [48]. Most of the papers in Table 1 report higher production costs, and the energy system project might not achieve profitability with these LCOH values. The aim is to minimize the LCOH or the hydrogen production costs; hence, oxygen sale is considered as a main pathway to achieve this goal.

Table 1.
Comparison of the levelized cost of hydrogen (LCOH) with selected studies.
3. Methodology
3.1. Model Description
The technoeconomic system analysis tool GHOST was programmed with Visual Basic for Applications (VBA) in Microsoft EXCEL, version 2305, where it can be flexibly extended by additional consumers or functions. Thus, it can be specially adapted to different applications and composition of the components. The data were validated in advance, before being added to the database for the simulation, with real data from the LocalHy project [12,13]. In addition, the numerical model was validated with the freely available energy system simulation tool EnergyPLAN from the Danish University of Aalborg (Aalborg, Denmark). Here, the operating behavior of the electrolyzer was examined in more detail as a function of the refueling behavior [27,30].
Using GHOST, it is possible to model power-to-gas concepts coupled with green or grey electricity on an hourly basis and to determine the optimal system configuration for each individual demand case, both technically and economically [28]. Specifically, for the refueling of fuel cell vehicles as hydrogen consumers, the CO2 footprint can additionally be calculated depending on the selected energy. Target values are generally the NPV (NPV > 0, as large as possible), the CO2 footprint (<95 g CO2/km) as a climate value, and the number of times the demand is not met as a reliability value. A distinction is made between Priority 1 (simulation stops if demand cannot be satisfied) and Priority 2 (the number of cases and the missing kilograms of hydrogen and oxygen are recorded; the simulation is not interrupted). There are three options for electrolyzer operation (continuous operation, only during solar hours, and standard operation) [29].
3.2. Detail of System Components
In this study, hydrogen and oxygen were produced on site at a WWTP in Thuriniga, Germany by electrolysis using grid electricity (Scenario 1) or PV electricity generated in-house and supplemented by grid electricity (Scenario 2). In this way, climate-neutral hydrogen for fuel cell electric vehicles (FCEV) could be produced directly at the HRS (publicly accessible). Oxygen could also be used directly in the biological purification stage of the WWTP after intermediate storage (see Figure 1). Onsite electrolyzers offer the great advantage that the refueling station, as well as the aeration basin, is independent of hydrogen or oxygen supplies, transport costs are eliminated, and the investment costs remain low. Before the hydrogen can be delivered to a vehicle, it must be compressed to the required pressure. The aerator for pure oxygen only works at an operating pressure of approximately 2.5 bar [32]. Therefore, the gas can be depressurized from 90 bar before it Is introduced into the aeration tank of the WWTP. The hydrogen and oxygen storage tanks are bundle battery plants in a modular system. This makes it possible to expand existing plants without any problems. The hydrogen refueling station consists of a high-pressure compressor, a dispenser’s precooling unit, a remote monitoring system, a regulation and control system, and H2 dispensers [55].
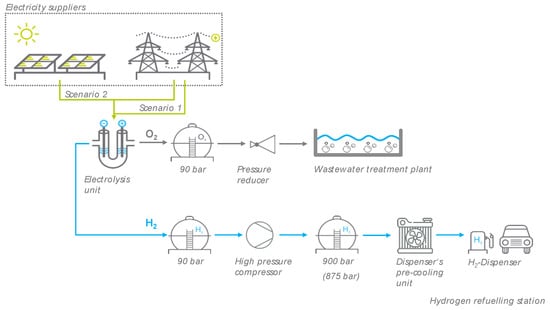
Figure 1.
Model of the power-to-gas (PtG) plant with onsite HRS and oxygen utilization in the aeration tank of a wastewater treatment plant (WWTP) at Thuringia, Germany.
The system components to design this model are outlined below.
- a.
- Electrolyzer
The simulation was based on an alkaline high-pressure electrolyzer (AEL), which provides the product gases hydrogen and oxygen at a pressure of 90 bar [12,13]. In alkaline electrolysis, the water is usually added at the cathode side (HER—hydrogen evolution reaction), where the hydrogen and the OH− ions, the charge carriers, are formed. The latter cross the microporous or anion-conducting membrane and are converted to oxygen and water on the anode side (OER—oxygen evolution reaction). The half-cell reaction of alkaline electrolysis is as follows [56]:
The electrolyzer can be scaled as required due to its modular design. The power of the electrolyzer for the scenario is 1.125 MW with a hydrogen production of 148,457.43 kg and an oxygen production of 978,768.00 kg. The power-independent losses of hydrogen and oxygen due to, for example, gas measurement or backwashing for gas conditioning and the power-dependent losses of oxygen for water dosing are already deducted here and are taken into account from the outset in the simulation. These can be individually defined by the user of the software. Both gases are initially stored temporarily at 90 bar. In this case study, the hydrogen was then compressed to 875 bar.
- b.
- Photovoltaic system
With the help of a dynamic simulation program, PV*SOL premium [57], a south-facing ground-mounted PV system was simulated in Sonneberg-Heubisch (Thuringia), the location of the LocalHy project [12,13]. The energy yield of the PV plant generated by the csv file with hourly resolution was temporarily stored in a separate file by GHOST as an output value and could be linearly scaled in size as required during system simulation.
According to the ordinance on tendering of financial support for ground-mounted systems, there is an upper limit for the size of the offer for a PV ground-mounted system; the offers must each have a size of an installed capacity of at least 100 kWp and at most 10 MWp [58]. For this reason, the maximum size of 10 MWp was fixed as a simulation value. If the average, volume-weighted surcharge value (ct/kWh) is considered over the last few years, the result is an average value of 5221 ct/kWh [59]. This was given as the revenue for feeding the remaining PV electricity into the grid in Scenario 2.
- c.
- Oxygen utilization in WWTPs
The electricity demand in WWTPs can be saved by using pure oxygen from electrolysis. With an average share of 20%, WWTPs are usually the largest consumers of electricity in the municipal sector and consume more electricity than schools, hospitals, administrative buildings, or other municipal facilities. The high electricity consumption is due to the aeration of the aeration tank of a WWTP, which usually requires by far the most energy of all the process steps of a municipal WWTP. This is around 50–80% of the total electricity demand of the WWTP [60]. In Table 2, the average specific electricity consumption of WWTPs is listed according to the size class. The population equivalent (PE) is defined as the average load of biodegradable substances in the wastewater of a resident. The inhabitant-specific, annual electricity consumption kWh/(PE·a) is used to evaluate and compare the energy parameters. The investigated WWTP was assigned to size class 4. The share of the total electricity demand was 60% in the study example. The main goal in system optimization of WWTPs is, thus, to reduce electricity consumption using the oxygen from water electrolysis.
Table 2.
Average specific electricity consumption of WWTPs by size class according to the Federal Environment Agency [60].
In drainage engineering, a distinction is made between the combined system and the separate system. The construction of new sewer networks in the mixed system has largely been completed. All new systems will be separate systems in order not to mix rainwater with wastewater and to divert it separately. In Thuringia, there are still predominantly combined sewer systems [61]. Due to fluctuating amounts of precipitation, there is an irregular supply of electrolytically produced oxygen. The wastewater changes over time. Thus, higher precipitation amounts are associated with lower substance concentrations and, thus, lower oxygen demand. In the course of time, there are always outliers that require a significantly higher amount of oxygen per hour. This is due to the fact that sudden heavy rainfall events are often accompanied by a so-called flushing surge, which is associated with a high volume of wastewater and high concentrations of substances. This also causes a disproportionately high oxygen demand [62].
Economically, it would be unfavorable to design the entire PtG system according to these outliers, as the entire system would then be oversized and, thus, no longer transferrable to economic viability. For this reason, redundancies in the form of oxygen bundles are provided for these cases, which are also considered as additional expenditure for oxygen utilization. Here, the calculation was based on the energy requirement for oxygen from air separation plants, which was offset against the missing quantity of oxygen.
- d.
- Hydrogen refueling station
SAE J2601 is a refueling protocol that specifies the requirements of HRS in terms of performance, refueling process, and other operating parameters. The compression process and the refueling time are also determined here. The latter depends on several parameters, such as delivery pressure (700 or 350 bar), ambient temperature, initial pressure in the vehicle, size of the tank, and the degree of refueling to be achieved. SAE J2601 defines the following parameters as “reference” refueling values to determine a target for the refueling time:
- -
- Delivery parameter: 70 MPa @ −40 °C (H70-T40),
- -
- Ambient temperature: 20 °C,
- -
- Initial pressure in the vehicle tank: 10 MPa,
- -
- Refueling level to be achieved: 95%.
Under these reference conditions, the maximum refueling time was set at 3 min [63]. In addition, there was a waiting time until the pump was ready for the next customer (see Table 3).
Different constellations are possible for both offsite (central hydrogen production) and onsite refueling stations (onsite production). Fraunhofer ISE, together with e-Mobil BW GmbH (2013), prepared an overview of various possible HRS concepts. Since offsite refueling stations are not the focus of this publication, they are not discussed further [64]. For refueling stations with decentralized hydrogen production, there are two options for storage and delivery. In cascade refueling, the gaseous energy carrier flows from the storage tank into the vehicle due to the pressure difference [65]. In cascading, hydrogen is compressed from the low-pressure to the high-pressure storage tank, if necessary. As soon as a refueling process starts, the vehicle is filled from the high-pressure storage tank until the pressure is equalized. Hydrogen is then filled from a pressure tank at the next higher pressure. As soon as pressure equalization occurs, a pressure tank with a higher pressure is used. Cascading with as many stages as possible can, thus, reduce energy losses and is the most sensible solution in terms of energy. However, higher investment and operating costs for the pressure tanks are detrimental to economic efficiency. For this reason, the general conditions are often analyzed in cascading in order to determine the refueling station configuration [66].
In order to achieve a certain refueling level in the cascade configuration, an overpressure is required. For this reason, hydrogen is usually stored at between 800 and 900 bar in the high-pressure tank [66,67,68]. In the case that the refueling process starts with more than 875 bar (900 bar tank), there is usually a pressure reducer that prevents the pressure from exceeding 875 bar. Therefore, 875 bar was specified as the maximum pressure in the simulation.
Table 3.
Parameters of hydrogen refueling station (HRS) sizes (excerpt) according to the H2 Mobility initiative [64,69].
Table 3.
Parameters of hydrogen refueling station (HRS) sizes (excerpt) according to the H2 Mobility initiative [64,69].
| Very Small | Small | Medium | Large | |
|---|---|---|---|---|
| Numbers of dispensers | 1 | 1 | 2 | 4 |
| Allowed waiting time between two refueling events in min | 20 | 5 | 5 | 0 |
| Max. number of refueling events per dispenser and hour | 2.5 | 6 | 6 | 10 |
| Number of refueling events per day (average/max) | 10/20 | 30/38 | 60/75 | 125/180 |
| Max. dispensed H2 in kg/h | 18 | 33.6 | 67.5 | 224 |
| Dispensed H2 in kg/day (average/max) | 56/80 | 168/212 | 336/420 | 700/1000 |
In addition, refueling with a so-called booster compressor is possible. Here, hydrogen is compressed from a low-pressure container directly into the vehicle tank. This publication focuses on cascading.
H2 MOBILITY divides HRS into four broad categories. In Table 3, the most important parameters that characterize the different sizes are listed. The simulated HRS is a refueling station of size M (medium) with two dispensers.
The hydrogen consumption at the HRS was determined for the simulation with 110,000 kg of hydrogen, which is sold for 9.50 EUR/kg at the refueling station. This corresponds to about 550 FCEV at an annual average mileage of 20,000 km per vehicle [70]. The hydrogen price at the H2 MOBILITY filling stations increased to 13.85 EUR/kg H2 for 700 bar refueling in June 2022. The simulation still uses the previous price of 9.50 EUR/kg [70]. The hydrogen storage (90 bar) is equipped with 60 × 50 L cylinder bundles. This corresponds to a total volume of 3000 L (total H2 stored @ 90 bar: 19.26 kg). The total volume of the hydrogen storage at 875 bar is 24,000 L (total H2 stored @ 875 bar: 1048.30 kg). The present compressor is a hydraulically driven piston compressor that compresses the hydrogen from 90 bar storage into 875 bar storage. According to a study by Fasihi et al. [37], hydrogen can be produced on all continents in 2050 at a price of 1.58 EUR/kg hydrogen. This assumes a reduction in the electricity production costs of renewable energies and an increase in the CO2 emission license prices. Furthermore, according to this study, cost degressions of PV plants, wind energy plants, hydrogen compressors, and water electrolyzers are to be expected up to 2050. Government subsidies, lower investment risks, and a lower WACC can also improve local competitiveness [37]. Cost reduction potentials arise primarily from the continuous increase in annual production quantities and the transition to series production.
An increase in utilization cannot be guaranteed by the constellation of electrolyzer and storage. Outages may occur, which are not considered in this scenario. An increase in the size of the storage facility would also not have had the desired effect. It would have needed to be significantly enlarged, which would not have been economical. The focus of this paper is on investigating the influence of the additional use of the byproduct oxygen from electrolysis. For this reason, the simulation was set for a 100% security of supply of around 550 FCEVs with an assumed driven distance of 20,000 km/year. The remaining approximately 38,500 kg of hydrogen in the storage at the end of the year was sold to the surrounding industry for 4.50 EUR in the present scenario, but could also serve as a buffer in the storage for the new year.
3.3. Levelized Cost of Hydrogen
The LCOH (inferred from the levelized cost of electricity (LCOE)) is considered the most important indicator among the economic valuation indices. Therefore, special attention is paid to their investigation. The LCOH is estimated on the basis of the NPV method. Kuckshinrichs et al. [71] lists not only the LCOH for the cost assessment, but also the NPV for the attractiveness analysis and the variable costs for the analysis of market flexibility.
In the valuation of investments, the NPV method is the most common calculation method. It belongs to the asset value methods and, in this sense, aims to maximize the final assets. Its result is the , which is calculated from the present value of all cash inflows () and cash outflows ) of the investment object at time , thus, represents the net cash flow in the individual periods during the project term (). The calculation interest rate (equated here with the ) is given as and is the number of periods. If the NPV assumes a positive value (), the project is absolutely advantageous and, thus, preferable to investing money on the capital market. According to the maximization calculation, the project with the highest NPV is, therefore, relatively advantageous. If, on the other hand, the NPV is negative (), investing money in the project proves to be disadvantageous. With an NPV of zero, no advantageous decision can be made using this method, since the return on investment corresponds to the return on the capital market. In this case, the decision maker is indifferent to both alternative courses of action. Blohm et al. [72], on the other hand, also saw this case as advantageous, since the desired minimum interest rate was achieved at the calculation Interest rate. The NPV formula also shows that the cost of capital increases as the interest rate rises. From this, it can be concluded that a higher calculation interest rate causes a lower NPV and, thus, has a significant influence on it [72,73]. The basic form of the formula of the NPV is as follows [7,72,73]:
In order to further specify this formula, additional parameters are first defined. The payments at the beginning of the project are called initial investment costs ( and do not need to be discounted due to their temporal occurrence at t = 0. At the end of the project (t = T), the liquidation proceeds () can be added to the payment surpluses of the last period [74]. The sum of all cash inflows and the liquidation proceeds after deducting the cash outflows results in the net payments. Their cash value in turn leads to the capital value, which is also referred to as the NPV. This can now be represented as follows [72,73]:
Inferred from the NPV method, the with the unit EUR/kg H2 is defined as follows [34,72]:
The total expenditure in each period, includes the annual maintenance and operating costs and the annualized replacement cost. is the yearly mass of hydrogen produced. refers to the annual income from the sale (feed-in) of surplus electricity from the PV system to the grid. is the rate of change during the period of time, not only the system degradation rate. can be positive or negative. For the present calculations, was assumed to be zero. If liquidation proceeds accrue toward the end of the project, these must also be considered in the calculation of the . In this project, it was assumed that the individual components reach the end of their service life after a term of 30 years; thus, no liquidation proceeds arose in the 30th project year.
with the unit EUR/kg H2 stands for the specific hydrogen production costs, in which the additional revenue from the sale of oxygen was taken into account in each period. The expenses for the additional use of oxygen (e.g., oxygen storage, aeration system) are also included in . The decrease compared to the only if the expenses for oxygen use are lower than the additional revenue from the sale of oxygen (. There is a cross-financing of hydrogen production by the revenues of oxygen utilization.
In this example, the revenue from oxygen sales corresponds to the savings in electricity for the blower originally used to aerate the aeration basins. A major advantage of this project is that the electrolytically produced oxygen is already under pressure and, therefore, no longer needs to be compressed for storage. In addition, there is no need for high-purity oxygen for aeration of the aeration basin, as is the case for medical applications; thus, no purification is required, which does not result in unnecessary costs.
4. Results and Discussion
All setting parameters can be found in the tables in the appendix (see Appendix A). First, Scenario 1 is discussed, which considers a PtG system that operates only with grid power. Here, a distinction is made between a pure hydrogen application and an additional use of the byproduct oxygen. This is followed by an examination of Scenario 2 with its own PV system, which must be procured at the beginning of the project, in addition to supplying the electrolyzer with grid electricity. At the end, building on Scenario 2, it is analyzed how the sale of oxygen affects the NPV and what influence the WACC has on the result. The whole project time is based on the lifetime of the PV system. The LCOH values with and without oxygen-sided configuration are mentioned in Table 4. The best scenario is achieved for the energy system scenario with a PV powerplant and usage of the byproduct oxygen. This scenario performed well with an LCOH value of 6.28 EUR/kg H2. When compared to the selected literature values researched, which are mentioned in Table 1, the water electrolyzer energy system performed the best due to the additional sale of the byproduct oxygen for the wastewater treatment plant.
Table 4.
Simulation results of the energy system for a scenario without photovoltaic (PV) and a scenario with PV power plant.
In order to completely understand the effect of important parameters on the financial aspects of the energy system, a sensitivity analysis was performed by varying four parameters: electricity price, PV power plant specific cost, electrolyer CAPEX, and oxygen selling price. The results of the various sensitivity simulations are presented below.
4.1. Simulation with Grid Power Only (Scenario 1)
In the two different scenarios, important factors influencing economic efficiency are examined in more detail. In Scenario 1, the electrolyzer is only operated with grid electricity. A fixed tariff is set here.
4.1.1. Electricity Price Variation
It was found that electricity costs play a major role on the economic efficiency of the overall system. Therefore, this subsection shows how a change in the electricity price helps to bring the PtG system into economic viability: on the one hand, for pure hydrogen use and, on the other hand, for the use of both products from water electrolysis. The results also show the marginal electricity price at which the project becomes profitable. The electricity price on the x-axis plotted in the figures always refers to the price for the electricity mix from the grid.
4.1.1.1. Without Oxygen Use
The initial capital value for the given parameters (electrolysis CAPEX: 700 EUR/kW and electricity price: 23 ct/kWh) in this example is −25,070.67 kEUR for pure hydrogen utilization. The LCOH is 19.64 EUR/kg H2. To illustrate the influence of the electricity costs, these are varied from 2 ct/kWh to 23 ct/kWh. At an electricity price of 8 ct/kWh, the NPV achieved a positive result. From here on, the investment in the project is worthwhile. The LCOH reaches a value of 7.91 EUR/kg H2. The payback period is 10 years. In Figure 2, the NPV and the LCOH are plotted against the electricity price.
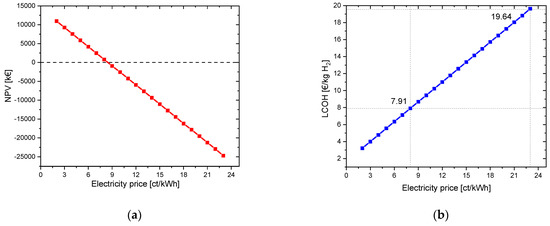
Figure 2.
Variation in electricity price for a project lifetime of 30 years: (a) change in net present value (NPV); (b) change in LCOH values.
4.1.1.2. With Oxygen Use
When the same settings are applied, but oxygen is additionally used for the biological purification stage, there is a slight improvement in the NPV, but it still remains negative: −21,902.37 kEUR. The main reason is that the oxygen is not directly sold to the WWTP in kg; instead, it is used to save only minor electricity costs of the aeration blower inside the WWTP. With high oxygen feed-in, the revenue from the electricity savings in WWTP is very low in this case even for an electricity price of 23 ct/kWh. However, for an electricity price of 9 ct/kWh, the NPV becomes positive. The LCOH here is 8.16 EUR/kg, and the payback period is 15 years. In order to establish comparability with the simulation in Section 4.1.1.1, the electricity price was also set at 8 ct/kWh. Accordingly, the LCOH becomes 7.44 EUR/kg H2 and the investment is amortized after only 8 years. Figure 3 shows the increase in NPV and the reduction in LCOH through the additional use of the byproduct oxygen from water electrolysis.
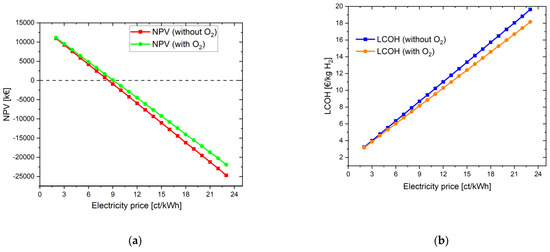
Figure 3.
Variation in electricity price for the energy system with oxygen use for a project lifetime of 30 years: (a) change in NPV; (b) change in LCOH values.
The difference in the LCOH values lies between 0.06 EUR at an electricity price of 2 ct/kWh and 1.50 EUR at an electricity price of 23 ct/kWh. The more expensive the electricity is for operating the water electrolysis, the more it is worthwhile to use the oxygen in addition. If it is assumed that the electricity price for accounting for the savings in the aeration tank does not change and is assumed to be constant at 23 ct/kWh, the difference between the LCOH values with and without O2 benefit is constant at its maximum value of 1.50 EUR.
In addition to the NPV and the LCOH, the payback period is another interesting parameter to consider. In Figure 4, the payback time of the two cases, with and without oxygen consideration, is listed depending on the electricity price. At an electricity price of 23 ct/kWh, the project duration of 30 years is not sufficient to amortize the project investment. The value here is well over 32 years. In the case with oxygen, the payback period is 15 years at an electricity price of 9 ct/kWh (see above). In order to amortize the investment even in the case without oxygen use, an electricity price of 8 ct/kWh is required. The payback period is 10 years. The strong dependence on the electricity price becomes clear here. A lower electricity price results in the two cases differing less. This can also be confirmed by the NPV and LCOH curves of the two cases, with and without oxygen utilization. Unlike the linear curve in the case of NPV and LCOH, the curve here is exponential because electricity price now plays the major role in the complete project lifetime; a slight change to 1 ct/kWh results in a huge change of operational costs every year. Until 10 ct/kWh, NPV is linearly negative, resulting in a payback period of over 30 years. There is a linear decrease in NPV from 23 ct/kWh to 10 ct/kWh; however, the payback period remains above 30 year threshold. For a configuration with O2 at 9 ct/kWh, the NPV achieved is 116.81 kEUR after the 30 year project lifetime; however, in the 15th year of the project, the NPV is 0 EUR, and the project subsequently earns profit from hydrogen and oxygen sale. Similarly for other points/electricity prices, the payback period is achieved at quickly and the NPV increases linearly every year after this stage. Hence, the payback period curve becomes exponential at each point after break-even is achieved.
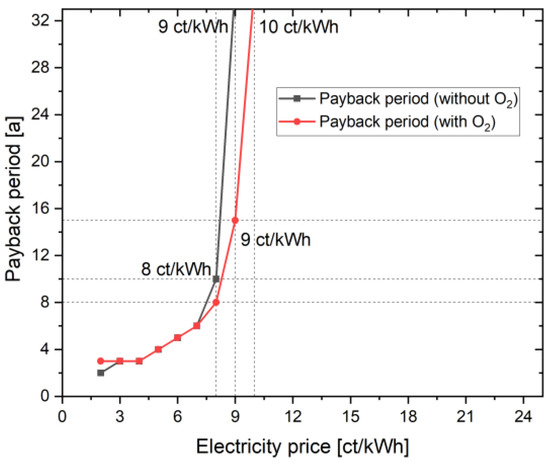
Figure 4.
Influence of additional oxygen use on the payback period.
4.1.2. Variation of the CAPEX of Electrolyzer
In order to additionally investigate the influence of the electrolyzer CAPEX (EL) on the NPV, the simulation with oxygen use was selected as the initial scenario. If the NPV is plotted against the electricity costs (see Figure 5), there is hardly any difference between the simulations with initial costs of the electrolyzer of 200 EUR/kW to 1000 EUR/kW. With a CAPEX of 1000 EUR/kW, the investment in the project is worthwhile from an electricity price of 8 ct/kWh and lower. For the simulation with an electrolyzer CAPEX of 200 EUR/kW to 700 EUR/kW, the marginal electricity price is 9 ct/kWh. A special case exists for EL = 1000 EUR/kW; here, the NPV reaches a positive value in the 19th and 20th years and then becomes negative again. This is due to the fact that several expenses are due in the 21st project year, such as the stack exchange, new contract for the long-term rental of the hydrogen and oxygen storage tanks, and inspection of the HRS.
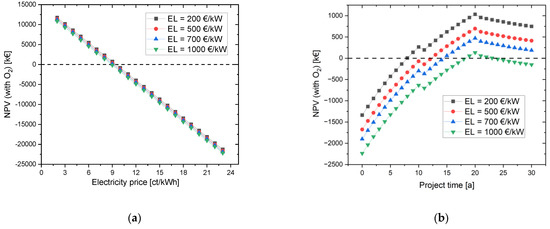
Figure 5.
Effects of varying the electrolysis CAPEX on the NPV (a) depending on the electricity price for a project time of 30 years, and (b) depending on the project time with an electricity price of 9 ct/kWh.
In summary, the change in electrolyzer CAPEX had a smaller impact on NPV than electricity costs.
4.2. Simulation with Grid and PV Power (Scenario 2) with Oxygen Use
The positive influence of oxygen use was already shown in Scenario 1. Therefore, in Scenario 2, the effects of a PV system in addition to the purchase of grid electricity (PV + grid), along with the use of the oxygen, are considered. If the electrolyzer is to be powered only by solar energy, this would not be possible without intermediate storage of the solar energy in a battery. The compressor for the HRS has a system base load, i.e., the compressor must be continuously supplied with electricity even when it is not in operation. A battery could remedy this by providing sufficient power during the night and at times when no renewable energy is available. In this scenario, grid electricity is used instead of a battery.
Minutillo et al. [34] found that an optimal configuration is achieved when the annual share of electricity supply from the grid is 50%. As described in Section 3.2. (b), the PV system had to be limited to 10 MWp due to the maximum size for PV systems. For the present constellation of the PtG plant, an annual share of electricity supply by the PV plant of only 35% was achieved here. However, it can be seen that purchasing electricity from one’s own PV system improves the NPV as long as the electricity costs from the grid are higher than 4 ct/kWh (see Figure 6). From an electricity price for grid electricity of 12 ct/kWh, the investment in the project is worthwhile. The payback period here is 25 years.
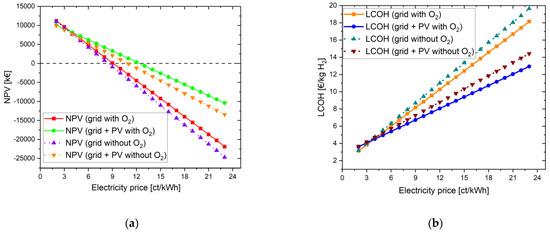
Figure 6.
Improvement in NPV (a) and reduction in LCOH (b) through the acquisition of an own PV system to reduce the purchase of expensive grid electricity.
The payback period for the scenario with 100% grid electricity is 9 ct/kWh over 15 years. If this is compared with the simulation with PV + grid at 9 ct/kWh, the payback time is 14 years. This is shown in Figure 7.
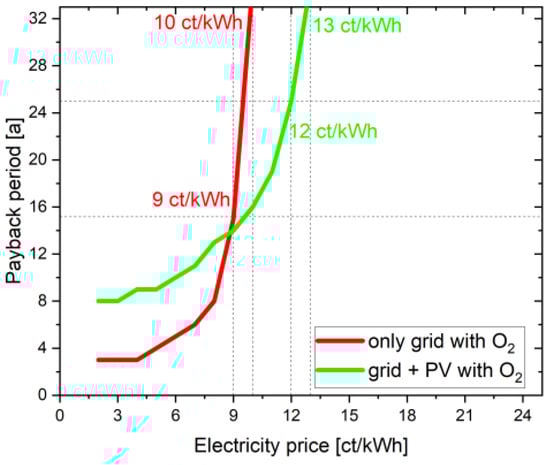
Figure 7.
Positive influence of PV system on the payback period.
For the project to pay for itself, the PV + grid, for example, only requires a reduction in electricity costs to 12 ct/kWh; however, if 100% grid electricity is purchased, an electricity price of 9 ct/kWh is needed for the same result. This shows that the PV + grid scenario is more profitable than a complete grid scenario for a 30 year project lifetime, even when considering additional investment costs of the PV plant.
4.2.1. Variation of CAPEX of the PV System
Currently, the investment costs of the PV module are around 530 EUR/kWp. A decline in investment costs can make this project financially more profitable. Hence, module prices until 2050 were considered to investigate and evaluate their effect on the NPV of the project. Fraunhofer ISE conducted a study on behalf of Agora Energiewende and examined the future module prices in different scenarios on the basis of the historical learning curve until 2050. This approach resulted in module costs decreasing from about 530 EUR/kWp to 140–210 EUR/kWp by 2050 in the breakthrough scenario. Other scenarios foresaw module prices of 180–260 EUR/kWp (270–360 EUR/kWp in the most pessimistic scenario) [75].
In the best scenario, here 140 EUR/kWp, an electricity price of at least 17 ct/kWh is needed for the NPV to be more than zero. In the case with 360 EUR/kWp, the electricity price must be reduced to 14 ct/kWh in order to make the project economically viable (see Figure 8). Compared to the studied example with 12 ct/kWh for grid electricity, the future scenario is better.
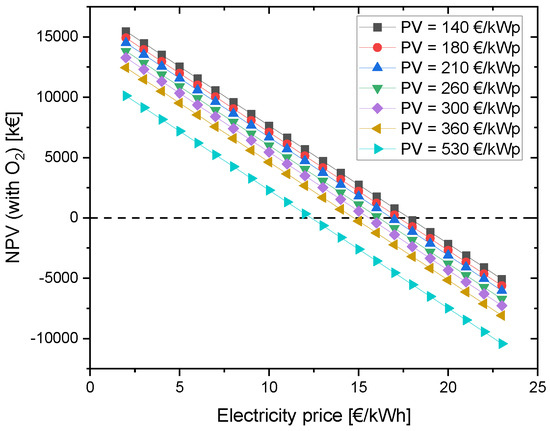
Figure 8.
Change in NPV due to variation of PV CAPEX depending on the electricity price for grid electricity.
4.2.2. Direct Sale of Oxygen
In the first considerations, oxygen is used in the biological treatment stage to aerate the aeration tank in order to replace the very electricity-intensive blower there. Here, the saved electricity costs are calculated and represented as the financial contribution of oxygen usage. In a further consideration, the oxygen is now to be sold to industry at different prices instead of being reused at the treatment plant. The storage size and costs remain the same to ensure comparability.
If the produced oxygen is sold directly, the project is more profitable for the same electricity price of 23 ct/kWh. A sensitivity analysis is performed with different oxygen prices to see how the project performs in terms of profitability. All scenarios show profitability in the project as shown in the Figure 9; even the scenario O2 price = 1 EUR/kg O2 becomes cost-effective in the 22nd project year. An oxygen selling price of at least 1.50 EUR/kg O2 is recommended for this scenario to further increase the NPV. The LCOH decreases significantly, reaching values of 7.90 EUR/kg H2 at 1 EUR/kg O2, 4.60 EUR/kg H2 at 1.50 EUR/kg O2 and 1.31 EUR/kg H2 at 2 EUR/kg O2. Even though the selling prices of oxygen in all these cases are higher than the oxygen commercially available on the market (7–10 ct/kg O2) [76], it is shown for academic purposes to explain the profitability of this project. With a different technical composition of the components with different economic parameters, this effect cannot be as pronounced. However, it clearly shows the positive influence of the additional use of oxygen, which is also obtained electrolytically.
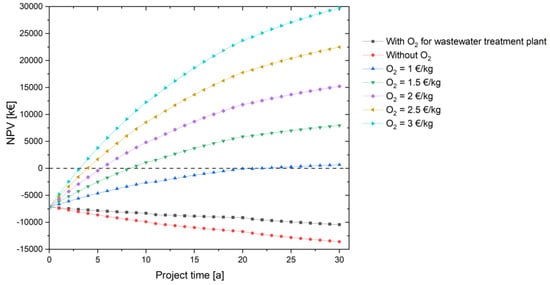
Figure 9.
Improvement of the NPV through the additional sale of the electrolytically produced oxygen depending on the project time.
At higher electricity prices for the operation of the water electrolysis, the additional use of oxygen, which is also produced electrolytically, leads to a greater reduction in the LCOH compared to pure hydrogen use.
4.2.3. Variation of the Weighted Average Cost of Capital (WACC)
Lastly, the influence of the WACC (equal to the discount rate) as an important financial indicator and the project time are discussed. The WACC is one of the profitability indicators with a direct influence on the NPV. It is a valuable tool for business and risk assessment. A lower WACC has a more positive impact on the NPV. A longer lifetime also has the effect of improving the NPV (see Figure 10). According to the Cost of Capital Study 2020 by KMPG, the WACC for the Energy and Natural Resources sector was 5.3% in 2020, which was used as the basis for the simulations [77].
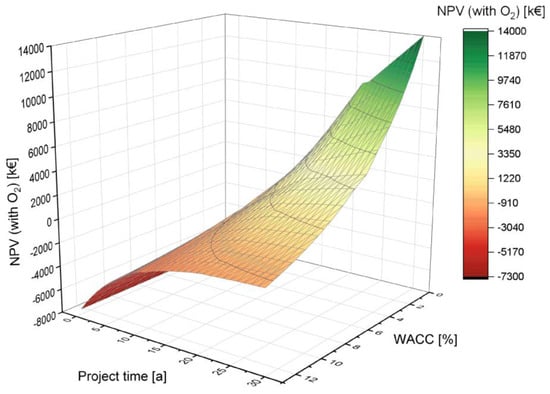
Figure 10.
Influence of the weighted average cost of capital (WACC) on the NPV depending on the project time.
5. Conclusions
A technoeconomic optimization was implemented on an energy system containing an electrolyzer, hydrogen storage, oxygen storage, HRS, and WWTP. Sensitivity analysis on different parameters was performed to obtain the best possible case to make the energy system project financially profitable. Two different scenarios were considered in this study: the power supply of the onsite water electrolyzer (1) with electricity from the grid (electricity mix), and (2) with PV electricity from an own PV system and from the grid.
In both cases, the NPV and LCOH were determined, first only with hydrogen utilization and then with the use of both gases (hydorgen and oxygen) from the electrolysis. In both cases, an improvement in the economic efficiency of the PtG system could be determined through the additional use of the electrolytically produced oxygen.
To confirm the effect of the profitable reuse of the oxygen, another simulation was carried out that examined the sale of the oxygen at different prices for academic purposes. The NPV already reached a positive value in the 22nd project year at a sale price of 1 EUR/kg O2. Here, it is recommended to set a price of 1.50 EUR/kg O2. The operating and maintenance costs were the main influencing factors, in addition to the electricity costs. Therefore, special attention was paid to the variation of electricity costs. A low electricity price can, thus, have a positive influence on the LCOH value.
Ensuring access to affordable, reliable, environmentally friendly, and sustainable energy for all, and using resources as efficiently as possible represent the foundation of a sustainable economic system. This is to be achieved through Sustainable Development Goal 7 of the 2030 Agenda for Sustainable Development, which was adopted by the United Nations in 2015 [78]. In 2021, a further development of the German National Strategy was published, as the world is in danger of failing to achieve the goals of the 2030 Agenda [79]. This will help ensure that green energy becomes available to everyone affordably in the coming years, including for the production of green hydrogen. Possibly, a green industrial electricity price could be introduced as a transformation turbo for energy-intensive industries to ensure permanently competitive electricity costs. The new coalition in Germany has also promised in its coalition agreement that the economy will obtain competitive electricity prices for industrial companies, while consistently using its own renewable energy potentials, which it needs on the way to climate neutrality [8]. Chancellor Olaf Scholz’s goal would be an industrial electricity price of 4 ct/kWh for Germany. The development of the electricity price is essential for the future of entire industries [80]. The additional use of the byproduct oxygen from water electrolysis can effectively contribute to increasing the economic viability of PtG projects.
Author Contributions
F.H., conceptualization, data curation, formal analysis, software, investigation, methodology, validation, visualization, resources, writing—original draft preparation, and project administration; G.D.R., resources, formal analysis, methodology, visualization, and writing—review and editing; D.D.-G., resources, data curation, methodology, and writing—review and editing; M.E., supervision (general work), funding acquisition, and writing—review and editing; U.B., supervision (economic work) and writing—review & editing. All authors have read and agreed to the published version of the manuscript.
Funding
This research was funded by the German Federal Ministry of Education and Research, grant number 03ZZ0705D.
Data Availability Statement
The data presented in this study are available on request from the corresponding author. The data are not publicly available due to confidential data of other companies.
Conflicts of Interest
The authors declare no conflict of interest.
Appendix A
In this appendix, Table A1, Table A2 and Table A3 show the technical parameters for the simulation, the cost of each component, and the variation of these parameters during the sensitivity analysis.
Table A1.
Technical parameters.
Table A1.
Technical parameters.
| Parameter | Value | Unit | References |
|---|---|---|---|
| Project time (plant lifetime) | 30 | years | [81] |
| PV plant peak power | 10 | MWp | [58] |
| Total power generation by PV plant | 10,427,714.80 | kWh/a | [57] |
| PV degradation rate | 0.25 | % | [81] |
| AEL electrolyzer power (without rectifier) | 1125 | kW | |
| Efficiency rectifier | 89 | % | [13] |
| Stack lifetime | 10 | a | [82] |
| Annual operation | 8759 | h/a | |
| Deionized water | 10 | kg/kg H2 | [82] |
| Hydrogen output a | 406.8 | kg/day | |
| Oxygen output a | 2682 | kg/day | |
| H2 storage (90 bar) | 19.62 | kg | |
| H2 storage (875 bar) | 1048.3 | kg | |
| O2 storage (90 bar) | 1417.95 | kg | |
| Long-term storage rental | 10 | years | [13] |
| System base load compressor | 1.25 | kW | [55] |
| Energy consumption per compression operation | 60 | kWh | [55] |
| H2 fixed refueling volume | 110,000 | kg H2/a | |
| O2 demand | 1123,142 | kg O2/a | [13] |
a After deduction of losses.
Table A2.
Economic parameters.
Table A2.
Economic parameters.
| Parameter | Value | Unit | References |
|---|---|---|---|
| Discount rate (equal to WACC) | 5.3 | % | [77] |
| PV plant specific cost (CAPEX) | 530 | EUR/kWp | [81] |
| PV plans OPEX fix | 2.5 | % of CAPEX p.a. | [81] |
| Feed-in remuneration for surplus | 0.05221 | EUR/kWh | [59] |
| PV electricity | |||
| Grid connection cost | 1000 | EUR | [13] |
| Electricity cost | 0.23 | EUR/kWh | [83] |
| AEL electrolyzer CAPEX a | 700 | EUR/kW | [9] |
| AEL electrolyzer OPEX fix | 19 | EUR/kW·a | [9] |
| AEL electrolyzer OPEX var | 45 | % of CAPEX | [9] |
| (Stack exchange) | Every 10 years | ||
| Deionized water | 0.01 | EUR/L | [71] |
| H2 storage (90 bar) | 22,500 | EUR/10 years | [13] |
| H2 storage (875 bar) | 180,000 | EUR/10 years | [13] assumption |
| O2 storage (90 bar) | 90,000 | EUR/10 years | [13] |
| HRS CAPEX b | 738,850 | EUR | [55] assumption |
| HRS OPEX fix | 2 | % of CAPEX p.a. | [55] assumption |
| HRS OPEX var (inspection) | 2.3 | % of CAPEX | [55] assumption |
| Every 5 years | |||
| Hydrogen selling price at the HRS | 9.5 | EUR/kg H2 | [70] |
| Hydrogen selling price for industry | 4.5 | EUR/kg H2 | [84,85] |
| Aeration system for pure oxygen | 81,024 | EUR | [13] |
| for aeration basins (CAPEX) | |||
| Aeration system OPEX | 2 | % of CAPEX p.a. | [13] |
a All peripheral components (rectifier, electrics, gas equipment, safety system, and control system) included. b Compressor, dispenser’s pre-cooling unit, remote monitoring and control system, and two H2 dispensers included.
Table A3.
Variation of the parameters for sensitivity analysis.
Table A3.
Variation of the parameters for sensitivity analysis.
| Parameter | Between | And | Unit | References |
|---|---|---|---|---|
| PV plant specific cost | 140 | 530 | EUR/kWp | [75] |
| Electrolyzer CAPEX | 200 | 1000 | EUR/kW | [37] |
| Oxygen selling price | 1 | 3 | EUR/kg O2 | [7] |
| Electricity cost | 0.02 | 0.23 | EUR/kWh | [80,83] |
References
- Bundesverband WindEnergie. Wasserstoff Ist der Champagner der Energiewende; 30 September 2021. Available online: https://www.windindustrie-in-deutschland.de/expertenwissen/politik/wasserstoff-ist-der-champagner-der-energiewende (accessed on 12 April 2023).
- BMWi. Nationales Reformprogramm 2020: Die Nationale Wasserstoffstrategie. Available online: https://www.bmwk.de/Redaktion/DE/Publikationen/Energie/die-nationale-wasserstoffstrategie.html (accessed on 12 April 2023).
- Maggio, G.; Nicita, A.; Squadrito, G. How the hydrogen production from RES could change energy and fuel markets: A review of recent literature. Int. J. Hydrogen Energy 2019, 44, 11371–11384. [Google Scholar] [CrossRef]
- American Association for the Advancement of Science (AAAS). Generating Green Hydrogen from Biomass, an Abundant Renewable Energy Source. Available online: https://www.eurekalert.org/news-releases/958648 (accessed on 11 June 2023).
- Giulia, Z.; Giuseppe, P.; Raffaele, P.; Samir, B. Aqueous phase reforming process for the valorization of wastewater streams: Application to different industrial scenarios. Catal. Today 2022, 387, 224–236. [Google Scholar] [CrossRef]
- DVGW. Wo Aus Wind Und Sonne Grünes Gas Wird…: Eine Übersicht der Power-to-Gas-Projekte in Deutschland. 2020. Available online: https://www.dvgw.de/themen/energiewende/power-to-gas (accessed on 23 April 2023).
- Nicita, A.; Maggio, G.; Andaloro, A.P.F.; Squadrito, G. Green hydrogen as feedstock: Financial analysis of a photovoltaic-powered electrolysis plant. Int. J. Hydrogen. Energy 2020, 45, 11395–11408. [Google Scholar] [CrossRef]
- SPD; BÜNDNIS 90/DIE GRÜNEN; FDP. Koalitionsvertrag 2021–2025: Mehr Fortschritt wagen: Bündnis für Freiheit, Gerechtigkeit und Nachhaltigkeit. 2021. Available online: https://www.spd.de/fileadmin/Dokumente/Koalitionsvertrag/Koalitionsvertrag_2021-2025.pdf (accessed on 12 April 2023).
- Smolinka, T.; Wiebe, N.; Sterchele, P.; Palzer, A. Studie IndWEDe–Industrialisierung der Wasserelektrolyse in Deutschland: Chancen und Herausforderungen für nachhaltigen Wasserstoff für Verkehr, Strom und Wärme. 2018. Available online: https://www.now-gmbh.de/wp-content/uploads/2020/09/indwede-studie_v04.1.pdf (accessed on 23 April 2023).
- Kato, T.; Kubota, M.; Kobayashi, N.; Suzuoki, Y. Effective utilization of by-product oxygen from electrolysis hydrogen production. Energy 2005, 30, 2580–2595. [Google Scholar] [CrossRef]
- Deutsche Energie-Agentur GmbH (dena). Baustein einer Integrierten Energiewende: Roadmap Power to Gas. 2017. Available online: https://www.dena.de/newsroom/publikationsdetailansicht/pub/broschuere-baustein-einer-integrierten-energiewende-roadmap-power-to-gas/ (accessed on 23 April 2023).
- Donner+friends UG (haftungsbeschränkt) & Co., KG. LocalHy-the Real Energy Transition. Available online: https://donnerandfriends.de/projekte/localhy.html (accessed on 12 May 2023).
- Hydrogen Power Storage & Solutions East Germany, e.V. (HYPOS). LocalHy: Dezentrale Wasserelektrolyse mit kombinierter Wasserstoff- und Sauerstoffnutzung aus Erneuerbarer Energie; 2015–2020. Available online: https://www.hypos-eastgermany.de/wasserstoffprojekte/zwanzig20/chemische-umwandlung/localhy/ (accessed on 12 April 2023).
- Rao, P.; Muller, M. Industrial oxygen: Its generation and use. ACEEE Summer Study on Energy Efficiency in Industry. 2007, Volume 6, pp. 124–135. Available online: https://www.aceee.org/files/proceedings/2007/data/papers/78_6_080.pdf (accessed on 12 April 2023).
- Hurskainen, M. Industrial Oxygen Demand in Finland. VTT Technical Research Centre of Finland. VTT Research Report No. VTT-R-06563-17. Available online: https://publications.vtt.fi/julkaisut/muut/2017/VTT-R-06563-17.pdf (accessed on 12 April 2023).
- The Business Research Company. Global Oxygen Market Report and Strategies to 2032. Available online: https://www.thebusinessresearchcompany.com/report/oxygen-market (accessed on 11 June 2023).
- Statista. Production Volume of Oxygen in Germany from 2010 to 2021. Available online: https://www.statista.com/statistics/1265697/production-of-oxygen-germany/ (accessed on 11 June 2023).
- Rivarolo, M.; Magistri, L.; Massardo, A.F. Hydrogen and methane generation from large hydraulic plant: Thermo-economic multi-level time-dependent optimization. Appl. Energy 2014, 113, 1737–1745. [Google Scholar] [CrossRef]
- Alsultannty, Y.A.; Al-Shammari, N.N. Oxygen Specific Power Consumption Comparison for Air Separation Units. Eng. J. 2014, 18, 67–80. [Google Scholar] [CrossRef]
- Büttner, S. (Bauhaus-Universität Weimar). Interview. Oxygen Purity. Personal Communication, 18 May 2021. [Google Scholar]
- Saleem, M.S.; Abas, N.; Kalair, A.; Rauf, S.; Haider, A.; Tahir, M.S.; Sagir, M. Design and optimization of hybrid solar-hydrogen generation system using TRNSYS. Int. J. Hydrogen Energy 2019, 45, 15814–15830. [Google Scholar] [CrossRef]
- Riedl, S.M. Development of a Hydrogen Refueling Station Design Tool. Int. J. Hydrogen Energy 2019, 45, 1–9. [Google Scholar] [CrossRef]
- Colbertaldo, P.; Aláez, S.L.G.; Campanari, S. Zero-dimensional dynamic modeling of PEM electrolyzers. Energy Procedia 2017, 142, 1468–1473. [Google Scholar] [CrossRef]
- Sánchez, M.; Amores, E.; Abad, D.; Rodríguez, L.; Clemente-Jul, C. Aspen Plus model of an alkaline electrolysis system for hydrogen production. Int. J. Hydrogen Energy 2020, 45, 3916–3929. [Google Scholar] [CrossRef]
- INSEL: Integrated Simulation Environment Language. Quebec Canada, Stuttgart: Doppelintegral GmbH. Available online: https://insel.eu/de/ (accessed on 13 April 2023).
- EDGAR. Freiberg. Available online: https://www.freiberg-institut.de/leistungen/simulation-und-optimierung/ (accessed on 13 April 2023).
- Lund, H.; Thellufsen, J.Z.; Østergaard, P.A.; Sorknæs, P.; Skov, I.R.; Mathiesen, B.V. EnergyPLAN–Advanced analysis of smart energy systems. Smart Energy 2021, 1, 100007. [Google Scholar] [CrossRef]
- Hönig, F.; Ebert, M.; Blum, U. Kläranlagen in Kombination mit der Wasserelektrolyse als neue Anbieter von Regelenergieprodukten. In Neue Energie für unser bewegtes Europa: 15. Symposium Energieinnovation: 14–16 February 2018, TU Graz, Österreich; Verlag der Technischen Universität Graz: Graz, Austria, 2018; Available online: https://www.tugraz.at/fileadmin/user_upload/Events/Eninnov2018/files/lf/Session_F6/766_LF_Hoenig.pdf (accessed on 12 April 2023). [CrossRef]
- Hönig, F.; Duque-Gonzalez, D.; Schneider, J.; Ebert, M.; Blum, U. Auslegung von dezentralen Wasserelektrolyseanlagen gekoppelt mit Erneuerbaren Energien. In Nutzung Regenerativer Energiequellen und Wasserstofftechnik 2019; Luschtinetz, T., Lehmann, J., Eds.; HOST-Hochschule Stralsund: Stralsund, Germany, 2019; pp. 110–120. Available online: https://www.hochschule-stralsund.de/storages/hs-stralsund/IRES/Dokumente/REGWA_Tagungsbaende/Tagungsband_2019-11-04.pdf (accessed on 12 April 2023).
- Hönig, F.; Duque-Gonzalez, D.; Hafemann, M.; Schneider, J.; Ebert, M.; Blum, U. Ermittlung der CO2-Emissionen von Power-to-Gas-Projekten Mittels GHOST und Validierung mit EnergyPLAN. In Energy for future-Wege zur Klimaneutralität: 16. Symposium Energieinnovation: 12–14 February 2020, TU Graz, Österreich; Verlag der Technischen Universität Graz: Graz, Austria, 2020; Available online: https://www.tugraz.at/fileadmin/user_upload/tugrazExternal/4778f047-2e50-4e9e-b72d-e5af373f95a4/files/lf/Session_F1/614_LF_Hoenig.pdf (accessed on 12 April 2023). [CrossRef]
- Büttner, S. Warum kommunale Kläranlagen Wasserstoff mittels Elektrolyse produzieren sollten. Gwf-Wasser 2020, 12, 14–17. [Google Scholar]
- Büttner, S.; Jentsch, M.F.; Hörnlein, S.; Hubner, B. Sektorenkopplung im Rahmen der Energiewende-Einsatz von Elektrolyseursauerstoff auf kommunalen Kläranlagen. In Nutzung Regenerativer Energiequellen und Wasserstofftechnik 2018; Luschtinetz, T., Lehmann, J., Eds.; HOST-Hochschule Stralsund: Stralsund, Germany, 2018; pp. 22–41. Available online: https://www.hochschule-stralsund.de/storages/hs-stralsund/IRES/Dokumente/REGWA_Tagungsbaende/Tagungsband_2018-10-30.pdf (accessed on 12 April 2023).
- Jentsch, M.F.; Büttner, S. Dezentrale Umsetzung der Energie- und Verkehrswende mit Wasserstoffsystemen auf Kläranlagen. Gwf Gas Energ. 2019, 160, 28–39. [Google Scholar]
- Minutillo, M.; Perna, A.; Forcina, A.; Di Micco, S.; Jannelli, E. Analyzing the levelized cost of hydrogen in refueling stations with on-site hydrogen production via water electrolysis in the Italian scenario. Int. J. Hydrogen Energy 2020, 46, 13667–13677. [Google Scholar] [CrossRef]
- Viktorsson, L.; Heinonen, J.T.; Skulason, J.B.; Unnthorsson, R. A Step towards the Hydrogen Economy—A Life Cycle Cost Analysis of A Hydrogen Refueling Station. Energies 2017, 10, 763. [Google Scholar] [CrossRef]
- Squadrito, G.; Nicita, A.; Maggio, G. A size-dependent financial evaluation of green hydrogen-oxygen co-production. Renew. Energy 2021, 163, 2165–2177. [Google Scholar] [CrossRef]
- Fasihi, M.; Breyer, C. Baseload electricity and hydrogen supply based on hybrid PV-wind power plants. J. Clean. Prod. 2020, 243, 118466. [Google Scholar] [CrossRef]
- Salzgitter, A.G. WindH2: Windwasserstoff Salzgitter. Available online: https://salcos.salzgitter-ag.com/de/windh2.html (accessed on 28 April 2023).
- Salzgitter Mannesmann Forschung GmbH. GrInHy2.0: Green Industrial Hydrogen. Available online: https://www.green-industrial-hydrogen.com/ (accessed on 28 April 2023).
- Fraunhofer-Institut für Mikrostruktur von Werkstoffen und Systemen IMWS. Großelektrolyseur Leuna Gewinner im Ideenwettbewerb Reallabore der Energiewende: GreenHydroChem Mitteldeutschland wird gefördert; 18 July 2019. Available online: https://www.imws.fraunhofer.de/de/presse/pressemitteilungen/reallabor-leuna-elektrolyse-wasserstoff.html (accessed on 28 April 2023).
- Raffinerie Heide GmbH. Westküste 100: Sektorenkopplung Komplett: Grüner Wasserstoff und Dekarbonisierung im Industriellen Maßstab. Available online: https://www.westkueste100.de/ (accessed on 28 April 2023).
- ARGE Wasserstoff-Initiative-Vorpommern. Solarer Wasserstoff in Mecklenburg-Vorpommern: Utopie oder Zukunftstechnologie. 2002. Available online: https://www.yumpu.com/de/document/view/6899239/arge-wasserstoff-initiative-vorpommern (accessed on 28 April 2023).
- Forschungsinstitut für Wasser- und Abfallwirtschaft an der RWTH Aachen (FiW) e.V. WaStraK NRW “Einsatz der Wasserstofftechnologie in der Abwasserbeseitigung”-Phase I: Abschlussbericht: 1–178. Available online: https://www.lanuv.nrw.de/fileadmin/forschung/wasser/klaeranlage_abwasser/WaStraK_Abschlussbericht_Teil%201.pdf (accessed on 28 April 2023).
- Schäfer, M.; Gretzschel, O.; Steinmetz, H. The Possible Roles of Wastewater Treatment Plants in Sector Coupling. Energies 2022, 13, 2088. [Google Scholar] [CrossRef]
- Alstone, P.; Gershenson, D.; Kammen, D.M. Decentralized energy systems for clean electricity access. Nat. Clim. Chang. 2015, 5, 305–314. [Google Scholar] [CrossRef]
- Reuters. Imported Hydrogen Can Beat EU Production Costs by 2030-Study. Available online: https://www.reuters.com/business/energy/imported-hydrogen-can-beat-eu-production-costs-by-2030-study-2023-01-24/ (accessed on 11 June 2023).
- Bayern Innovativ GmbH. Production and Import Costs of Hydrogen. Available online: https://www.bayern-innovativ.de/en/page/production-and-import-costs-of-hydrogen (accessed on 11 June 2023).
- FuelCellsWorks. 92nd German hydrogen Station Opens as TOTAL Opens Two New Hydrogen Stations. Available online: https://fuelcellsworks.com/news/92nd-germany-station-open-as-total-opens-two-new-hydrogen-stations/ (accessed on 11 June 2023).
- Artuso, P.; Zuccari, F.; Dell’era, A.; Orecchini, F. PV-Electrolyzer Plant: Models and Optimization Procedure. J. Sol. Energy Eng. 2010, 132, 031016. [Google Scholar] [CrossRef]
- Parra, D.; Patel, M.K. Techno-economic implications of the electrolyser technology and size for power-to-gas systems. Int. J. Hydrogen Energy 2016, 41, 3748–3761. [Google Scholar] [CrossRef]
- Ferrero, D.; Gamba, M.; Lanzini, A.; Santarelli, M. Power-to-Gas Hydrogen: Techno-economic Assessment of Processes towards a Multi-purpose Energy Carrier. Energy Procedia 2016, 101, 50–57. [Google Scholar] [CrossRef]
- Yates, J.; Daiyan, R.; Patterson, R.; Egan, R.; Amal, R.; Ho-Baille, A.; Chang, N.L. Techno-economic Analysis of Hydrogen Electrolysis from Off-Grid Stand-Alone Photovoltaics Incorporating Uncertainty Analysis. Cell Rep. Phys. Sci. 2020, 1, 100209. [Google Scholar] [CrossRef]
- Grimm, A.; de Jong, W.A.; Kramer, G.J. Renewable hydrogen production: A techno-economic comparison of photoelectrochemical cells and photovoltaic-electrolysis. Int. J. Hydrogen Energy 2020, 45, 22545–22555. [Google Scholar] [CrossRef]
- Gutiérrez-Martín, F.; Amodio, L.; Pagano, M. Hydrogen production by water electrolysis and off-grid solar PV. Int. J. Hydrogen Energy 2020, 44, 11371. [Google Scholar] [CrossRef]
- H2 POWERCELL GmbH. Interview. Components of a Hydrogen Refueling Station. Wettringen. Personal Communication, 22 September 2021. [Google Scholar]
- Smolinka, T.; Günther, M.; Garche, J. NOW-Studie: “Stand und Entwicklungspotenzial der Wasserelektrolyse zur Herstellung von Wasserstoff aus regenerativen Energien”: Kurzfassung des Abschlussberichts. 2011. Available online: https://www.now-gmbh.de/projektfinder/studie-wasserelektrolyse/ (accessed on 25 April 2023).
- PV*SOL premium: Die Planungs- und Simulationssoftware für Photovoltaik-Systeme. Berlin. Available online: https://valentin-software.com/produkte/pvsol-premium/ (accessed on 25 April 2023).
- BMWi. Verordnung Zur Einführung von Ausschreibungen der finanziellen Förderung für Freiflächenanlagen sowie zur Änderung Weiterer Verordnungen zur Förderung der erneuerbaren Energien: Freiflächenausschreibungsverordnung-FFAV. 2015, pp. 1–105. Available online: https://www.bmwk.de/Redaktion/DE/Downloads/V/verordnung-zur-einfuehrung-von-ausschreibungen-der-finanziellen-foerderung-fuer-freiflaechenanlagen.pdf (accessed on 25 April 2023).
- Bundesnetzagentur. Solar Freifläche: Beendete Ausschreibungen/Statistiken. Available online: https://www.bundesnetzagentur.de/DE/Sachgebiete/ElektrizitaetundGas/Unternehmen_Institutionen/Ausschreibungen/Solaranlagen1/BeendeteAusschreibungen/BeendeteAusschreibungen_node.html (accessed on 25 April 2023).
- Fricke, K. Energieeffizienz kommunaler Kläranlagen; Umweltbundesamt: Dessau-Roßlau, Germany, 2009; Available online: https://www.umweltbundesamt.de/sites/default/files/medien/publikation/long/3855.pdf (accessed on 25 April 2023).
- Dettmar, J.; Brombach, H. Im Spiegel der Statistik: Abwasserkanalisation und Regenwasserbehandlung in Deutschland. Korresp. Abwasser 2019, 66, 354–364. [Google Scholar]
- Büttner, S. (Bauhaus-Universität Weimar). Interview. Disproportionately High Oxygen Demand. Personal Communication, 27 April 2021. [Google Scholar]
- SAE International. SAE J2601 Fueling Protocols for Light Duty Gaseous Hydrogen Surface Vehicles: J2601_202005. 2020th ed. Available online: https://www.sae.org/standards/content/j2601_202005/ (accessed on 25 April 2023).
- Landesagentur für Elektromobilität und Brennstoffzellentechnologie Baden-Württemberg GmbH (e-mobil BW) in Kooperation mit dem Fraunhofer-Institut für Solare Energiesysteme ISE. Wasserstoff-Infrastruktur für eine nachhaltige Mobilität: Entwicklungsstand und Forschungsbedarf 2013. Available online: https://www.e-mobilbw.de/fileadmin/media/e-mobilbw/Publikationen/Studien/Wasserstoff-Infrastruktur_fuer_eine_nachhaltige_Mobilitaet_-_final_WEB.pdf (accessed on 25 April 2023).
- NOW GmbH. Einführung von Wasserstoffbussen im ÖPNV: Fahrzeuge, Infrastruktur und betriebliche Aspekte. 2018. Available online: https://www.now-gmbh.de/wp-content/uploads/2018/12/NOW-Broschuere_Wasserstoffbusse-im-OePNV.pdf (accessed on 25 April 2023).
- Bauer, A.; Mayer, T.; Semmel, M.; Morales, M.A.G.; Wind, J. Energetic evaluation of hydrogen refueling stations with liquid or gaseous stored hydrogen. Int. J. Hydrogen Energy 2019, 44, 6795–6812. [Google Scholar] [CrossRef]
- Reddi, K.; Elgowainy, A.; Sutherland, E. Hydrogen refueling station compression and storage optimization with tube-trailer deliveries. Int. J. Hydrogen Energy 2014, 39, 19169–19181. [Google Scholar] [CrossRef]
- Ozsaban, M.; Midilli, A.; Dincer, I. Exergy analysis of a high pressure multistage hydrogen gas storage system. Int. J. Hydrogen Energy 2011, 36, 11440–11450. [Google Scholar] [CrossRef]
- H2 MOBILITY. 70MPa Hydrogen Refuelling Station Standardization: Functional Description of Station Modules. 2010. Available online: https://www.now-gmbh.de/wissensfinder (accessed on 25 April 2023).
- Filling up with H2: Hydrogen Mobility Starts Now. 2023. Available online: https://h2.live/ (accessed on 25 April 2023).
- Kuckshinrichs, W.; Ketelaer, T.; Koj, J.C. Economic Analysis of Improved Alkaline Water Electrolysis. Front. Energy Res. 2017, 5, 1. [Google Scholar] [CrossRef]
- Blohm, H.; Lüder, K.; Schaefer, C. (Eds.) Investition: Schwachstellenanalyse des Investitionsbereichs und Investitionsrechnung, 9th ed.; Vahlen: München, Germay, 2006. [Google Scholar]
- Wöhe, G.; Döring, U. (Eds.) Einführung in Die Allgemeine Betriebswirtschaftslehre, 24th ed.; Vahlen: München, Germay, 2010. [Google Scholar]
- Kruschwitz, L. (Ed.) Investitionsrechnung, 12th ed.; Oldenbourg Wissenschaftsverlag: München, Germay, 2009. [Google Scholar]
- Fraunhofer, I.S.E. Current and Future Cost of Photovoltaics: Long-term Scenarios for Market Development, System Prices and LCOE of Utility-Scale PV Systems. 2015. Available online: https://www.ise.fraunhofer.de/content/dam/ise/de/documents/publications/studies/AgoraEnergiewende_Current_and_Future_Cost_of_PV_Feb2015_web.pdf (accessed on 25 April 2023).
- High Volume Oxygen. How Much Does Oxygen Cost? 2021. Available online: https://highvolumeoxygen.com/how-much-does-oxygen-cost/ (accessed on 11 June 2023).
- KPMG. Cost of Capital Study 2020: Global Economy-Search for Orientation? 2020. Available online: https://kpmg.com/de/en/home/insights/2020/10/cost-of-capital-study-2020.html (accessed on 25 April 2023).
- United Nations. Transforming Our World: The 2030 Agenda for Sustainable Development 2015. Available online: https://sdgs.un.org/publications/transforming-our-world-2030-agenda-sustainable-development-17981 (accessed on 25 April 2023).
- Die Bundesregierung. Deutsche Nachhaltigkeitsstrategie: Weiterentwicklung 2021. Available online: https://www.bundesregierung.de/resource/blob/998006/1873516/9d73d857a3f7f0f8df5ac1b4c349fa07/2021-03-10-dns-2021-finale-langfassung-barrierefrei-data.pdf?download=1 (accessed on 25 April 2023).
- Stratmann, K. Energieintensive Industrie fordert radikalen Schnitt beim Strompreis: Große Energieverbraucher kämpfen dafür, dass die Strompreise auf ein wettbewerbsfähiges Niveau gesenkt werden. Sie wissen den Bundeskanzler auf ihrer Seite. 2022. Available online: https://www.handelsblatt.com/politik/ (accessed on 25 April 2023).
- Fraunhofer Institute for Solar Energy Systems ISE. Levelized Cost of Electricity: Renewable Energy Technologies. 2021. Available online: https://www.ise.fraunhofer.de/content/dam/ise/en/documents/publications/studies/EN2021_Fraunhofer-ISE_LCOE_Renewable_Energy_Technologies.pdf (accessed on 25 April 2023).
- Koj, J.C.; Wulf, C.; Schreiber, A.; Zapp, P. Site-Dependent Environmental Impacts of Industrial Hydrogen Production by Alkaline Water Electrolysis. Energies 2017, 10, 860. [Google Scholar] [CrossRef]
- Statista. Strompreise für Gewerbe- und Industriekunden in Deutschland in den Jahren 2011 bis 2021. 2021. Available online: https://de.statista.com/statistik/daten/studie/154902/umfrage/strompreise-fuer-industrie-und-gewerbe-seit-2006/ (accessed on 10 May 2023).
- statista. Forecast Hydrogen Selling Price of Selected Giga-Scale Projects Worldwide by 2021 Wind and Solar Costs. 2021. Available online: https://www.statista.com/statistics/1260117/projected-selling-prices-of-large-scale-hydrogen-green-projects/ (accessed on 5 May 2023).
- IRENA. Hydrogen: A renewable Energy Perspective, Report prepared for the 2nd Hydrogen Energy Ministerial Meeting. 2019. Available online: https://www.irena.org/-/media/Files/IRENA/Agency/Publication/2019/Sep/IRENA_Hydrogen_2019.pdf (accessed on 5 May 2023).


Disclaimer/Publisher’s Note: The statements, opinions and data contained in all publications are solely those of the individual author(s) and contributor(s) and not of MDPI and/or the editor(s). MDPI and/or the editor(s) disclaim responsibility for any injury to people or property resulting from any ideas, methods, instructions or products referred to in the content. |
© 2023 by the authors. Licensee MDPI, Basel, Switzerland. This article is an open access article distributed under the terms and conditions of the Creative Commons Attribution (CC BY) license (https://creativecommons.org/licenses/by/4.0/).