Abstract
The discovery of concretions of Chang 7 shale formations in the Ordos basin has increased interest in the exploration of lacustrine carbonate genesis in these basins. In this paper, these concretions were sampled and used in major, trace, and isotopic geochemistry tests. We used a microscope to investigate these concretions, and the results showed that the concretions consisted of carbonate rocks, the calcite was hydrothermal calcite, and obvious hydrothermal activity was present in the Yanchang period. We used seismic data to interpret the faults, and we determined that tectonic activity was relatively frequent in the middle–late Triassic period and that the faults were channels for hydrothermal upwelling. During the middle–late Triassic period, tectonic movement of the basin occurred, and synsedimentary faults developed in the Yanchang Formation. As deep hydrothermal gushers rose through faults and fractures, they carried particles upward through the deep limestone strata. When the hydrothermal gushers reached the lake bottom, the particles precipitated and eventually formed concretions via diagenesis.
1. Introduction
The hot fluid in sedimentary basins not only has an important effect on the temperature, pressure, and chemical field of the basins, but also plays an important role in the water–rock interactions and the generation, migration, and accumulation of oil and gas in the basins [1,2,3,4]. Scholars have analyzed the relationship between hot water deposition and the spatial and temporal configuration of source rocks [1,5], the effect of hot water deposition on organic matter enrichment [6,7,8,9,10], the effect of hot water deposition on special trace elements, etc. [11].
The Ordos basin is a typical continental lake basin that formed during the deposition of the Yanchang Formation. Many scholars have also found evidence of various hydrothermal activities occurring during this time [12]. Based on the results of studies exploring the micro-organisms in Chang 7 source rocks, scholars think that these rocks were affected by brief hydrothermal activity [13], the characteristics of high-gamma-ray sandstones in the Chang 6 formation [14,15], the large amounts of tuff in the Chang 7 formation, etc. [16,17]. García [18] thinks that the sedimentary limestone in the lacustrine basin is also evidence of hydrothermal activity. When hydrochloric acid was dropped on the nodules, foam was formed, and the concretions were suspected to have carbonate components. Because the concretions are composed of shale formations, we studied the petrological and geochemical characteristics of the carbonate concretions. By analyzing the formation mechanism of the concretions, we can speculate on how the high-quality source rocks in this area developed, which could provide a reference for oil and gas exploration in this area.
2. Geological Setting
2.1. The Ordos Basin
The Ordos basin is in North–Central China; it covers an area of 250,000 km2 and contains various energy resources such as oil, gas, coal, and uranium. The oil-bearing formations are mainly the Upper Triassic Yanchang and Middle Jurassic formations, and the coal resources are distributed in the Late Paleozoic Carboniferous–Permian and Mesozoic, Jurassic, and Triassic strata, whereby the oil is in the upper northern part of the strata and the gas is in the lower southern part of the strata [19]. Tectonic activities around the basin are relatively frequent, and earthquakes and volcanic eruptions occur in some areas. The internal structure of the basin is relatively simple: it has a gentle slope with a dip angle of less than 1°. According to the current structural form of the basin, it can be divided into six tectonic units: the Yimeng Uplift, the Western Thrust Belt, the Tianhuan Depression, the Weibei Uplift, the Jinxi Flexure Belt, and the Yishan Slope (Figure 1).
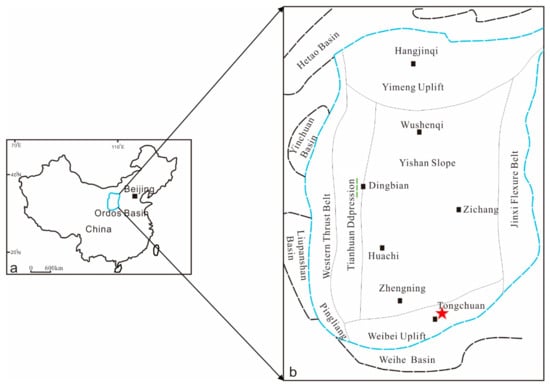
Figure 1.
(a) Regional location and (b) simplified structure of the Ordos basin and data used in this study; the red star is the sampling location [20].
2.2. Deposit Geology
The Ordos basin is a large inland sedimentary basin that formed during the middle–late Triassic period, during which a set of river–delta–lake facies appeared. Its sedimentary filling includes five stages, which are the initial depression, strong depression, progressive filling, uplift and shrinkage, and erosion and extinction [21,22]. According to the evolution characteristics of the lake basin, the Yanchang Formation can be divided into ten subunits (five sections) named Chang 10 to 1 from bottom to top [23,24,25]: the first section (T3y1) includes Chang 10; the second section (T3y2) includes Chang 9 and 8; the third section (T3y3) includes Chang 7, 6, 5, and 4; the fourth section (T3y4) includes Chang 3 and 2; and the fifth section (T3y5) includes Chang 1, which is generally continuously deposited between each section. The formation in the sampled outcrop profile includes Chang 7, which consists of a set of shales. The formation consists of dark gray mudstone and shale and gray siltstone and tuff, and the corresponding seismic horizon is Tt7. Its characteristics include a high resistance, gamma, and sound velocity and low potential. This shale formation set is relatively stable in the whole area, and it is also the main source rock in the Yanchang Formation (Figure 2).
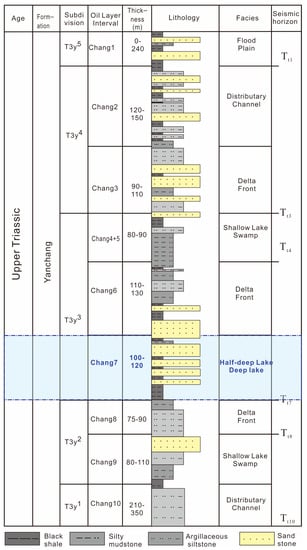
Figure 2.
General stratigraphy of Yanchang Formation showing major tectonic and depositional events. Lacustrine source rocks are concentrated in Chang 7 (modified according to Reference [26]).
3. Material and Methods
A total of 17 concretion samples and their surrounding rocks were analyzed and tested. Thin sections of the sedimentary rock samples were prepared at the State Key Laboratory of Continental Dynamics, Northwest University, and were studied in detail using an optical and scanning electron microscope. The major and trace elements were measured at the State Key Laboratory of Continental Dynamics, Northwest University. The element concentrations were analyzed using inductively coupled plasma optical emission (ICP-OES; Al2O3, CaO, Fe2O3, K2O, MgO, MnO, Na2O, P2O5, TiO2, Ba, and Sr) and mass spectrometry (ICP-MS; V, Zn, Zr, Sc, Cr, Co, Ni, and Cu). Several samples were repeatedly analyzed to determine the precision of the measurements, which was higher than 2% for most of the elements (bwz-30). Carbon–oxygen isotopes were measured using a Thermo Fisher Scientific MAT253 isotope mass spectrometer at the Stable Isotope Laboratory of the Institute of Geology and Geophysics, Chinese Academy of Sciences; Vienna Pee Dee Belemnite (VPDB) was used as the standard sample, and the test error was ±0.02‰. We used a 2D seismic line, which is a zero-phase migration stack profile with a sampling interval of 2 milliseconds, and the main frequency was 35 Hertz.
4. Results
Concretion 1 (six samples), which was located at the Bawangzhuang Quarry, was spherical and hard and ranged from 0.5 to 1 m (Figure 3a). Concretion 2 (five samples), which was located at the back hill of the Bazwangzhuang Quarry, was detached from the undisturbed stratum, hard, and characterized by its disc shape with a diameter of 0.7 m. Concretion 3 (six samples), which was located at Niejiahe, was mainly lens-shaped with an earthen yellow core (Figure 3e). The shale near concretion 3 was bent, and the shale far from concretion 3 was not deformed (Figure 3f).
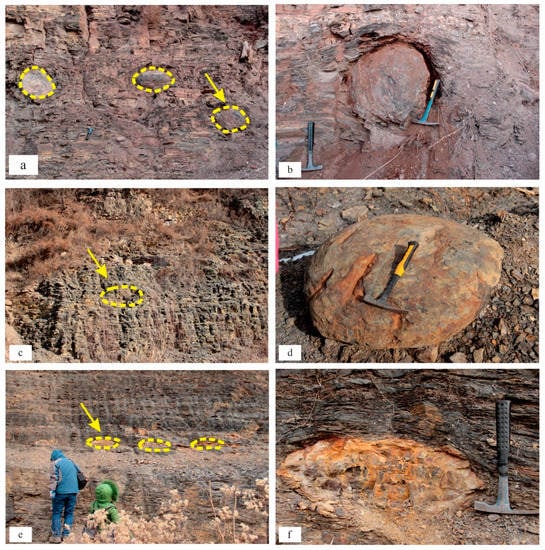
Figure 3.
The location of the concretions. Concretion 1—location: Bawangzhuang Quarry (a,b). Concretion 2—location: back hill of Bawangzhuang (c,d). Concretion 3—location: Niejiahe (e,f). The Yellow circles indicate carbonate concretions on outcrops profile.
4.1. Petrography
Concretion 1 (bwz-30) was a limestone concretion mainly composed of calcite. The concretion contained larger calcites. The calcite was round with a diameter of up to 700 μm (Figure 4a,b); part of the calcite had a radial structure under a single polarized light (Figure 4c) and a cross extinction under orthogonal polarized light (Figure 4d). Only a small part of the outer layer of the spherulites remained fibrous (Figure 4e) with a radial structure. A large amount of oil that was grid-like was seen between the calcite crystals and in the cleavage cracks (Figure 4f).
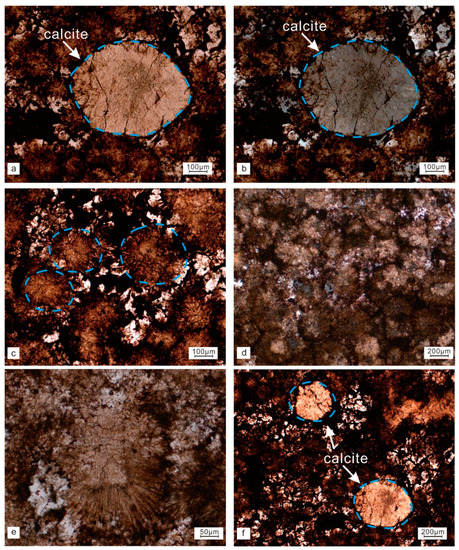
Figure 4.
Microscopic features of concretion 1. Large-grain calcite under single polarized light (a). Large-grain calcite under cross-polarized light (b). Radial felsic under single polarized light (c). Small proportion of radial felsic under cross-polarized light (d). Large-scale fibrous structure under single polarized light (e). Multiple large calcite particles (f). The blue circles indicate calcite block under the microscope.
Concretion 2 was also a limestone concretion (Figure 5a,b). Much organic matter remained among the calcite grains of the secondary limestone under high magnification. A large amount of organic matter fillings was seen in the intergranular and cleavage fractures; when observing the surrounding rock slices of concretion 2, we found that in addition to ordinary shale, the bwz-33 (Figure 5c) and bwz-35 samples of concretion 2 were dolomites (Figure 5d).
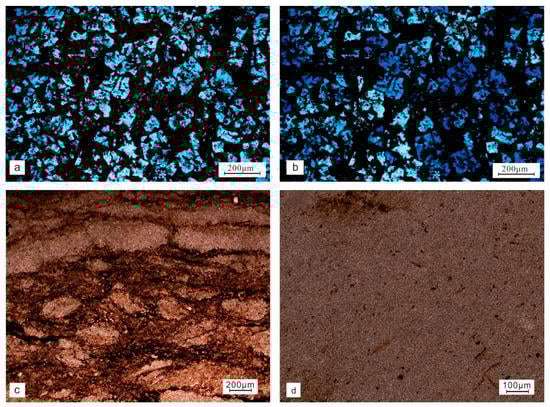
Figure 5.
The microscopic characteristics of concretion 2. Grid-like limestone (bwz-31) under single polarized light (a). Grid-like limestone under cross-polarized light (bwz-31) (b). The dolomite under single polarized light (bwz-33) (c). The dolomite under single polarized light (bwz-35) (d).
Concretion 3 (yq-36, 37, 41) was a dolomite concretion with silty crystalline dolomite (Figure 6a,b), dolomitized altered tuff (Figure 6c), and argillaceous silty dolomite in single polarized light (Figure 6d). The particles were filled with organic matter, and no calcite pellets were seen (such as in the section from Bawangzhuang, Tongchuan). Dolomite is mainly oolitic, and it was the main component of the rock. Most of the spherulites were relatively intact when preserved, and the surface was smooth; additionally, a small part showed spherical irregularity, and the concretion surrounding the rocks consisted of ordinary shale.
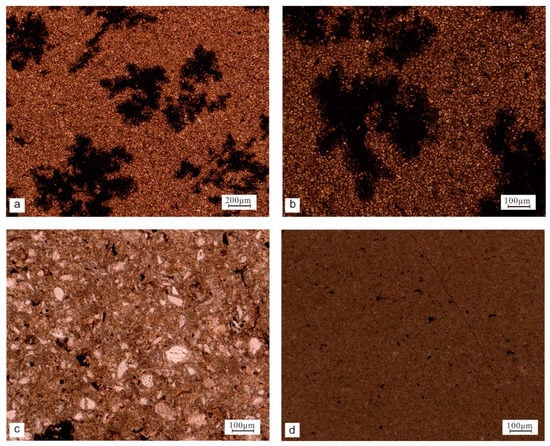
Figure 6.
The microscopic characteristics of concretion 3. Dolomite under single polarized light (yq-37) (a,b). Tuffaceous dolomite under single polarized light (yq-36) (c). Argillaceous dolomite under single polarized light (yq-41) (d).
After observing the three concretions from the Bawangzhuang quarry and the Niejiahe outcrop section of Yaoqu under a microscope, combined with the coupling relationship between them and the surrounding rock bedding, we preliminarily considered that the concretions in the shale of the Chang 7 oil layer group consisted of carbonate rocks.
4.2. Major and Trace Element Geochemistry
According to the results of our analysis of the major elements (Table 1), the major elemental relationships between the concretion cores were as follows (Table 2): the SiO2/(Na2O + K2O) of the concretion ranged from 9.53 to 26.13 (average = 15.46), the Al2O3/(Na2O + K2O) ranged from 2.78 to 4.68 (average = 3.74), the Al2O3/Na2O ranged from 7 to 15.6 (average = 10.11), the K2O/Na2O ranged from 1.13 to 2.33 (average = 1.68), and the SiO2/Na2O ranged from 25.97 to 57.5 (average = 39.9). The MnO value of the concretion 1 core was 1.25, and the average MnO value of the surrounding rock was 0.04. The MnO value of the concretion 2 core was 0.06, and the average MnO value of the surrounding rock was 7.95. The MnO value of the concretion 3 core ranged from 9.53 to 16.69 (average = 14), and the average value of the surrounding rock was 0.35.

Table 1.
Major elements of the Chang 7 carbonate concretion samples.
Table 2.
Inter-relationships between carbonate rocks and secondary rock-forming elements of carbonate rocks [27].
According to the results of the trace element analysis (Table 3), the average Yb, Eu, and La values were 1.22, 0.466, and 17.51 ppm, respectively. The U/Th values of concretions 1 and 2 were greater than one (averages = 4.28 and 4.56, respectively), whereas the U/Th value of concretion 3 was less than one, but that of the surrounding rock was greater than one. The ∑REE value of the concretion 1 core was 8.99 × 10⁻⁶, and the ∑REE value of the surrounding rocks ranged from 9.63 × 10⁻⁶ to 160.78 × 10⁻⁶ (average = 91.12 × 10⁻⁶); the ∑REE value of the concretion 2 core was 7.92 × 10⁻⁶, and that of the surrounding rock ranged from 47.24 × 10⁻⁶ to 95.67 × 10⁻⁶ (average = 69.41 × 10⁻⁶); the average ∑REE value of the concretion 3 core was 67.64 × 10⁻⁶, and that of the surrounding rock was 127.75 × 10⁻⁶. The total rare earth element content of the three concretions cores was much smaller than the rare earth element content of the surrounding rock, and much lower than that of North American shale (193.18 μg/g), which indicates that the total content of rare earth elements (∑REE) was relatively deficient.
Table 3.
Trace elements of the Chang 7 carbonate concretion samples.
4.3. Carbon–Oxygen Isotope Geochemistry
δ18O is commonly used to determine the temperature of ancient seawater [28]. Although the oxygen isotope present in a carbonate rock is a function of temperature, the amount of water is much larger than the amount of carbonate rock that balances it, so the isotopic composition of the seawater is unaffected. Epstein [29] used δ18O to calculate the temperature of ancient seawater:
t = 16.9 − 4.2 (δ18O + 0.22) +0.13 (δ18O + 0.22)2
The temperature calculated using formula (1) is shown in Table 4. The δ13CV-PDB in the Upper Triassic formation ranged from 0.5 to 3.5‰, δ18OV-PDB ranged from −4 to −0.6‰ [30], δ13CV-PDB ranged from 1.2 to 12.3‰ (average = 5.45‰), δ18OV-PDB ranged from −16.9 to −10.4‰ (average = −14.35‰), and most of the carbon isotopes of the samples were higher than 3.5‰.
Table 4.
Carbon–oxygen isotope of the Yanchang Formation concretion sample.
5. Discussion
5.1. Evidence of Hydrothermal Activity
By analyzing the content of the major elements, we know that the concretions were sedimentary carbonate rocks [27]. The Chang 7 formation was mainly composed of shale, whereas the concretions were carbonate rocks. We preliminarily speculated that the sedimentary environment of the nodules and shale was different. The abundance of trace elements in the sediments was controlled by three factors: provenance, the sedimentary environment, and diagenesis [31,32,33].
- (1)
- Positive Eu anomaly
Two situations usually cause an Eu abnormality when North American shale formations are standardized in minerals and rocks: one is that the aqueous solution of the mineral precipitation has abnormal Eu enrichment, and the other is that the Eu in the aqueous solution is present in a divalent form. When minerals undergo chemical precipitation, the trivalent Eu enters the mineral lattice later than the divalent Eu; that is, the divalent Eu enters the mineral lattice first. Therefore, the main controlling factor for an Eu anomaly is whether Eu-rich water is present or whether Eu exists in its divalent form. Standardizing the Eu element in the mineral is usually necessary before judging whether an Eu anomaly is present. If the u value is greater than one, the Eu has a positive anomaly, and if the Eu value is less than one, the Eu has a negative anomaly. A positive anomaly of Eu usually reflects the influence of hydrothermal fluid or is related to a reducing environment [34,35,36,37].
We standardized the Eu element content of the three concretions and their surrounding rocks. The calculation formula is as follows:
EuN, SmN, and GdN are standardized values in Formula (2). The calculation results are shown in Figure 7; concretions 1 (bwz-30) and 2 (bwz-31) had an obvious positive Europium anomaly, and concretion 3 (yq-37, 41) had positive Eu abnormalities. The Eu value of sample 40 was close to one. A few positive Eu abnormalities were present in the nonhydrothermal sedimentary dolomite. Therefore, we inferred that the formation of concretions 1, 2, and 3 may have been related to hydrothermal activity [38].
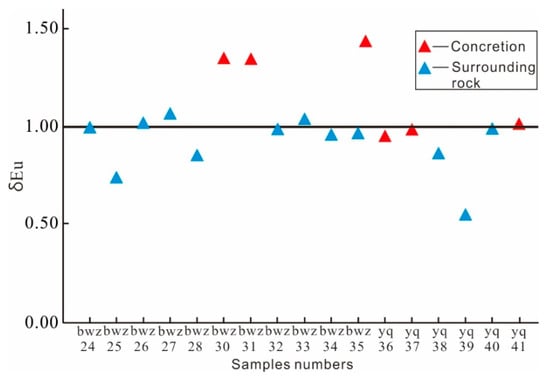
Figure 7.
Europium content in carbonate rock concretions and surrounding rock samples in the outcrop section of the Yanchang Formation.
- (2)
- Yb/Ca–Yb/La relationship
The Yb/Ca–Yb/La relationship diagram is an effective tool to judge the formation and evolution of calcite [39,40,41]. The results of the Yb/Ca–Yb/La diagram (Figure 8) analysis showed that the core samples of concretions 1, 2, and 3 were all in the hydrothermal calcite area, which indicated that the carbonate rocks in the area were subject to a certain degree of hydrothermal action. Some of the surrounding samples were not in this area, which indicated that they were less affected by it. All the samples showed that the core was greatly affected by the hydrothermal fluid, whereas the surrounding rocks were less affected.
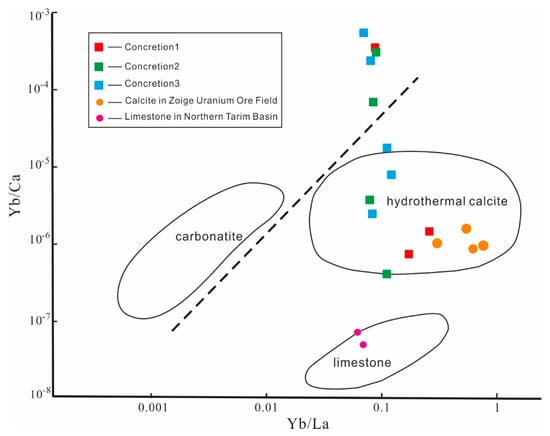
Figure 8.
Yb/Ca-Yb/La relationship of carbonate rock concretions and surrounding rock samples in the outcrop section of the Yanchang Formation; the reference data of yellow dots are from hydrothermal carbonate of Zoige Uranium Ore Field, and the reference data of pink dots are from sedimentary calcite of Northern Tarim Basin.
- (3)
- U/Th ratio
The U and Th elements in sedimentary rocks can be used to judge the sedimentary environment. In an oxidizing environment, the Th content is higher than the U content. Under strong reduction conditions, the U content is generally higher than the Th content, and hot water is also an important factor that leads to a strong reduction. Scholars generally think that the U/Th value in a hot water environment is greater than one, and the U/Th value in a non-hot water environment is less than one [35].
According to the results of the tests run on the samples, the U/Th values of the concretion 1, 2, and 3 samples were mostly greater than one. This may have been caused by weathering and corrosion or hot water deposition (Figure 9).
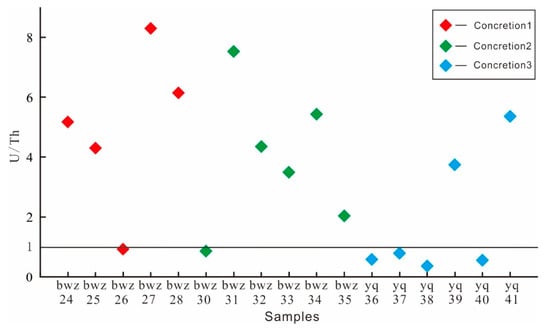
Figure 9.
U/Th ratio of both concretions and surrounding rock samples in the outcrop section of the Yanchang Formation.
- (4)
- REE content
After standardizing the North American shale [42] samples from the study area, we found that the REE distribution pattern curves of concretions 1, 2, and 3 were obviously different from those of the surrounding rocks, and the REE distribution pattern of the surrounding rocks was not considerably different from that of North American shale. The difference between LREE and HREE was not obvious, and obvious positive Eu anomalies were present in concretions 1 and 2 (Figure 10a,b). The LREE in the surrounding rock of concretion 3 was slightly more enriched than the HREE, which appeared slightly more on the left, and no obvious Ce and Eu anomalies were present (Figure 10c). We speculate that the provenance of the three concretions differed from that of the surrounding rock, and they were affected by thermal fluid to varying degrees.
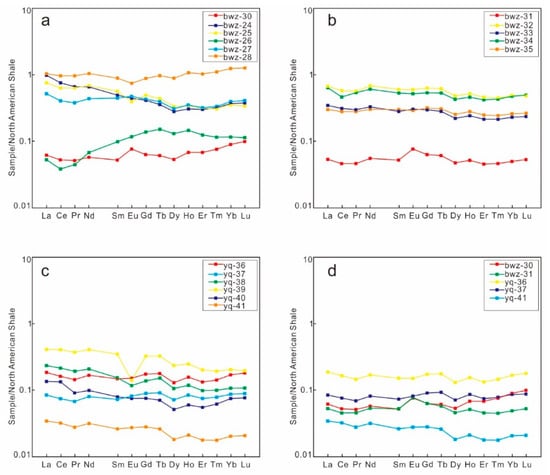
Figure 10.
REE standardization diagram of rare earth elements in carbonate rock concretions and surrounding rock samples in Yanchang Formation outcrop section. (a) The ratio of concretion 1 REE content to its surrounding rock sample; (b) the ratio of concretion 2 REE content to its surrounding rock sample; (c) the ratio of concretion 3 REE content to its surrounding rock sample; and (d) the ratio of REE content of 3 concretions.
- (5)
- Palaeotemperature
The oxygen isotope composition of the concretions was much smaller than that of the ocean during this period, so we concluded that the concretions did not develop during the Chang 7 deposition, which is consistent with the previous assumption that their provenance is inconsistent with that of Chang 7 shale [43,44]. According to the temperature calculated using Formula 2, the samples experienced high temperatures such as 115 and 123 °C, which are far beyond the temperature rises that occurred due to burial depth. Therefore, we speculate that the concretions experienced hydrothermal erosion.
5.2. Tectonic Conditions of Hydrothermal Activity
Tectonic activity is generally considered to be conducive to hydrothermal activity [19], but for a long time, scholars thought that the Ordos basin was a stable craton basin, the internal tectonic activity in the basin was relatively weak, and the sedimentation was stable. Thus, it is unclear whether tectonic activity occurred during the extended period and formed faults, and thus, provided the conditions for hydrothermal upwelling. We used seismic data to study the tectonic activity in the Ordos basin during the extended period and found that a certain scale of synsedimentary faults was present in the extended period (Figure 11 and Figure 12). By interpreting the seismic section, we found that these synsedimentary faults were small in scale and active at all times during the extension period, which means they could have been used as channels for hydrothermal upwelling. These synsedimentary faults have a strong relationship with the basement faults in a plane distribution. Of relevance, some synsedimentary faults directly inherit basement faults, and some synsedimentary faults are new faults developed near these inherited faults [19]. We infer that tectonic activity was relatively frequent in the extended period of the hydrocarbon-rich sag, which provided the necessary conditions for hydrothermal activity and created the conditions needed for the development of high-quality source rocks.
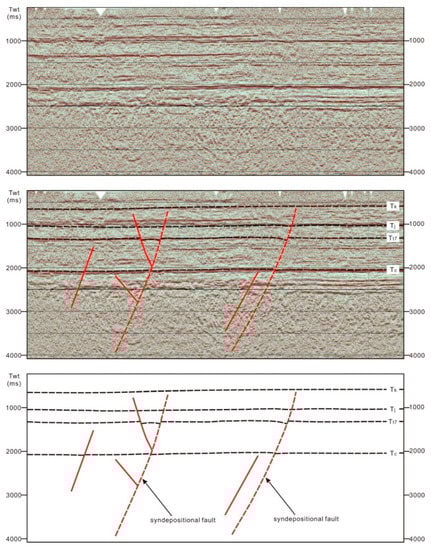
Figure 11.
The morphology of synsedimentary faults during the Triassic Period in the Ordos basin; the plane position is shown in Figure 1.
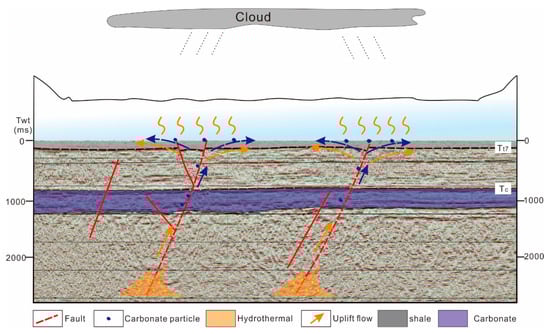
Figure 12.
Carbonite concretion sedimentation model for the middle–late Triassic Yanchang Formations in the Ordos basin.
5.3. Effects of Hydrothermal Activity on Source Rocks
Thermal events mainly had beneficial effects on source rocks in terms of nutrition and catalysis, which increase organic matter generation. In the upwelling process, a hydrothermal event brings many nutrients, which can promote the reproduction of many microorganisms and can also become organic matter catalysts, which promote the generation of organic matter with hydrocarbons. Considering the results of the rock mineralogy analysis, major and trace elements, and carbon–oxygen isotopes of these concretions, we conclude that they were syngenetic with the Chang 7 formation. Due to the strong impact of the Qinling orogenic belt, syndepositional faults and fractures developed in the Yanchang period. Hydrothermal events carried deep carbonate rocks that upwelled into the lake basin along the faults, and the carbonate rocks were rapidly deposited to form the concretions. The minerals from the hydrothermal events not only increased the nutrient content in the water, but they also promoted the growth of organisms in the lake basin and increased the heat required for the thermal evolution of organic matter. As catalysts, these minerals can greatly increase the efficiency of hydrocarbon generation and transformation, and can promote the efficiency by which hydrocarbons are expelled from high-quality source rocks (Figure 12).
6. Conclusions
By analyzing the concretions of Chang 7 shale formations, we elucidated the composition of the concretions and surrounding rock and explored the responses of these concretions to hydrothermal activity. Our results indicated that hydrothermal activity had a remarkable effect on the concretions, whereby a positive Eu anomaly, Yb, and U enriched the concretions and were influenced by hydrothermal activity. The Chang 7 formation is a shale formation, and the sedimentary environment at that time was a lacustrine deposition; we speculate that the formation process of the carbonate concretion was as follows: In the middle and late Triassic periods, tectonic movement of the basin occurred, and synsedimentary faults were developed in the Yanchang Formation. As deep hydrothermal gushers moved upward through faults and cracks, some particles were carried upward through the deep limestone strata, and when the hydrothermal gushers moved down towards the lake bottom, the particles were precipitated, and the present concretions were formed through diagenesis.
Author Contributions
Methodology, C.F.; formal analysis, C.L.; writing—original draft, M.S. All authors have read and agreed to the published version of the manuscript.
Funding
This research was funded by the Shaanxi Provincial Natural Science Basic Research Program (No. 2020JQ-798).
Data Availability Statement
All the data required to evaluate the conclusions of this study are present in the paper. The authors will provide additional data related to this paper upon request.
Conflicts of Interest
The authors declare that no conflict of interest exist regarding the publication of this paper.
References
- Lv, X.; Fu, M.; Zhang, S. The effect of thermal fluid derived from mud diapir on sandstone reservoirs in the Yinggehai Basin, South China Sea. Energy Geos. 2021, 3, 473–484. [Google Scholar] [CrossRef]
- Chandrasekhar, T.; Minissale, A.; Vaselli, O.; Chandrasekharam, D.; Singh, H.K. Understanding the evolution of thermal fluids along the western continental margin of India using geochemical and boron isotope signatures. Geothermics 2018, 74, 197–209. [Google Scholar] [CrossRef]
- Rachmawati, C.; Abdurrahman, M. Geothermal System Boundary at the Northern Edge of Patuha Geothermal Field Based on Integrated Study of Volcanostratigraphy, Geological Field Mapping, and Cool Springs Contamination by Thermal Fluids. In Proceedings of the IOP Conference Series: Earth and Environmental Science, Shanghai, China, 19–22 October 2017; Volume 103, p. 1. [Google Scholar]
- Stefánsson, A.; Hilton, D.R.; Sveinbjörnsdóttir, Á.E.; Torssander, P.; Heinemeier, J.; Barnes, J.D.; Arnórsson, S. Isotope systematics of Icelandic thermal fluids. J. Volc. Geo. Res. 2017, 337, 146–164. [Google Scholar] [CrossRef]
- Pszonka, J.; Schluz, B. SEM Automated Mineralogy applied for the quantification of mineral and textural sorting in submarine sediment gravity flows. Gospod. Surowcami Miner. Miner. Resour. Manag. 2022, 38, 105–131. [Google Scholar]
- Bernd, R.; Simoneit, A.; Tarek, A. Hydrothermal petroleum from lacustrine sedimentary organic matter in the East African Rift. Appl. Geochem. 2000, 15, 355–368. [Google Scholar]
- Tiercelin, J.; BouleÁgue, J.; Simoneit, B. Hydrocarbons, sulphides, and carbonate deposits related to sublacustrine hydrothermal seeps in the North Tanganyika Trough, East African Rift. Bitum. Ore Depos. 1993, 9, 96–113. [Google Scholar]
- Pszonka, J.; Wendorff, M.; Godlewski, P. Sensitivity of marginal basins in recording global icehouse and regional tectonic controls on sedimentation. Example of the Cergowa Basin, (Oligocene) Outer Carpathians. Sedim. Geo. 2023, 444, 106326. [Google Scholar] [CrossRef]
- Jin, Q.; Zhu, G. Progress in Research of Deposition of Oil Source Rocks in Saline Lakes and Their Hydrocarbon Generation. Geol. J. China Univ. 2006, 12, 483–492. [Google Scholar]
- Jia, Z.; Hou, D.; Sun, D. Characteristics and geological implications of rare earth elements in black shale in hydrothermal sedimentation areas: A case study from the Lower Cambrian Niuti-tang Fm shale in central and eastern Guizhou. Nat. Gas Ind. 2018, 38, 5. [Google Scholar]
- Zhang, W.; Yang, H.; Xie, L.; Yang, Y. Lake-bottom hydrothermal activities and their influence on high-quality source rock development: A case from Chang 7 source rocks in Ordos Basin. Petrol. Etrol. Explor. Dev. 2010, 37, 424–429. [Google Scholar]
- Liu, C.; Zhao, J.; Ma, Y.; Wang, J.; Xiong, L.; Chen, J.; Mao, G.; Zhang, D.; Deng, Y. The advances and problems in the study of the characteristics and formation of hydrocarbon-rich sag. Earth Sci. Front. 2014, 2, 75–88. [Google Scholar]
- Zhang, W.; Yang, H.; Xie, L.; Xie, G. Discobery of micro-and nannofossils in high grade hydrocarbon souece rocks of the Triassic Yangchang formation chang7 member in Ordos Basin and its scientific significance. Acta Pal. Sin. 2011, 50, 109–117. [Google Scholar]
- Li, R.; Duan, L.; Chen, B.; Xia, B.; Li, J. Albitization and hydrothermal diagenesis of Yanchang oil sandstone reservoir, Ordos Basin. Acta Petro. Min. 2012, 31, 173–180. [Google Scholar]
- Liu, X.; Liu, Y.; Zhou, D.; Li, H.; Cheng, X.; Nan, Y. Deep fluid tracer in Ordos Basin: Characteristics and origin of high natural gamma sandstons in Triassic Yanchang Formation. Earth Sci. Front. 2013, 20, 149–165. [Google Scholar]
- Qiu, X.; Liu, C.; Li, Y.; Mao, G.; Wang, J. Distribution characteristics and geological significances of tuff interlayers in Yanchagn formation of Ordos Basin. Acta Sedim. Sin. 2009, 27, 1138–1146. [Google Scholar]
- Wang, J.; Liu, C.; Li, C.; Wu, T.; Wu, J. Geochronology, potential source and regional implications of tuff interevals in Chang-7 member of Yanchang formation. Acta Sedim. Sin. 2017, 35, 691–704. [Google Scholar]
- García, J.; Guerra-Merch, A.; Serrano, F.; Palmqvist, P.; Flores-Moya, A.; Martínez-Navarro, B. Hydrothermal activity and its paleoecological implications in the latest Miocene to Middle Pleistocene lacustrine environments of the Baza Basin. Betic Cor. SE Spain 2014, 96, 204–221. [Google Scholar]
- Liu, C.; Wang, J.; Qiu, X.; Zhang, D.; Zhao, J.; Zhao, H.; Deng, Y. Geodynamic environment and tectonic attributes of the hydrocarbon-rich sag in Yanchang Period of Middle-Late Triassic, Ordos Basin. Acta Petrol. Sin. 2020, 36, 1913–1930. [Google Scholar]
- Xu, L.; Zhou, L.; Zhang, Y. Characteristics and tectonic setting of tectono-stress field of Ord-os basin. Geotecton. et Metallog. 2006, 04, 455–462. [Google Scholar]
- Zhang, Y.; Liao, C. Transition of the Late Mesozoic-Cenozoic tectonic regimes and modification of the Ordos basin. Geol. China 2006, 33, 28–40. [Google Scholar]
- Li, W.; Pang, J.; Cao, H.; Xiao, L.; Wang, R. Space-Time Coordinate of the Evolution and Reformation and Mineralization Response in Ordos Basin. Acta Geol. Sin. 2006, 80, 5. [Google Scholar]
- Li, F.; Wang, D.; Zhang, Q.; Xu, X. Sedimentary facies characteristic and sequence stratigraphy analysis of Yanchang formation in longdong area Ordos Basin. Acta Sedim. Sin. 2006, 24, 549–554. [Google Scholar]
- Li, W.; Pang, J.; Cao, H.; Xiao, L.; Wang, R. Depositional system and paleographic evolution of the late Triassic Yanchang Stage in Ordos Basin. J. N. Univ. 2009, 39, 501–506. [Google Scholar]
- Yang, H.; Zhang, W.; Jiu, C.; Ma, J. Geochemical Characteristics of Ordovician Subsalt Gas Reservoir and Their Significance for Reunder standing the Gas Source of Jingbian Gas field, East Ordos Basin. Nat. Gas Geo. 2009, 20, 8–14. [Google Scholar]
- Xia, Y.; Jiao, G.; Xu, L. Research on Sequence Stratigraphic Modes in Upper Triassic Series in Ordos Basin. Pet. Geol. 2007, 12, 8–13. [Google Scholar]
- Liu, T. Criterion distinguishing magmatic carbonatite and sedimentary carbonate rocks by rock-from, Ngelements. Min. Rocks 1988, 8, 50–59. [Google Scholar]
- Korte, C.; Kozur, H.; Veizer, J. δ13C and δ18O values of Triassic brachiopods and carbonate rocks asproxies for coeval seawater and palaeotemperature. Pal. Pal. Pal. 2005, 226, 287–306. [Google Scholar]
- Hao, S.; Li, Z.; Li, W. Sedimentary characteristics of turbidite of Chang 7 member in southwestern Ordos Basin. Geol. Bul. China 2016, 35, 424–432. [Google Scholar]
- Haskin, L.; Wildeman, T.; Freyf, A. Rare earths in sediments. J. Geo-Phys. Res. 1966, 71, 6091–6105. [Google Scholar] [CrossRef]
- Zhao, Z.; Zhou, L. REE geochemistry of some alkali-rich intrusive rocks in China. Sci. China 1997, 40, 145–158. [Google Scholar] [CrossRef]
- Yang, S.; Li, C.; Zhang, J. Provenance Study of Holocene Sediments in Subei Coastal Plain-Comparison between elemental geochemistry and heavy mineral methods. Acta Sedim. Sin. 1999, 17, 458–463. [Google Scholar]
- Xu, Z.; Cheng, R.; Zhang, L.; Wang, L. Transgression−regression event element geochemistry records of southwestern Fujian in Late Triassic-Middle Jurassic. J. Cent. Univ. 2013, 20, 2819–2829. [Google Scholar] [CrossRef]
- Rona, P. Criteria for recognition of hydrothermal mineral deposits in oceanic crust. Eco. Geol. 1978, 73, 135–160. [Google Scholar] [CrossRef]
- Marchig, V. Some geochemistry indicators for discrimination between diagenetic and hydrothermal metalliferous sediments. Mar. Geol. 1982, 58, 241–256. [Google Scholar] [CrossRef]
- Herzig, P.; Becker, K.; Stoffers, P. Hydrothermal silica chimney fields in the Galapagos Spreading Center at 86° W. Ear. Planet. Sci. Let. 1988, 89, 261–272. [Google Scholar] [CrossRef]
- Sun, X.; Chen, J.; Liu, W.; Zheng, J. The process of hydrothermal fluids and reflecting upon formation of oil and gas. Nat. Gas Geosci. 2003, 14, 215–219. [Google Scholar]
- Wang, X.; Shen, J.; Chen, D.; Yang, H.; Wang, Y. Dolomite types and trace element geochemistry of the early paleozoic strata in the keeping-Bachu area, Tarim basin. J. Min. Petrol. 2011, 31, 23–32. [Google Scholar]
- Maravic, H.; Morteani, G. Petrology and geochemistry of the carbonatite and syenite complex of Lueshe (N. E. Zaire). Lithos 1980, 13, 159–170. [Google Scholar] [CrossRef]
- Cui, H.; Guan, P.; Jian, X. Magmatic Hydrothermal Fluids-Formation Water Compound System and Diagenetic Response of Carbonate Reservoir Rocks in Northern Tarim Basin. Acta Sci. Nat. Univ. Pek. 2012, 48, 434–443. [Google Scholar]
- Chen, Y.; Wei, J.; Ye, Y. Significance and geochemical characteristics of Ree and carbon-oxygen isotopes of calcites in the Zoige uranium orefield in sichuan province, China. Adv. Earth Sci. 2012, 27, 1061–1067. [Google Scholar]
- Gromet, L.P.; Haskin, L.A.; Korote, R.L. The “North American shale composite”: Its compilation, major and trace element characteristics. Geo. Cosmo. Acta 1984, 48, 2469–2482. [Google Scholar] [CrossRef]
- Fu, J.; Guo Zh Deng, X. Sedimentary facies of Yanchang Formation of upper Triassic and petroleum geological implication in the southwestern Ordos Basin. J. Pal. 2005, 7, 35–44. [Google Scholar]
- Yang, H.; Dou, W.; Liu, X.; Zhang, C. Analysis on sedimentary facies of member 7 in Yanch-ang Formation of Triassic in Ordos Basin. Acta Sedm. Sin. 2010, 28, 254–263. [Google Scholar]
Disclaimer/Publisher’s Note: The statements, opinions and data contained in all publications are solely those of the individual author(s) and contributor(s) and not of MDPI and/or the editor(s). MDPI and/or the editor(s) disclaim responsibility for any injury to people or property resulting from any ideas, methods, instructions or products referred to in the content. |
© 2023 by the authors. Licensee MDPI, Basel, Switzerland. This article is an open access article distributed under the terms and conditions of the Creative Commons Attribution (CC BY) license (https://creativecommons.org/licenses/by/4.0/).