Abstract
A glass production furnace requires a considerable amount of energy to allow the correct glass melting process. In this work, a CFD model has been developed in order to simulate the convective flow movements within the molten glass bath of the glass furnace. A heat flux profile has been assigned to the glass free surface to model the combustion process, and the glass has been modelled with thermophysical properties variable with temperature based on its chemical composition. The model has been validated by comparing the flow structure and temperature with a reference work. Subsequently, a flow analysis has been carried out by using different shapes for the heat flux profile and by varying its main parameters. The above heat release profiles are representative of different settings of the combustion operating points and can be useful to understand the effects of different flames (i.e., from different fuels also) on the glass flow structure. It has been demonstrated that only the thermal distribution with a maximum generates two convective macro-cells: the first is necessary for the glass melting, the second for its homogenization. It has also been observed that the length of these vortices is related to the flame length. However, a portion of the flow exits directly from the throat (furnace exit port) without entering into the second cell; a low-quality product will be generated in this case.
1. Introduction
A glass furnace requires a large amount of energy to melt the glass raw material at a temperature of almost 2000 [K]. In recent decades, it has been estimated that the glass industry sector in the EU25 has absorbed 7.8 [GJ] average each year and produced 0.57 tons of CO2 per ton of saleable product [1]. Updated international climate agreements have imposed stringent regulations for energy consumption reduction and for the related pollutant emissions. Specific strategies have been studied to reduce the environmental impact of a glass furnace: optimized regenerative chambers [2,3], raw material preheating system [4], waste gas recirculation [5,6] and air staging [7,8] strategies for NOx reduction. Furthermore, the recent international situation of markets has experienced the problem of supplying raw materials, especially the natural gas (the reference fuel used in the glass production sector). Strategic development processes must be in the containment of energy consumption and use of alternative fuels. It is important to optimize the glass-melting process and demonstrate a good understanding of the flow structure inside the glass bath (to guarantee for glass quality) by varying its main operating parameters, including fuel change. A glass furnace is basically made of a combustion chamber above the melting bath. In the combustion chamber, a diffusive flame forms from the fuel injected into a hot air stream obtained from a heat recovery process to increase the thermodynamic efficiency of the system. The heat generated from the combustion process is transferred by thermal radiation and convection to the glass bath to melt and sustain the reactions of the raw material pushed into the glass tank from lateral ports called “dog houses”. The molten glass recirculates in the glass tank in order to reach the desired degree of homogenization and to obtain a high-quality product.
The flow structure in the molten glass bath of the furnace is mainly characterized by two circulation loops along the longitudinal direction [9]. Under the batch, through the first recirculation the glass melts downwards along the rear wall and then rises near the meeting area with the second recirculation. Then, it flows downward along the front wall and around the second circulation loop and finally exits through the throat. In Figure 1, a scheme of the typical two recirculation loops is reported.
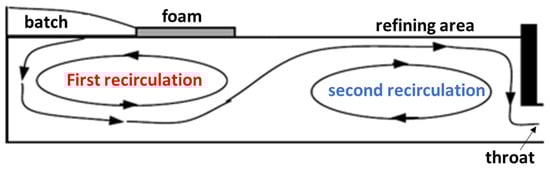
Figure 1.
Scheme of the two recirculation loops inside the glass batch.
In practice, with this path, the first cell allows the melting of the glass still solid (actually present as powder islets and foam), while the second cell is necessary for the homogenization and the subsequent refining of the molten glass. However, Zhiqiang and Zhihao [10] experimentally observed that a part of the molten glass does not enter in the second loop, but it flows directly below at the bottom of the glass tank to the throat. It is clear that in this case the quality of the molten glass is lower, due to the shortened residence time in the bath before exiting to the throat. Different solutions, such bubble generators, are often provided to reduce this behavior by increasing the residence time [11]. Nevertheless, this solution is difficult to optimize because a part of the bubbles remains trapped in the molten glass. Frequent solutions include a wall to divert the flow path and redirect into the second recirculation rather directly to the throat and electrodes located on the bottom of the tank to control the shape and the size of the convective motions through a local boosting of heat flux [12].
Several experimental and numerical studies have been developed to understand the flow structure of molten glass as it travels into the tank of a glass furnace. Curlet et al. [13] simulated the flow pattern in a glass furnace by modelling the batch as a copper-plate cooled with water to maintain the surface of the model fluid (glycerol) at a constant temperature; they included wall cooling and electrical heaters. Ungan and Viskanta [14] observed through a 3D model local convective instabilities called Rayleigh–Bernard-type instabilities below the batch that develop because the liquid at the batch–glass melt interface is heavier than the one on the bottom; these cells tend to increase the heat exchange to the batch. Lim et al. [15] showed that the flow below the batch is oscillatory and chaotic, using a simplified numerical model that neglected the heat transfer with the outside. In another work [16] the heat losses from the furnace walls were included, and they observed that the flow structure (including these cells) varied considerably; other cells developed near the side walls, near the corners, also varying the Rayleigh–Bernard cells. It was shown by Pilon et al. [17] that 2D models are unable to consider the heat exchange of the walls with the outside and that at the centerline only a correct flow structure can be predicted. Several studies with 3D numerical models [18,19] that can also include the thermal coupling between the combustion chamber and the glass bath [20,21,22] have been presented.
Research activities using a CFD model have contributed to the development and study of different strategies for reducing energy consumption and for the abatement of the main polluting emissions. Previous activities were focused on the design of the regenerative chambers [23,24], the pre-heating system of glass raw material [25], the exhausted gas recirculation system [26,27] and the air staging strategies [28]. In this work a 3D CFD model has been developed to separately study the convective motions of the molten glass inside the glass furnace. The glass tank only is considered, and the heat generated by combustion is modelled with an appropriate heat flux profile at the interface between the molten glass and the combustion chamber. Instead, the raw material enters from a portion of the upper interface with appropriate boundary conditions, which take into account the cold temperature and inlet velocity. The glass has been modelled as a fluid with the thermo-physical properties’ functions of the temperature according to the current chemical glass composition. The CFD model has been validated by comparing the predicted flow structure with those of a reference work [17]. Then, the model has been used to understand the effects of the variation of the heat flux profile on the glass bath. The aim is to provide a useful tool in the design phase of the glass bath of a glass furnace in order to optimize the melting and the homogenization process according to a given flame structure (heat flux release profile). This model will be coupled with simulations of the combustion process (performed separately) through the heat flux release profile obtained from the flame structure.
2. Materials and Methods
2.1. Geometry of the Test Case
The geometry of the reference glass furnace is from Pilon’s work [17]. The furnace has a length of 15.85 [m], a width of 7.315 [m] and a height of 2.83 [m]; the free surface of the molten bath is assumed to have a height of 1.03 [m] from the bottom surface. In addition, there are two open sections for the combustion air with a width of 2 [m] and a height of 0.80 [m], placed on the rear wall above the free surface at a 0.20 [m] distance from it (usually equipped with three or four burners each). These openings are typical of end-port-type furnaces and are the entrance and the exit of air and fumes during the regenerative process. The batch of glass raw material is modelled through another opening with a height of 0.20 [m] located along the entire length of the rear wall. The actual raw material feeding process is through one or two side openings called doghouses. The outlet throat of the molten glass is placed in the center at the bottom wall with a dimension of 0.386 [m] × 0.82 [m]. Figure 2 shows a scheme of the glass furnace model.
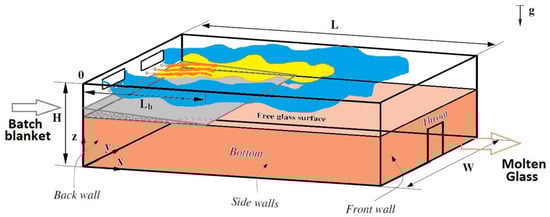
Figure 2.
Scheme of the model glass furnace.
The raw material introduced into the furnace has the following chemical composition in mol%: 74% of SiO2, 16% of Na2O and 10% of CaO. The raw material enters with a mass flow rate equal to 356 [tons/day] (4.12 [kg/s]). Following Madivate’s work [29], about 200 [kg] of gas are produced per ton of inlet batch, therefore the molten glass quantity produced is equal to 297 [tons/day] (3.334 [kg/s]).
2.2. Assumptions and Governing Equations
In the numerical model, a series of simplifying assumptions have been used for the molten glass bath. First, the molten glass is assumed to be incompressible, homogeneous (no gas bubbles or solid silica grains) and a Newtonian fluid. The glass has a laminar regime (due to the very low velocity in the bath) and its chemical composition is constant. Then, the Boussinesq approximation is set (the density linearly depends on the temperature) and the fluid has a constant heat capacity per unit of volume. The free molten glass surface remains horizontal. It is assumed that the input raw material has a profile of decreasing thickness in the longitudinal direction and that a steady melting process is present (the powder melts in the same quantity as loaded). Therefore, the maximum extension of the batch blanket is kept constant and does not move on the melted bath.
The mathematical problem is set using the Reynolds-averaged Navier–Stokes equations. The conservation of mass and momentum take the Eulerian conservative divergence form:
where τ is the tensor of the normal and tangential stress due to viscosity and SM is the momentum source. With the assumption of the laminar flow, no additional turbulence closure is needed. The energy equation is solved in enthalpy form, as in Equation (3):
where the total enthalpy ht is equal to:
The other parameters of the previous equations can be found in [30]. The thermal radiation from the combustion space to the molten glass and the batch, as well as the thermal radiation from the molten glass to the batch, is treated as a diffusion process; the Rosseland approximation has been assumed, where the molten glass and the batch are considered optically thick.
2.3. CFD Model
The flow domain for this study includes only the molten glass bath up to the 1.03 [m] of the furnace described in the previous section. The free surface has been divided into two patches: the first models the solid powder glass at the inlet constant temperature, the second with molten glass only. The domain has been discretized with a structured grid using Ansys ICEM CFD v. 17.1. A set of mesh blocks is set to represent the different geometrical details. The distribution of the nodes is uniform in all the directions, with a cell size along the depth of 30 [mm]. In the three directions, 66 × 39 × 25 elements are generated, corresponding to a global mesh size of 64 kcells. The mesh, shown in Figure 3, has been selected after a careful mesh sensitivity analysis with two other global grid dimensions, respectively of 35 and 120 kcells. The quality of the mesh is very high according to the determinant criterion that is over 0.95.
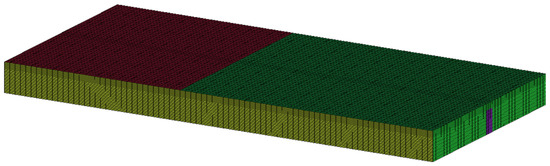
Figure 3.
Structured mesh of the fluid domain of the glass tank.
The code Ansys CFX v. 17.1 has been used as the flow solver. The following boundary conditions have been set: on the patch relating the batch blanket (red surface of Figure 3), a linear decreasing velocity distribution from the rear wall to zero has been set up; the maximum velocity has been calculated from the value with which the powder enters in the furnace from the opening above the free glass surface. In addition, an inclination of 1° with respect to the horizontal line has been assigned; in this way, the decreasing velocity distribution guarantees an inlet glass mass flow rate of 4.12 [kg/s], through the normal velocity component to the boundary. Then, the uniform inlet temperature of 800 [K] has been set and the glass properties are close to a solid. The outlet condition with a mass flow rate of 4.12 [kg/s] has been given to the throat section by ensuring the balance between the glass inflow and outflow in the furnace. The fluid domain has been initialized as a quiescent fluid, with zero velocity in all three directions; moreover, the hydrostatic pressure of the glass as a function of depth has been set by also considering the thickness of the batch floating on it. Finally, all the domains have been initialized with a uniform temperature equal to 1450 [K].
The buoyancy is activated to calculate the convective flow generated by the density gradients into the glass, setting the initial temperature as the reference value and the reference density as 2355 [kg/m3] (reference pressure of 1 [atm]). At the solid walls of the glass tank the no-slip condition is imposed and the local heat transfer coefficient (transmittance U) takes into account the thermal conductivity of the refractory and the external convection with the ambient value at 320 [K]. Following the reference work [17], these values of transmittance have been fixed: side walls U = 3.86 [W/m2K], bottom wall U = 3.89 [W/m2K], and rear and front wall U = 5.57 [W/m2K]. In the remaining top surface, where there is no inlet boundary condition (the green surface of Figure 3), a wall free-slip condition has been set. Finally, a heat flux profile is given on the free surface of the glass on the upper patches (including the batch blanket where a thermal source option has been used). The thermal flux profile is chosen on the basis of industrial practices from the literature [31]. It is important to note that the distribution, shown in Figure 4, is characterized by a maximum heat flux q″max and a negative heat flux near the front wall, where the glass returns the heat previously accumulated to the combustion chamber and not the contrary (the combustion chamber provides heat to the glass bath). The choice of a heat flux distribution instead of the glass surface temperature [32,33] is based on the fact that in actual glass melting furnaces, the furnace operator can decide the fuel firing pattern and thus control the heat flux distribution (through the resulting flame structure) while they do not have direct control over the glass surface temperature.
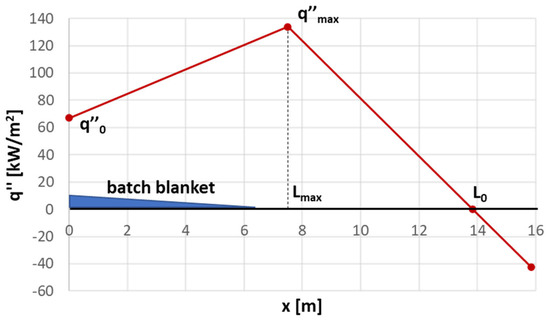
Figure 4.
Heat flux set to the free surface of the glass (baseline case).
The thermal profile trend is defined by four parameters: the heat flux at the back wall q″0, the maximum heat flux q″max, the position of the maximum heat profile from the back wall Lmax and the position L0 where the heat flux is equal to zero. All the equations have been solved with a second-order numerical scheme, and steady flow simulations have been set up by fixing a variable physical timestep from 0.001 [s] to 0.1 [s] for convergence reasons.
2.4. Fluid Properties
The glass has been modelled with the main properties variable with temperature between 1000 [K] and 2000 [K], by considering the chemical composition of 74% SiO2, 16% Na2O and 10% CaO. The density can be approximated by the equation:
where ρ0 is the glass molten density at the reference temperature T0, while β is the linear expansion coefficient that depends strongly on the chemical compositions and takes into account the buoyancy on the molten glass that generates a convective motion. The analysis from the Coenen data [34] estimates β equal to 6.59 × 10⁻⁵ [K−1] for a glass with the chemical composition of 73.8% SiO2, 15.5% Na2O and 10.7 CaO [mol.%]. Despite the fact that the glass density variation in the range can be considered small, the use of a constant value would give an error of 7% compared to the case with the correct density relationship [34]. The glass viscosity of the silicate glass depends strongly on the temperature (expressed in Kelvin as in the following equations), but also on its chemical composition. According to Lakatos et al. [35,36], the dynamic viscosity of the silicate glass with 74% SiO2, 16% Na2O and 10% CaO [mol.%] can be expressed as:
Sharp and Ginther [37] studied the effect of the temperature and chemical composition on the specific heat Cp for the silicate sodium calcium glass; they observed that it varies slightly with the chemical composition [38]; for the glass with 74% SiO2, 16% Na2O and 10% CaO [mol.%] they recommend this expression:
The thermal diffusivity α of the molten glass is an important thermo-physical property used to calculate the heat flux in the molten glass and to calculate the generation and transport of the bubbles. Van Zee and Babcock [39] reported the data for the glass with 72.6% SiO2, 14% Na2O and 13.4% CaO [mol.%] in the temperature range of between 1000 and 1700 [K]. A second-order polynomial fits the experimental data with a good accuracy, and the following expression is used:
From the experimental thermal diffusivity, by knowing the specific heat and the density, an expression for the equivalent thermal conductivity of the molten glass can be used, as in the following equation:
This coefficient takes into account both the thermal conductivity and the thermal radiation of the molten glass.
3. Results and Discussions
3.1. Validation of the Baseline Case
In this section the main flow dynamic distributions predicted by the CFD model are discussed for the reference case and compared to those from the published work [17]. In the reference case, the heat flux profile has the characteristics reported in Table 1.

Table 1.
Main parameters of the thermal flux—baseline case.
The length of the batch blanket Lb = 6.5 [m] has been chosen by using the work of Lim et al. [40], who showed that the batch blanket should cover between 25 to 40% of the glass surface for an optimum melting rate. Instead, the maximum heat flux position has been located at 1 [m] from the top of the batch, while the zero-heat flux position is 2 m away from the front wall. The total energy transferred from the combustion chamber to the molten glass is equal to 8.3 [MW], and from this value q″max has been calculated.
Figure 5, Figure 6 and Figure 7 show the comparisons on the longitudinal mid plane of the distributions obtained from the CFD model with respect to those from the reference [17], respectively: the velocity contours with projected vectors, the velocity streamlines projected on this plane and the temperature contours.
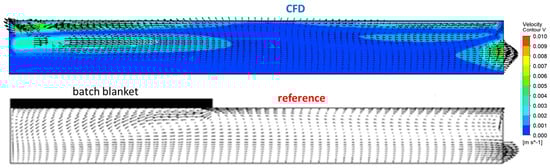
Figure 5.
Velocity contours and vectors on the longitudinal mid plane obtained from the CFD model (upper) compared with the results of the reference work [17] (below).
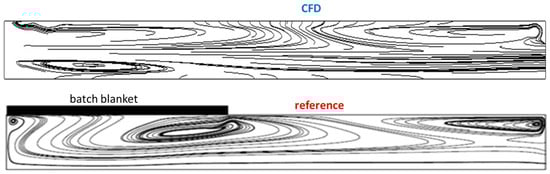
Figure 6.
Velocity streamlines projected on the longitudinal mid plane obtained from the CFD model (upper) compared with the results of the reference work [17] (below).
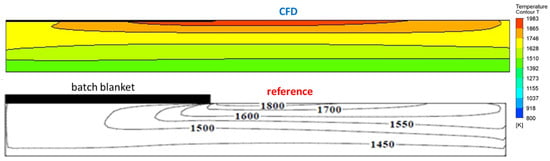
Figure 7.
Temperature contours on the longitudinal mid plane obtained from the CFD model (upper) compared with the results of the reference work [17] (below).
A good match between the above distributions obtained from the two simulation approaches is obtained; every trend is correctly captured. This confirms the validity of the proposed CFD approach to simulate the molten glass flow distributions. The longitudinal flow structure in this bath has essentially two macro-vortices: the first includes, and slightly exceeds, the batch blanket, and the second is towards the front wall. In addition, there is also a third smaller cell, located below the first for the melting of the batch. In the reference work this cell was not identified because they used a lower discretization level with a coarser mesh. A portion of flow does not take part of the second macro-recirculation (without proper mixing into the molten glass) and goes straight to the exit throat. This is probably due to the interaction between the first cell and the other one placed below that drags the above portion below the homogenization area. The highest velocity values are present in the area below the batch blanket, near the throat, with the order of half centimeters per second. On the other hand, in the remaining domain the velocity values are at least one order of magnitude lower, which confirms the long residence time of the powder particles before exiting from the throat to the following molds.
The maximum temperature values are near the free surface in the area centers at Lmax with values over 1800 [K], while on the bottom of the bath there are values below 1400 [K], thus showing a great variability; the isotherm not parallel to the ground are responsible for the temperature gradients that generate the previous convective motions. The lower temperature present toward the bottom surface motivates the use of electric heat boosters in many actual furnace designs (not present in this simplified model). In Figure 8 the velocity streamlines projected on different transversal planes located at 0.1 [m], 7 [m] and 14 [m] are shown.
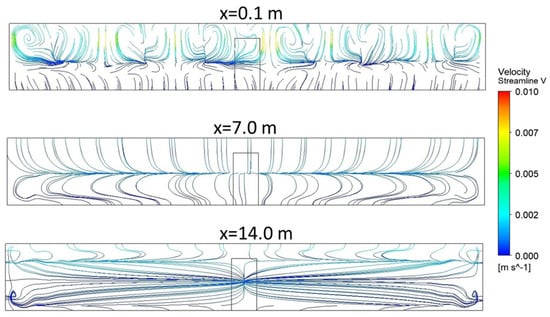
Figure 8.
Velocity streamlines projected on different transversal planes from furnace inlet to exit (throat).
It can be observed that in the first part of the glass tank, immediately below the batch blanket, there are about fifteen Rayleigh–Bernard cells. These gradually smear from the inlet, and in the central area of the furnace there are only two vortices placed in the two lower corners; in fact, heat losses through the sidewalls and the bottom tank create temperature gradients in the lateral direction in proximity of the bottom corners that generate these cells. Close to the throat, in addition to the previous two cells in the lower corners, there are also two other vortices in the corners on the free surface. These are due to the heat losses through the front wall, the sidewalls, and to the combustion space as the negative heat flux increases. On the other hand, the cells forming at the bottom corners are due to the combination of the heat losses through the bottom, the sidewalls, and the front wall. Toward the furnace, close to the front wall, the heat losses to the combustion space increase, so the cells on the free surface blends and extend deeper into the tank, while those in the lower corners appear to be damped by the accelerating flow towards the throat.
3.2. Parametric Analysis of Heat Flux Release from the Combustion Process
Using the proposed CFD model, a flow dynamic analysis has been carried by varying the heat flux profile set on the top that is due to the combustion process above the melted glass surface. The integral total energy transferred from the combustion to the molten glass has been kept constant. The shape of the heat flow profile has been changed from uniform, parabolic and triangular. For the latter configuration, the effect of varying the positions of the zero-heat flux and of the maximum heat flux has been analyzed. Table 2 shows the reference data for the tested cases and Figure 9 the heat flux profile of the dataset.
Table 2.
Dataset of simulations with different heat flux profiles.
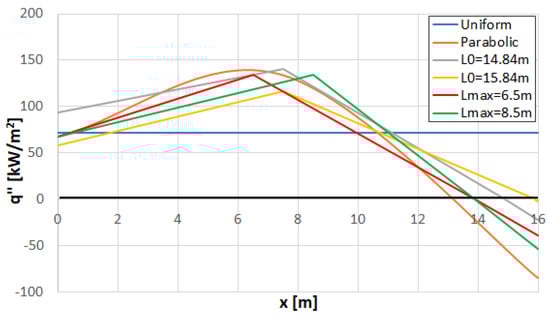
Figure 9.
Heat flux profile of the dataset.
The effect of different flame profiles can be analyzed to model the effect of different combustion processes that can be obtained with a different setup of the burners or by changing the fuel. This can be achieved by varying the velocity of the fuel jet, the diameter of the burner nozzle, the swirl number or even the fuel type and composition. In the following paragraphs the different heat flux profiles are tested. The residence time of the glass particles from the bath inlet has been evaluated through an appropriate post-processing method using the time variable on one thousand streamlines measured at the outlet throat. The effect on this important global parameter (that has a direct influence on the final glass quality) of the different flow structure, induced into the glass bath by the different heat flux profiles, can be quantified.
3.2.1. Uniform and Parabolic
The main difference in the flow structure of the molten glass obtained from a uniform heat flux distribution and from a parabolic profile are discussed. Figure 10, Figure 11 and Figure 12 show the comparison on the mid plane of the velocity streamlines projected on it, the velocity and temperature contours. In Table 3, the averaged residence time of the glass is reported for the two cases.
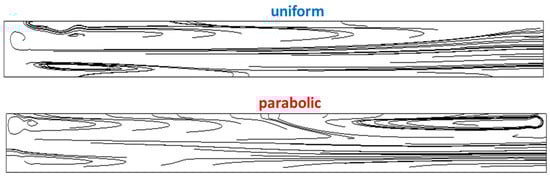
Figure 10.
Velocity streamlines projected on the longitudinal mid plane for different heat flux profiles: uniform (upper) and parabolic (below).
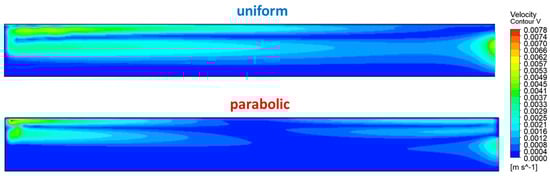
Figure 11.
Velocity contours on the longitudinal mid plane for different heat flux profiles: uniform (upper) and parabolic (below).
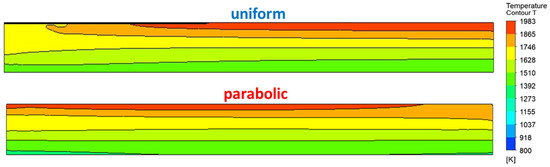
Figure 12.
Temperature contours on the longitudinal mid plane for different heat flux profiles: uniform (upper) and parabolic (below).
Table 3.
Averaged residence time for the uniform and parabolic heat flux profiles.
It can be observed that with the uniform heat flux, only one main convection cell develops; in fact, in this case the temperature gradient has isotherms almost parallel to the free surface in the second half of the bath, opposite to the parabolic case. With only one cell the expected quality of the glass produced would be very poor due to a poor homogenization degree and a shorter residence time. Below this macrocell a substantial portion of the flow is dragged straight into the throat. This is confirmed by the averaged residence time: with the uniform heat flux profile it is almost halved with respect to the parabolic case (same overall heat flux integral). In fact, in this second case, there are two main convection cells (a solution desired in the glass bath) and more glass particles can be trapped into the second cell before leaving through the throat. This is also confirmed by the velocity contours, where in the uniform case the highest velocity area is one and along the entire extension of the bath; in the parabolic case, there are two regions separated longitudinally by a stagnation region at a lower velocity that divides the two cells. In both cases, close to the throat the flow acceleration allows the required mass flow rate, but with a larger accelerating region in the uniform case.
3.2.2. Triangular Heat Flux Profile with Variation of the Position of the Zero-Heat Flux L0
The triangular shaped heat profile is considered, and to evaluate the effect on the flow structure of the convective molten glass motions by varying the position of the zero-heat flux position, L0 has been increased by one and two meters by keeping constant the overall heat transferred from the flame to the glass bath. In Figure 13 the velocity streamlines for cases with L0 equal to 13.84 [m], 14.84 [m] and 15.84 [m] are reported on the longitudinal mid plane. In Figure 14 the averaged residence time trend for the various zero-heat flux positions is shown.
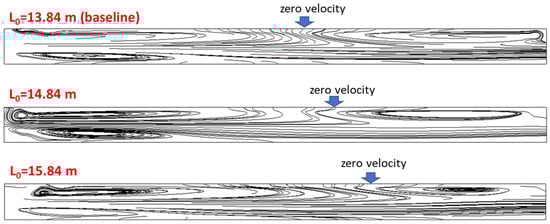
Figure 13.
Velocity streamlines projected on the longitudinal mid plane for different positions of the zero-heat flux.
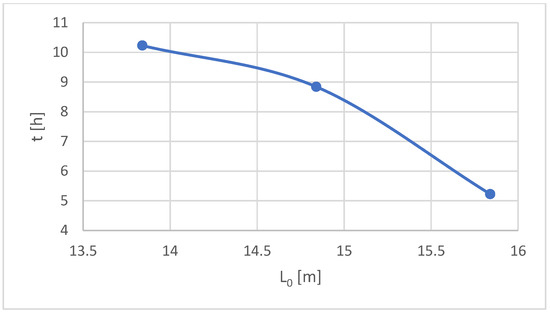
Figure 14.
Averaged residence time trend for the different zero-heat flux positions.
It can be noted that the extension of the second recirculation cell increases significantly when the position of the zero-heat flux is moved towards the furnace center, while the size of the first cell decreases. Therefore, by decreasing L0, although the efficiency of the first cell in melting the glass powder is limited, it allows for the confinement of the non-melted silica grains—and even gas bubbles in the first half of the furnace—away from the throat. This allows for a higher residence time in the second cell and for a homogenization with a better refining process, which results in the higher final quality of the glass. However, in all the above cases, a portion of the flow that is not entrained in any of the main vortices is always clearly visible. It can be observed that the average residence time decreases by increasing L0; in fact, the second cell for the homogenization has lower velocity values with respect to the first cell for the melting. To increase the residence time (to improve the quality of the final glass), it is more important to increase the extension of the homogenization cell.
3.2.3. Triangular Heat Flux Profile with Variation of the Position of the Maximum Heat Flux Lmax
The triangular-shaped heat profile is considered, and to evaluate the effect on the flow structure of the convective molten glass motions by varying the position of the maximum heat flux, it has been moved one meter forward and backward with respect to the baseline. The overall integral heat flux has been kept constant for all the profiles. Figure 15 shows the velocity streamlines projected on the mid longitudinal plane for the case with Lmax equal to 6.5 [m], 7.5 [m] and 8.5 [m]. In Figure 16 the average residence time trend for the different maximum heat flux positions is reported.
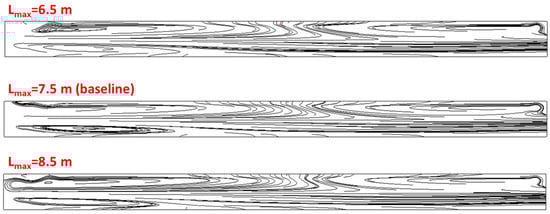
Figure 15.
Velocity streamlines projected on the longitudinal mid plane for different positions of the maximum heat flux.
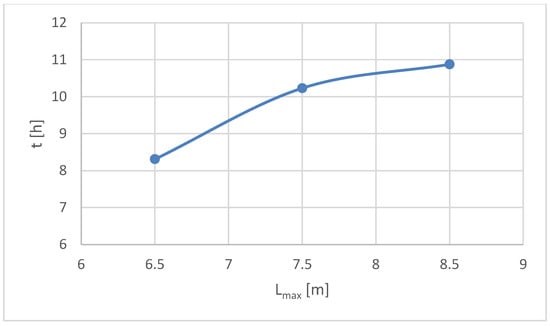
Figure 16.
Averaged residence time trend for the different maximum heat flux positions.
It can be verified that this parameter does not significantly influence the flow structure of the molten glass bath; the limiting streamline between the two macro-vortices varies only slightly. On the other hand, the portion of flow that is not entrained into the second cell is always present and unaltered. There are no significant variations in the averaged residence time with different maximum heat flux; only a slight reduction in residence time occurs by moving the hotspot position towards the inlet. It confirms the lower importance of this flame configuration parameter compared to the zero-heat flux position.
4. Conclusions
A CFD model has been developed to simulate the convective motions in the glass bath in a glass production furnace. The model considers the glass tank only, and the effect of the flame and the heat release from the combustion process is modelled through a heat release profile function. Critical aspects are the proper modelling of the glass thermophysical properties and the wall heat transfer using a transmittance coefficient to take into account the wall structure and the convective heat transfer from the external surface with the ambient. After a model validation, a parametric analysis has been carried out by varying the shape of the assigned heat flux profile. This analysis has shown how a uniform heat flux distribution generated only a convective macrocell in the molten bath, while the distributions with a maximum generate two main macro vortex structures, as also observed experimentally. In every configuration a portion of glass that does not enter into the second recirculation (but goes straight into the exit throat) dragged by a third vortex below the first cell, under the batch blanket, is present. This glass portion is less mixed (lower residence time in the bath), with a lower homogenization degree, and the result is a lower-quality glass being produced. A parametric analysis of the triangular heat flux profile has been performed to analyze the effect of a different flame length (or in general a different combustion process) on the convective glass motions. It has been observed that the position of zero flux has a strong influence on the glass movement (it varies the length of the second recirculation cell), while the position of the maximum value has negligible effects. The simulation model is considered a valuable tool not only because it can support the design of the glass furnace, but also because it can manage it, since it can predict the effects of a different flame structure on the glass flow structures and therefore on the final glass quality. The use of the averaged residence time of glass particles inside the bath can give a quantitative output for the furnace operation condition evaluation strictly linked to the final glass quality. The effects of the electric boosters can be introduced in the model together with the presence of a typical dividing wall close to the exit throat. This simulation approach is considered strategic for the analysis of existing glass plants, highlighting the possible use of an alternative fuel or for the design of new plants. Finally, this model can also be associated with a more complicated multiphase model to predict the corrosion phenomena on the refractory walls and manage maintenance campaigns.
Author Contributions
C.C. and D.M. have equally contributed to the concept of the research activity, the setup of the model, the discussion of the results and the writing of the paper. All authors have read and agreed to the published version of the manuscript.
Funding
This research received no external funding.
Data Availability Statement
Not applicable.
Conflicts of Interest
The authors declare no conflict of interest.
Nomenclature
| Cp | Specific heat coefficient at constant pressure |
| g | Gravity |
| h | Enthalpy |
| H | Height |
| k | Thermal conductivity |
| L | Length |
| p | Static pressure |
| q″ | Heat flux |
| t | Time |
| T | Temperature |
| u | Velocity |
| U | Transmittance |
| W | Width |
| x | Horizontal coordinate |
| α | Thermal diffusivity |
| β | Linear expansion coefficient |
| μ | Viscosity |
| ρ | Density |
| τ | Tensor of tangential and normal stress |
| Subscript | |
| 0 | Zero-heat flux position |
| b | Batch blanket |
| eq | Equivalent |
| max | Maximum |
| t | Total |
References
- Schmitz, A.; Kaminski, J.; Scalet, B.M.; Soria, A. Energy consumption and CO2 emissions of the European glass industry. Energy Policy 2011, 39, 142–155. [Google Scholar] [CrossRef]
- Koshelnik, A.V. Modelling operation of system of recuperative heat exchangers for aero engine with combined use of porosity model and thermos-mechanical model. Glass Ceram. 2008, 65, 301–304. [Google Scholar]
- Basso, D.; Cravero, C.; Reverberi, A.P.; Fabiano, B. CFD Analysis of Regenerative Chambers for Energy Efficiency Improvement in Glass Production Plants. Energies 2015, 8, 8945–8961. [Google Scholar] [CrossRef]
- Selvaray, J.; Varun, V.S.; Vishwam, V. Waste heat recovery from metal casting and scrap preheating using recovered heat. Procedia Eng. 2014, 97, 267–276. [Google Scholar] [CrossRef]
- LIFE Project “LIFE 12ENV/IT/001020”. Available online: http://ec.europa.eu/environment/life/project/Projects (accessed on 14 May 2023).
- Fathi, M.; Saray, R.K.; Checkel, M.D. The influence of Exhaust Gas Recirculation (EGR) on combustion and emissions of n-heptane/natural gas fueled Homogeneous Charge Compression Ignition (HCCI) engines. Appl. Energy 2011, 88, 4719–4724. [Google Scholar] [CrossRef]
- Spliethoff, H.; Greul, U.; Rüdiger, H.; Hein, K.R. Basic effects on NOx emissions in air staging and reburning at a bench-scale test facility. Fuel 1996, 75, 560–564. [Google Scholar] [CrossRef]
- Staiger, B.; Unterberger, S.; Berger, R.; Hein, K.R. Development of an air staging technology to reduce NOx emissions in grate fired boilers. Energy 2005, 30, 1429–1438. [Google Scholar] [CrossRef]
- Zhao, G.; Guo, Z.; Hu, W. Quantitative evaluation for glass fusion processes. In Proceedings of the XVII International Congress on Glass, Beijing, China, 9–14 October 1995; International Academic Publishers: Oxford, UK; Volume 6, pp. 380–385. [Google Scholar]
- Zhiqiang, Y.; Zhihao, Z. Basic flow pattern and its variation in different types of glass tank furnaces. Glass Sci. Technol. 1997, 70, 165–172. [Google Scholar]
- Pokorny, R.; Kruger, A.A.; Hrma, P. Mathematical modeling of cold cap: Effect of bubbling on melting rate. Ceram. Silik. 2014, 58, 296–302. [Google Scholar]
- Chang, S.L.; Zhou, C.; Golchert, B. A numerical investigation of electric heating impacts on solid/liquid glass flow patterns. In Proceedings of the 8th AIAA/ASME Joint Thermophysics and Heat Transfer Conference, St. Louis, MO, USA, 24–26 June 2002; p. 2879. [Google Scholar]
- Curlet, N.W.E.; Won, K.J.; Clomburg, L.A., Jr.; Sarofim, A.F. Experimental and mathematical modeling of three-dimensional natural convection in an enclosure. AIChE J. 1984, 30, 249–257. [Google Scholar] [CrossRef]
- Ungan, A.; Viskanta, R. Three-dimensional numerical modeling of circulation and heat transfer in a glass melting tank. II: Sample simulations. Glastech. Ber. 1987, 60, 115–124. [Google Scholar]
- Lim, K.O.; Lee, K.S.; Song, T.H. Primary and secondary instabilities in a glass-melting surface. Numer. Heat Transf. Part A Appl. 1999, 36, 309–325. [Google Scholar] [CrossRef]
- Ungan, A.; Viskanta, R. Identification of the structure of the three-dimensional flow in an idling container glass melter. Glass Technol. 1987, 28, 252–260. [Google Scholar]
- Pilon, L.; Zhao, G.; Viskanta, R. Three-dimensional flow and thermal structure in glass melting furnaces. Part I: Effect of the net heat flux distribution. Glass Sci. Technol. 2002, 75, 55–68. [Google Scholar]
- Ungan, A.; Viskanta, R. Three-dimensional numerical modeling of circulation and heat transfer in a glass melting tank. I: Mathematical formulation. Glastech. Ber. 1987, 60, 71–78. [Google Scholar]
- Wang, J.; Brewster, B.S.; McQuay, M.Q.; Webb, B.W. Validation of an improved batch model in a coupled combustion space/melt tank/batch melting glass furnace simulation. Glass Sci. Technol. 2000, 73, 299–308. [Google Scholar]
- Kawachi, S.; Iwatsubo, Y. Diagnosis and treatment of bubbles in glass production using a numerical simulator. Glass Sci. Technol. 1999, 72, 207–213. [Google Scholar]
- Schnepper, C.; Jurcik, B.; Champinot, C.; Simon, J.F. Coupled combustion space-glass bath modeling of a float glass melting tank using full oxy-combustion. Ceram. Trans. 1997, 82, 219–224. [Google Scholar]
- Abbassi, A.; Khoshmanesh, K. Numerical simulation and experimental analysis of an industrial glass melting furnace. Appl. Therm. Eng. 2008, 28, 450–459. [Google Scholar] [CrossRef]
- Cravero, C.; Marsano, D. Numerical simulation of regenerative chambers for glass production plants with a non-equilibrium heat transfer model. WSEAS Trans. Heat Mass Transf. 2017, 12, 21–29. [Google Scholar]
- Cravero, C.; Marsano, D.; Spoladore, A. Numerical strategies for fluid-dynamic and heat transfer simulation for regenerative chambers in glass production plants. NAUN Int. J. Math. Model. Methods Appl. Sci. 2017, 11, 82–87. [Google Scholar]
- Cravero, C.; De Domenico, D.; Leutcha, P.J.; Marsano, D. Strategies for the numerical modelling of regenerative pre-heating systems for recycled glass raw material. Math. Model. Eng. Probl. 2019, 6, 324–332. [Google Scholar] [CrossRef]
- Cogliandro, S.; Cravero, C.; Marini, M.; Spoladore, A. Simulation strategies for regenerative chambers in glass production plants with strategic exhaust gas recirculation system. IJHT Int. J. Heat Technol. 2017, 35, S449–S455. [Google Scholar] [CrossRef]
- Cravero, C.; De Domenico, D. The Use of CFD for the Design and Development of Innovative Configurations in Regenerative Glass Production Furnaces. Energies 2019, 12, 2455. [Google Scholar] [CrossRef]
- Cravero, C.; De Domenico, D.; Marsano, D. The Use of Uncertainty Quantification and Numerical Optimization to Support the Design and Operation Management of Air-Staging Gas Recirculation Strategies in Glass Furnaces. Fluids 2023, 8, 76. [Google Scholar] [CrossRef]
- Madivate, C.M.D.O. Calculation of the theoretical energy requirement for melting technical silicate glasses. J. Am. Ceram. Soc. 1998, 81, 3300–3306. [Google Scholar] [CrossRef]
- ANSYS Inc. Ansys CFX Theory Guide v.17; ANSYS Inc.: Canonsburg, PA, USA, 2009. [Google Scholar]
- Kawachi, S. Evaluation of bubble removing performance in a TV glass furnace Part1. Mathematical formulation. Glass Sci. Technol. 1998, 71, 83–91. [Google Scholar]
- Kawachi, S.; Kawase, Y. Evaluation of bubble removing performance in a TV glass furnace. Part 2. verification using real furnace data. Glass Sci. Technol. 1998, 71, 111–119. [Google Scholar]
- Hayes, R.R.; Wang, J.; McQuay, M.Q.; Webb, B.W.; Huber, A.M. Predicted and measured glass surface temperatures in an industrial, regeneratively gas-fired flat glass furnace. Glass Sci. Technol. 1999, 72, 367–377. [Google Scholar]
- Coenen, M. Dichte von „Schlierengläsern “bei hohen Temperaturen. Glastechn. Ber. 1996, 39, 81–89. [Google Scholar]
- Scholze, H. Glass Nature, Structure and Properties, 3rd ed.; Springer: Berlin/Heidelberg, Germany, 1991. [Google Scholar]
- Lakatos, C.; LG, J. Viscosity temperature relations in the glass system SiO2-Al2O3-Na2O-K2O-CaO-MgO in the composition range of technical glasses. Glass Technol. 1972, 13, 88–95. [Google Scholar]
- Sharp, D.E.; Ginther, L.B. Effect of composition and temperature on the specific heat of glass. J. Am. Ceram. Soc. 1951, 34, 260–271. [Google Scholar] [CrossRef]
- Babcock, C.L.; McGraw, D.L. Controlling conductivity in silicates. Glass Ind. 1957, 38, 147–151. [Google Scholar]
- Van Zee, A.F.; Babcock, C.I. A method for the measurement of thermal diffusivity of molten glass. J. Am. Ceram. Soc. 1951, 34, 244–250. [Google Scholar]
- Lim, K.O.; Song, T.H.; Lee, K.S. Patterns of natural convection driven by the free surface temperature distribution in a glass melting furnace. Glass Technol. 1998, 39, 27–31. [Google Scholar]
Disclaimer/Publisher’s Note: The statements, opinions and data contained in all publications are solely those of the individual author(s) and contributor(s) and not of MDPI and/or the editor(s). MDPI and/or the editor(s) disclaim responsibility for any injury to people or property resulting from any ideas, methods, instructions or products referred to in the content. |
© 2023 by the authors. Licensee MDPI, Basel, Switzerland. This article is an open access article distributed under the terms and conditions of the Creative Commons Attribution (CC BY) license (https://creativecommons.org/licenses/by/4.0/).