Article

Influence and Mechanism Study of Ultrasonic Electric Power Input on Heavy Oil Viscosity

1
State Key Laboratory of Acoustics, Institute of Acoustics, Chinese Academy of Sciences, Beijing 100190, China
2
University of Chinese Academy of Sciences, Beijing 100049, China
3
Beijing Engineering Research Center of Sea Deep Drilling and Exploration, Beijing 100190, China
*
Author to whom correspondence should be addressed.
Energies 2023, 16(1), 79; https://doi.org/10.3390/en16010079
Submission received: 15 November 2022 / Revised: 12 December 2022 / Accepted: 16 December 2022 / Published: 21 December 2022
(This article belongs to the Topic Enhanced Oil Recovery Technologies, 2nd Volume)

Abstract

:
The reserves of heavy oil are enormous. However, its high viscosity and other characteristics make heavy oil extraction and transportation extremely difficult. Power ultrasonic (US) reforming technology on heavy oil has the advantages of environmental protection and fast results, so it is important to understand the mechanism of ultrasonic reforming. We examine the influence law of the electric power input of the US transducer on the viscosity of heavy oil. Fourier Transform Infrared Spectrometer (FTIR) and Gas Chromatography (GC) are applied to explain the changes in different functional groups, heavy components, and carbon chains before and after US irradiation. The cavitation noise method is also used to study the influences of variance in the intensity of cavitation on the viscosity of heavy oil. The results indicate that the viscosity of heavy oil first decreases, and next increases with an increase in electric power. The functional groups and chromatographic distillation also change in different forms, and with an increase in electric power, the cavitation effect is gradually enhanced. These findings suggest that it is not that the stronger the cavitation, the greater the influence on the viscosity of heavy oil.

1. Introduction

Oil, one of the three major fossil fuels, remains irreplaceable in the international markets. According to its relative density, oil can be divided into four categories: light, medium, heavy, and extra-heavy crude [1]. Among them, the latter two are called heavy oil globally [2]. Heavy oil reserves are especially abundant, but the high viscosity, high density, and other characteristics of this category of oil make mining, transportation, and subsequent refining difficult and expensive [3,4,5]. At present, the viscosity of heavy oil is mainly changed by altering the chemical composition of heavy oil, or increasing the temperature and pressure [6,7], such as the addition of heating and chemicals. The technology of US modification technology on heavy oil possesses three advantages: low cost, energy conservation, and environmental protection [8,9,10,11].
In the late 20th century, researchers, such as Sokolov and Simkin [12], Yan and Zhang [13], confirmed the feasibility of the application of US technology in heavy oil development. At the beginning of this century, Bjorndalen and Islam [14], Shedid [15], Mousavi et al. [16], and Mullakaev et al. [17] began to explore the influence of factors for the viscosity of oil samples, such as US frequency and irradiation time. Shi et al. [18], Huang et al. [19], and Gao et al. [20] have delved into the relationship between various experimental parameters through Orthogonal Experiments and deepened the research. In recent years, scholars have begun to focus on the mechanism of how ultrasound alters the viscosity of heavy oil. Though Hamidi et al. [21], Jaber et al. [22,23], Cui et al. [24,25], and Liu et al. [26] have explored such a mechanism through chemical analysis and other analytical methods, a consistent conclusion lacks consensus.
The researchers previously cited generally believe that ultrasound mainly changes the internal structure of oil samples by the mechanical effect, cavitation effect, and thermal effect, resulting in viscosity variations of heavy oil. However, we have not seen scholars who have examined whether the cavitation effect exists with the application of ultrasound on heavy oil, or the influence of cavitation intensity on the viscosity of oil samples.
To investigate the relationship between the input electrical power of the US machine and the cavitation intensity, and the mechanism of its effect on the viscosity of heavy oil. In this paper, an experimental platform is built, and we explore the influence of the electric power input of a US transducer on the viscosity of oil samples. The influences of ultrasound on the chemical structure of oil samples are analyzed utilizing several methods of chemical analysis. The existence of the cavitation effect in the application of ultrasound on oil samples is confirmed using a passive cavitation detection method (i.e., a cavitation noise method), and the relationship between cavitation intensity and variations in the viscosity of oil samples is also examined.

2. Materials and Methods

2.1. Experimental Samples and Instruments

2.1.1. Experimental Samples

The original heavy oil sample was extracted from Xinjiang, China. Table 1 shows their viscosity under varied temperatures.

2.1.2. Experimental Instruments

Beakers of 100 mL capacity were utilized to bloom heavy oil samples. A glass rod was used to stir oil samples. The water bath (VIVO Itherm, JULABO, Baden-Wurttemberg, Germany) was applied to make the heavy oil heated.
A US generator was used to irradiate oil samples, the generator being produced by our laboratory. A stopwatch (LOEASE, Guangdong, China) was applied to record the change in time. Hydrophones (8103, B&K, Virum, Denmark) and an Oscilloscope (RTM3004, ROHDE&SCHWARZ, Munich, Germany) were used to receive and preserve noise signals generated by US input on the heavy oil samples. The descriptions of rheometer, FTIR, and GC refer to Gao et al. [27].

2.2. Experimental Samples and Instruments

2.2.1. Preparing of Heavy Oil

The experimental schemes are given in Figure 1. First, each beaker was filled with an original heavy oil sample of approximately 60 mL, subsequently sealed and placed in a 90 °C water bath for more than 3 h, and continuously stirred with a glass rod to ensure even heating of each sample.

2.2.2. Ultrasonic Irradiation

According to the experimental procedures, different parameters were set prior to commencement and during the experiments, including US transducer input electrical power of 50 W, 100 W, or 200 W; US irradiation time of 6 or 12 min; US irradiation mode of intermittent type: irradiating for 3 min firstly, then making the oil samples cool to about 90 °C, next US irradiation for 1 min, and then cooling to 90 °C, repeating it until 6/12 min; The center frequency of a transducer of 18 kHz or so. Refer to Gao et al. [27] for more detailed descriptions of other parameters and guidelines.

2.2.3. Measurement of Acoustic Cavitation Noise

Acoustic cavitation generally refers to the small bubbles irradiated by US wave in a liquid at a certain pressure, and these small bubbles fluctuate, oscillate, or grow, shrink, and break with the changes in sound pressure [28]. The cavitation noise is produced when cavitation occurs, it is extremely complicated, and it includes broadband, super-harmonics, sub-harmonics, harmonics, and fundamental component noise [29]. Acoustic cavitation noise can be used to confirm the existence of cavitation when ultrasound irradiates a liquid, and the cavitation noise spectrum data could be utilized to distinguish the strength of acoustic cavitation [30,31].
This section will use the hydrophone and oscilloscope to receive and collect noise signals generated by US acting on heavy oil to characterize the role of the cavitation effect in the mechanism of the US effect on heavy oil viscosity. Among them, the sampling frequency is 125 kHz, with the sampling mode being to collect the signals every minute after 3 min of US action (oil samples are colloidal in the first three minutes of US irradiation, so it is difficult to collect a signal by hydrophone).

2.2.4. Measure of Viscosity and Chemical Analysis

The oil samples before and after US treatment were poured into the cylinder of the rheometer to measure the changes of viscosity with temperature. The measuring accuracy of temperature and viscosity is ±0.1 °C and ±1%, respectively. We use the viscosity reduction rate (VRR) to indicate the degree of change in viscosity:
VRR = μ 0 μ μ 0 × 100 %
where VRR (%) means the viscosity reduction rate, μ 0   mPa · s means the original viscosity of oil samples, μ   mPa · s means the viscosity after ultrasound irradiation.
Please refer to Gao at al. [27] for a detailed description of viscosity measurement and chemical analysis methods. The chemical analysis along with technical support was provided by the Sinopec Research Institute of Petroleum Processing.

3. Results and Discussions

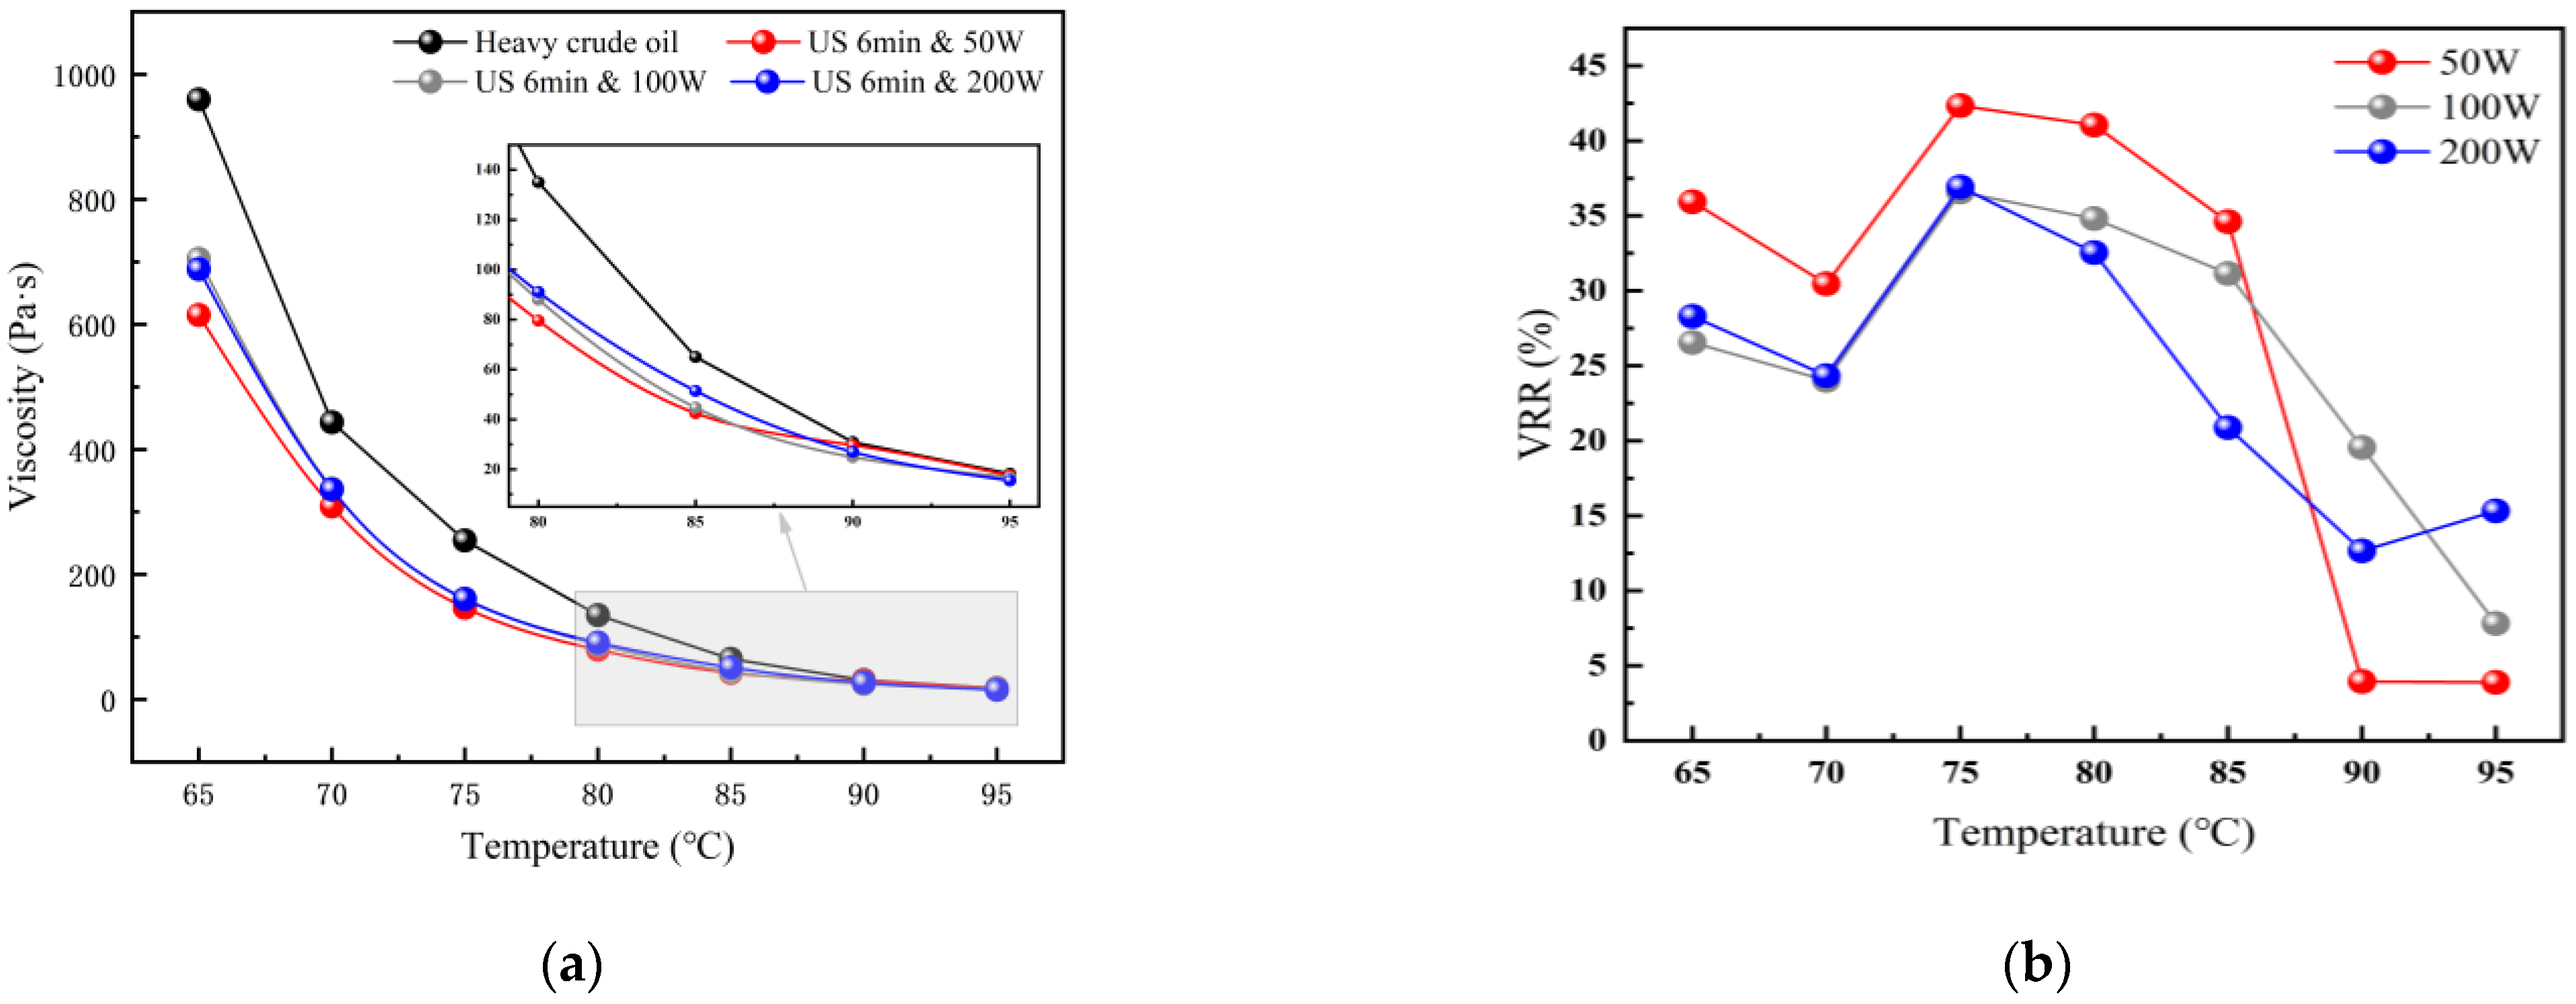
3.1. Viscosity Variation Conditions

3.1.1. US Irradiation 6 min

The results of viscosity variations under different degrees of electric power after 6 min of US action are given in Figure 2. The black, red, gray, and blue curves stand for the conditions of the original oil sample, and electric power 50 W, 100 W, 200 W, respectively. An enlarged figure can clearly represent the viscosity variations from 80 °C to 95 °C in Figure 2a.
As can be seen from Figure 2a, the viscosity of heavy oil samples reduced, and the gap of viscosity under different experimental conditions gradually reduced with the increase in temperature. When the input electric power from the US transducer was 50 W, the viscosity of heavy oil samples reduced the most, and VRR reached 40% at local temperature points. When the electric power gradually increased to 100 W or 200 W, the viscosity of the oil sample increased, and the VRR reached approximately 20%. This is somewhat inconsistent with the research results of Shi et al. and Hamidi et al., who discovered that the viscosity of heavy oil samples decreased with an increase in input power [18,21]. In fact, the type of heavy oil and the style of ultrasonic generator used in the experiments of different scholars are different. The effective sound power of ultrasonic generators produced by most companies is not high, and when the effective sound power of US action on heavy oil increases significantly; we suspect that it may have an inhibitory effect on the viscosity reduction of heavy oil.
Figure 2b shows that the VRR at different temperatures was different and varied greatly, reaching a maximum at 75 °C at different electric power, and decreasing when the temperature gradually rose.

3.1.2. US Irradiation 12 min

Similar to the situation when the US irradiation time was 6 min, when the US irradiation time was 12 min and the input electric power of the transducer was 50 W, the viscosity of oil samples also reduced the most, and the VRR at the local temperature would reach about 40%. When the input power was raised, the viscosity of the oil sample increased, and the viscosity exhibited little difference at 100 W and 200 W.
Figure 3b shows that the VRR under varied input electric powers reached a peak at 75 °C or 80 °C, and the VRR gradually decreased as the temperature rose.
In summary, the viscosity of oil samples under different electric powers at 12 min of US irradiation was higher than that at 6 min at the same level of power, which again verified that an increase in the duration of US irradiation increased the viscosity of oil samples [27]. Additionally, the VRR at 50 W of electric power was higher than that at 100 W and 200 W, regardless of US irradiation duration.

3.2. Results of Chemical Analysis

3.2.1. US Irradiation 6 min

  • FTIR results
FTIR results of different experimental conditions are shown in Figure 4, which reveal a change in transmittance with the corresponding wavenumber. The black, red, gray, and blue curves represent the results of original heavy oil and electric power at 50 W, 100 W, and 200 W, respectively.
As is given in Figure 4, it could be gotten that 719 cm−1 and 747 cm−1 may express the NH out-of-plane bending vibration. The aldehyde C-H out-of-plane bending vibration existed at 809 cm−1 and 861 cm−1. Methyl and methylene angular vibration appeared at 1378 cm−1 and 1458 cm−1. The position of 1605 cm−1 and 2724 cm−1 represented the aromatic ring skeleton vibration, and the aldehyde C-H stretching vibration, severally. The methylene stretching vibration appeared at 2857 cm−1 and 2924 cm−1 [32].
When the US transducer input power was 50 W, the viscosity of the oil sample decreased the most. The amplitude of each characteristic peak changed the most, and their position also changed, indicating that each functional group changed the most at this time. The peak values of the spectral lines at the electric power of 100 W and 200 W were between the original heavy oil and the oil sample at an electric power level of 50 W; the intensity and location of characteristic peaks also changed, which highly conformed to the variation in viscosity.
2.
GC results
Figure 5a shows the chromatographic distillation range results at several levels of electric power. The gray and green bars represent changes in the contents of the distillate and the heavy component oil, respectively. Distillate oil is the crude oil evaporated when the distillation temperature is between 350 and 500 °C, while the one evaporated at a distillation temperature higher than 500 °C is called heavy component oil. The cut point of these two categories of oil is 500 °C. When the US transducer input electric power reached 50 W, the viscosity of the oil sample decreased the most and the contents of distillate increased the most. This is not quite in line with common sense, so we guessed that the errors may be caused by the improper operation when commissioning outside units to do the test. Under other experimental conditions, the contents of distillate and heavy component oil decreased, and the viscosity was lower than the original, but it was higher than the condition of US 6 min, which may have been due to the increase in electric power and cavitation effect, resulting in the volatilization of some components and an increase in viscosity.
Carbon number distribution is a method for characterizing the molecular chain content of different lengths in oil samples. Figure 5b illustrates the analysis results of carbon number distribution at different levels of electric power. The red and cyan bars stand for the changes in the contents from C21 to C40 and over C40, respectively. They all belong to relatively long carbon chains. The same error may exist under ultrasound 50 W and 6 min. It is also possible that the C21–C40 content has increased more, resulting in a relatively lower viscosity when the electric power is 50 W. The contents of long chains both decreased under the other two experimental conditions, resulting in a decrease in viscosity.

3.2.2. US Irradiation 12 min

3.
FTIR results
FTIR results of different input electric powers are given in Figure 6, which describes the conditions after a 12-min duration of US irradiation.
The amplitude of different functional groups under three levels of input electric power was more than those of the initial heavy oil, and the positions of different peaks were also changed, indicating that the functional groups altered and the viscosity of oil sample changed simultaneously. When the electric power was 200 W, the viscosity of the oil sample changed the least, but the different functional groups altered the most, which may have been due to the reorganization of certain components to generate polymer substances, resulting in an increase in viscosity. On the whole, the spectral amplitude at 12 min was lower than that at 6 min, the viscosity reduction rate was also much lower, and these two alterations in principles corresponded well.
4.
GC results
The variation of different fractions of oil samples under different conditions after 12 min of US treatment is shown in Figure 7a. Different levels of electric power could have caused changes in the contents of different components, with the largest change occurring at 50 W. The heavy component contents decreased the most, and this was very closely related to the change in viscosity. The content of the heavy component in the other two cases was between 50 W and the original oil sample, which also corresponds well to the viscosity changes.
Figure 7b gives the results of carbon number distribution under different levels of electric power when the US irradiation duration reached 12 min. The content of long chains decreased at most under ultrasound at 50 W and 12 min; this caused the most changes in viscosity. The ratio of long-carbon chains in the other two cases is between 50 W and the original oil sample, which also corresponds well to the viscosity change.

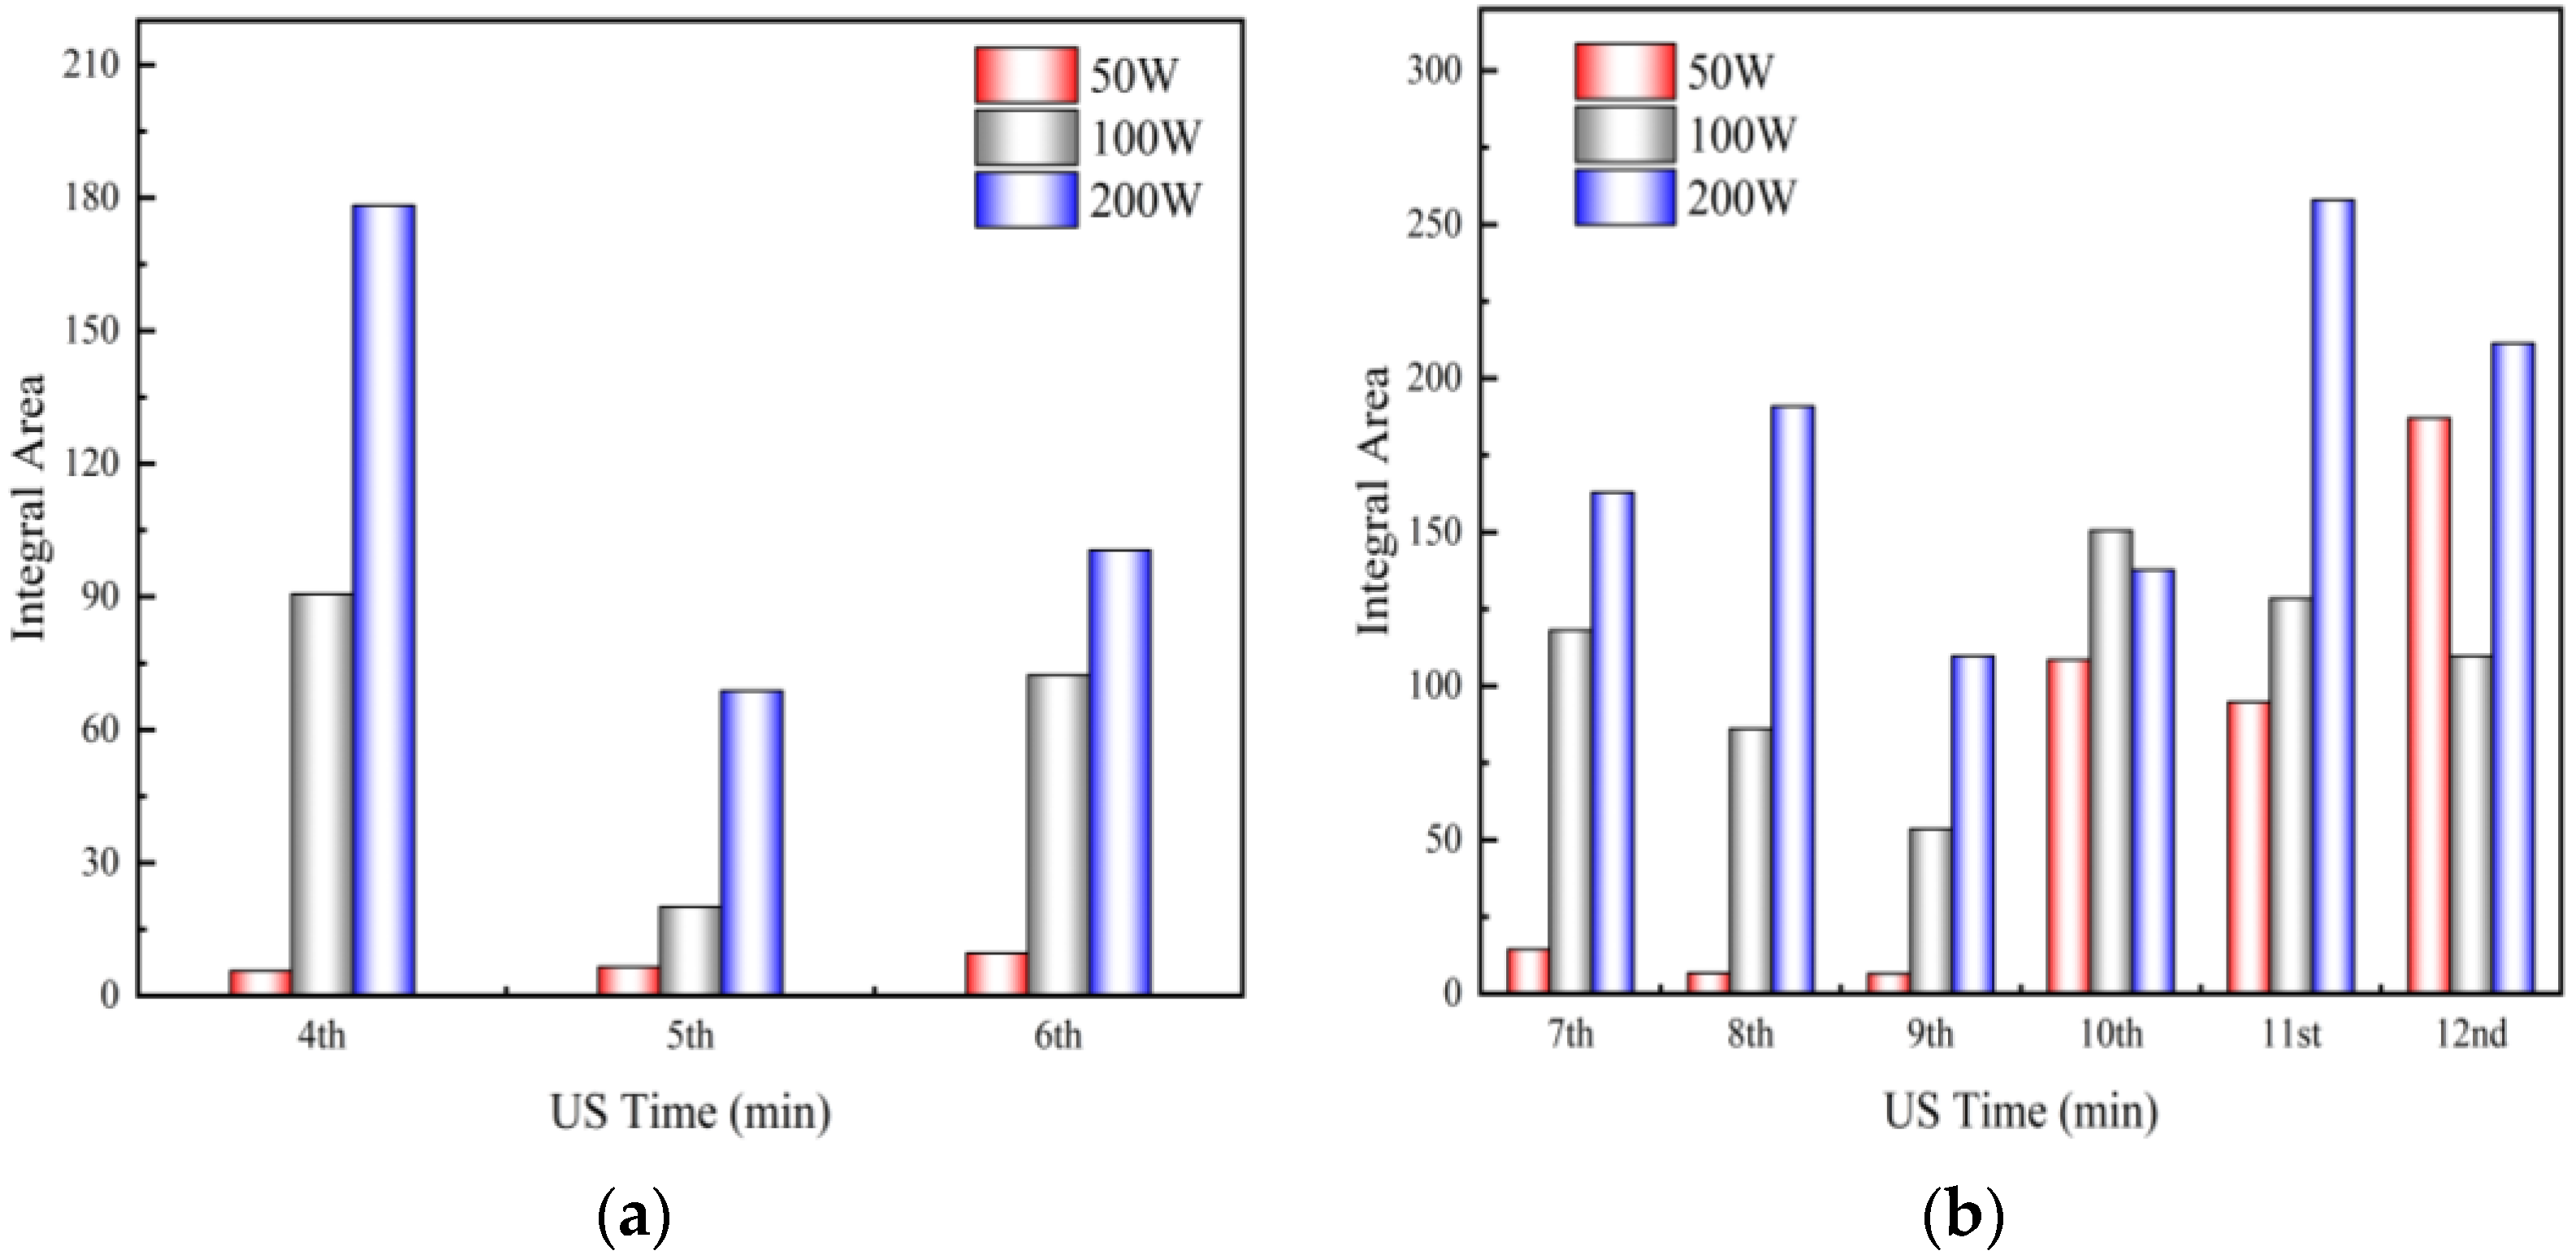
3.3. Cavitation Noise Analysis

The results of noise signal measurement and changes to the Fast Fourier Transform (FFT) are shown below:
The signal information collected under US action of 50 W for 6 min is briefly introduced. Figure 8a is the signal waveform collected at the 4th, 5th-, and 6th-minute points of US action. Because this paper only compares the relative value, the voltage was not converted to sound pressure. Figure 8b shows the results when the time domain signal changes in frequency.
Figure 8b also shows that the peak value of the fundamental (f0 = 18 kHz) is obvious, while the peaks of the subharmonics and ultraharmonics look rather inconspicuous. This may be due to the fact that the broadband noise was stronger, and the resonance peak was submerged, so it is hard to judge the relevant information of cavitation through the subharmonics and ultraharmonics peaks.
The integral area of broadband noise with the horizontal axis (frequency) can be used to evaluate the strength of cavitation [31]. In this section, the cumulative cavitation noise in a period of time is calculated based on real-time spectrum analysis and statistical methods, and the strength of cavitation is explained by comparing the cumulative values under different experimental conditions.
Cumulative cavitation noise was calculated by: (1) Taking the frequency range of 0–40 kHz and removing 50 points near the fundamental and harmonics; (2) Calculating the integral area of broadband noise and frequency axis by the basic definition of calculus; (3) Comparing the results of different input electric powers at the same US irradiation duration, which are shown below:
The red, gray, and blue histograms represent levels of electric power at 50 W, 100 W, and 200 W, respectively. Figure 9 shows that the integral area gradually increased with the increase of the input electric power, indicating that the cavitation effect was steadily enhanced. However, the US irradiation duration of 6 or 12 min both produced a maximum change in viscosity when the electric power was 50 W, indicating that the cavitation was not the stronger, the better. When it reached a certain node, it inhibited the change of viscosity.
The deviation of the integral area at the 10th and 12th minute of US action may have been due to changes in temperature and the internal structure of the oil sample with the increase of the US irradiation duration, resulting in measurement errors.

3.4. Discussion

As seen in Section 3.1, the viscosity of the oil sample decreased the most at most temperature points under ultrasound 50 W, whether US irradiation duration was 6 or 12 min, and increased when the input electric power was 100 W and 200 W. The experimental law was different from others, the power scales used by different scholars were also a little varied, thus weakening the comparability of different experimental results, which was greatly related to the place of production, using mode, and electro-acoustic conversion efficiency of different instruments.
For the results of FTIR, the amplitude and position of different peaks changed a lot more than the original heavy oil, thus the different functional groups became greater than the original heavy oil, with most variations occurring at ultrasound 50 W and 6 min, which led to the variations in viscosity. When ultrasound was irradiated at 50 W and 12 min, the transmittance axis had the least variation, which may volatilize for the light components or the experimental errors.
In fact, the two groups of rules in GC were correlated and had the same variations with changes in electric power levels. The contents of heavy components and long-carbon chains had been reduced, which may be one of the causes of the viscosity reduction of oil samples. However, we speculated that the internal structure of heavy oil is especially complex, and there may be some other reasons for this phenomenon, such as broken bond recombination of molecular chain, uneven change of resin, and/or asphaltene contents.
As for the results of cavitation noise analysis, when ultrasound irradiated the heavy oil, the cavitation effect did exist, and with the increase of electric power, the cavitation effect gradually rose. The viscosity reduced the most at 50 W, indicating that cavitation was not the stronger, the better. Researchers in this study speculate that there was a node. Before the node, the greater the power, the stronger the cavitation, and the greater the viscosity change. After the node, with an increase in power, cavitation was still stronger, but the change of oil viscosity was inhibited.
As a matter of fact, only a part of the input electric power was converted to acoustic power. This part of the acoustic power acted on the oil sample, which produced the cavitation effect, thermal effect, and mechanical effect, causing changes in the internal molecular structure, functional groups, and different component contents of the oil sample, thus leading to variations in the viscosity of oil samples [33,34].

4. Conclusions and Prospect

This research shows that the viscosity decreased under US input electric power for 50 W, but increased when the electric power was raised to 100 W and 200 W. In addition, the viscosity after a US irradiation duration of 12 min became higher than after that of 6 min. Moreover, ultrasound can produce an acoustic cavitation effect when irradiating heavy oil samples, but it may inhibit the decrease of viscosity with an increase in the level of electric power and cavitation. In brief, ultrasound can change the functional groups’ contents, break carbon chains, and alter the internal structure during the thermal, mechanical, and acoustic cavitation effects when irradiating heavy oil samples, thus changing the viscosity. In addition, in order to increase the comparability of experimental results, we will measure the acoustic power as the experimental parameter in future research. What is more, the aspect of combining theoretical prediction models and experimental results for heavy oil viscosity is also worthy of in-depth study [4].

Author Contributions

J.G.: literature research, idea generation, experimental scheme, experiments, data processing, mechanism analysis, writing, and response to the reviewers; P.W.: mechanism analysis, idea generation, review, and response to the reviewers; C.L.: the experimental scheme, and theoretical direction; D.X.: supervision and review; X.W.: supervision, review, and response to the reviewers. All authors have read and agreed to the published version of the manuscript.

Funding

This work was funded by the National Natural Science Foundation of China (Pengfei Wu, No. 11904384; Delong Xu, No. 11474305) and the Key Research Program of Frontier Sciences, CAS (Pengfei Wu, No. ZDBS-LY-SLH037).

Data Availability Statement

Not applicable.

Acknowledgments

Thanks to Weijun Lin, student Yuchen Zang and Guanwen Sun (The Institute of Acoustics, CAS) for the inspiring discussion of theoretical knowledge and data processing. Many thanks to Yaqiong Cui, Zhuxuan Zhao, Xi Li, Xindu Cao, and Tom Conboy (Department of Foreign Languages, UCAS) for help with the English expression and corrections.

Conflicts of Interest

The authors declare no conflict of interest.

Abbreviations

USUltrasonic
FTIRFourier Transform Infrared Spectrometer
GCGas Chromatography
VRRViscosity reduction rate

References

  1. Shishkova, I.; Stratiev, D.; Kolev, I.V.; Nenov, S.; Nedanovski, D.; Atanassov, K.; Ivanov, V.; Ribagin, S. Challenges in petroleum characterization—A review. Energies 2022, 15, 7765. [Google Scholar] [CrossRef]
  2. Li, X.J. Classification and evaluation methods of heavy crude oil resources at home and abroad. Inn. Mong. Petro Chem. Ind. 2008, 34, 61–62. [Google Scholar]
  3. Stratiev, D.; Nenov, S.; Nedanovski, D.; Shishkova, I.; Dinkov, R.; Stratiev, D.D.; Stratiev, D.D.; Sotirov, S.; Sotirova, E.; Atanassova, V.; et al. Empirical modeling of viscosities and softening points of straight-run vacuum residues from different origins and of hydrocracked unconverted vacuum residues obtained in different conversions. Energies 2022, 15, 1755. [Google Scholar] [CrossRef]
  4. Stratiev, D.; Shishkova, I.; Dinkov, R.; Nenov, S.; Sotirov, S.; Sotirova, E.; Kolev, I.; Ivanov, V.; Ribagin, S.; Atanassov, K.; et al. Prediction of petroleum viscosity from molecular weight and density. Fuel 2023, 331, 125679. [Google Scholar] [CrossRef]
  5. Guo, K.; Li, H.; Yu, Z. In-situ heavy and extra-heavy oil recovery: A review. Fuel 2016, 185, 886–902. [Google Scholar] [CrossRef]
  6. Chen, X.F.; Xu, Z.C.; Gong, Q.T.; Wu, D.H.; Zhang, L.; Zhang, L.; Zhao, S. Adsorption of extended anionic surfactants at the water-polymethylmethacrylate interface: The effect of polyoxyethylene groups. Colloids Surf. A Physicochem. Eng. Asp. 2022, 656, 130395. [Google Scholar] [CrossRef]
  7. Li, C.X. Cude Oil Rheology; China University of Petroleum Press: Beijing, China, 2006. [Google Scholar]
  8. Sawarkar, A.N. Cavitation induced upgrading of heavy oil and bottom-of-the-barrel: A review. Ultrason. Sonochem. 2019, 58, 104690. [Google Scholar] [CrossRef]
  9. Rehman, M.M.; Meribout, M. Conventional versus electrical enhanced oil recovery: A review. J. Petrol. Explor. Prod. Technol. 2012, 2, 169–179. [Google Scholar] [CrossRef] [Green Version]
  10. Kadyirov, A.; Karaeva, J. Ultrasonic and heat treatment of crude oils. Energies 2019, 12, 3084. [Google Scholar] [CrossRef] [Green Version]
  11. Avvaru, B.; Venkateswaran, N.; Uppara, P.; Iyengar, S.B.; Katti, S.S. Current knowledge and potential applications of cavitation technologies for the petroleum industry. Ultrason. Sonochem. 2018, 42, 493–507. [Google Scholar] [CrossRef]
  12. Sokolov, A.V.; Simkin, E.M. Study of Influence of Acoustic Treatment on Rheological Properties of Some Oils; All-Union Research Institute of Nuclear Geophysics and Geochemistry: Moscow, Russia, 1981; pp. 137–142. [Google Scholar]
  13. An, X.H.; Zhang, Y.P. The experimental results of reducing viscosity of heavy crude oil by ultrasonic wave. Oil Gasfield Surf. Eng. 1996, 5, 20–21. [Google Scholar]
  14. Bjorndalen, N.; Islam, M.R. The effect of microwave and ultrasonic irradiation on crude oil during production with a horizontal well. J. Pet. Sci. Eng. 2004, 43, 139–150. [Google Scholar] [CrossRef]
  15. Shedid, S.A. An ultrasonic irradiation technique for treatment of asphaltene deposition. J. Pet. Sci. Eng. 2004, 42, 57–70. [Google Scholar] [CrossRef]
  16. Mousavi, S.M.; Ramazani, A.; Najafi, I. Effect of ultrasonic irradiation on rheological properties of asphaltenic crude oils. Pet. Sci. 2012, 9, 82–88. [Google Scholar] [CrossRef] [Green Version]
  17. Mullakaev, M.S.; Volkova, G.I.; Gradov, O.M. Effect of ultrasound on the viscosity-temperature properties of crude oils of various compositions. Theor. Found. Chem. Eng. 2015, 49, 287–296. [Google Scholar] [CrossRef]
  18. Shi, C.W.; Yang, W.; Chen, J. Application and mechanism of ultrasonic static mixer in heavy oil viscosity reduction. Ultrason. Sonochemistry 2017, 37, 648–653. [Google Scholar] [CrossRef]
  19. Huang, X.T.; Zhou, C.H.; Suo, Q.Y.; Wang, S.H. Experimental study on viscosity reduction for residual oil by ultrasonic. Ultrason. Sonochem. 2018, 41, 661–669. [Google Scholar] [CrossRef]
  20. Gao, J.B.; Xu, D.L.; Wang, X.M.; Zhu, C.H. Orthogonal experiments of the heavy oil viscosity reduction by using ultrasonic wave. Petrochem. Technol. 2021, 50, 313–318. [Google Scholar]
  21. Hamidi, H.; Mohammadian, E.; Junin, R.; Rafati, R.; Manan, M.; Azdarpour, A.; Junid, M. A technique for evaluating the oil/heavy-oil viscosity changes under ultrasound in a simulated porous medium. Ultrasonics 2014, 54, 655–662. [Google Scholar] [CrossRef]
  22. Jaber, T.S.; Ali, S.; Hassan, N. The experimental investigation of effect of microwave and ultrasonic waves on the key characteristics of heavy crude oil. J. Anal. Appl. Pyrolysis 2017, 128, 92–101. [Google Scholar]
  23. Jaber, T.S.; Ali, S.; Hassan, N. Analysis of the asphaltene properties of heavy crude oil under ultrasonic and microwave irradiation. J. Anal. Appl. Pyrolysis 2018, 129, 171–180. [Google Scholar]
  24. Cui, J.J.; Zhang, Z.H.; Liu, X.D.; Liu, L.; Peng, J. Studies on viscosity reduction and structural change of crude oil treated with acoustic cavitation. Fuel 2020, 263, 116638. [Google Scholar] [CrossRef]
  25. Cui, J.J.; Zhang, Z.H.; Liu, X.D.; Liu, L.; Peng, J. Analysis of the viscosity reduction of crude oil with nano-Ni catalyst by acoustic cavitation. Fuel 2020, 275, 117976. [Google Scholar] [CrossRef]
  26. Liu, J.; Yang, F.K.; Xia, J.Y.; Wu, F.P.; Pu, C.S. Mechanism of ultrasonic physical-chemical viscosity reduction for different heavy oils. ACS Omega 2021, 6, 2276–2283. [Google Scholar] [CrossRef]
  27. Gao, J.B.; Li, C.; Xu, D.L.; Wu, P.F.; Lin, W.J.; Wang, X.M. The mechanism of ultrasonic irradiation effect on viscosity variations of heavy crude oil. Ultrason. Sonochem. 2021, 81, 105842. [Google Scholar] [CrossRef] [PubMed]
  28. Feng, R. Ultrasonic Manual; Nanjing University Press: Nanjing, China, 1999. [Google Scholar]
  29. Wu, P.F.; Wang, X.M.; Lin, W.J.; Bai, L.X. Acoustic characterization of cavitation intensity: A review. Ultrason. Sonochem. 2022, 82, 105878. [Google Scholar] [CrossRef]
  30. Lauterborn, W.; Cramer, E. Subharmonic route to chaos observed in acoustics. Phys. Rev. Lett. 1981, 47, 1445. [Google Scholar] [CrossRef]
  31. Wu, P.F.; Bai, L.X.; Lin, W.J.; Wang, X.M. Mechanism and dynamics of hydrodynamic-acoustic cavitation. Ultrason. Sonochem. 2018, 49, 89–96. [Google Scholar] [CrossRef]
  32. Weng, S.F.; Xu, Y.Z. Fourier Transform Infrared Spectroscopy, 3rd ed.; Chemical Industry Press: Beijing, China, 2016. [Google Scholar]
  33. Hua, Q. Experimental studies on viscosity reduction of heavy crude oil by ultrasonic irradiation. Acoust. Phys. 2020, 66, 495–500. [Google Scholar]
  34. Lv, S.H.; Peng, S.; Zhang, R.J.; Guo, Z.; Du, W.C.; Zhang, J.; Chen, G. Viscosity reduction of heavy oil by ultrasonic. Petrol. Chem. 2020, 60, 998–1002. [Google Scholar]
Figure 1. Experimental flowchart.
Energies 16 00079 g001
Figure 2. Changes in viscosity under different input power after 6-min ultrasound irradiation: (a) Viscosity–Temperature curve; (b) VRR under different temperatures.
Energies 16 00079 g002
Figure 3. Influences of US action on the changes in viscosity of oil samples: (a) Viscosity–Temperature curve; (b) Changes in VRR with temperature.
Energies 16 00079 g003
Figure 4. FTIR results of US irradiation time 6 min.
Energies 16 00079 g004
Figure 5. GC results of US irradiation time 6 min: (a) Chromatographic distillation range results; (b) Carbon number distribution results.
Energies 16 00079 g005
Figure 6. FTIR results of US irradiation time 12 min.
Energies 16 00079 g006
Figure 7. GC results of US irradiation time 12 min: (a) Chromatographic distillation range results; (b) Carbon number distribution results.
Energies 16 00079 g007
Figure 8. Acoustic cavitation noise signal under ultrasound 6 min and 50 W: (a) The signal of time domain; (b) The signal of the frequency domain.
Energies 16 00079 g008
Figure 9. Variations of the integral area (that is the strength of cavitation) under different experimental conditions: (a) Ultrasonic irradiation time 6 min; (b) Ultrasonic irradiation time 12 min.
Energies 16 00079 g009
Table 1. The viscosity under different temperatures for the original oil sample.
Temperature/°C65707580859095
Viscosity/Pa·s960.000443.750254.444135.00065.00030.91718.263
Disclaimer/Publisher’s Note: The statements, opinions and data contained in all publications are solely those of the individual author(s) and contributor(s) and not of MDPI and/or the editor(s). MDPI and/or the editor(s) disclaim responsibility for any injury to people or property resulting from any ideas, methods, instructions or products referred to in the content.

