Article

Effectiveness of Butanol and Deposit Control Additive in Fuel to Reduce Deposits of Gasoline Direct Injection Engine Injectors

1
Faculty of Civil and Transport Engineering, Poznan University of Technology, 60-965 Poznan, Poland
2
Oil and Gas Institute—National Research Institute, 31-503 Krakow, Poland
*
Author to whom correspondence should be addressed.
Energies 2023, 16(1), 77; https://doi.org/10.3390/en16010077
Submission received: 3 December 2022 / Revised: 16 December 2022 / Accepted: 19 December 2022 / Published: 21 December 2022
(This article belongs to the Special Issue Combustion Engine Applications)

Abstract

:
Modern internal combustion engines are designed to meet new emission standards and reduce fuel consumption. The wide application of direct fuel injection is associated with the problem of injector contamination. It leads to a deterioration of the engine’s environmental performance. The paper aims to evaluate the effect of applying gasoline–butanol blends and appropriate additives on the formation of injector deposits. The research involved testing the engine on a dynamometer, evaluating the injector tips visually at 1000× magnification, and registering the fuel spray using high-speed imaging techniques with a laser and halogen lighting source. The effect of engine operating with the reference fuel was to coke the injector tip with a linear pattern. It increased the linear injection time to keep the engine’s operating point constant over the 48 h test. The application of 20% (v/v) butanol reduced deposit formation. The best scavenging results were obtained by extending the engine operating time by the next 24 h and using a cleaning procedure. The procedure included a cleaning additive in addition to butanol. Among the cases analyzed, a combination of butanol and DCA (Deposit Control Additive) was the best method for injector patency restoration.

1. Introduction

The global policy of reducing road transport emissions requires diversifying the powertrains and fuels employed. As a result, completely new or significantly modified technologies and design features are being forced into use. In the case of the automotive industry, the development of vehicles and fuels or other energy sources is subordinated to the overriding goal of reducing harmful emissions, including greenhouse gases (GHGs), into the atmosphere.
A directive of the European Parliament and of the Council (EU) 2009/28/WE of 23 April 2009 on promoting the use of energy from renewable sources known as RED I (Renewable Energy Directive) specifies permissible ethanol content in gasoline and supports flex fuel vehicles. In turn, the Directive of the European Parliament and the Council (EU) 2018/2001 of 11 December 2018, also known as the RED II or Biofuels Directive, promotes the use of energy from renewable sources [1].
On 8 June 2022, the European Parliament voted on a Regulation of the European Parliament and of the Council (EU) amending Regulation (EU) 2019/631 with regard to tightening CO2 emission standards for new passenger cars and light commercial vehicles in line with the Union’s more ambitious climate targets. The European Parliament voted in favor of reducing average CO2 emissions by 20% by 2025, by 55% by 2030, and by 100% by 2035 compared to 2021.
The research that has been carried out and the experience collected during the operation of engines indicate ethanol and butanol as the most promising alcohol biocomponents for the conventional fuels currently in use [1]. However, it is worth noting that alcohol-doped fuels are compatible with new trends in the development of internal combustion engines. That allows better use in the design of engines and the potential of new technologies, such as downsizing, modern solutions of direct, high-pressure fuel injection, and boosting and controlled auto-ignition [2,3,4,5]. In addition, alcohol–gasoline blends’ environmentally friendly properties are an essential factor in determining the possibility of using fuel as an alternative to vehicles. The results of studies conducted to date have shown that using alcohol-blended fuel for vehicle propulsion provides measurable benefits in terms of greenhouse gas emissions compared to gasoline [6,7,8].
Fuel is an important part of the automotive engineering process, including the choice of construction materials, including lubricating oils for the powertrain, fuel distribution, and storage systems. The limits of engine control and the optimization of harmful exhaust emissions and performance and operating characteristics are determined by fuel properties. Thus, the fuel should ensure the vehicle’s technical functionality and appropriate performance characteristics while maintaining the required emission standards over the engine’s life cycle and the manufacturer’s warranty. Any fuel change on the market must be adapted to the existing fleet of vehicles and their requirements [1,5]. The scope and results of research work to date do not fully explain how certain properties of various alcohols affect engine performance and operating characteristics. Also insufficiently recognized is the effect of blends of alcohols with gasoline on the tendency to form or flush out pre-formed, various injector deposits of gasoline direct injection (GDI) engines. However, the coke deposits formed on the injector tips of GDI engines, especially in the fuel outflow channels and around the exhaust ports, deform the injected fuel jet, affecting its shape and range and the amount of fuel delivered. However, the coke deposits formed on the injector tips of GDI engines, especially in the fuel outflow channels and around the exhaust ports, deform the injected fuel jet, affecting both its shape and range, as well as the amount of fuel delivered. It has a very detrimental effect on both the quantitative and qualitative processes of mixture formation and combustion processes in the engine chambers. Presumably, this causes difficulty in starting, engine performance deterioration, increased fuel consumption, and emissions of harmful exhaust components. The mechanisms of deposit formation in an engine vary depending on where the deposit is formed and the factors that affect it. Due to simultaneous deposit removal processes, the number of deposits formed is the result of deposit formation and removal processes. The mechanisms of deposit formation are known, although the formation processes are not fully understood to date. In the case of fuel injectors, deposit precursors are formed by oxidation, condensation, and precipitation of unstable hydrocarbons (aromatics and olefins) from the fuel [9,10]. These precursors form precipitates through two distinct chemical reaction pathways, i.e., self-oxidation at low temperatures and coke precipitate formation by pyrolysis at high temperatures. However, it has not been possible to establish a temperature boundary between the low- and high-temperature reactions, especially as a temperature range has been observed in which both low- and high-temperature-assigned reactions occur [10]. Oxidative stability differs from thermal stability and refers to the rate of oxygen consumed during the formation of oxidation products. Oxidation reactions of alkyl radicals form hydrated peroxides and other oxidation products responsible for precipitate formation [11,12]. At temperatures higher than 350 °C, carbonaceous precipitates are usually formed in two ways, i.e., by the decomposition of hydrocarbons to free carbon and hydrogen and by the polymerization/condensation of different hydrocarbon moieties to larger polycyclic aromatic hydrocarbons, which then form embryos and subsequently carbonaceous precipitates. In GDI engines, as in indirect injection (PFI—Port Fuel Injection) engines, the main influence on deposit formation processes on the injector tips is high temperature [9,10]. Additionally, the fuel’s high sulfur and olefin contents are other factors that promote deposit formation. Also of major importance is the direct chemical impact on the injector of the gases of the mixture being burned in the engine combustion chamber and high pressure. Deposits usually begin to form in the outlet area of the fuel injector orifices and then cover the interior of the injector orifice tubules, especially the surfaces on which fuel wetting remains after injection [11,12]. Such deposits, in the form of lakes and resins, result from the fuel’s thermal oxidation and polymerization processes. It poses a challenge and defines new research areas for engine designers and fuel manufacturers, especially additive manufacturers [13,14]. In the absence of an effective Deposit Control Additive (DCA) in the fuel, injector deposits form relatively fast. This especially occurs when the fuel is chemically unstable and the vehicle is operated over short distances, so the engine is frequently heated and cooled [11]. DCA components must be compatible with other additives in the fuel refining package and tolerate water very well. They must not contribute to the fouling of spark plugs, the suspension of engine valves, or the formation of deposits in the engine crankcase. Standard DCA-type additives used in motor gasoline are most often based on polyisobutylene (PIB) or polyether amine (PEA) [1]. While PIB dissolves readily in hydrocarbons, it does not mix with alcohol. Consequently, this can increase the deposits formed on engine components and the fuel injection system. Thus, dedicated DCA-type additives are necessary for alcohol-blended fuels [15]. Manufacturers of engines, fuel additives, and fuels themselves have for many years paid very close attention to testing and evaluating the tendency of fuels to form harmful engine deposits. This is reflected in the world’s most important document defining the required scope and procedures for fuel testing, i.e., the Worldwide Fuel Charter. The latest, sixth edition of the Worldwide Fuel Charter was released on 28 October 2019. Since its first edition, the Worldwide Fuel Charter included a set of, inspected by fuel and engine manufacturers, Europe-wide standardized engine fuel testing procedures. These successively modified and supplemented engine procedures specifically address the evaluation of the effectiveness of DCA in both gasoline and diesel applications. The evaluations are carried out using engines of different generations and concern harmful deposits formed on various engine components. The systematic development of engine designs and fuel formulations has led to the development of several procedures dedicated to studying the mechanisms, magnitudes, and effects of the formation of harmful engine deposits, including the latest procedure CEC F-113 (VW EA111 GDI Injector Deposit Test) [15,16]. These procedures were developed within the framework of CEC (The Coordinating European Council for the Development of Performance Tests for Fuel, Lubricants, and other Fluids) working groups.
The problem of deposit formation dependent on the fuel composition for GDI engine injectors became the motivation for undertaking work, the results of which are presented in this article. In particular, the effect of butanol admixture gasoline on the formation/flushing of fuel injector deposits was studied. What sets this work apart from others is the use of a unique hybrid methodology for evaluating deposits in GDI engine injectors. This was performed by combining the well-known and Europe-wide standardized CEC F-113 test procedure with a qualitative comparative analysis of fuel flow from engine injectors using laser illumination. This second, qualitative evaluation used a unique, in-house test methodology.
The conventional analysis of jet penetration had limited applicability because there were small differences when testing injectors fueled with various fuels. For this reason, additional geometric indicators were used to determine differences in fuel injection. An analysis of the jet cross-section was used to obtain differences due to changes in the geometry of the nozzle. Additional confirmation of the changes is provided by visual evaluation of the nozzles.
This allowed a multi-directional evaluation of the effects of butanol-blended gasoline without and with the addition of DCA on the functioning of the injection system under actual engine operating conditions. Such an approach to assessing deposits in fuel injectors cannot be found in the literature. Therefore, the methodology presented in the article for the study of injector deposits is its distinguishing feature.

2. Butanol as an Engine Fuel

Butanol and ethanol are alcohols that are considered the most promising biocomponents for the currently used conventional fuels. They are characterized by favorable operating as well as environmental properties. They make it possible to reduce the share of hydrocarbon fuels for fueling engines and reduce the emission of harmful components into the atmosphere [17,18,19,20], including CO2Table 1.
Butanol, as an admixture to motor fuels, has many advantages over the more common ethanol. The heat of combustion of butanol is about 83% of the heat of combustion of gasoline. In comparison, the heat of combustion of ethanol is 65% of the heat of combustion of gasoline [20]. Butanol also has a higher heating value and is much less hygroscopic than ethanol. Ethanol is fully miscible in water, while butanol is weakly soluble in water. As a result, butanol has a less corrosive effect on fuel injection system components than ethanol. Thus, butanol is more compatible with a fuel system adapted to gasoline than ethanol. It also has better lubricating properties than short-chain alcohols, such as ethanol. As with ethanol, the butanol addition to motor gasoline increases the octane number, allowing for higher compression ratios and lower fuel consumption volume and CO2 emissions [21]. As with ethanol, when blending butanol with the gasoline of different hydrocarbon compositions, both octane and volatility are nonadditive parameters. The mixture of butanol and gasoline has a lower excess air ratio than gasoline—Table 1. The disadvantages of butanol include a high boiling point and low vapour pressure, which adversely affects the engine’s cold-starting ability [22,23,24]. Another disadvantage is the lower heat of vaporization compared to ethanol when applied to fuels blended with gasoline. Due to its higher viscosity and density compared to ethanol and gasoline, butanol will break down less well when spraying the fuel. Consequently, it may be more prone to form deposits on internal engine components, as well as in fuel injectors—Table 1 [22,23]. The performance of a ZI engine, especially with direct injection fueled by a gasoline/alcohol mixture, depends to a large extent on the fuel atomization process. Therefore, many researchers are focusing on further research and improvement of this process, including reducing the impact of damaging injector deposits on this process [25,26,27,28,29].
Table 1. Main properties of gasoline and butanol [18,19,25].
PropertyGasolineButanol
Chemical formulaC8H18C4H9OH
Molecular weight [g/mol]11474.11
Fuel density in 20 °C [kg/m3]736.8806
Viscosity [mPa·s]0.4–0.82.57–3.33
Excess air ratio14.711.17
Heat of vaporization [kJ/kg]349683
Oxygen content [%(m/m)]021.6
Vapor pressure acc. to Reid at 37.8 °C [kPa]63.96.6
Research octane number95105.1

3. Aim and Scope of the Study

Regarding the problem of loss of patency (fouling) of injectors in the injection systems of GDI engines, it was decided to evaluate the change in the operating properties of injectors under the influence of the application of a butanol additive and a DCA additive to gasoline.
The research was conducted in three fields:
  • the effect of the fuel used on the duration of fuel injection;
  • visual evaluation of injector orifices;
  • determining the effect of injector contamination on geometric spray indicators.
The study’s scope involved using base fuel and blends containing butanol and DCA in various configurations. The injectors were operated in the engine under testing for 48 and 72 h, followed by visual evaluation and optical examination of the spray development.
The study’s goal was to determine the degree of deposit formation of GDI engine fuel injectors depending on the type of fuel and additive used. At the same time, the possibility of leaching of previously formed deposits by the fuel-containing admixtures with the inclusion of the DCA-type additive was determined.

4. Materials and Methods

4.1. Motor Fuels

Three types of fuels with different physicochemical properties were tested on an engine dynamometer. The first was a reference fuel; the second was the same fuel admixed with 20% (v/v) butanol, and in the third, a 500 mg/kg DCA-type additive was added to the gasoline–butanol mixture. Benchmark gasoline RF-12-09 batch 11 required by CEC test procedures for checking, adjusting, and calibrating test engines was used as the reference (base) fuel. Gasoline RF-12-09 batch 11 is a non-DCA fuel with a high tendency to form deposits on the intake valves of SI engines. Limiting the admixture of butanol to 20% (v/v) was due to the engine manufacturer’s requirements for the maximum allowable alcohol content in gasoline. A DCA-type additive of typical content for fuels on the European market was used for the third fuel. This is an additive from one of the well-known manufacturers that is compatible with gasoline-containing alcohol additives. The physicochemical properties of the fuel samples prepared for testing are shown in Table 2.
The tests were conducted under conditions in accordance with the requirements of the standardized, pan-European test procedure CEC F-113—2022 edition.

4.2. Engine Test Methodology

The tests were conducted according to two applicable versions of the test procedure, i.e., CEC F-113-KC “Keep-Clean” Test Procedure and CEC F-113-CU “Clean-Up” Test Procedure (VW EA111 BLG) [5]. In the remainder of this paper, these tests will be called Keep-Clean and CleanUp. The VW EA111 BLG engine was used as the test tool in this procedure. This engine is representative of European direct injection engine designs. Wall-guided direct fuel injection was matched with a combined supercharging system (supercharging + turbocharging). The engine was built in the “downsizing” convention. Six-hole electromagnetic injectors were used for fuel injection. During the tests, the engine was operated under the following fixed conditions:
(a)
with constant speed n = 2000 rpm;
(b)
with a constant load Mo = 56 Nm;
(c)
with constant injection pressure p = 7.7 MPa;
(d)
with a constant excess air ratio of 1.
The test procedure consisted in performing the evaluation of fuels (and DCA additive) according to two tests (Table 3):
  • Keep-Clean: is a 48 h test during which the engine is operated under constant speed (2000 rpm) and constant load (56 Nm) conditions. It allows evaluation of the base or refined fuel in terms of its ability to keep the injectors clean;
  • Clean-Up: includes a 48 h part of the Keep-Clean test and a 24 h part of the Clean-Up test in which the engine runs under the same conditions as before. The test allows evaluation of the cleaning properties of the fuel used in the Clean-Up part of the test.
As a criterion for evaluating the fuel in the tests, the changing width of the electrical pulse controlling the injection time of the fuel dose was used. This time changes (lengthens) as the number of deposits accumulating outside and inside the injector gradually increases. The injection time was registered with an accuracy of 0.001 ms. During the Clean-Up test, the pulse width controlling the fuel dose injection time shortens as deposits are flushed out of the injectors.
Due to the nature of the measurement, the engine tests were not repeated. Their repetition would require a new batch of injectors. Repeating the tests on current injectors would have entailed different test results due to changes in the injector flow.
The fuel tests were carried out on an engine test bench complying with the CEC F-113-KC “Keep-Clean” Test Procedure and the CEC F-113-CU “Clean-Up” Test Procedure (VW EA111 BLG)—2022 edition. Figure 1 shows a general view of the test stand.

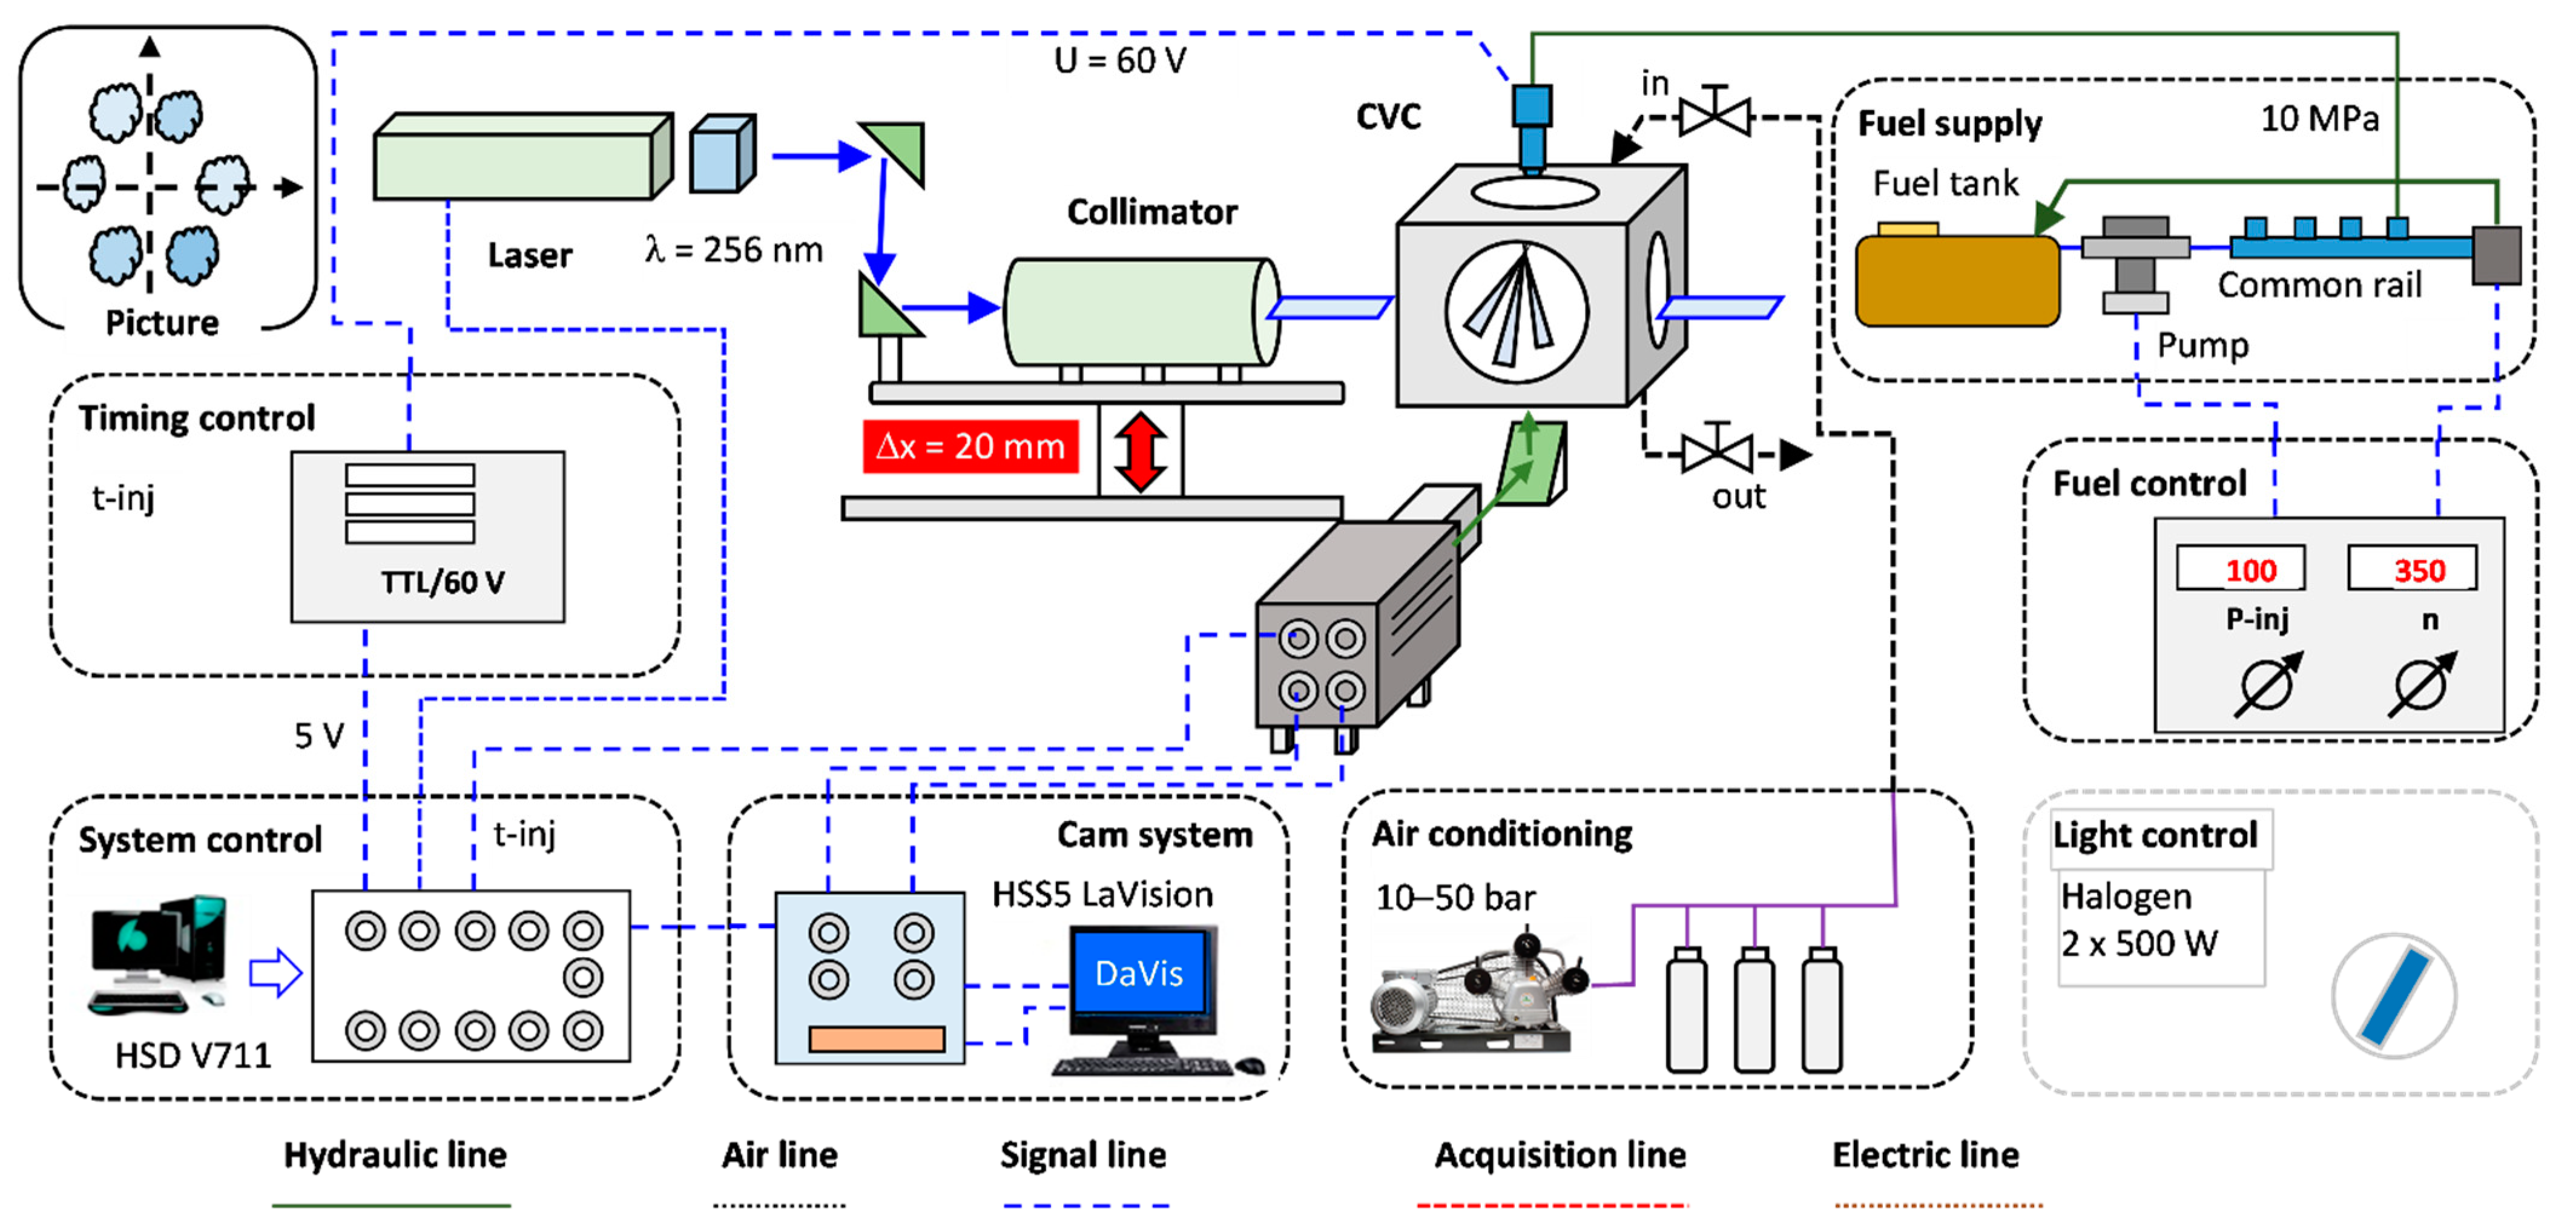
4.3. Optical Testing Methodology

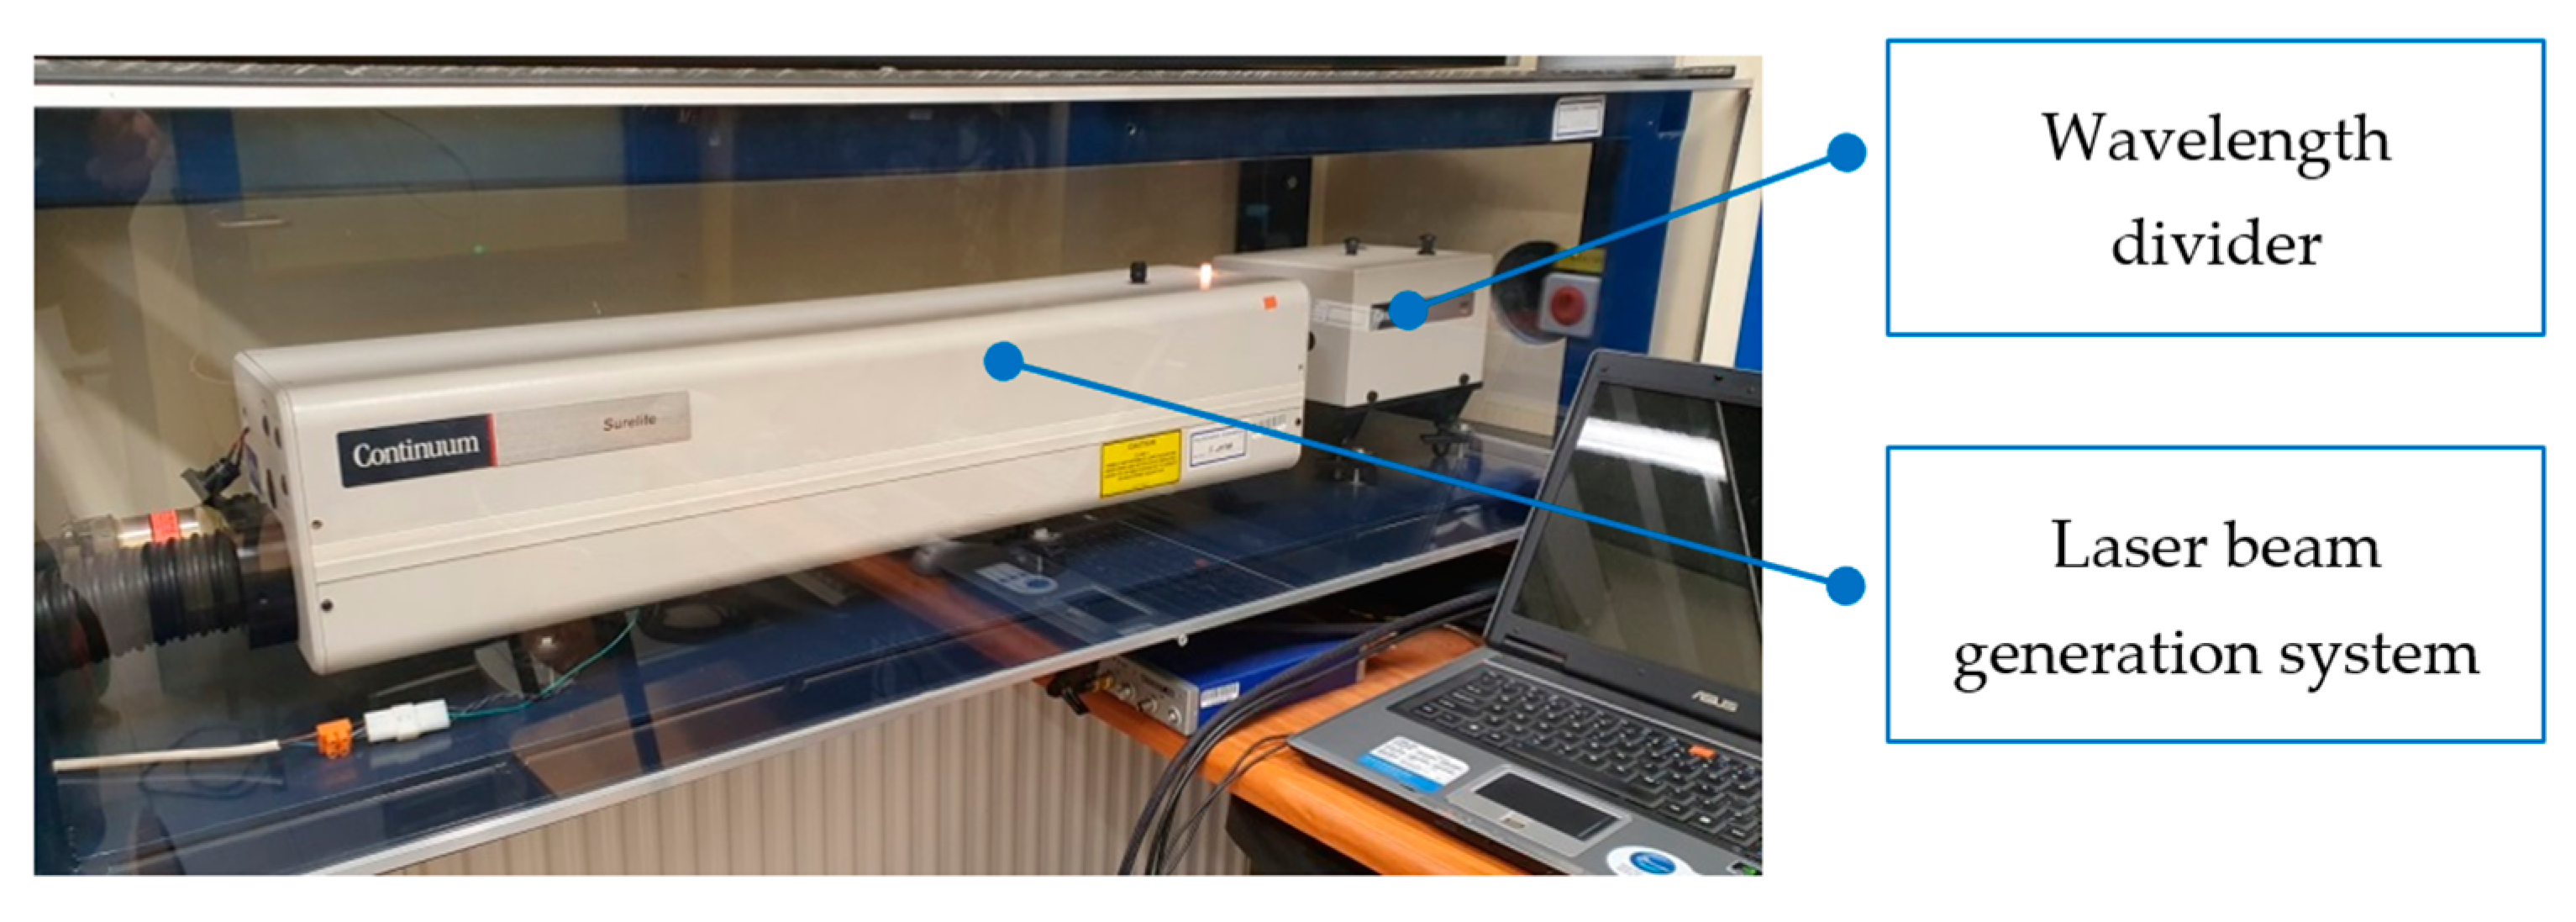
4.3.1. Test and Measurement Apparatus

Tests on the injectors of a spark-ignition engine with direct injection were carried out using a constant volume chamber (Figure 2). It allows for simulating conditions corresponding to the engine chamber. In tests using a chamber with a volume of 2.2 dm3 (quartz glass with a thickness of 30 mm was built into five sides of the chamber), it was assumed that the effect of piston motion and gas thermal conversion on the analyzed phenomenon is negligible inside the chamber. Such assumptions accompany optical studies of the course of fuel injection under static conditions. In addition, the tests were carried out without air back pressure, which made it possible to analyze the qualitative magnitudes of the development of the fuel spray (cross-sectional tests). The mentioned conditions deviate to some extent from the real ones. However, the angle of fuel injection in the engine was carried out under conditions where the pressure in the cylinder was close to the ambient pressure (early injection in the intake stroke).
The research conducted required the use of an external fuel supply system (Figure 2—fuel supply). The pressure generation system used an electric motor to drive the fuel pump (n = 350 rpm) producing a pressure of p = 100 bar.
A HighSpeedStar 5 camera from LaVision (Göttingen, Germany) was used to record the optical signal from the fuel spray pattern (under halogen and laser illumination). Image recording was carried out at a recording rate of 10 kHz. An image with a resolution of 512 × 512 px was recorded at this filming speed. The shutter settings of the camera depended on the method of lighting: 1/10000—halogen lighting and 1/197000—laser lighting. A Nikon AF Nikkor AF 24-85 mm f/1:2.8-4D IF lens was used in the study.
Optical tests for determining geometric indicators of the jet were performed three times. The results presented in the article are an average of the data from the three repetitions. The images shown are not averaged, and as such, an approach would result in low-quality images.

4.3.2. Lighting Sources

The evaluation of typical geometric indices was carried out using halogen lighting. It was realized using two 2 × 500 W halogen lamps in an arrangement orthogonal to the recorded fuel spray (Figure 3).
The evaluation of additional qualitative indicators of fuel spray development was analyzed using laser illumination. In the study, a beam generated by Surelite’s SL II-10 Continuum Nd:YAG laser was employed. The white-light-emitting laser was equipped with a beam divider (Surelite Separation Package) to produce a second harmonic (wavelength = 532 nm; green light) of 50 mJ (max. 300 mJ). A circular beam (about 7 mm in diameter) was directed at two mirrors (Figure 2). The beam was then directed to a collimator, and the form of a horizontal optical knife was obtained. As the laser beam generation (f = 10 Hz) and fuel injection were synchronized, a plane fuel jet exposure was obtained. The possibility of changing the optical mirror with the collimator height (∆x = 20 mm—Figure 2) results in different cross-sectional measurements of the jet relative to the injector tip.
The study of the fuel jet’s longitudinal and transverse cross-sections was carried out using a device changing the shape of the laser beam, which guarantees the possibility of further analysis. A view of the beam generation system is shown in Figure 4.
No optical filter was used to record the image, as only the light from the halogen lamp reflected from the droplets of injected fuel or the green light (with a wavelength λ = 532 nm) from the laser system was recorded.

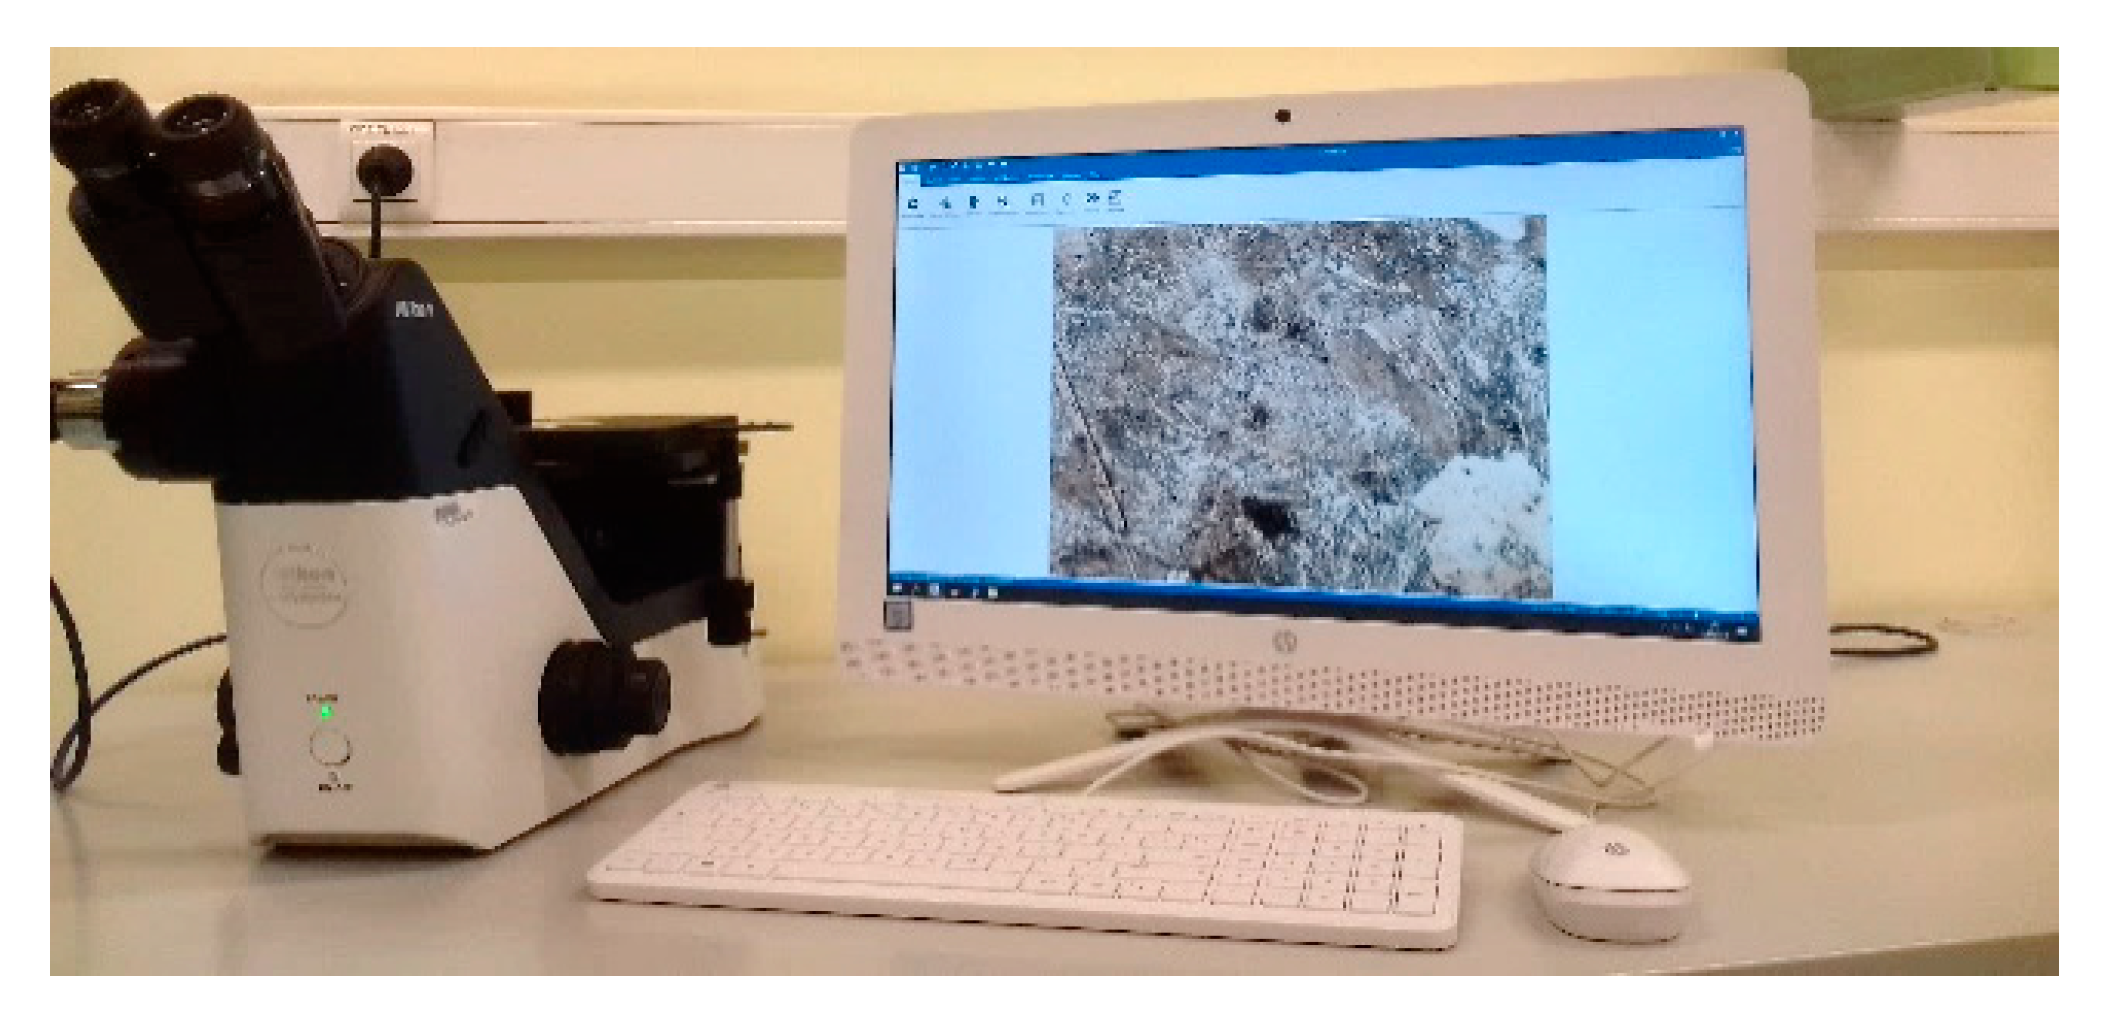
4.3.3. Optical Microscope

Visual observation of the condition of the nozzle tip of the tested injector was carried out using an optical metallographic microscope. For research purposes, a Nikon Eclipse MA100N compact inverted microscope designed for brightfield observation was used (Figure 5).
The microscope was originally equipped with a camera that works with a computer and dedicated image analysis software (Figure 5). The microscope used in the study was fitted with a rectangular three-plate MA-SR-N table. This makes it possible to observe and capture high-contrast images with a magnification of up to 1000. The equipment includes an illuminator for observation in reflected light (using the illumination method from above—EPI), which has a diaphragm with a variable aperture (it controls image contrast and depth of field). The tests were conducted with Nikon CFI60-2 TU Plan EPI lenses providing long-distance capability and an advanced chromatic aberration correction system.

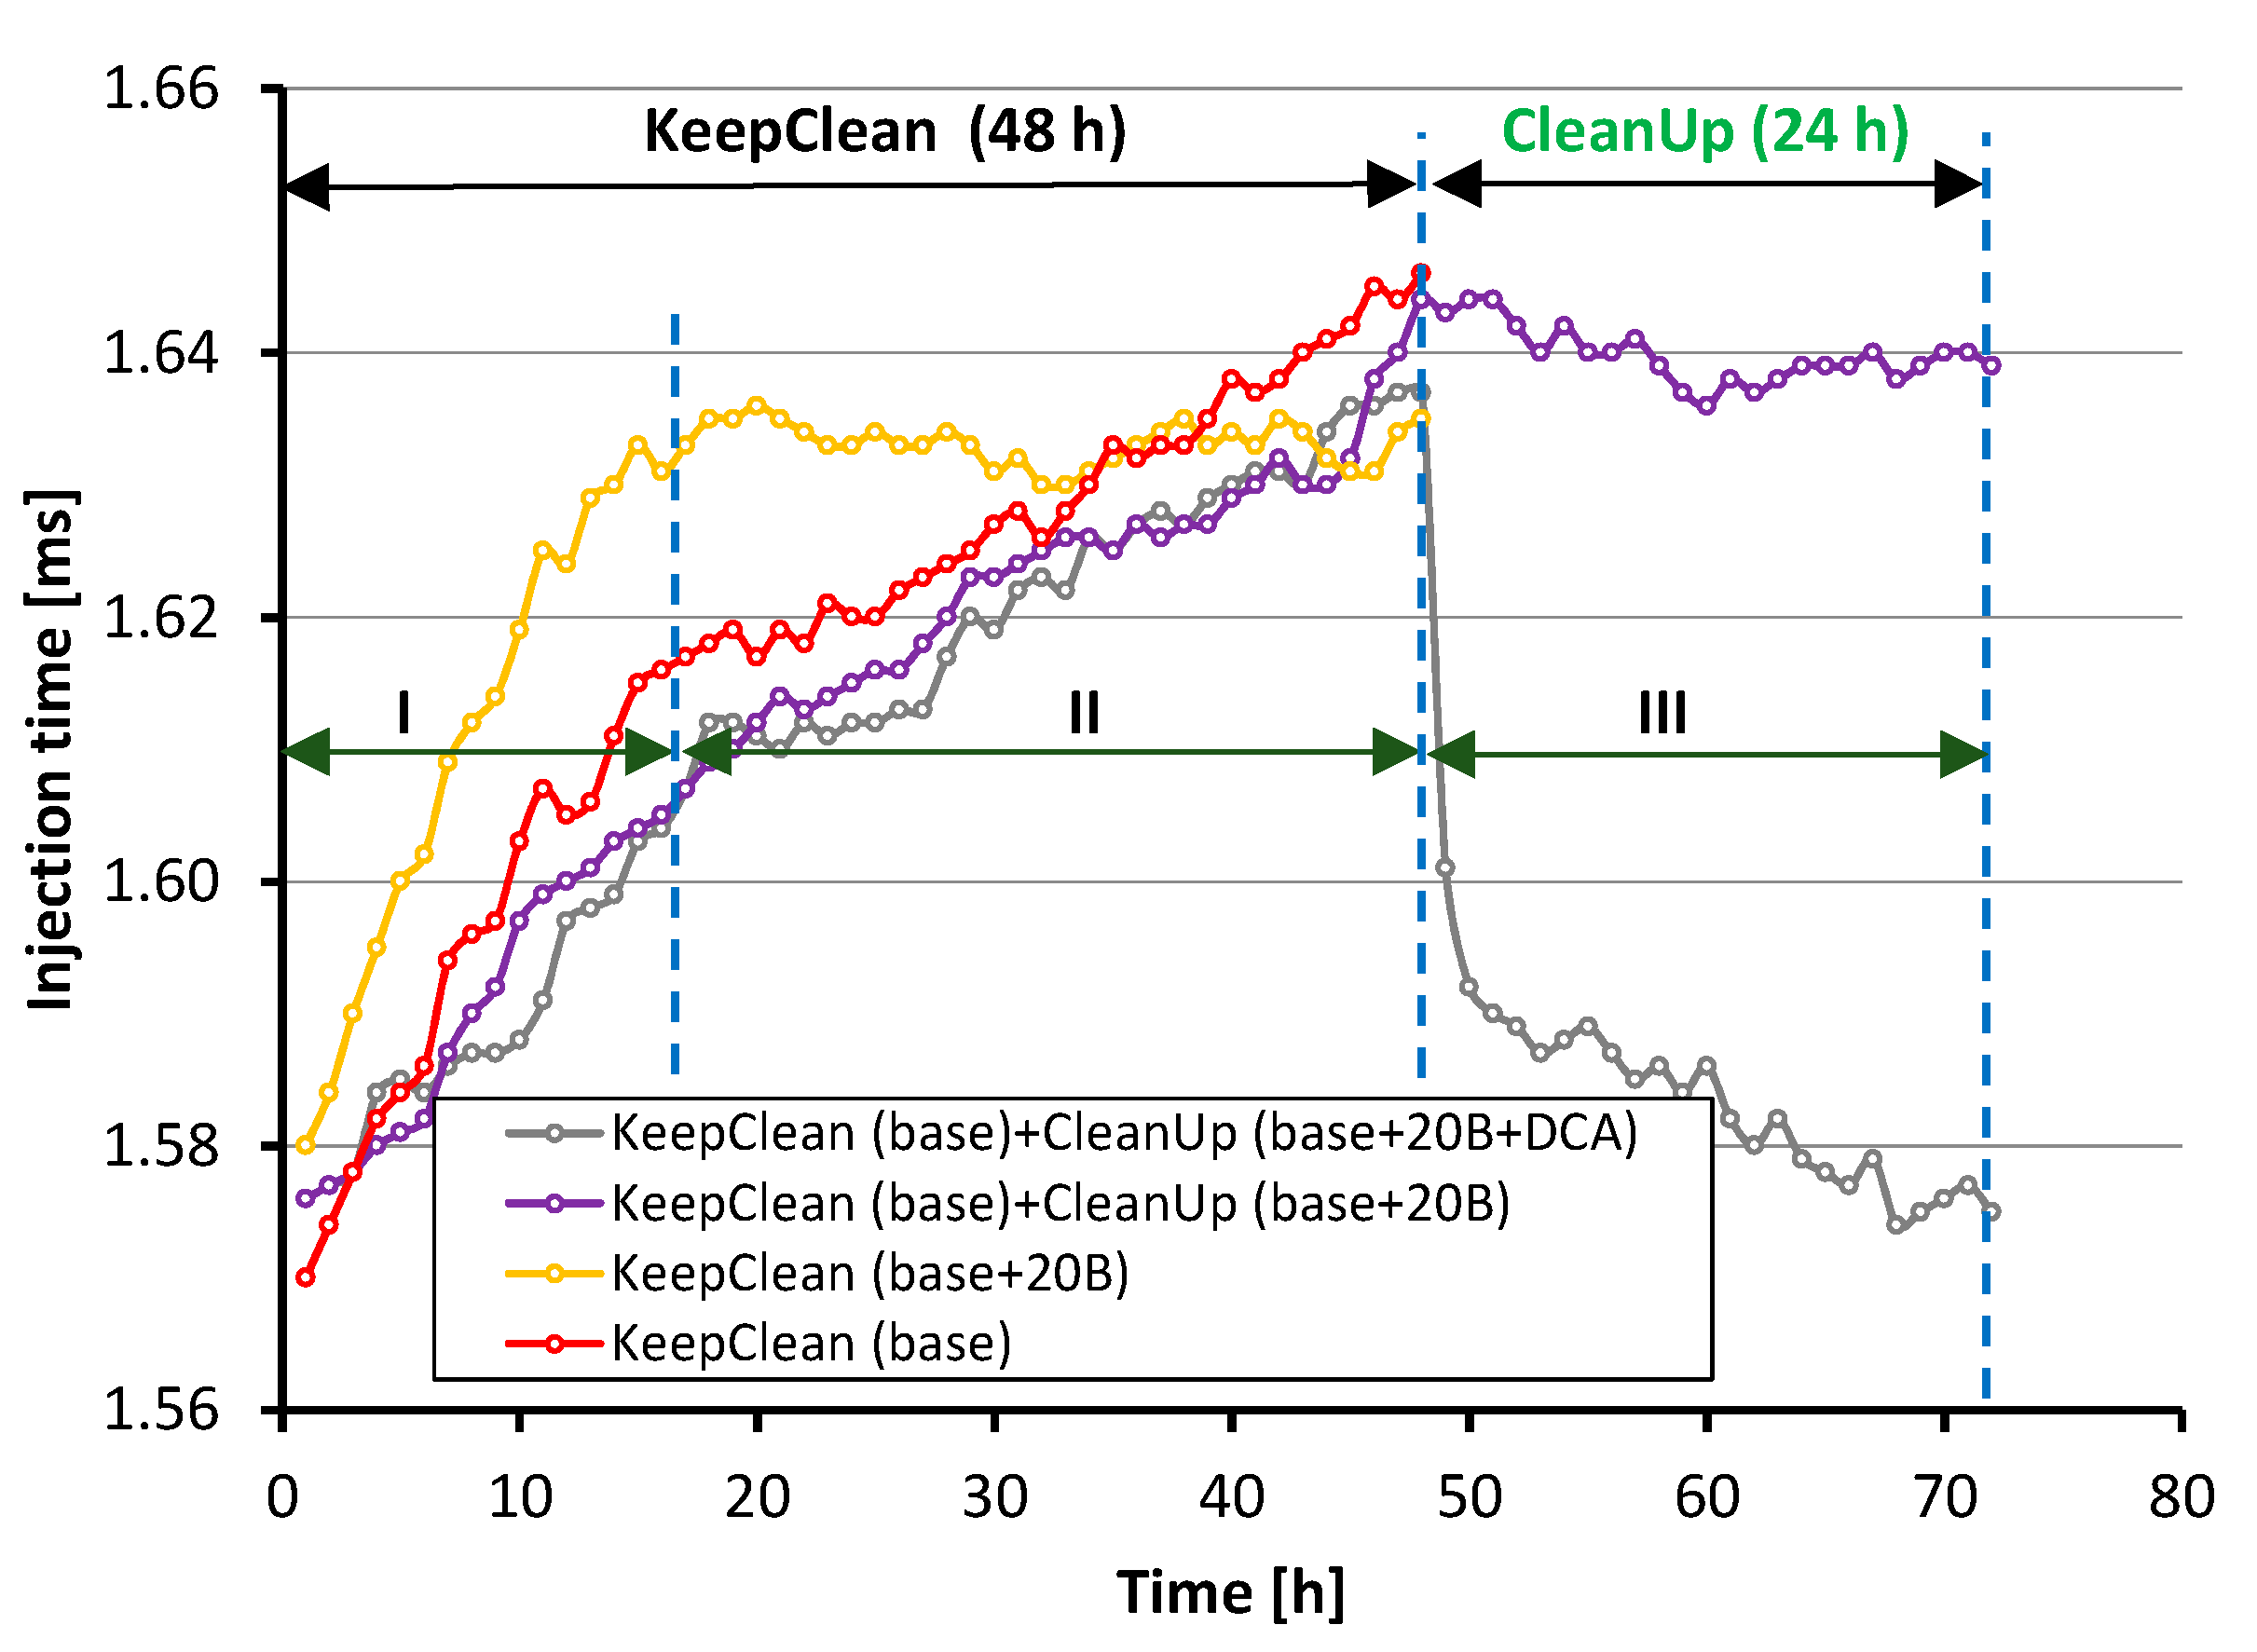
5. Evaluation of Engine Tests—Change of Fuel Dose

Figure 6 shows a comparison of the changes in the injection times for the fuels tested, obtained in tests carried out according to the Keep-Clean and Clean-Up procedures (described previously—Section 4.2). The areas of the analyzed injection times (areas I to III) are also marked in this figure. The injector opening time was calculated based on measurements of changes in the width of the electrical pulse controlling the fuel injection time. The average difference in injector opening (injection) time at the beginning and end of the test is the result, which is usually given as a percentage of the change in the time of a single fuel injection. The change in injection time was caused by the need to maintain a constant value of the injected fuel dose due to obtaining a constant operating point.
Comparing the results of the Keep-Clean tests of the two fuels (Figure 6), for the reference fuel (base), the average increase in the calculated injection time was 5.105%, while for the reference fuel admixed with 20% (v/v) butanol (base + 20B), it was 3.875%. According to the research carried out so far, the most important properties of unrefined (base) fuel that has a major impact on injector deposit formation processes are the T90, sulfur, olefin, and aromatic contents of the fuel, as well as vapor pressure, density, IBP (Initial Boiling Point), and octane number [10,12,21,30]. In the discussed investigation, the base fuel and thus the reference (base) fuel was RF-12-09 batch 11. The differences in physicochemical properties among the blends studied were minor and were mainly due to the admixture of butanol. The results obtained are influenced by the simultaneous interaction of the different properties of the additives used, which can interact with each other in very difficult-to-determine interactions with different effects on the formation of injector deposits. Analyzing the results obtained for the two fuels (base and base + 20B), the most noteworthy is the pattern of deposit formation during the 48 h test. In the case of the base fuel, an approximately linear increase in deposits during the entire test is apparent—Figure 6. As a result, after a 15 h test run, the calculated rise in injection time of a single fuel dose is 2.936%—Figure 6 (area I). The situation is different for the base+20B fuel, where the course of the increase in the injection time of a single fuel dose is logarithmic. After about 15 h of the test run, a clear break in the trend of deposit formation can be seen at the level of the increase in the injection time of a single fuel dose of 3.748%—Figure 6 (an area I). Then, in the other part of the test, i.e., between 15 and 48 h, the increase in the injection time of a single fuel dose changes from 3.748% to 3.875%—Figure 6 (area II). Thus, there is a stabilization of the deposit formation process. Differences in the trend and rate of injector deposit formation for different fuels are due to the intensity of the formation processes of deposit precursors, the strength of their adhesion to the surface, and the simultaneous processes of self-cleaning of injectors [2]. After the formation and stabilization of deposit precursors on the surface of the injectors, the subsequent course of deposit formation results from the processes of their growth and removal (flushing). In the case of a linear course, the simultaneous processes of deposit formation and removal occur approximately with a constant predominance of fouling processes. A logarithmic course occurs when the formation process of injector sediment precursors occurs more rapidly; the sediment adheres more firmly to the surface, or/and its removal (washing out) occurs with less intensity. Ultimately, in the case of fuel containing an admixture of alcohol, this leads to balancing the sediment formation and removal processes after only a dozen hours of testing. The results of similar studies [2] are consistent with those presented in this article. They cover both the effects of ethanol and butanol on the tendency of GDI engine injector deposits. However, in this case, only the ability of alcohol-blended fuel to keep injectors clean (Keep Clean) was assessed.
A comparison of the 72 h test results of the two tested fuels, base + 20B and base + 20B + DCA (Figure 6), shows that when the reference fuel doped with 20% (v/v) butanol was used in the Clean-Up part of the test (24 h), the efficiency of removing the deposits formed in the Keep-Clean part of the test was very low. In the 48 h part of the Keep-Clean test, base fuel was used, obtaining an average increase in the calculated injection time of 4.378%. After replacing the fuel with the base + 20B fuel, the 24 h-lasting Clean-Up test yielded an average calculated injection time decrease of 0.365% relative to the injection time after the 48 h Keep-Clean test—Figure 6 (area III). As in the case of the first Keep-Clean test, in the second test, base fuel was used in the Keep-Clean part, obtaining an average increase in the calculated injection time of 4.068%. After replacing the fuel with a base fuel containing an admixture of 20% (v/v) butanol and 500 ppm (m/m) DCA, an average calculated injection time reduction of 3.726% relative to the injection time after the 48 h Keep-Clean test was obtained during the 24 h CleanUp test—Figure 6 (area III). Thus, the fuel with the butanol and DCA-type additive proved to be very effective in washing out injector deposits. After about two hours of running the Clean-Up test, more than 90% of the final injection time reduction was achieved—Figure 6 (area III). For alcohol-blended fuels, the effectiveness of the DCA-type additives used depended on their composition and appropriate selection [1]. Publication [1] extensively describes the selection method and the effect of the applied DCA additive on the tendency to form deposits on the intake valves and in the combustion chambers of a PFI (flex fuel) engine. Research to date shows that suitable DCA additives are the most effective way to prevent or reduce the formation of harmful deposits on engine fuel injectors [10].

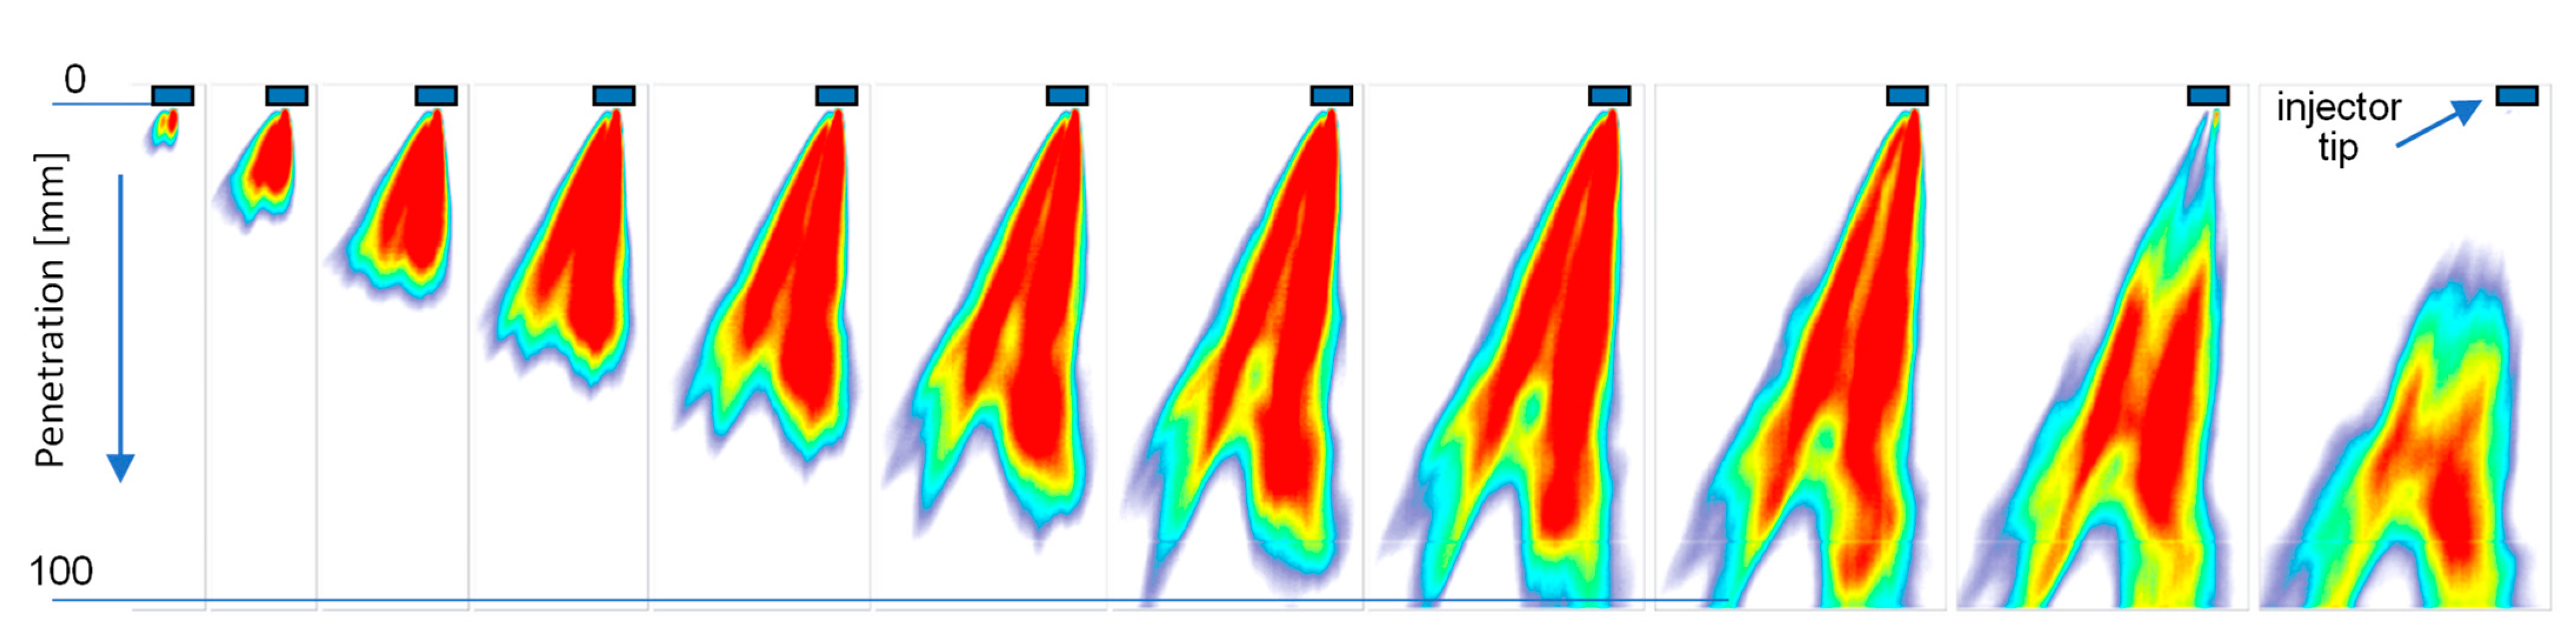
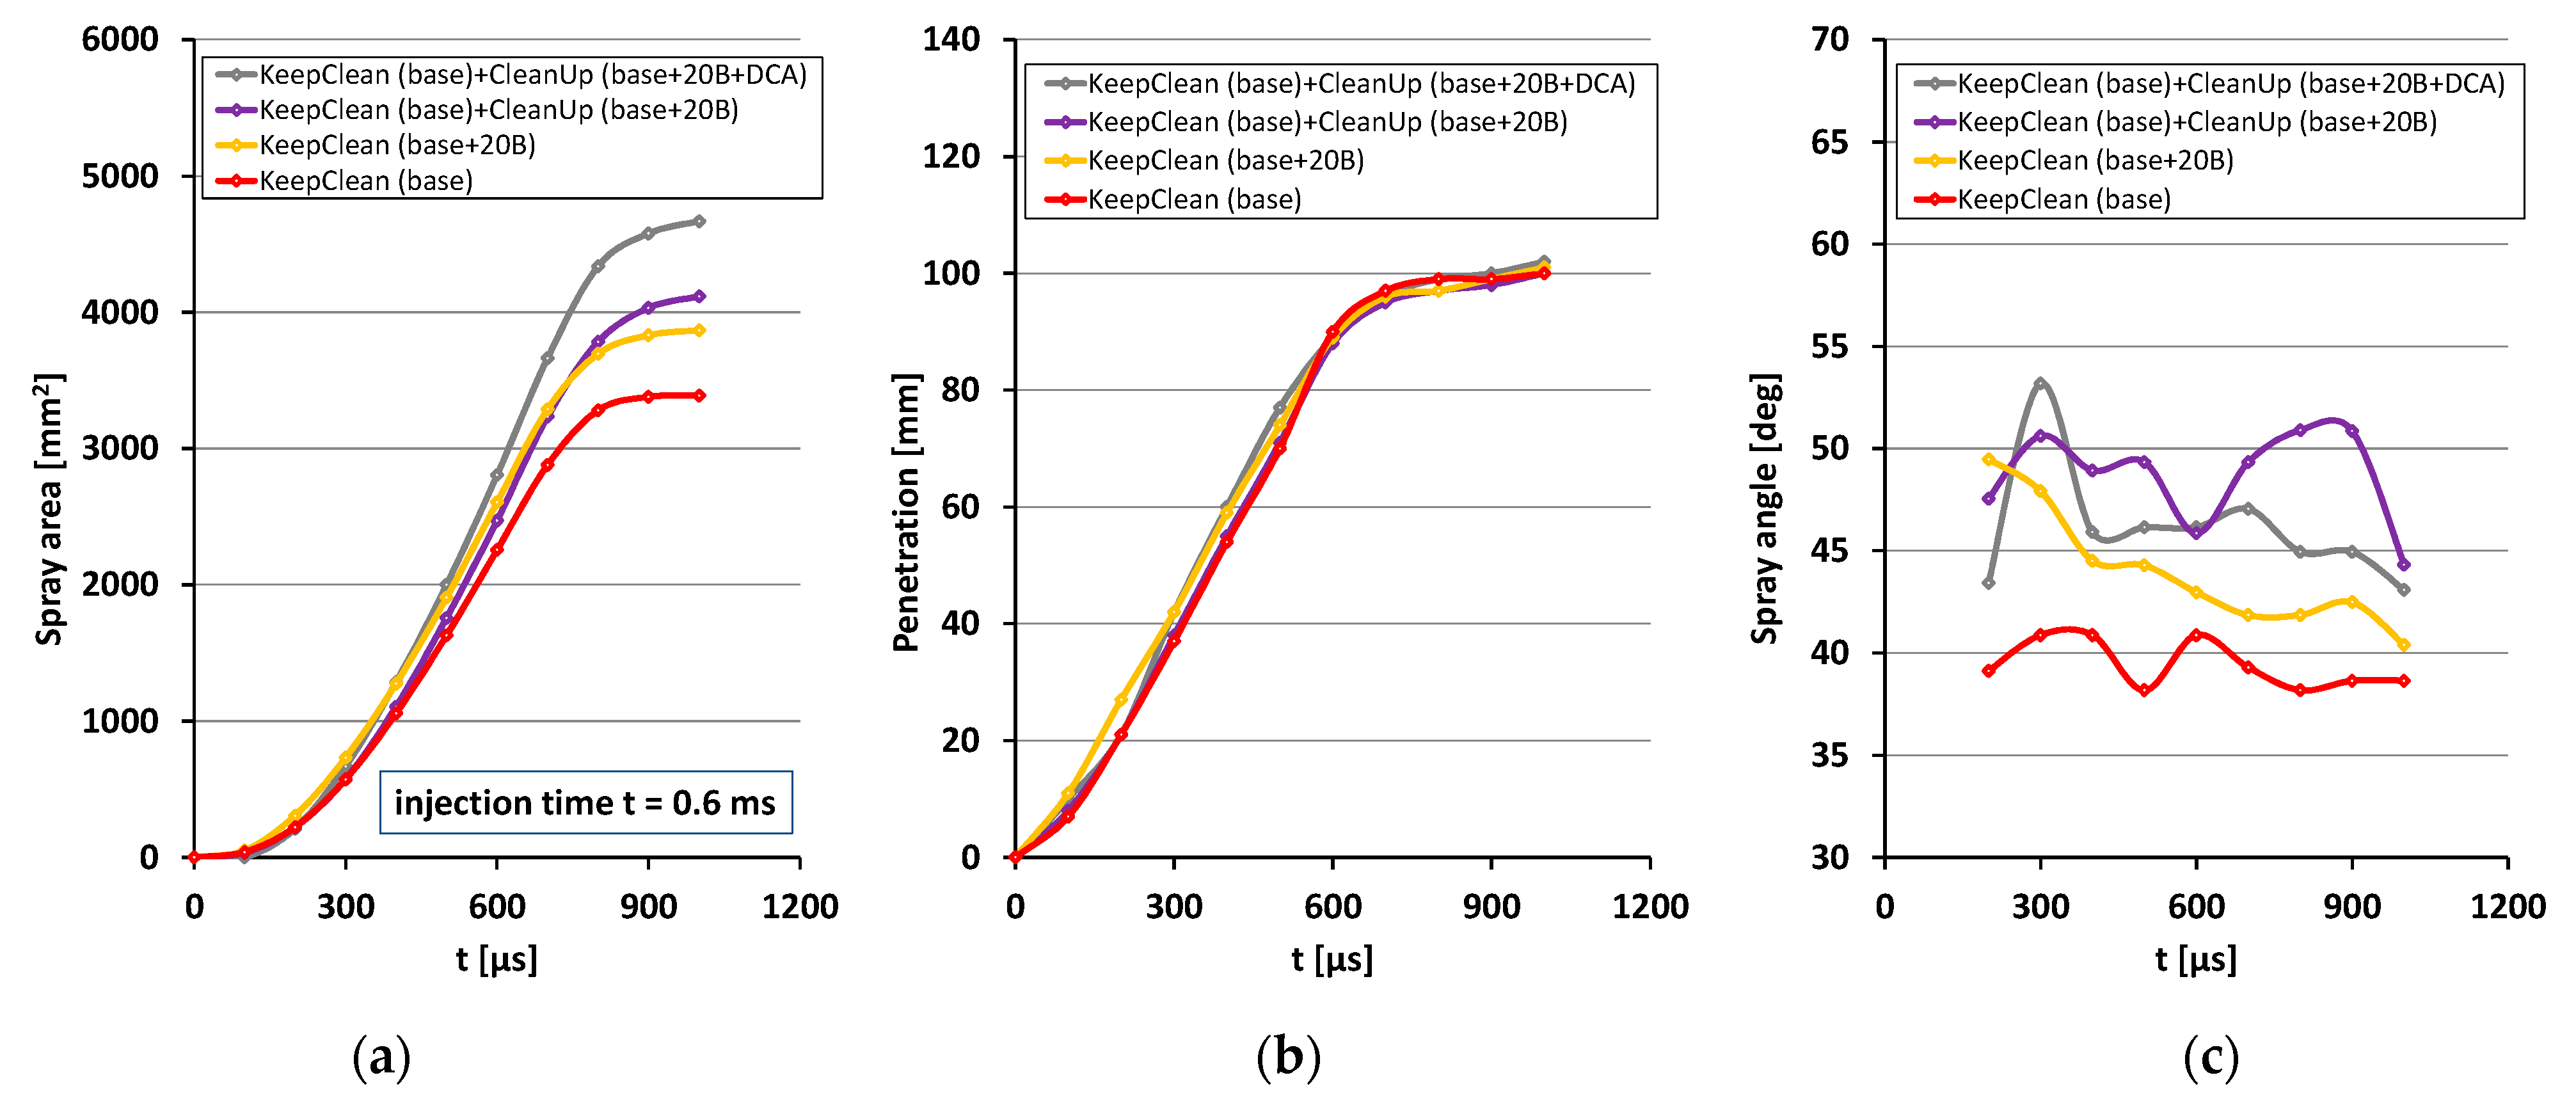
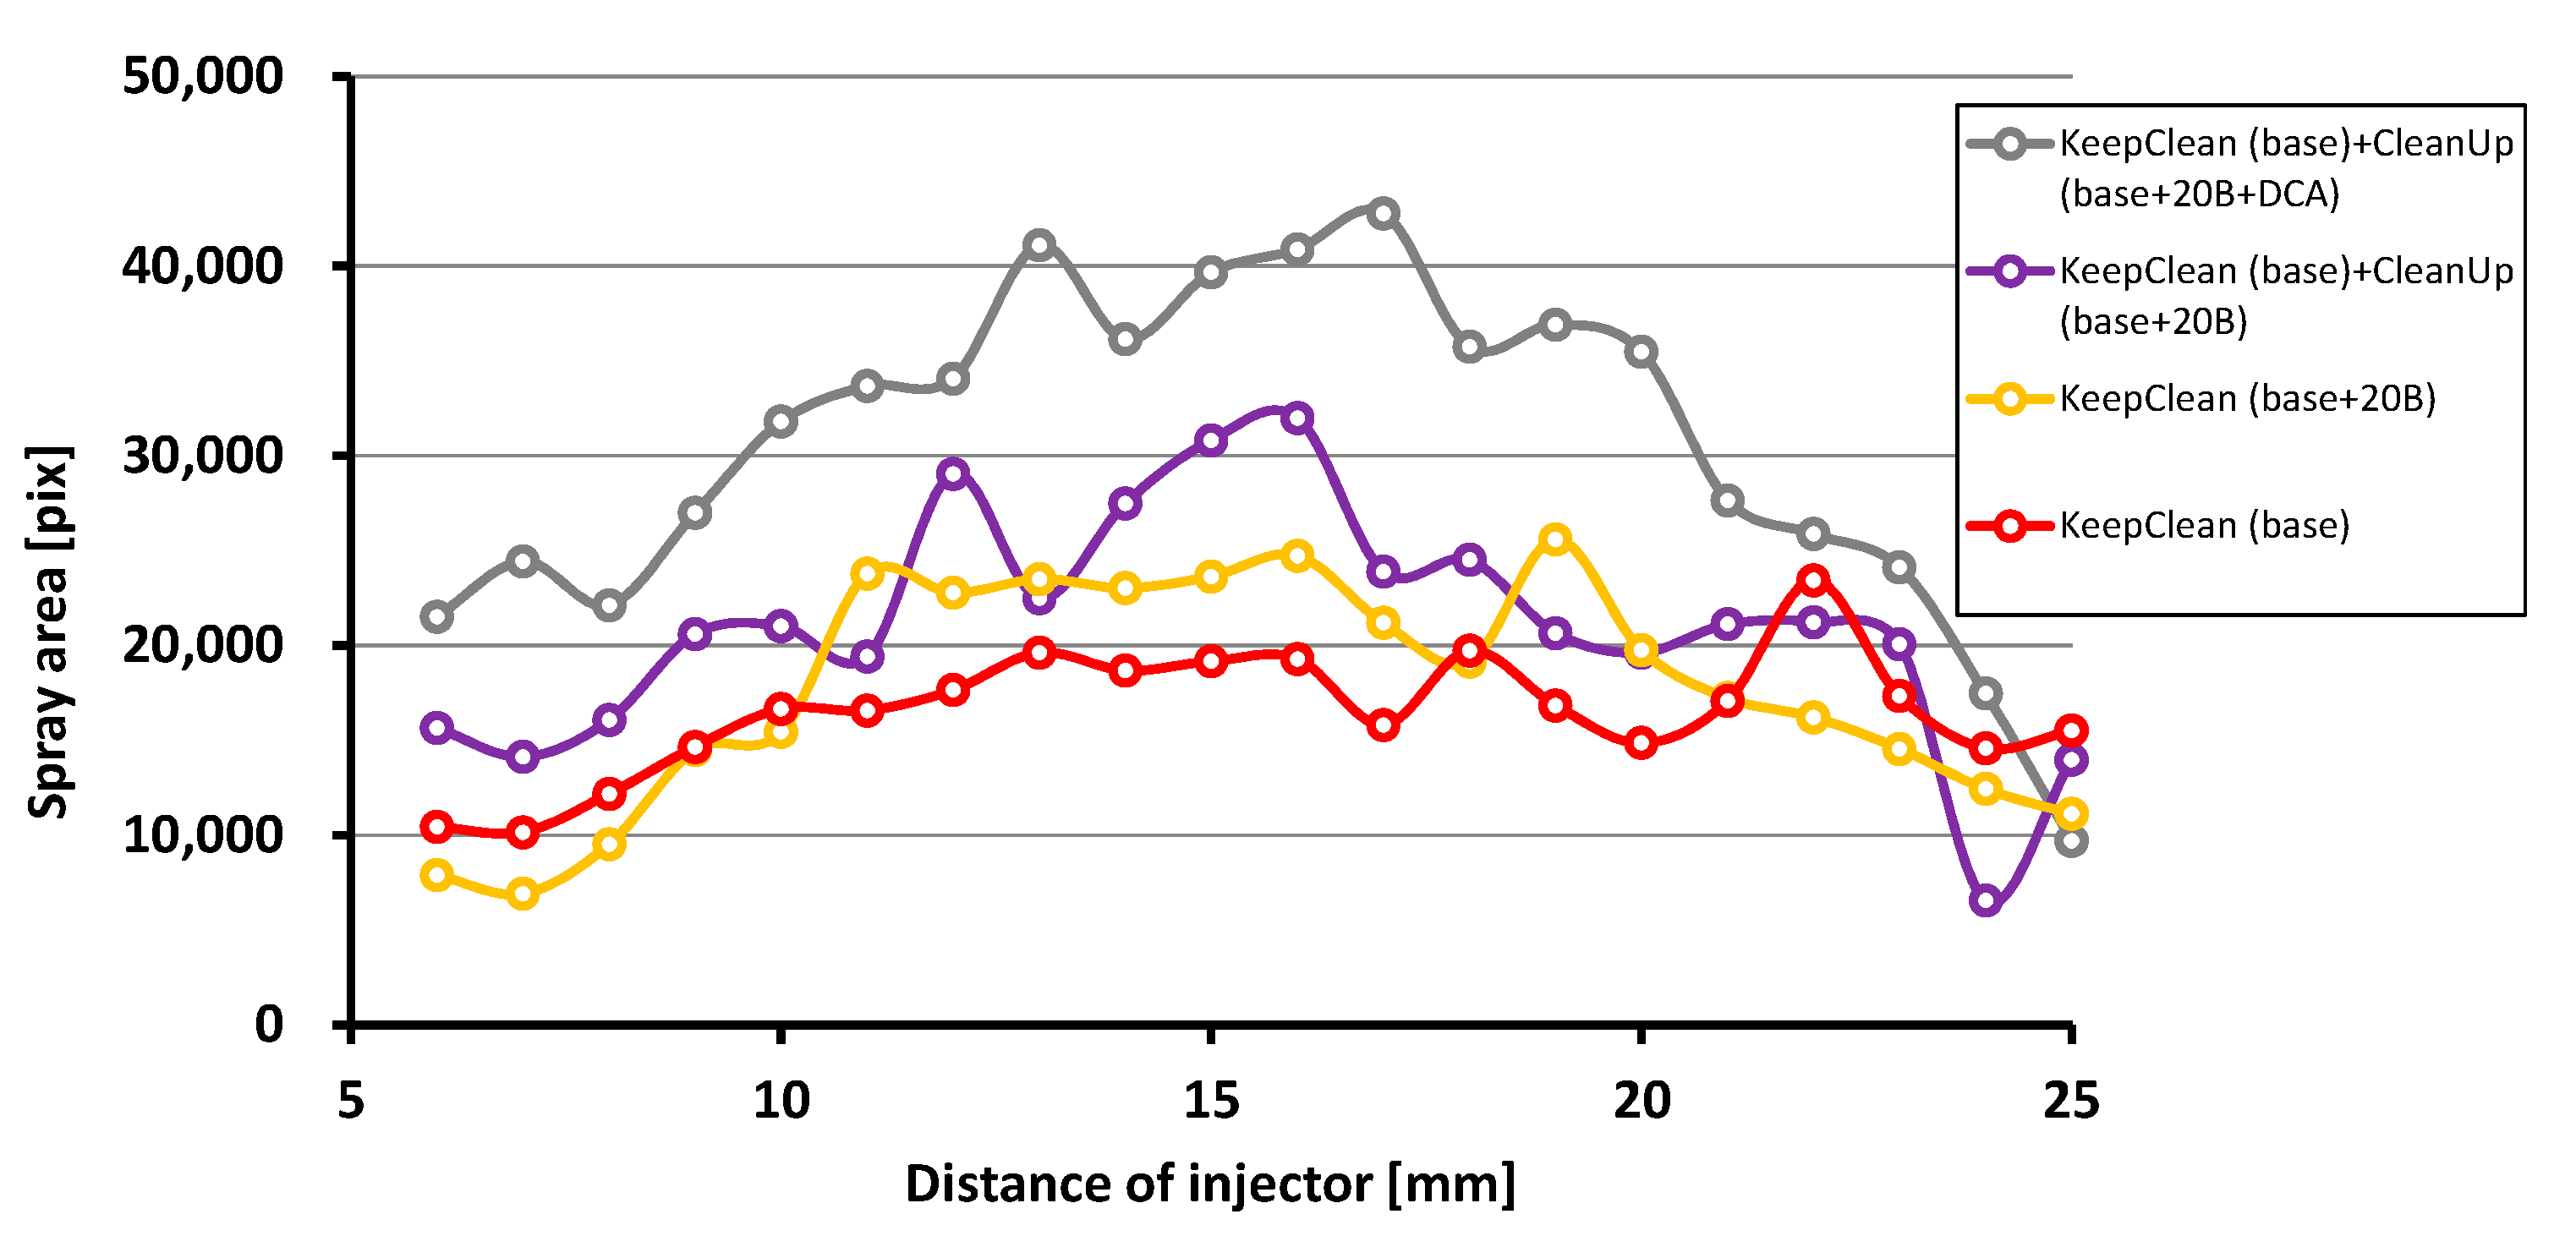
6. Fuel Jet Geometric Indicator Evaluation

The study of geometric indicators of the jet was carried out using the test stand in Figure 3. Figure 7 shows the full pattern of the fuel outflow from the injector. Although the set injection time was set to 0.6 ms, the actual fuel outflow time (after taking into account the response times of the electromagnetic injector) was about 0.8 ms. This is the typical response of the injector, as the hydraulic response and, in addition, the so-called injector dead time must be considered in the actual outflow.
The analysis of the fuel-injected spray structure recorded in the plane parallel to the injector axis (Figure 7) was developed from 11 images corresponding to the 1.1 ms jet formation time from when the injector needle opens. The corresponding color represents the variation of fuel concentration in the jet from red, where the fuel is in the liquid phase, to blue representing fuel vapor. In the initial stage of injection (the first four photos), the jet is compact, and the shape is close to a cone. As time passes, the jet breaks up, and individual streams are separated.
In order to compare the effect of using different fuels on the operation of the injector of the GDI system, the following indicators were chosen: spray area, penetration, and jet cone angle (Figure 8). The ranges of the change in jet penetration as a function of time (Figure 8b), regardless of the fuel used, are negligible, and the maximum values after 1.1 ms do not exceed a 2% difference. The change in the geometry of the outflow holes under the influence of the deposits is best described by the spray area (Figure 8a) especially considering the lack of significant changes in the penetration range. This indicates changes in the process of jet development in the plane perpendicular to the axis of the injected fuels. Changes in the spray area dictated by contamination of the injector can be caused by a change in the amount of fuel injected (tinj = const) or a change in the distribution of fuel in the jet. The proportion of 20% butanol in the fuel during engine operation for 48 h significantly affects the injector patency. During the same injector opening pulse duration during the optical tests, the area covered by the fuel jet is increased by 14.1%. By subjecting the injector running on the base fuel to the cleaning process for another 24 h, slightly better results were obtained than continuous engine operation on the base + 20B mixture. The best results were obtained using a cleaning procedure with 20% butanol and DCA added, which increased the spray area by 13.4% relative to a cleaning procedure without DCA. Considering the change in the fuel spray angle (Figure 8c), there is a relationship between the value of the spray angle and the surface area. The smallest value of the jet cone angle was obtained for the injector running on the base fuel, corresponding to the smallest maximum spray area value. The results for the remaining cases are the same.
It should be noted that the tests of geometric indicators were carried out with the same basic fuel (gasoline). The obtained indicators are not the result of using various fuels. Geometric index variations are due to the degree of the same injector contamination subjected to subsequent tests. Therefore, higher values of the jet cone angle after tests with butanol—Keep-Clean(base) + CleanUp(base + 20B) do not indicate irregularities or deviate from the engine test. The most important indicator is the spray area; the cone angle cannot indicate the spray quality.

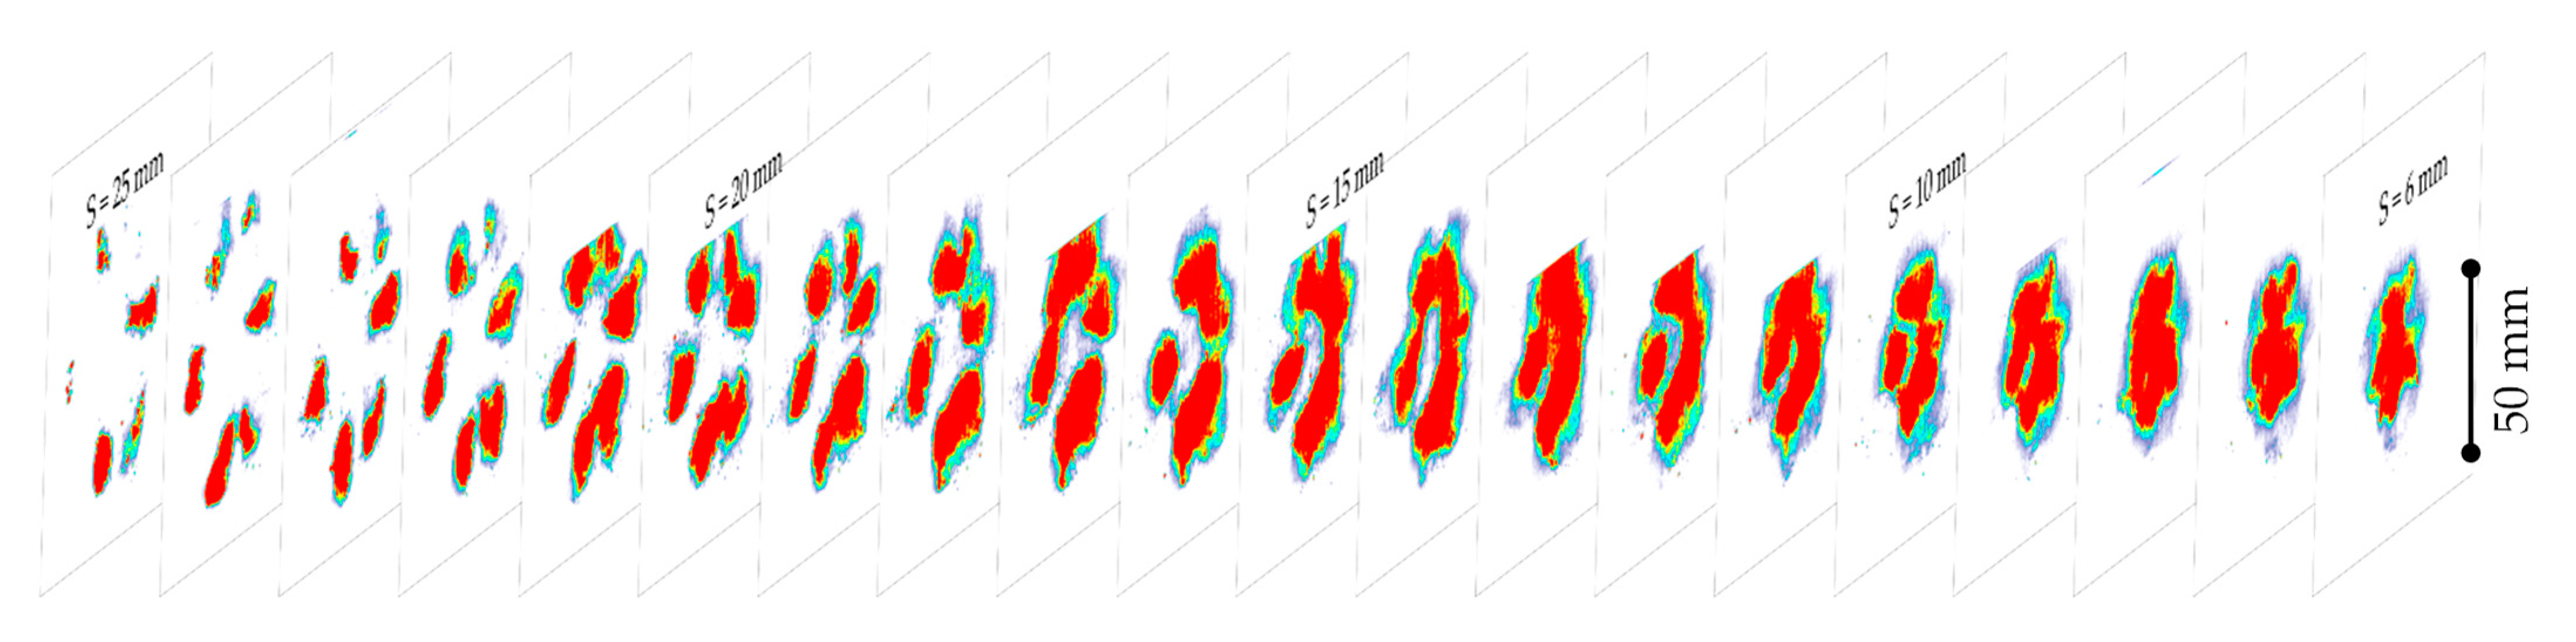
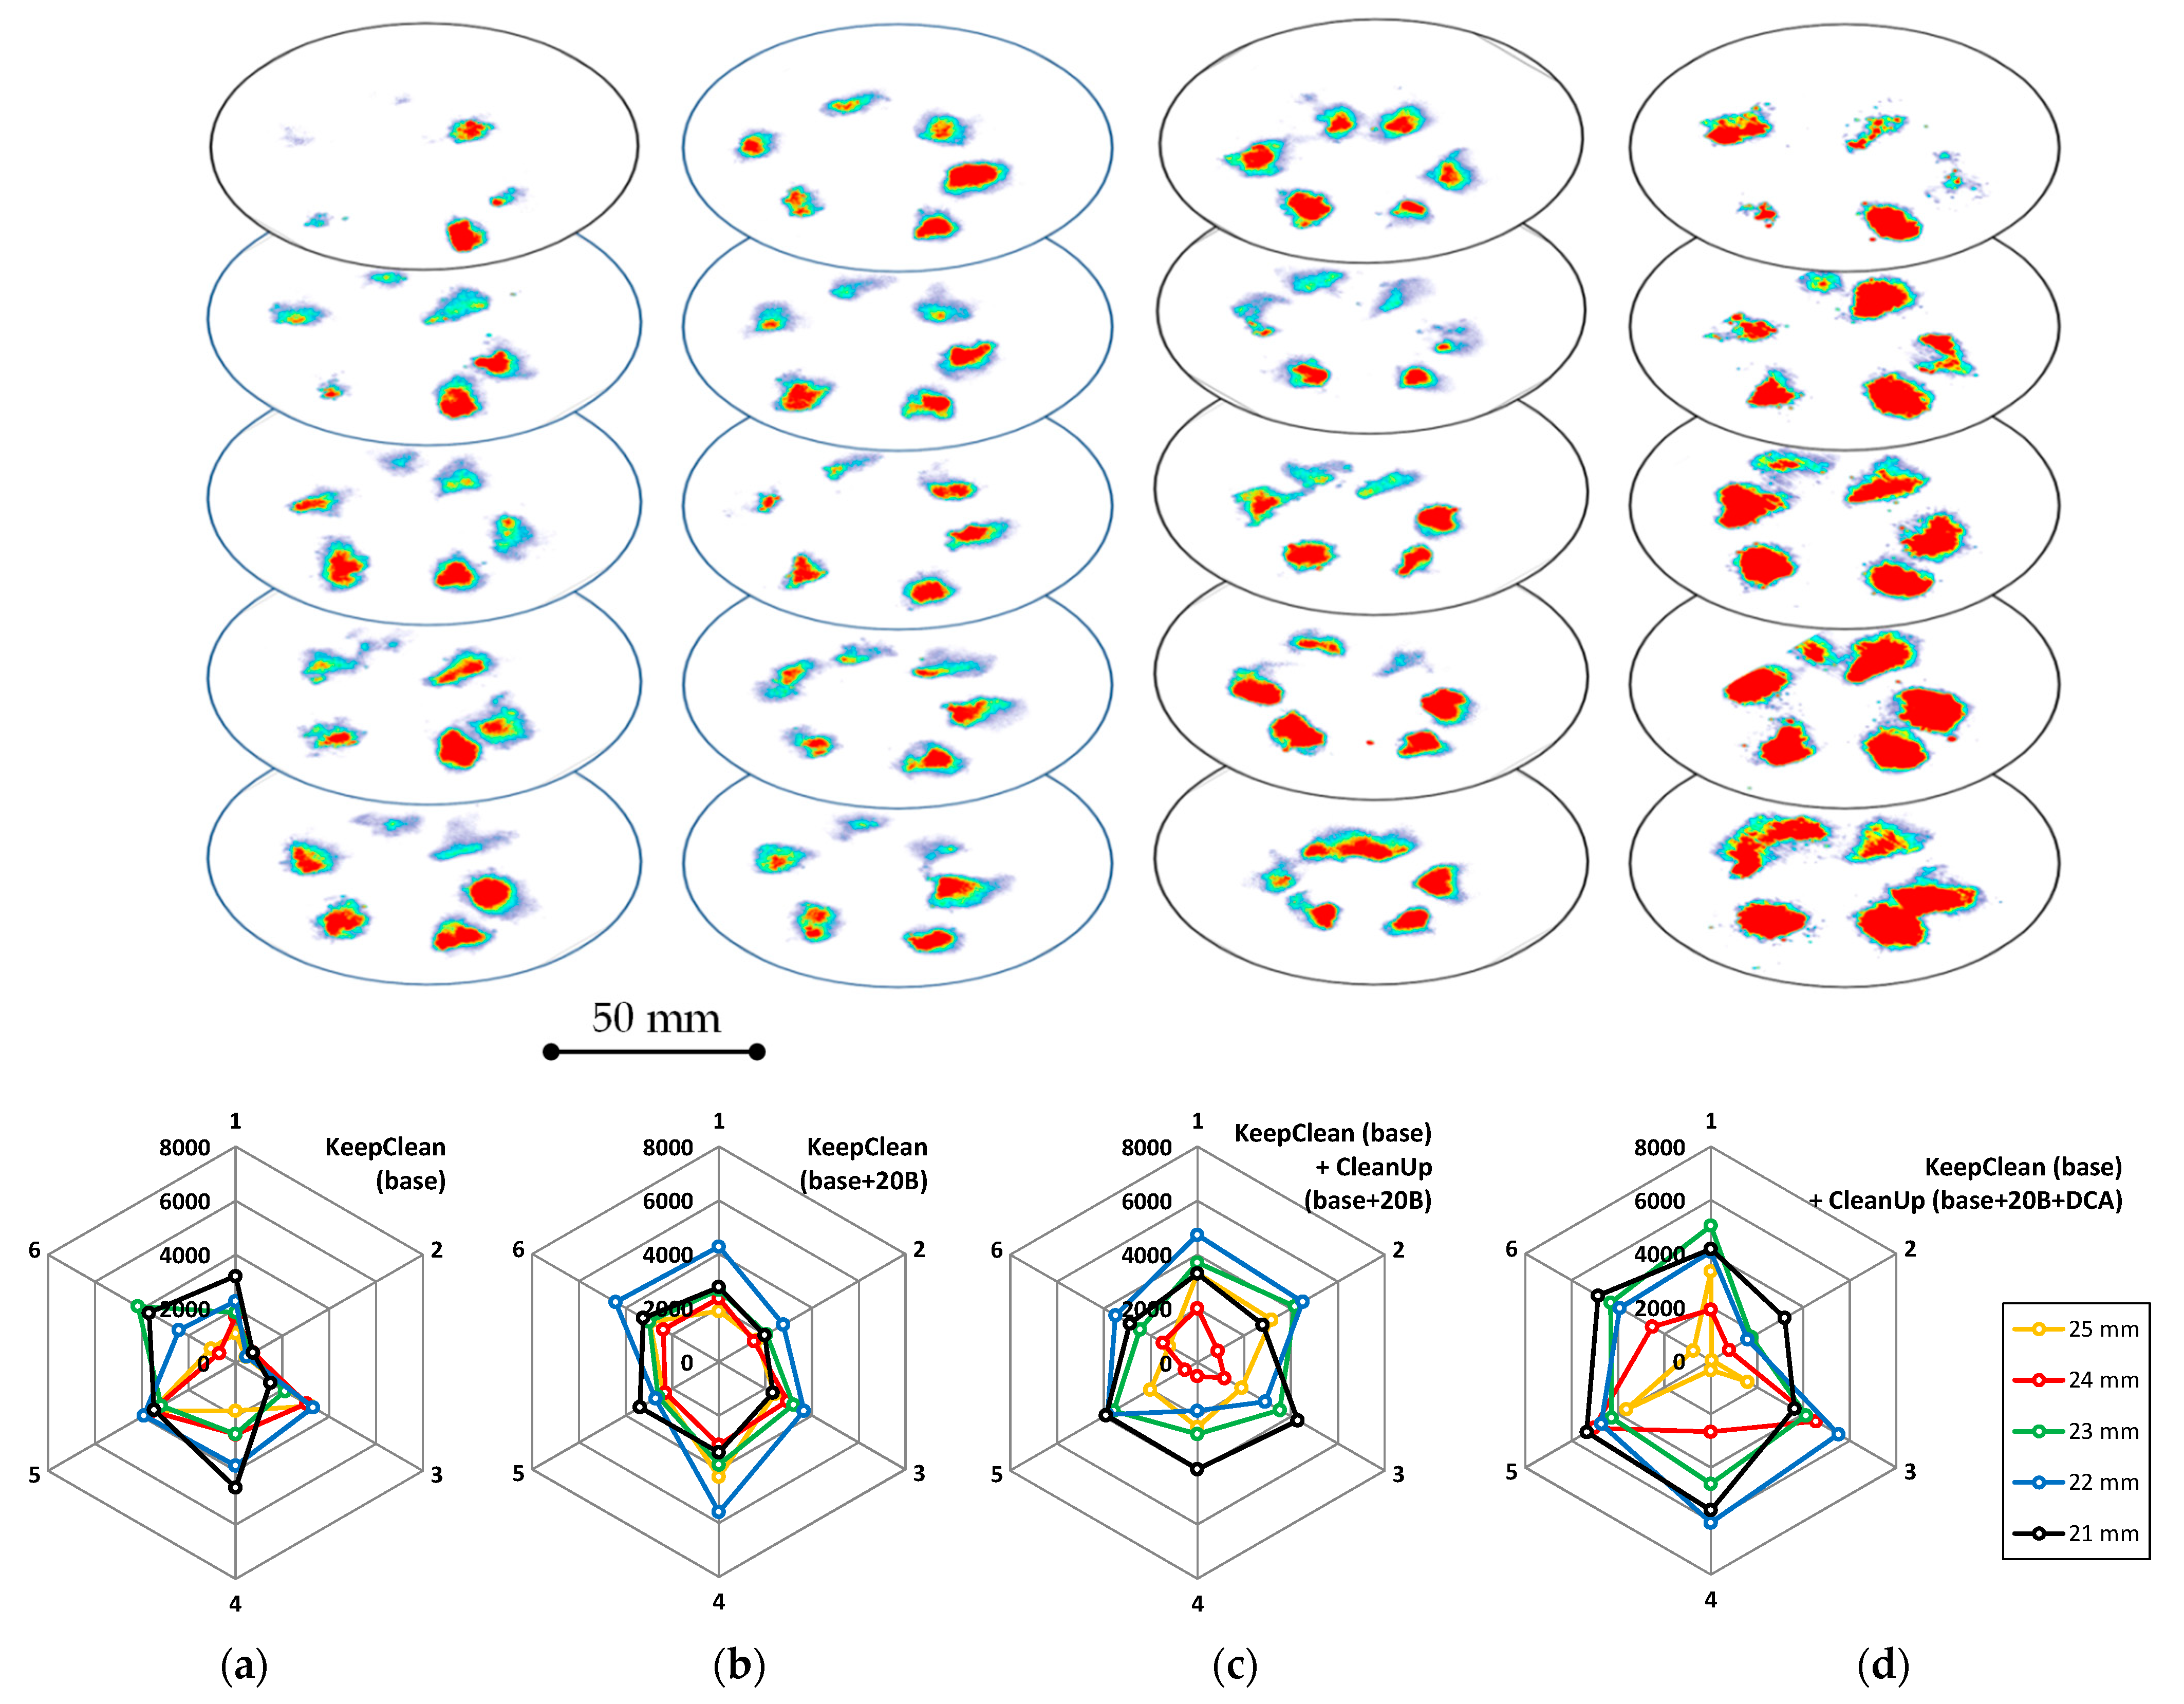
7. Fuel Jet Cross-Section Analysis

The analysis with halogen light described in the previous section shows the external structure of the jet without being able to identify changes occurring inside the outflowing fuel streams. For this purpose, the fuel jet was recorded in a plane perpendicular to the axis of the injector using laser illumination (Figure 9). The fuel jet was illuminated with a flat laser beam at distances from 6 to 25 mm in 1 mm increments from the tip of the injector. At the shortest distance from the tip of the injector, the jet is uniform and distinguishing individual fuel streams is impossible. As the distance increases, it becomes possible to distinguish individual streams and evaluate them.
Images obtained at a distance of 21 to 25 mm were selected for a comparative evaluation (Figure 10). This is the range where the best extracted visualizations of individual fuel jets were obtained. In addition, a plot showing the cross-sectional area of the jet was developed below for each image sequence. The unevenness of the area fields for each case is due to the cross-sectional plane’s position in the injector’s axis inconsistent with the fuel jet axis.
The image sequences indicate that over the entire range analyzed, the largest area areas were obtained for the case where 20% butanol and DCA additive were used in addition to the base fuel (Figure 10d). Using only the Keep-Clean phase (Figure 10a,b), a distance of 21 mm separates all the streams, in contrast to the other cases where partially the streams form a uniform area of fuel concentration. The two streams disappear for the injector running on base fuel (Figure 10a) at a distance of 25 mm from the injector tip, which is unprecedented in the other test cases.
The results of summing the areas for each image in the range of 6–25 mm are shown in Figure 11. The largest area of the jet in the cross-section was obtained in the middle of the analyzed distance. For the 48 h tests, the results are similar, but a larger area in the middle range was obtained for the injector running on a mixture of butanol and base fuel. Subsequently, applying the Clean-Up procedure improved the atomization rates, especially with DCA additives. The results correlate with those previously discussed, but an analysis of the internal structure of the spray shows smaller differences for the cases where the 48 h test was used.

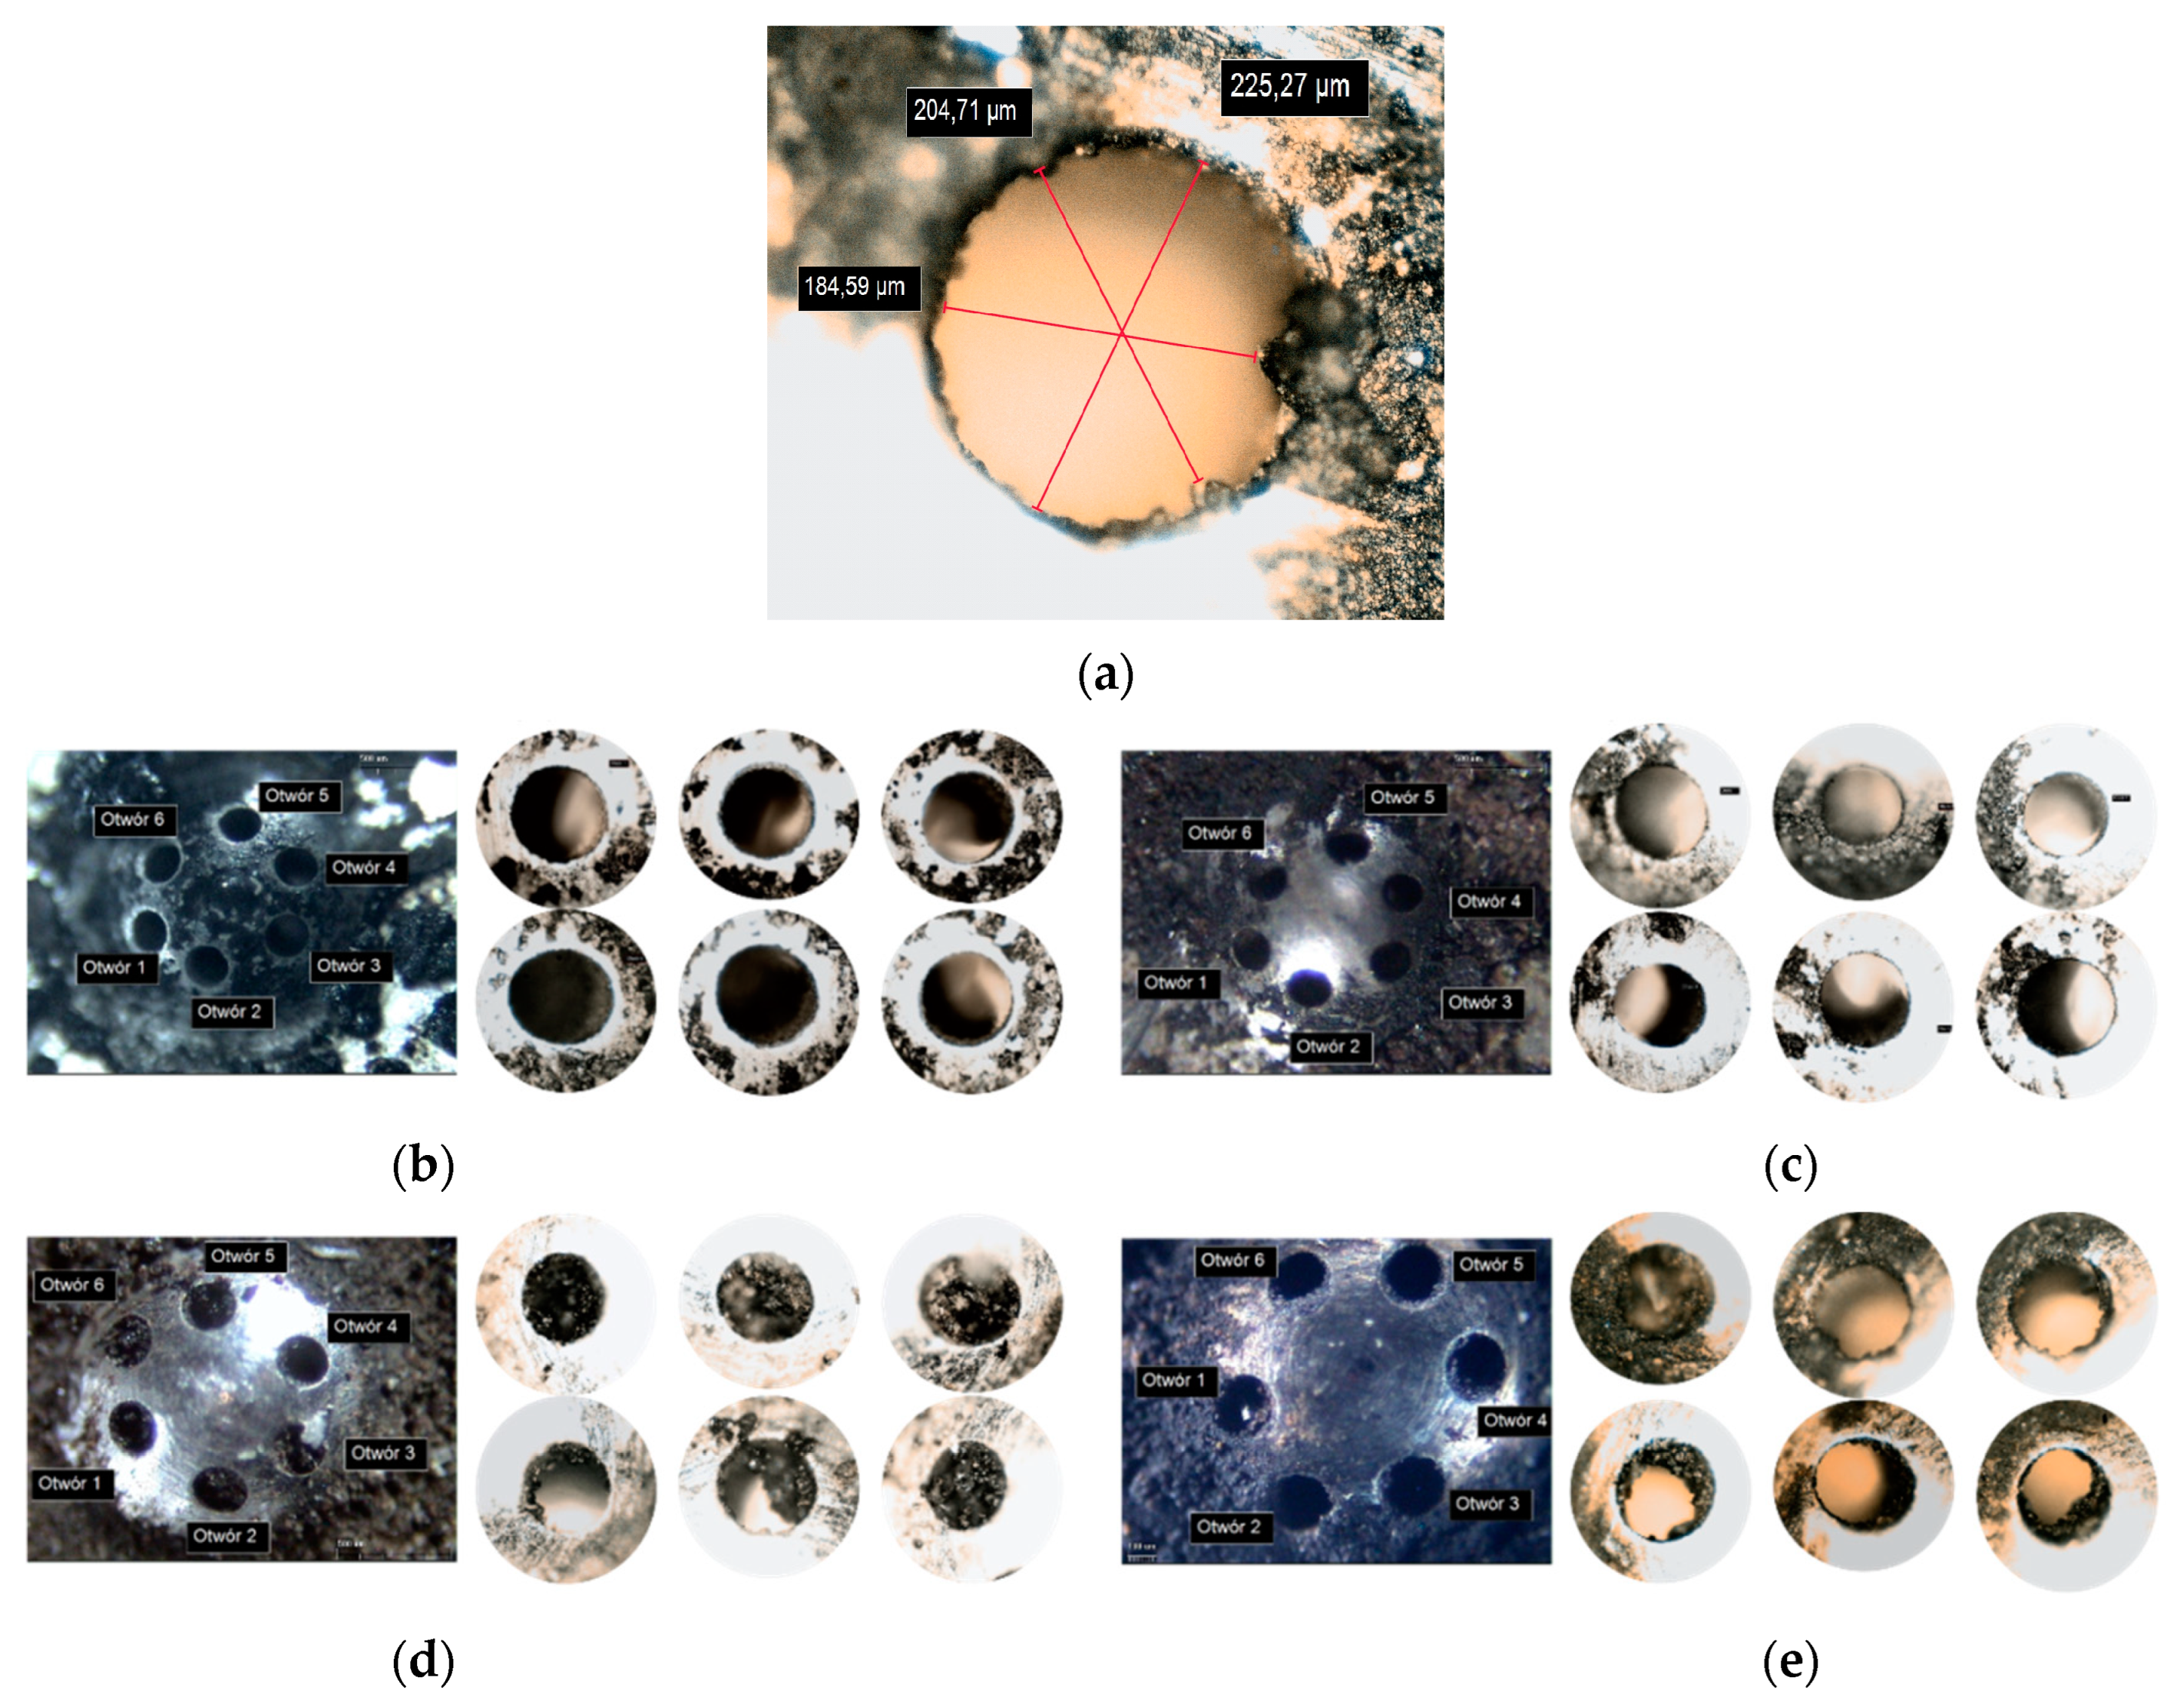
8. Visual Assessment of the Injector Nozzles

An analysis of the type of fuel used on the patency of the channels of the tested atomizer was carried out using an optical microscope. The results of the observations are included in the form of summary images in Figure 12.
General views of the injector nozzle covering all six orifices and close-ups of the nozzle channel outlet (Figure 12) indicate the formation of deposits for each fuel tested. Substantial differences in the amount and location of deposits were observed. It was found that the reference fuel used in the study produced such large deposits that they were the cause of significant blockages of some atomizer channels (Figure 12a). Using the base + 20B fuel also showed significant numbers of deposits; they did not completely plug the atomizer channels (Figure 12b). The deposits observed in Figure 12b were most likely partially reduced (in addition to the use of butanol fuel) by making a cylindrical deepening in the spray channel.
Further observations of the nozzle tips made it possible to note that the application of butanol-blended fuel following the 72 h CleanUp test (Figure 12c) resulted in the formation of deposits that adhered after the combustion process on a significant part of the surface of the nozzle tip canopy (Pre-Hole). The above deposits on the nozzle tip bowl (Pre-Hole) were not observed in Figure 12a–c. However, for the case in question, the deposits were clearly away from the edge of the channel mouth on the side of the combustion chamber. The views of the individual holes in Figure 12c,d indicate the presence of very small deposits in the individual channel mouths of the atomizer. This demonstrates the deposit-reducing capabilities and cleaning abilities of butanol for the Keep-Clean (base)+CleanUp (base + 20B) test, particularly evident at the edge of the injector nozzle channel mouth on the combustion chamber side (Pre-Hole) (Figure 12c). Microscopic observations (no clear deposits at the mouth of the injector channels—Figure 12d) seem to confirm the advisability of using and preventing the formation of deposits in the injector channels by applying a DCA-type additive to the fuel.

9. Conclusions

The study shows that in the case of non-butanol fuel, the process of fuel injection time increment as the test proceeds is linear. It can be hypothesized that if the conduct of the test were to be prolonged by an unspecified time, there would be a further increase in injection time. Thus, there would be an increase in deposits on the tips and the fuel outlet holes of the injectors. A different course and tendency of the process of increasing the injection time of a single dose of fuel was observed in the case of fuel doped with butanol. Here the course is logarithmic. After the initial period of progressive increase in the injection time of the fuel dose, it is followed by its stabilization over time at a certain level. As a result, butanol-doped fuel has a lower tendency to foul fuel injectors. In this case, it can be hypothesized that increasing the time of running the test would not cause significant changes in the average injection time of a single fuel dose. The alcohol-compatible additive DCA for refining alcohol-blended fuel is very effective in flushing out previously formed injector deposits. This means an equal reduction in the average injection time of the fuel dose.
Based on the research and analysis carried out, specific conclusions were formulated for each stage of the work.
  • The research on changes in fuel injection time indicates that there is a relationship between the use of fuel additives and injection time:
    • Butanol admixture to the base fuel deposits the injector, and the changes are linear;
    • Butanol admixture causes a linear increase in injection time up to about 30% of the duration of the engine dynamometer test; after that, injection time stabilization is observed, indicating no further deposit formation;
    • The use of butanol-blended gasoline (without DCA) in the CleanUp procedure does not change significantly the contamination status of the injectors;
    • The use of fuel with the addition of DCA in the CleanUp procedure causes a sharp increase in the flow cross-section of the injector orifices (as evidenced by the reduction in fuel injection time).
  • Studies on geometric indicators of the jet under halogen lighting indicate:
    • The spray area analysis shows that the results coincide with those of the studies on injection time changes; the use of standard fuel significantly reduces the spray area due to deposit;
    • The spray area corresponds to the angle of the cone;
    • The degree of coking of the injector has no significant effect on the jet penetration;
    • The use of the CleanUp phase with butanol yields better results than running the injector on a mixture of base fuel and butanol during the Keep-Clean phase (14.1% increase in area field);
    • The addition of DCA achieves the best results from the analyzed cases in restoring injector patency.
  • The research on the evaluation of the jet in cross-section using laser illumination made the following possible:
    • Determination of the size of the cross-sectional projection of the fuel jet, which makes it possible to evaluate the spray area for each atomizer orifice separately;
    • Assessing the degree of contamination of the injectors by analyzing the optical merging or significant reduction of the outflow of the injected fuel jet;
    • Assessment of the unevenness of fuel outflow from the injector orifices.
  • Observation of the condition of the tip of the atomizer using an optical microscope allowed us to determine the following conclusions:
    • The use of base fuel causes the formation of numerous deposits, which can even completely pivot the mouths of the injector channels of a GDI-type injector;
    • The admixture of butanol to the fuel (base + 20B) in the Keep-Clean (base + 20B) test can cause only partial journaling of the mouth of the channels of the GDI-type injector;
    • The admixture of butanol in the Keep-Clean (base) + CleanUp (base + 20B) test appears to have a marked effect on reducing deposit formation relative to the base or butanol-doped fuel in the 48 h test;
    • The occurrence of sparse deposits at the mouth of the nozzle channel of the GDI-type injector on the side of the combustion chamber when operated with the DCA-type fuel indicates the effectiveness of reducing deposit formation by the additive used.
    • The potential of the hybrid test methodology presented in this paper will allow it to be used in the future to assess injector deposits formed by fuels containing up to 85%(v/v) alcohol. It is also possible to use this test methodology to assess injector deposits of compression ignition engines.
    • Based on the conclusions, it would be worth expanding the study in the future to use other alcohols and evaluate the effects of their interaction with DCA. In addition, optical microscopy proved to be instrumental in identifying injector tip fouling. For better visual evaluation of the holes’ interiors, it is worthwhile to undertake studies using a scanning electron microscope.

Author Contributions

Conceptualization, Z.S., I.P., F.S., and G.K.; methodology, Z.S., F.S., and I.P.; software, I.P., and F.S.; validation, Z.S., F.S., and G.K.; formal analysis, F.S., and G.K.; investigation, Z.S., I.P., F.S., and G.K.; resources, Z.S.; data curation, Z.S.; writing—original draft preparation, Z.S., F.S., I.P., and G.K.; writing—review and editing, I.P., and F.S.; visualization, F.S., and G.K.; supervision, Z.S.; project administration, Z.S., and I.P. All authors have read and agreed to the published version of the manuscript.

Funding

This research received no external funding.

Data Availability Statement

Not applicable.

Conflicts of Interest

The authors declare no conflict of interest.

References

  1. Stępień, Z.; Żak, G.; Markowski, J.; Wojtasik, M. Investigation into the impact of the composition of ethanol fuel deposit control additives on their effectiveness. Energies 2021, 14, 604. [Google Scholar] [CrossRef]
  2. Sun, Z.; Li, X.; Nour, M.; Xu, M. Investigation of flash boiling spray and combustion in SIDI engine under low-speed homogeneous lean operation. In SAE Technical; SAE International: Warrendale, PA, USA, 2021. [Google Scholar] [CrossRef]
  3. Wouters, C.; Lehrheuer, B.; Pischinger, S.; Seifert, P.; Raabe, T.; Kolbeck, M.; Rausch, B.; Menger, L.; Kulzer, A.C. Evaluation of synthetic gasoline fuels and alcohol blends in a spark-ignition engine. SAE Int. J. Fuels Lubr. 2022, 15, 333–347. [Google Scholar] [CrossRef]
  4. Gainey, B.; Hoth, A.; Waqas, M.; Lawler, B.; Kolodziej, C. High temperature HCCI critical compression ratio of the C1-C4 alcohol fuels. SAE Int. J. Adv. Curr. Prac. Mobil. 2021, 3, 1495–1507. [Google Scholar] [CrossRef]
  5. Stępień, Z.; Pielecha, I.; Cieślik, W.; Szwajca, F. The impact of alcohol admixture with gasoline on carbon buildup and fuel injectors performance. Eksploat. Niezawodn. 2022, 24, 226–236. [Google Scholar] [CrossRef]
  6. Karavalakis, G.; Durbin, T.D.; Shrivastava, M.; Zheng, Z.; Villela, M.; Jung, H. Impacts of ethanol fuel level on emissions of regulated and unregulated pollutants from a fleet of gasoline light-duty vehicles. Fuel 2012, 93, 549–558. [Google Scholar] [CrossRef]
  7. Knoll, K.; West, B.; Huf, S.; Thomas, J.; Orban, J.; Cooper, S. Effects of mid-level ethanol blends on conventional vehicle emissions. In SAE Technical; SAE International: Warrendale, PA, USA, 2009. [Google Scholar] [CrossRef] [Green Version]
  8. Stepien, Z.; Urzedowska, W.; Oleksiak, S.; Czerwinski, J. Research on emissions and engine lube oil deterioration of diesel engines with biofuels (RME). SAE Int. J. Fuels Lubr. 2011, 4, 125–138. [Google Scholar] [CrossRef]
  9. Stępień, Z. Influence of physico-chemical properties of gasoline on the formation of DISI engine fuel injector deposits. Comb. Engines 2021, 184, 16–23. [Google Scholar] [CrossRef]
  10. Xu, H.; Wang, C.; Ma, X.; Sarangi, A.K.; Weall, A.; Krueger-Venus, J. Fuel injector deposits in direct-injection spark-ignition engines. Prog. Energ. Combust. 2015, 50, 63–80. [Google Scholar] [CrossRef]
  11. Medina, M.; Alzahrani, F.M.; Fatouraie, M.; Wooldridge, M.S.; Sick, V. Mechanisms of fuel injector tip wetting and tip drying based on experimental measurements of engine-out particulate emissions from gasoline direct injection engines. Int. J. Engine Res. 2020, 22, 2035–2053. [Google Scholar] [CrossRef]
  12. Altin, O.; Eser, S. Carbon deposit formation from thermal stressing of petroleum fuels. ACS Div. Fuel Chem. Prepr. 2004, 49, 764–766. [Google Scholar]
  13. Galloni, E.; Fontana, G.; Staccone, S.; Scala, F. Performance analyses of a spark-ignition engine firing with gasoline-butanol blends at partial load operation. Energy Convers. Manag. 2016, 110, 319–326. [Google Scholar] [CrossRef]
  14. Elfasakhany, A. Performance and emissions of spark-ignition engine using ethanol–methanol–gasoline, n-butanol–iso-butanol–gasoline and iso-butanol–ethanol gasoline blends. Eng. Sci. Technol. Int. J. 2016, 19, 2053–2059. [Google Scholar] [CrossRef] [Green Version]
  15. Pałuchowska, M.; Stępień, Z. Evaluation of ethanol fuels in engine and field tests. Nafta-Gaz 2017, 2, 97–104. [Google Scholar] [CrossRef]
  16. Henkel, S.; Hardalupas, Y.; Taylor, A.; Conifer, C.; Cracknell, R.; Goh, T.K.; Reinicke, P.-B.; Sens, M.; Rieß, M. Injector fouling and its impact on engine emissions and spray characteristics in gasoline direct injection engines. SAE Int. J. Fuels Lubr. 2017, 10, 287–295. [Google Scholar] [CrossRef] [Green Version]
  17. Smocha, R.; Vuilleumier, D.; Christison, K.; Loeper, P.; Ketterer, N.; Pickett, L.; Hwang, J.; Kim, N.; Stickland, T. Gasoline direct injector deposits: Impacts of fouling mechanism on composition and performance. SAE Int. J. Adv. Curr. Prac. Mobil. 2022, 4, 1413–1430. [Google Scholar] [CrossRef]
  18. Göktaş, M.; Balki, M.K.; Sayin, C.; Canakci, M. An evaluation of the use of alcohol fuels in SI engines in terms of performance, emission and combustion characteristics: A review. Fuel 2021, 286, 119425. [Google Scholar] [CrossRef]
  19. Li, X.; Zhen, X.; Wang, Y.; Tian, Z. Numerical comparative study on performance and emissions characteristics fueled with methanol, ethanol and methane in high compression spark ignition engine. Energy 2022, 254, 124374. [Google Scholar] [CrossRef]
  20. Veloo, P.S.; Wang, Y.L.; Egolfopoulos, F.N.; Westbrook, C.K. A comparative experimental and computational study of methanol, ethanol and n-butanol flames. Combust. Flame 2010, 157, 1989–2004. [Google Scholar] [CrossRef]
  21. Gautam, M.; Martin, D.W. Combustion characteristics of higher-alcohol/gasoline blends. Proc. Inst. Mech. Eng. Part A J. Power Energy 2000, 214, 497–511. [Google Scholar] [CrossRef]
  22. Venugopal, T.; Ramesh, A. Effective utilization of butanol along with gasoline in a spark ignition engine through a dual injection system. Appl. Therm. Eng. 2013, 59, 550–558. [Google Scholar] [CrossRef]
  23. Elfasakhany, A. Experimental study of dual n-butanol and iso-butanol additives on spark-ignition engine performance and emissions. Fuel 2016, 163, 166–174. [Google Scholar] [CrossRef]
  24. Merola, S.S.; Tornatore, C.; Valentino, G.; Marchitto, L.; Corcione, F. Optical investigation of the effect on the combustion process of butanol-gasoline blend in a PFI SI boosted engine. In SAE Technical; SAE International: Warrendale, PA, USA, 2011. [Google Scholar] [CrossRef]
  25. Kale, R.; Banerjee, R. Optical investigation of flash boiling and its effect on in-cylinder combustion for butanol isomers and iso-octane. Int. J. Engine Res. 2020, 22, 1565–1578. [Google Scholar] [CrossRef]
  26. Zhou, X.; Li, T.; Yi, P. Modeling of diesel spray tip penetration during start-of-injection transients. Int. J. Engine Res. 2020, 22, 3013–3029. [Google Scholar] [CrossRef]
  27. Kumar, N.; Sonthalia, A.; Tomar, M.; Koul, R. An experimental investigation on spray, performance and emission of hydrotreated waste cooking oil blends in an agricultural engine. Int. J. Engine Res. 2020, 22, 2305–2317. [Google Scholar] [CrossRef]
  28. Stępień, Z. Utility potential of butanol as an alternative fuel for spark ignition engines. Nafta-Gaz 2020, 2, 126–135. [Google Scholar] [CrossRef]
  29. Nsikane, D.M.; Vogiatzaki, K.; Morgan, R.E.; Heikal, M.; Mustafa, K.; Ward, A.; Winder, N. Novel approach for adaptive coefficient tuning for the simulation of evaporating high-speed sprays injected into a high-temperature and high-pressure environment. Int. J. Engine Res. 2020, 21, 1162–1179. [Google Scholar] [CrossRef]
  30. Zhang, W.; Zhang, Z.; Ma, X.; Awad, O.I.; Li, Y.; Shuai, S.; Xu, H. Impact of injector tip deposits on gasoline direct injection engine combustion, fuel economy and emissions. Appl. Energy 2020, 262, 114538. [Google Scholar] [CrossRef]
Figure 1. General view of test stand with VW EA111 BLG engine (photo INIG–PIB).
Energies 16 00077 g001
Figure 2. Schematic diagram of the structure of the fuel atomization test stand using laser illumination—cross-sectional views of all fuel jets.
Energies 16 00077 g002
Figure 3. Schematic of fuel atomization tests using halogen lighting—longitudinal projection view of fuel spray.
Energies 16 00077 g003
Figure 4. View of the laser beam generation system.
Energies 16 00077 g004
Figure 5. An upgraded Nikon Eclipse MA100N metallographic microscope used for visual observations of the nozzle tip of the GDI system injector under study.
Energies 16 00077 g005
Figure 6. Changes in injection time of single doses of tested fuels obtained in Keep-Clean and Clean-Up tests.
Energies 16 00077 g006
Figure 7. Sequence of fuel spray formation images filmed at 10 kHz (∆t = 100 μs) in a constant volume chamber (example fuel spray pattern—maximum penetration S = 102 mm).
Energies 16 00077 g007
Figure 8. Analysis of geometric indices of the atomized fuel spray (six fuel jets were considered combined): (a) spray area; (b) penetration; and (c) jet cone angle.
Energies 16 00077 g008
Figure 9. Sequence of images of the fuel jet in cross-section; the view includes the full sequence of tests from 6 to 25 mm from the tip of the atomizer.
Energies 16 00077 g009
Figure 10. Cross-sectional view of the jet (ad) and area analysis (below) of individual fuels after Keep-Clean and CleanUp tests: (a,b) tests lasting 48 h and (c,d) tests lasting a total of 72 h.
Energies 16 00077 g010
Figure 11. The course of changes in the areas of the fuel spray (the sum of the six streams from the beginning of the analysis—6 mm to the end—25 mm) in cross-sections.
Energies 16 00077 g011
Figure 12. Images of the injector tips and holes after testing: (a) the hole diameter after the test as a determinant of the figure scale; (b) Keep-Clean (base); (c) Keep-Clean (base + 20B); (d) Keep-Clean (base) + CleanUp (base + 20B); and (e) Keep-Clean (base) + CleanUp (base + 20B + DCA).
Energies 16 00077 g012
Table 2. Physicochemical properties of gasoline samples prepared for engine testing.
PropertyUnitRF-12-09
Batch 11
RF-12-09
Batch 11 + 20% (v/v) Butanol
RF-12-09 Batch 11
+ 20% (v/v) Butanol
+ 500 mg/kg DCA
Test
Procedure
Notation basebase+20Bbase+20B+DCA
Research octane number96.298.898.8EN ISO 5164
Motor octane number86.188.788.7EN ISO 5163
Sulfur contentmg/kg5.03.83.7EN ISO 20846:2020
Content of hydrocarbon types: EN 15553:2009
  olefinic% (v/v)5.5<5.0<5
  aromatic% (v/v)27.825.423.8
Oxygen % (m/m)4.944.574.42EN 1601:2017-09
Organic compounds containing EN 1601:2009
oxygen:
butanol% (v/v)<0.1720.220.1
ethanol% (v/v)<0.17<0.17<0.17
Fractional composition: EN ISO + 3405:2019
  T10°C52.561.759.4
  T50°C106.8102.6101.9
  T90°C173.2153.4153.8
Table 3. Research conditions.
FuelBaseBase + 20BBase + 20B + DCA
Test
Keep-Clean (48 h)YesYes
Keep-Clean (48 h) + Clean-Up (24 h) YesYes
Disclaimer/Publisher’s Note: The statements, opinions and data contained in all publications are solely those of the individual author(s) and contributor(s) and not of MDPI and/or the editor(s). MDPI and/or the editor(s) disclaim responsibility for any injury to people or property resulting from any ideas, methods, instructions or products referred to in the content.

