1. Introduction
The urgent international desire to reduce the dependency on fossil fuels in electricity generation led to an increased penetration of renewable energy sources as an alternative for energy production [
1]. International policy makers are encouraging and funding projects to reduce the greenhouse gas emissions produced from industrial, energy, and transportation sectors. Among these sectors, the ports industry is crucial for the development of any economy, as it handles a huge portion of the international trade. As an example, the ports industry contributes with GBP 29 bn in the UK business turnover annually, with more than 115,000 jobs [
2]. Projects targeting the gas emissions reduction from ports and ships have been explored by different European countries, including Germany, Spain, and the UK, in order to fund real-world demonstrations of clean maritime technologies.
In this context, shore power becomes an important area for both research and industrial development. Shore power is supplying the vessels docked at the port by electricity for the domestic usage when the vessels turn off their engines. This electricity is used for accommodation and for the other demand by the crew and passengers. Approximately, emissions during docking form 13% of the vessels’ NOx emission, 16% of the carbon emissions, and 11% of the PM10 [
3]. Using clean energy to supply the vessels at shore-side can reduce the emissions of approximately 97% NOx and 90% for carbon emissions [
4]. In addition to the gas emissions, residents living near to the shore-side are usually unsatisfied with the poor air quality and high noise generated by the vessels’ engines, which can exceed 100 dB.
Generally, there are three main challenges facing the shore power development: firstly, the high capital costs required to build the renewable energy system near to the port; secondly, the high price of electricity if the port supplies the vessel from the grid when compared to the fuel prices; then, the lack of demand during some periods when the trade movement is not consistent due to wars, pandemics, recessions, or any other reasons [
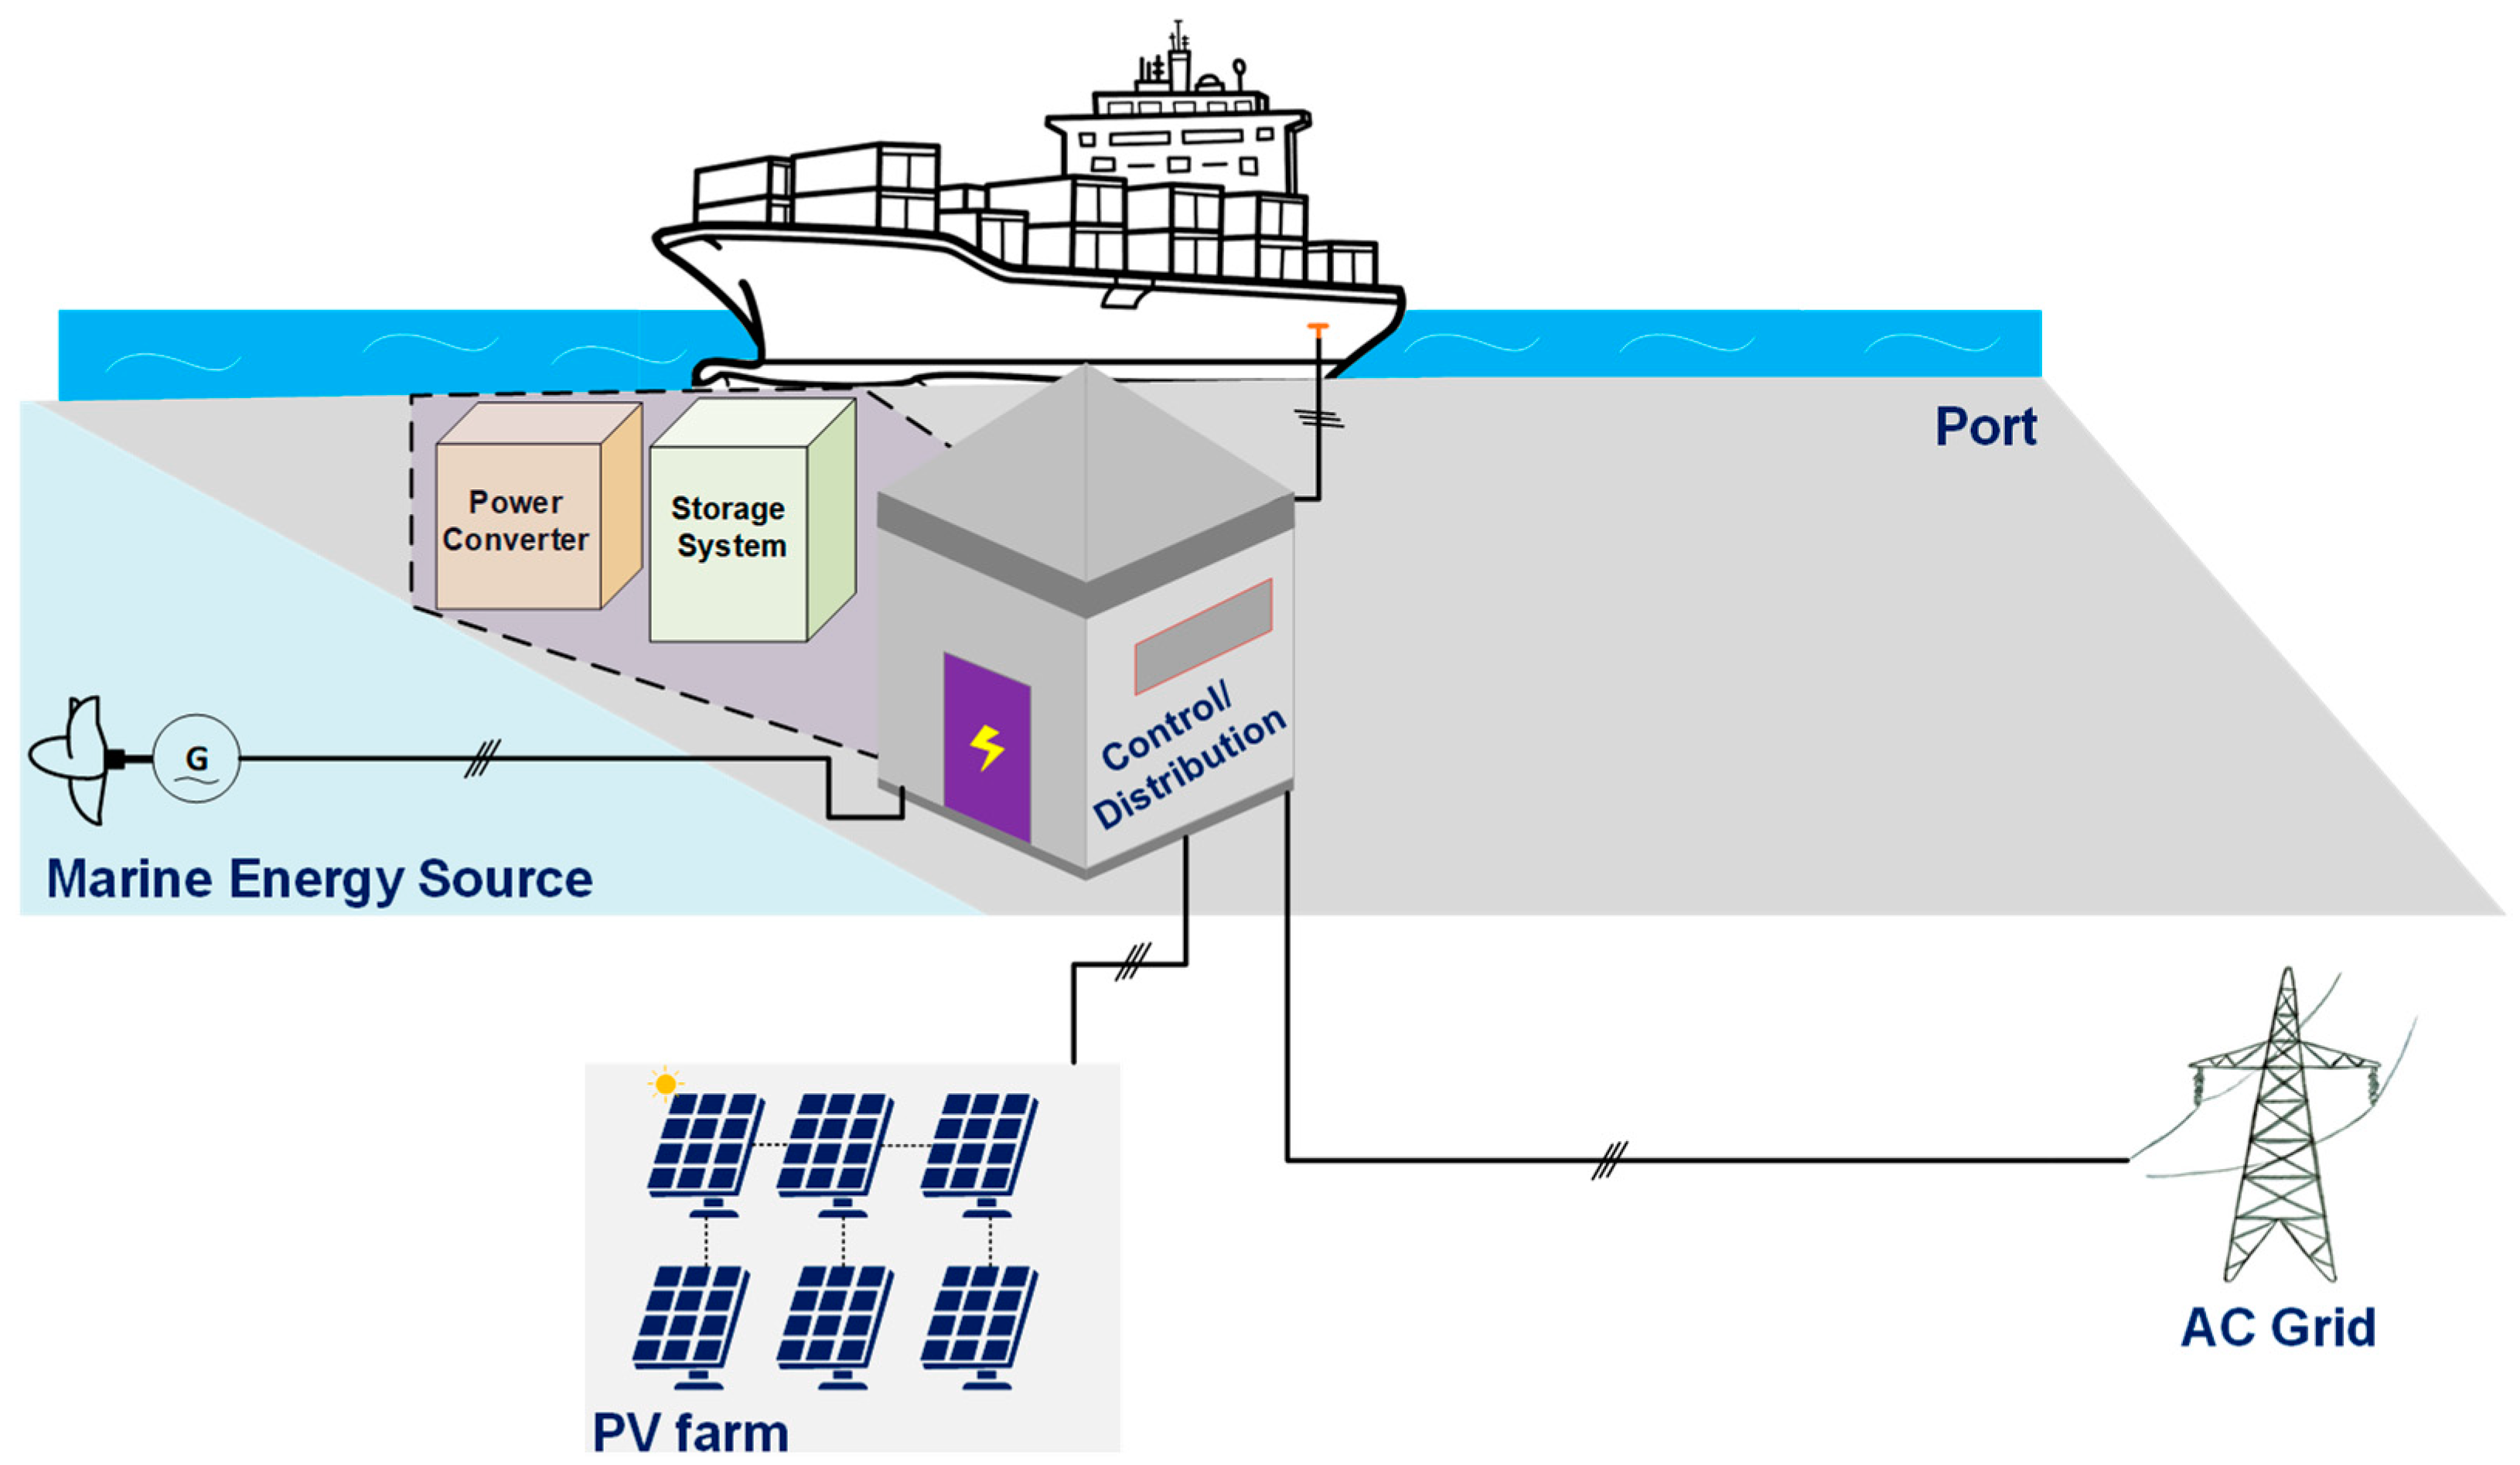
2]. This means that the port will not be able to recover the cost of the investment. In this context, this paper is focusing on the electrical system of shore power systems to help in relaxing the aforementioned barriers, especially the second and the third ones, by supplying the required power from renewable energy systems which have low running costs. Moreove, the port can be used to generate electricity and sell it to the national grid during the periods of light demands. For several shore power systems, the clean energy can be generated by different renewable energy sources (RESs), such as hydroelectric converters and photovoltaic (PV) solar systems. The electrical energy will be generated during the peak generation of the RESs, which probably will occur at different times, and then stored in the energy storage systems. Then, the port can supply the vessels by the required electricity demand when needed. In addition, the port can sell the extra electricity to the grid during off-peak times to accelerate the cost recovery. The description of the operation will be explained in more details in the next section.
The shipping ports may be a suitable place for installing marine energy sources (MESs), such as wave’s energy, currents, thermal, and tidal energy systems [
5,
6,
7]. The employed hydroelectric source type depends on the physical structure of the port, the available space, and the availability of sufficient water head. These points will determine the best technology for the shore power system. Similarly, PV solar energy sources became a promising alternative among other renewable energy sources to supply the global electricity demand [
8].
The evolution of semiconductor devices, power electronics technologies, and the cost reduction of PV modules will lead to increased penetration of the PV-based electricity sources in the next period [
9]. The International Renewable Energy Agency (IRENA) monitored a more than 83% drop in the price of PV modules in 2020 when compared with the prices in 2010 [
10]. Moreover, the price of each 1 kWh generated has dropped in 2020 by 15% to less than GBP 0.05. Improving the power converters associated with the PV modules is crucial for enhancing the total efficiency, harvested energy, and the system’s reliability. Modular converters emerged as a promising candidate for these systems where the power conversion stage is formed from several submodules (SMs) instead of one bulky centralised power converter [
11].
The modular structure can increase the harvested energy from the PV modules because individual maximum power point tracking (MPPT) controllers can be employed on the PV module’s level [
12]. Decentralising the power converter stage will provide modularity and scalability so the PV system can generate high power using small semiconductor devices [
13]. This also means that, for any partial fault in few SMs, the PV system can remain in service with the proper control, which bypasses the faulted SMs [
14]. If the employed SM’s converter has an embedded high-frequency transformer (HFT), the bulky line transformer, which connects the LSPV system to the MV grid, can be eliminated, which saves massive weight, cost, and volume [
15,
16,
17]. The modular structure allows for embedding batteries with the PV modules for energy storage, where these distributed batteries can store the excess energy and deliver it to the grid when the demand is higher than the supply, e.g., at nights. However, to achieve this function, the employed converters in the SMs should allow bidirectional power flow [
18]. The modular structure will enable better charging and discharging processes for the batteries, which will improve their lifetime.
This paper proposes a new energy conversion system for a shore power system, which integrates PV modules, hydroelectric source, battery storage system, and the associated power electronic converter. The paper presents the associated control systems for different modes of operation necessary to satisfy the requirements of the shore-power converter (SPC). The power electronic modular converter is able to harvest the energy from the hydroelectric source, obtain the maximum energy from the PV modules, regulate the charging and discharging processes of the battery, and supply the energy to the utility grid when required. The Cuk inverter is chosen as the building block of the proposed converter in this application for several reasons. The Cuk inverter is descendant from the Cuk dc/dc converter, which can generate output voltages higher or lower than the input voltage from the PV module, which is necessary for MPPT operation and second-order harmonic cancellation [
15]. The inverter can be isolated with an HFT, so the input and output sides are galvanically isolated to comply with the grid’s codes [
16]. Moreover, the HFT can provide an additional voltage boosting when required. In addition, the Cuk inverter has continuous input and output currents, so the required capacitance will be minimised, which improves the reliability of the total system [
19].
The paper presents the analysis and evaluation for the proposed SPC shown in
Figure 1 and presents the control designs to ensure proper operation based on the selected mode. Following this introduction,
Section 2 explains the operation of the SECS in general.
Section 3 explains the electrical modes of operation for the proposed SECS, with focus on the electrical side.
Section 4 provides the mathematical calculations and the modulation techniques on the module’s level. The computer simulations of the proposed inverter using MATLAB/SIMULINK with the associated control schemes are also presented in
Section 4.
Section 5 shows the scaled-down experimental results, which are obtained using a 3 kW prototype controlled by a TMSF28335 DSP. Finally, the findings and conclusions are summarised in
Section 6.
3. Electrical System Level and Modes of Operation
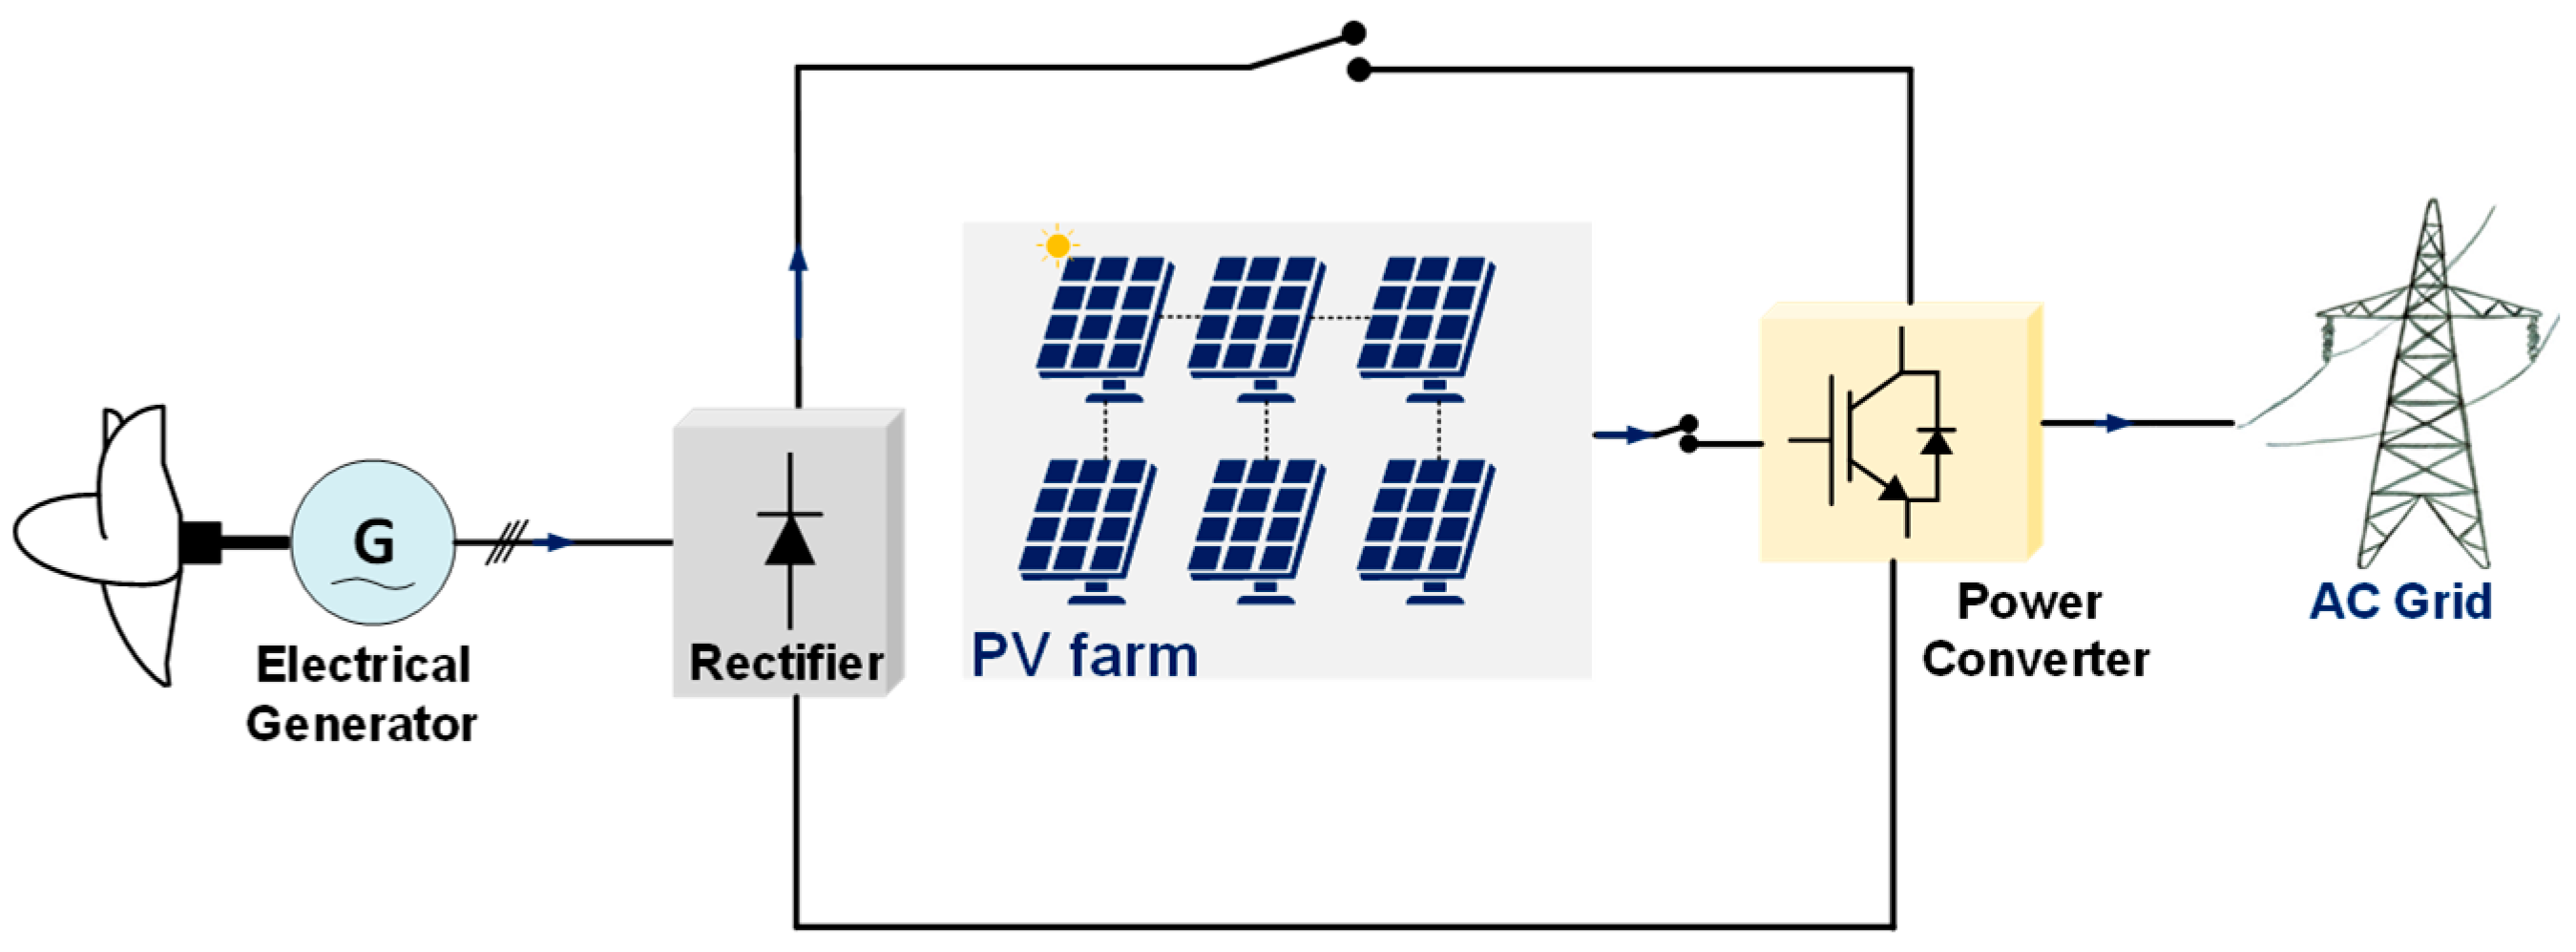
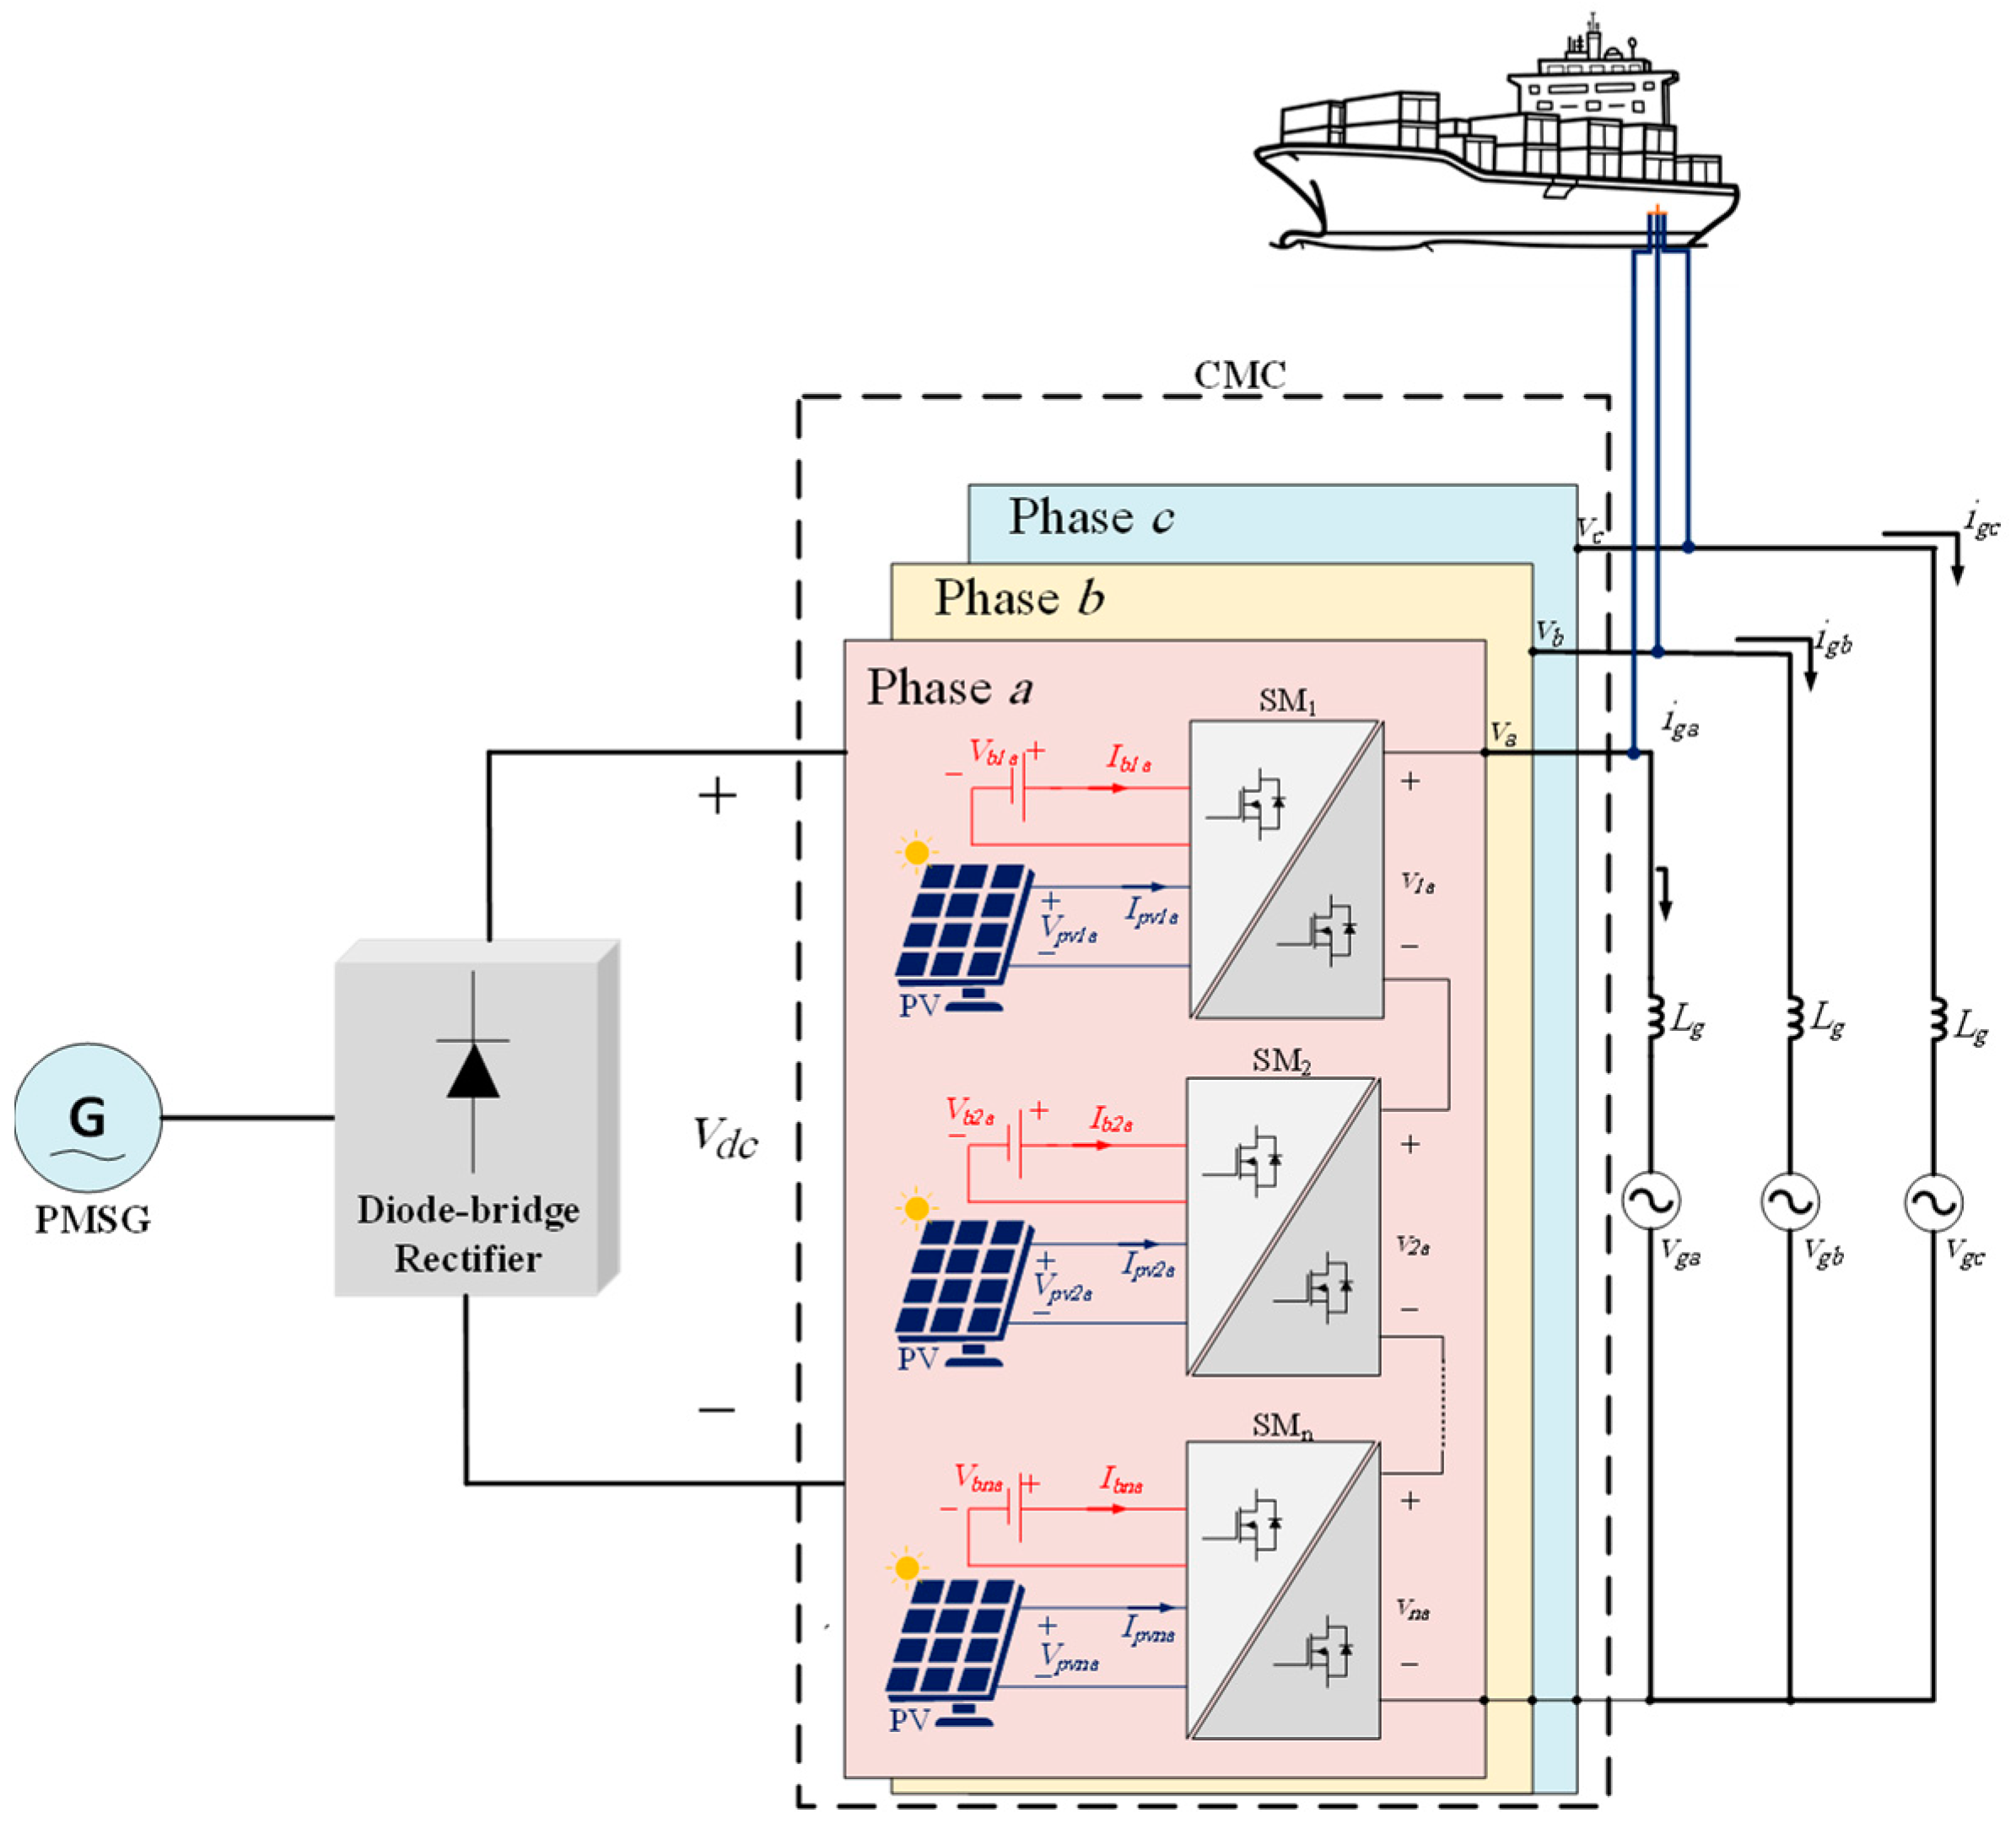
This section explains the connection of the electrical system composed of the PMSG, three-phase diode rectifier, three-phase Cuk modular converter (CMC), and then the grid filter, as shown in
Figure 6. It is worth mentioning that
Figure 6 shows the electrical connection only and not the physical connection of the system, which has been shown already in
Figure 1. For example, the physical PV modules are installed usually outside the port, while the batteries are connected together in the same room with the power converter.
The output side of the three-phase CMC can be connected directly to the vessel or to the three-phase grid through the grid inductors
Lg with an internal resistance
rg. If the system is connected to the grid, the total voltage of each phase of the converter is the summation of the individual voltages of the series SMs. These total voltages can be expressed as:
where
V is the magnitude of the output voltage and
θ is the phase shift with the grid voltage.
Vg will be defined through the paper as the magnitude of the grid three-phase voltage. If the three-phase MCI supplies active power
P to the grid at a power factor cos
φ, the values of
V, θ, and the magnitude of the three-phase output current
Ig can be expressed as:
It should be noted that the active power
P will be positive when the CMC is delivering power to the grid and negative if the grid is charging the batteries connected in parallel with the SMs. In the normal operation, the SM number
k in phase
j generates the voltage of:
where
n is the number of SMs per phase.
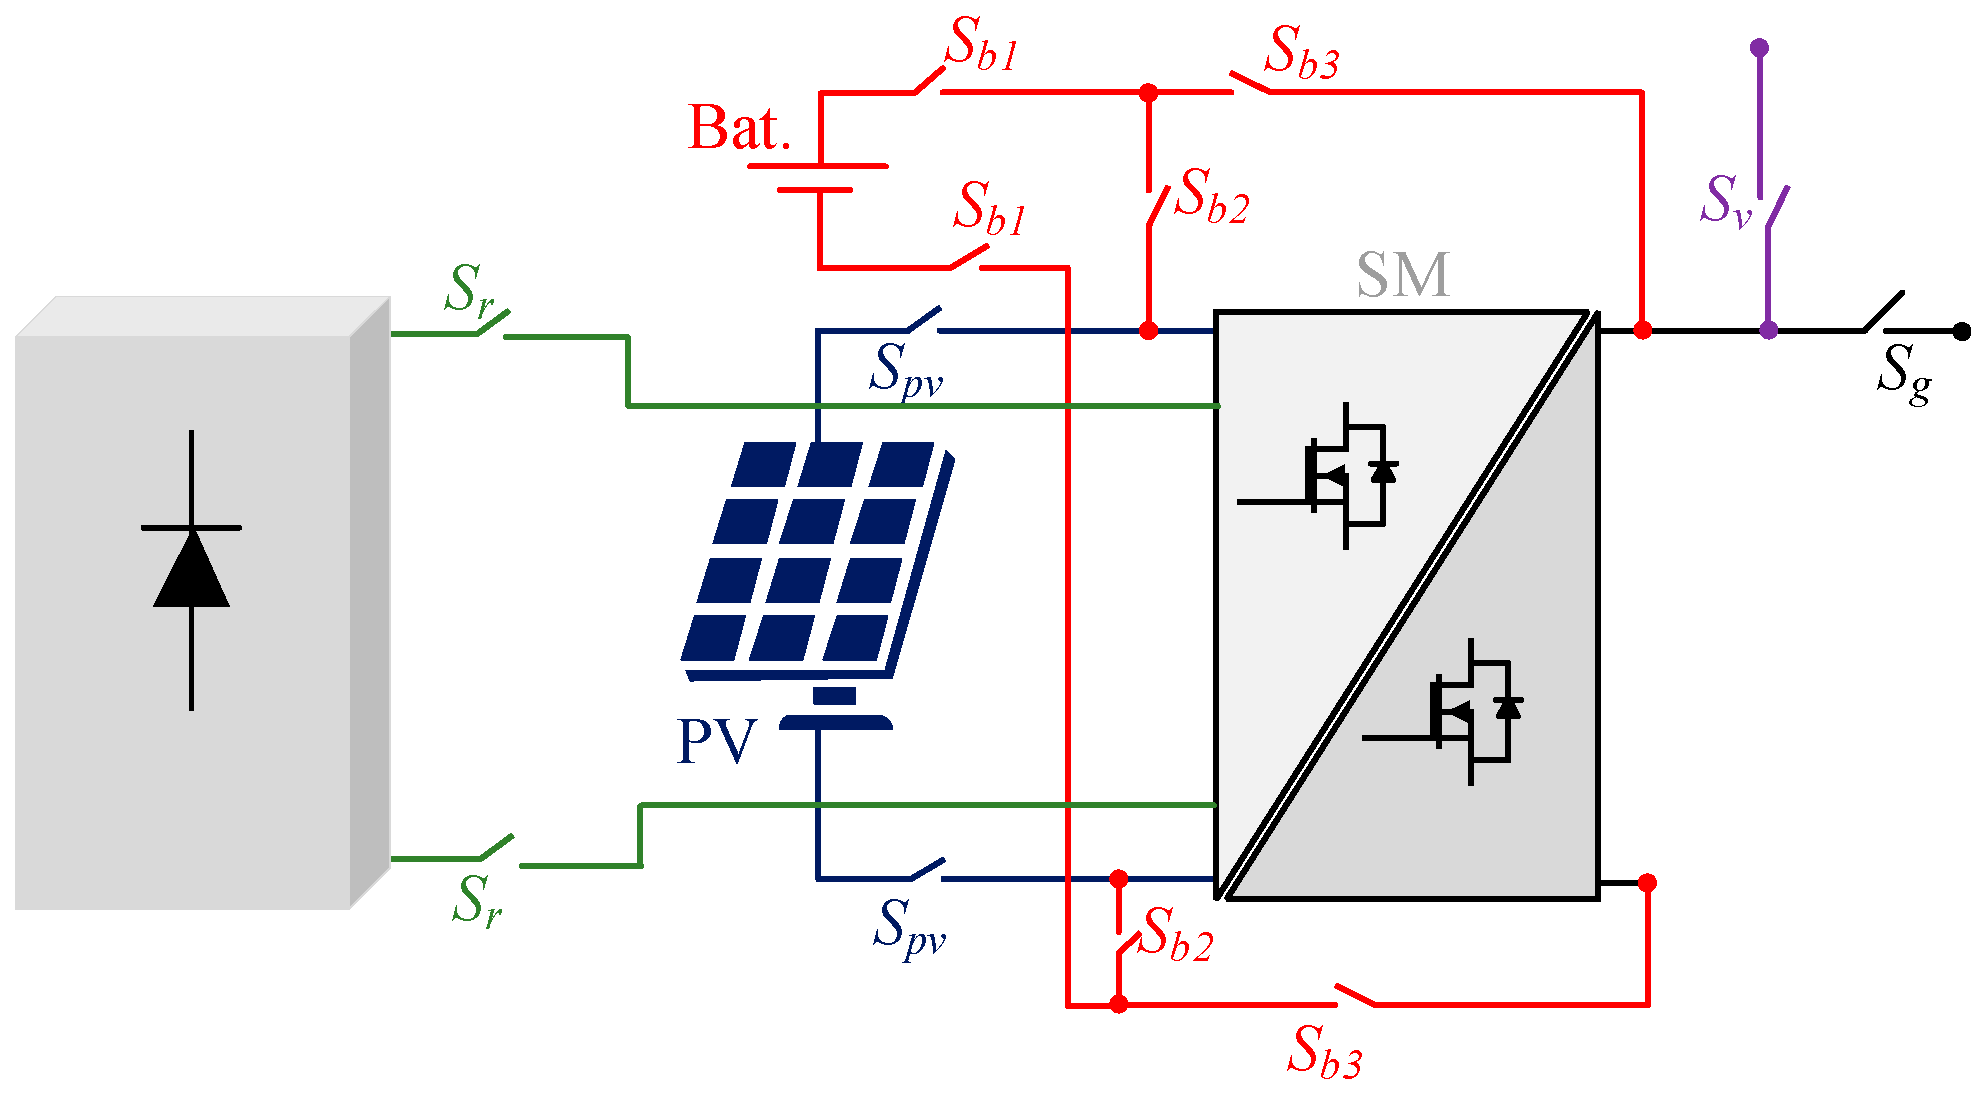
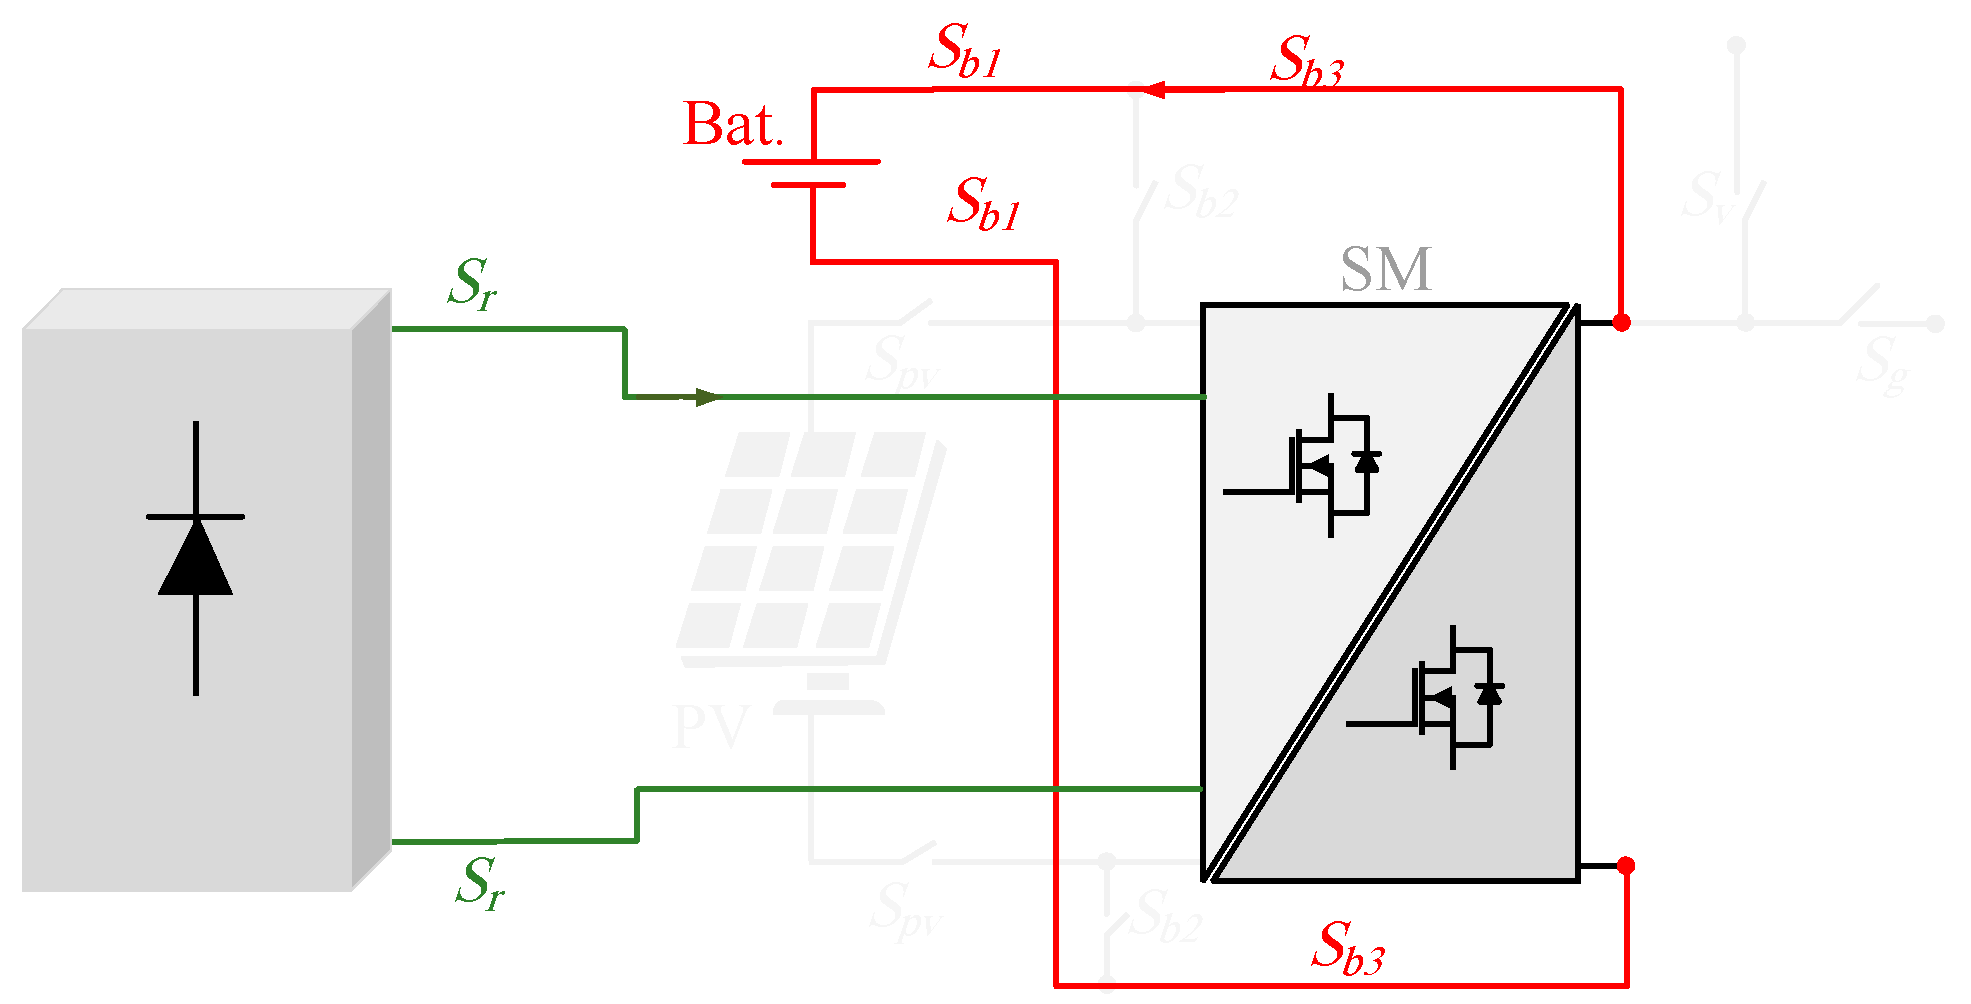
The electrical mode of operation is determined by the connection of the submodule (SM) converter to the sources and the loads.
Figure 7 shows the electrical connection of one SM using single-pole double-through (SPDT) relays, which are cheap and are available in industry.
Table 1 shows the status of the relays based on the required mode of operation.
4. Cuk Inverter as an SM
To fulfil the required modes of operation for the proposed SPC, the SM of the CMC should be able to perform four functions: (1) allowing bidirectional power flow, (2) providing flexible voltage higher or lower than the input voltages from the PV modules in order to improve the MPPT and the charging/discharging of the batteries, (3) providing galvanic between the batteries/PV modules and the load to improve, and (4) decoupling the even harmonic currents at the dc side when the SM operates as a dc/ac inverter to keep the PV/battery current constant with time. Although several inverters are able to achieve the four functions, such as dual active bridge (DAB), Buck-boost, Flyback, etc., the Cuk inverter will be selected in this work for two reasons. Firstly, the Cuk converter has continuous currents at the input and output sides, which will reduce the filtering capacitors of the PV modules and batteries. Secondly, a smaller high-frequency transformer (HFT) can be embedded between its input and output sides for isolation [
18]. The selected Cuk SM is shown in
Figure 8. The SM consists of five semiconductor switches
S1 →
S5, an isolating transformer with turns’ ratio
Ns/
Np, two inductors
L1 and
L2, two mandatory capacitors
C1 and
C2, and an optional capacitor
Co. The next subsections will analyse the operation of the SM within the full system during different modes.
4.1. Mode 1: From MES to Batteries
Figure 9 shows the SM connection to the diode rectifier of the MES generator in Mode 1. This subsection will explain the modulation scheme of the SM, the state-space representation, the control scheme, as well as MATLAB/SIMULINK simulations for the CMC.
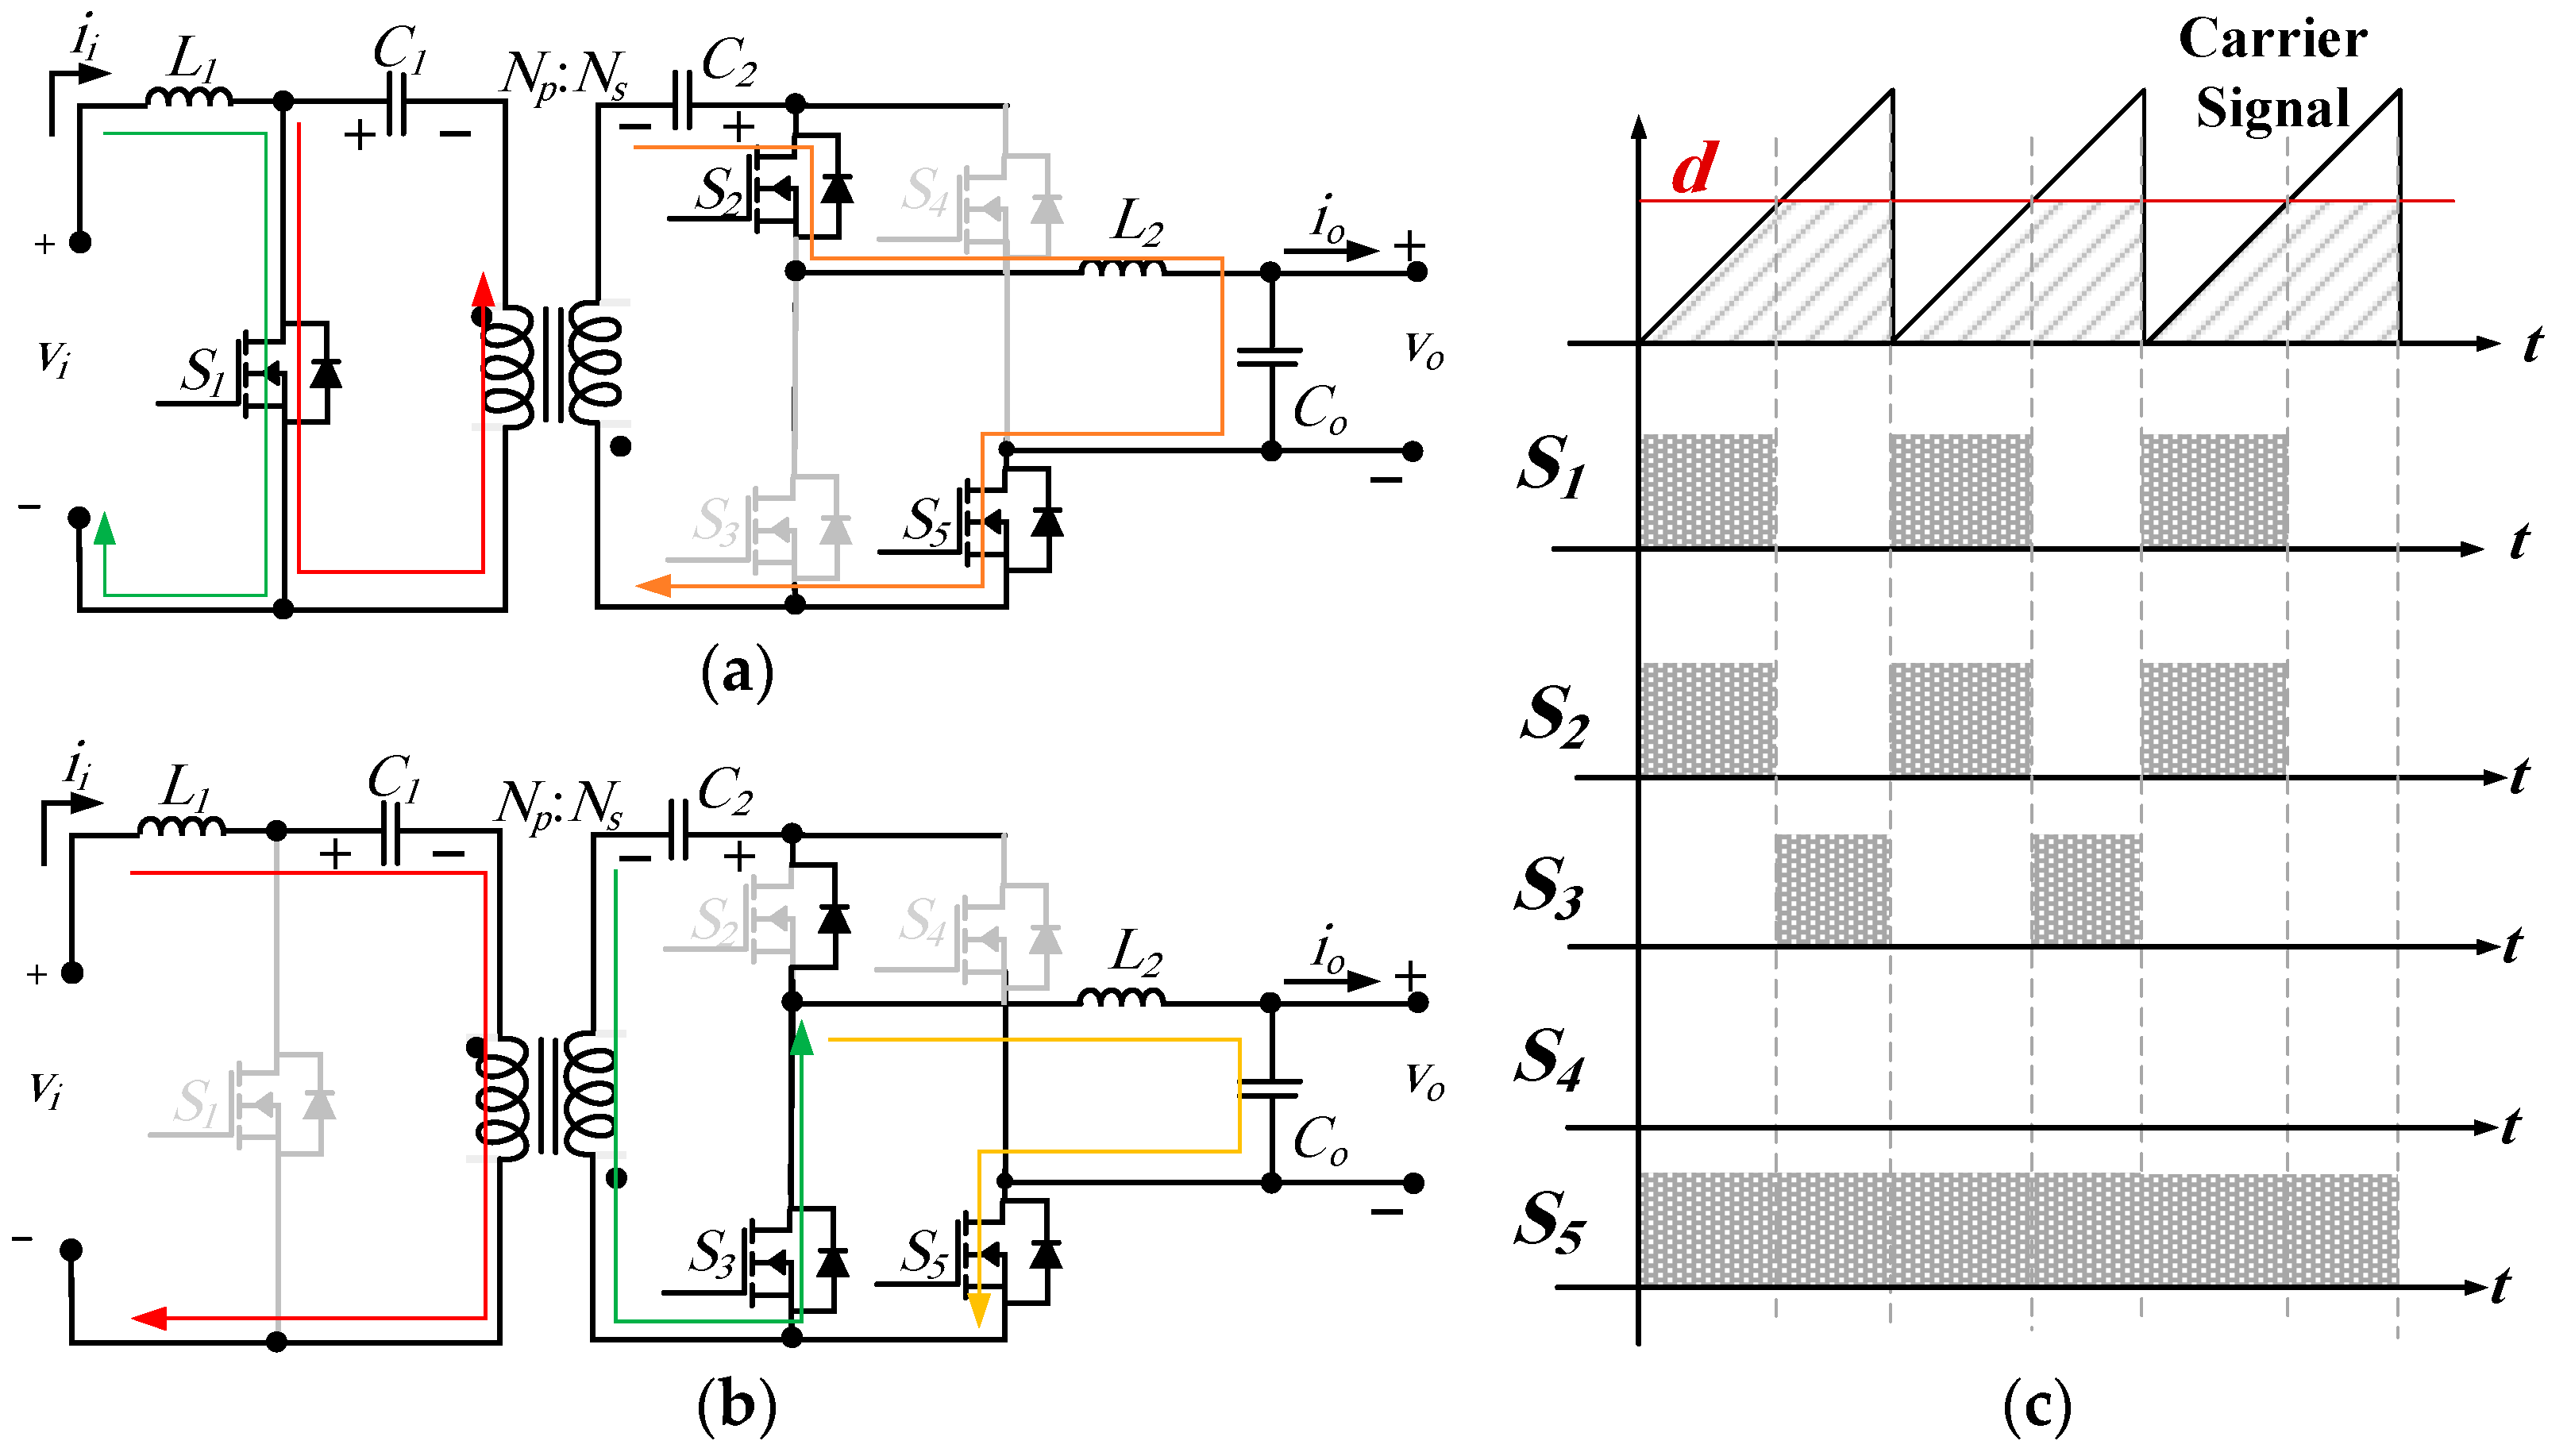
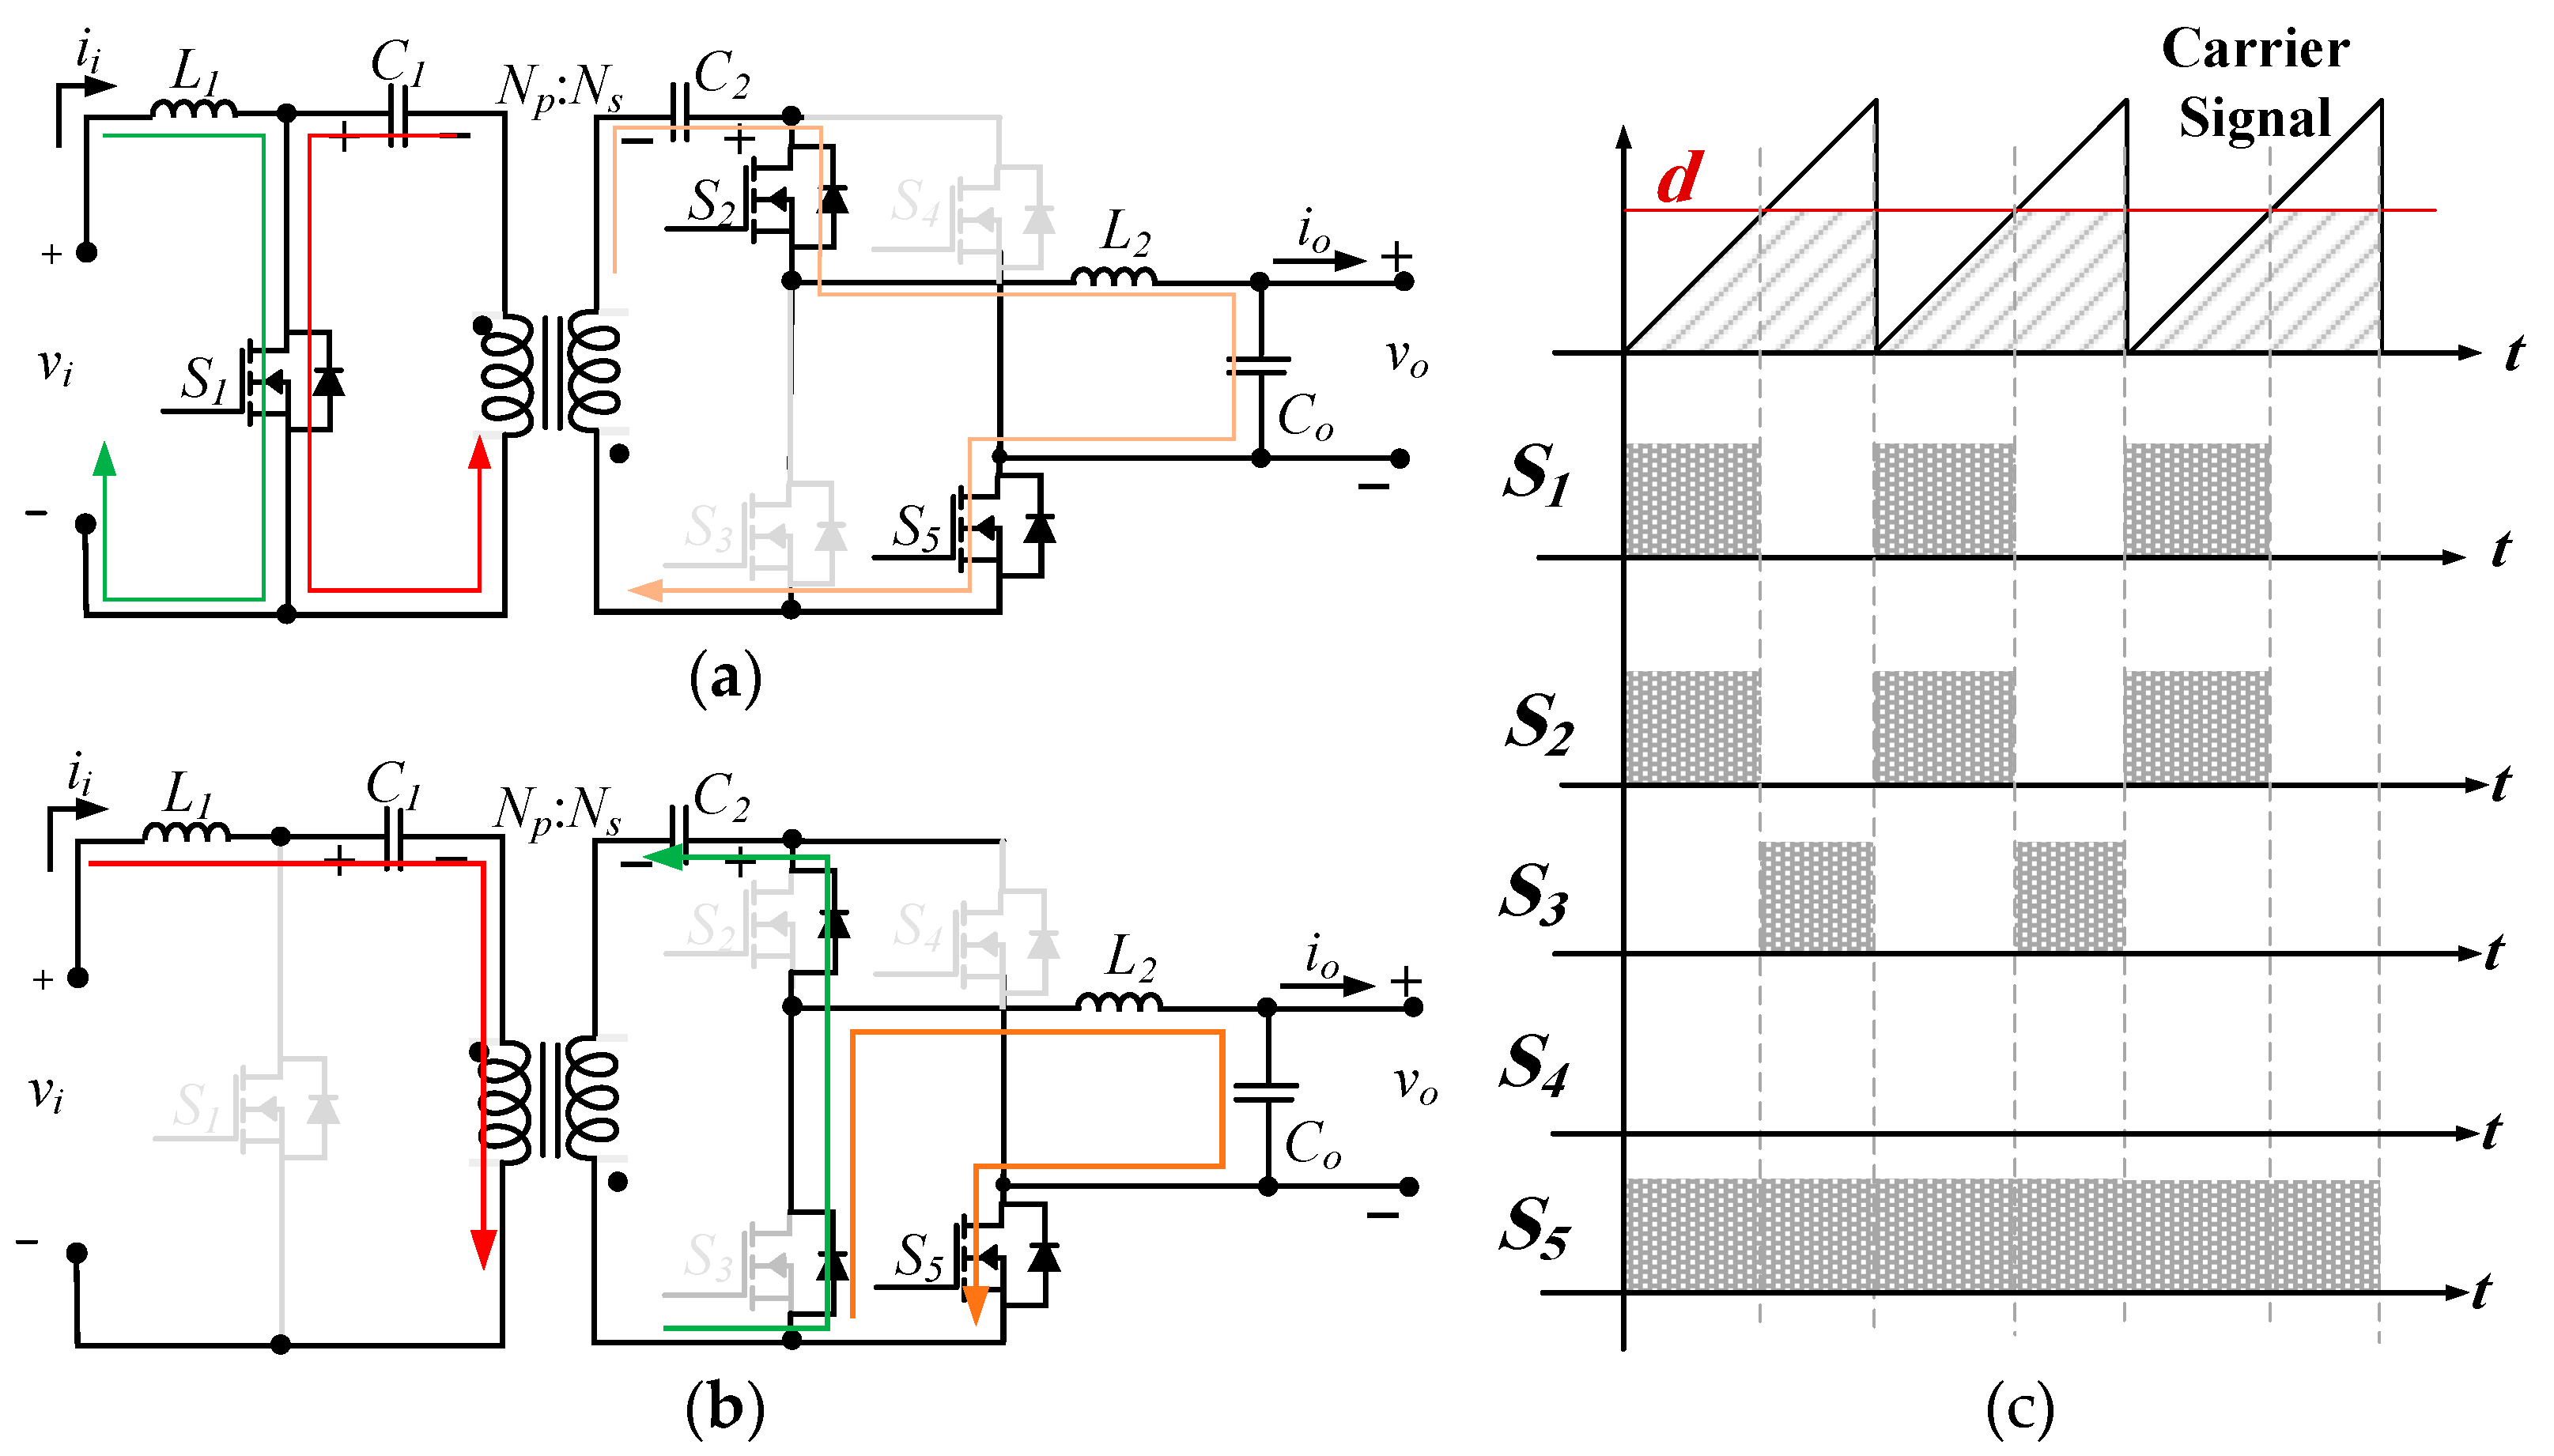
4.1.1. Modulation Scheme
In this mode, the SM is operating as a dc/dc converter. According to the state of the five active switches, the SM works in two states as follows:
Stdc1 (0 ≤
t <
ton), switches
S1,
S2, and
S5 are turned on together. The input side current
ii is increasing to charge the inductor
L1. Meanwhile, the capacitors
C1 and
C2 are discharging in the output load, leading
L2 to charge. The duration of this period is
ton =
d.
ts, where
d is the duty cycle ratio and
ts is the switching time of the SM. The currents of the SM during this state are shown in
Figure 10a.
Stdc2 (
ton ≤
t <
ts), switch
S1 is turned off and, hence, the current
ii flows into the capacitors
C1 and
C2, leading them to charge. Switches
S3 and
S5 are turned on to provide a path for the current in
L2 to flow and, hence, the inductors’ currents decrease. This state is shown in
Figure 10b.
The modulation scheme for this mode is shown in
Figure 10c.
4.1.2. Control System
The state vector of the SM in this case can be assumed as
x(
t) = [
ii(
t)
vCt(
t)
iL2 (
t)
vo(
t)
io (
t)] and the output
ydc(
t) =
io(
t) is the battery current.
vb is the battery voltage,
Lb is its equivalent inductance, and
rb is its internal resistance. The large-signal average model is deduced in (4).
The large-signal transfer function of the converter is calculated from:
Thus, the large-signal transfer function of the converter is:
The state-space representation of the SM is linearised to obtain the small-signal model where the superscript ‘~’ refers to the incremental variation of a state, while the subscript ‘
e’ stands for the equilibrium point of a state. To obtain the small-signal models, the small-signal matrices are arranged as:
Accordingly, the small-signal model is expressed as:
The small-signal s-domain transfer function between the control input
d to the output
ig can be deduced as:
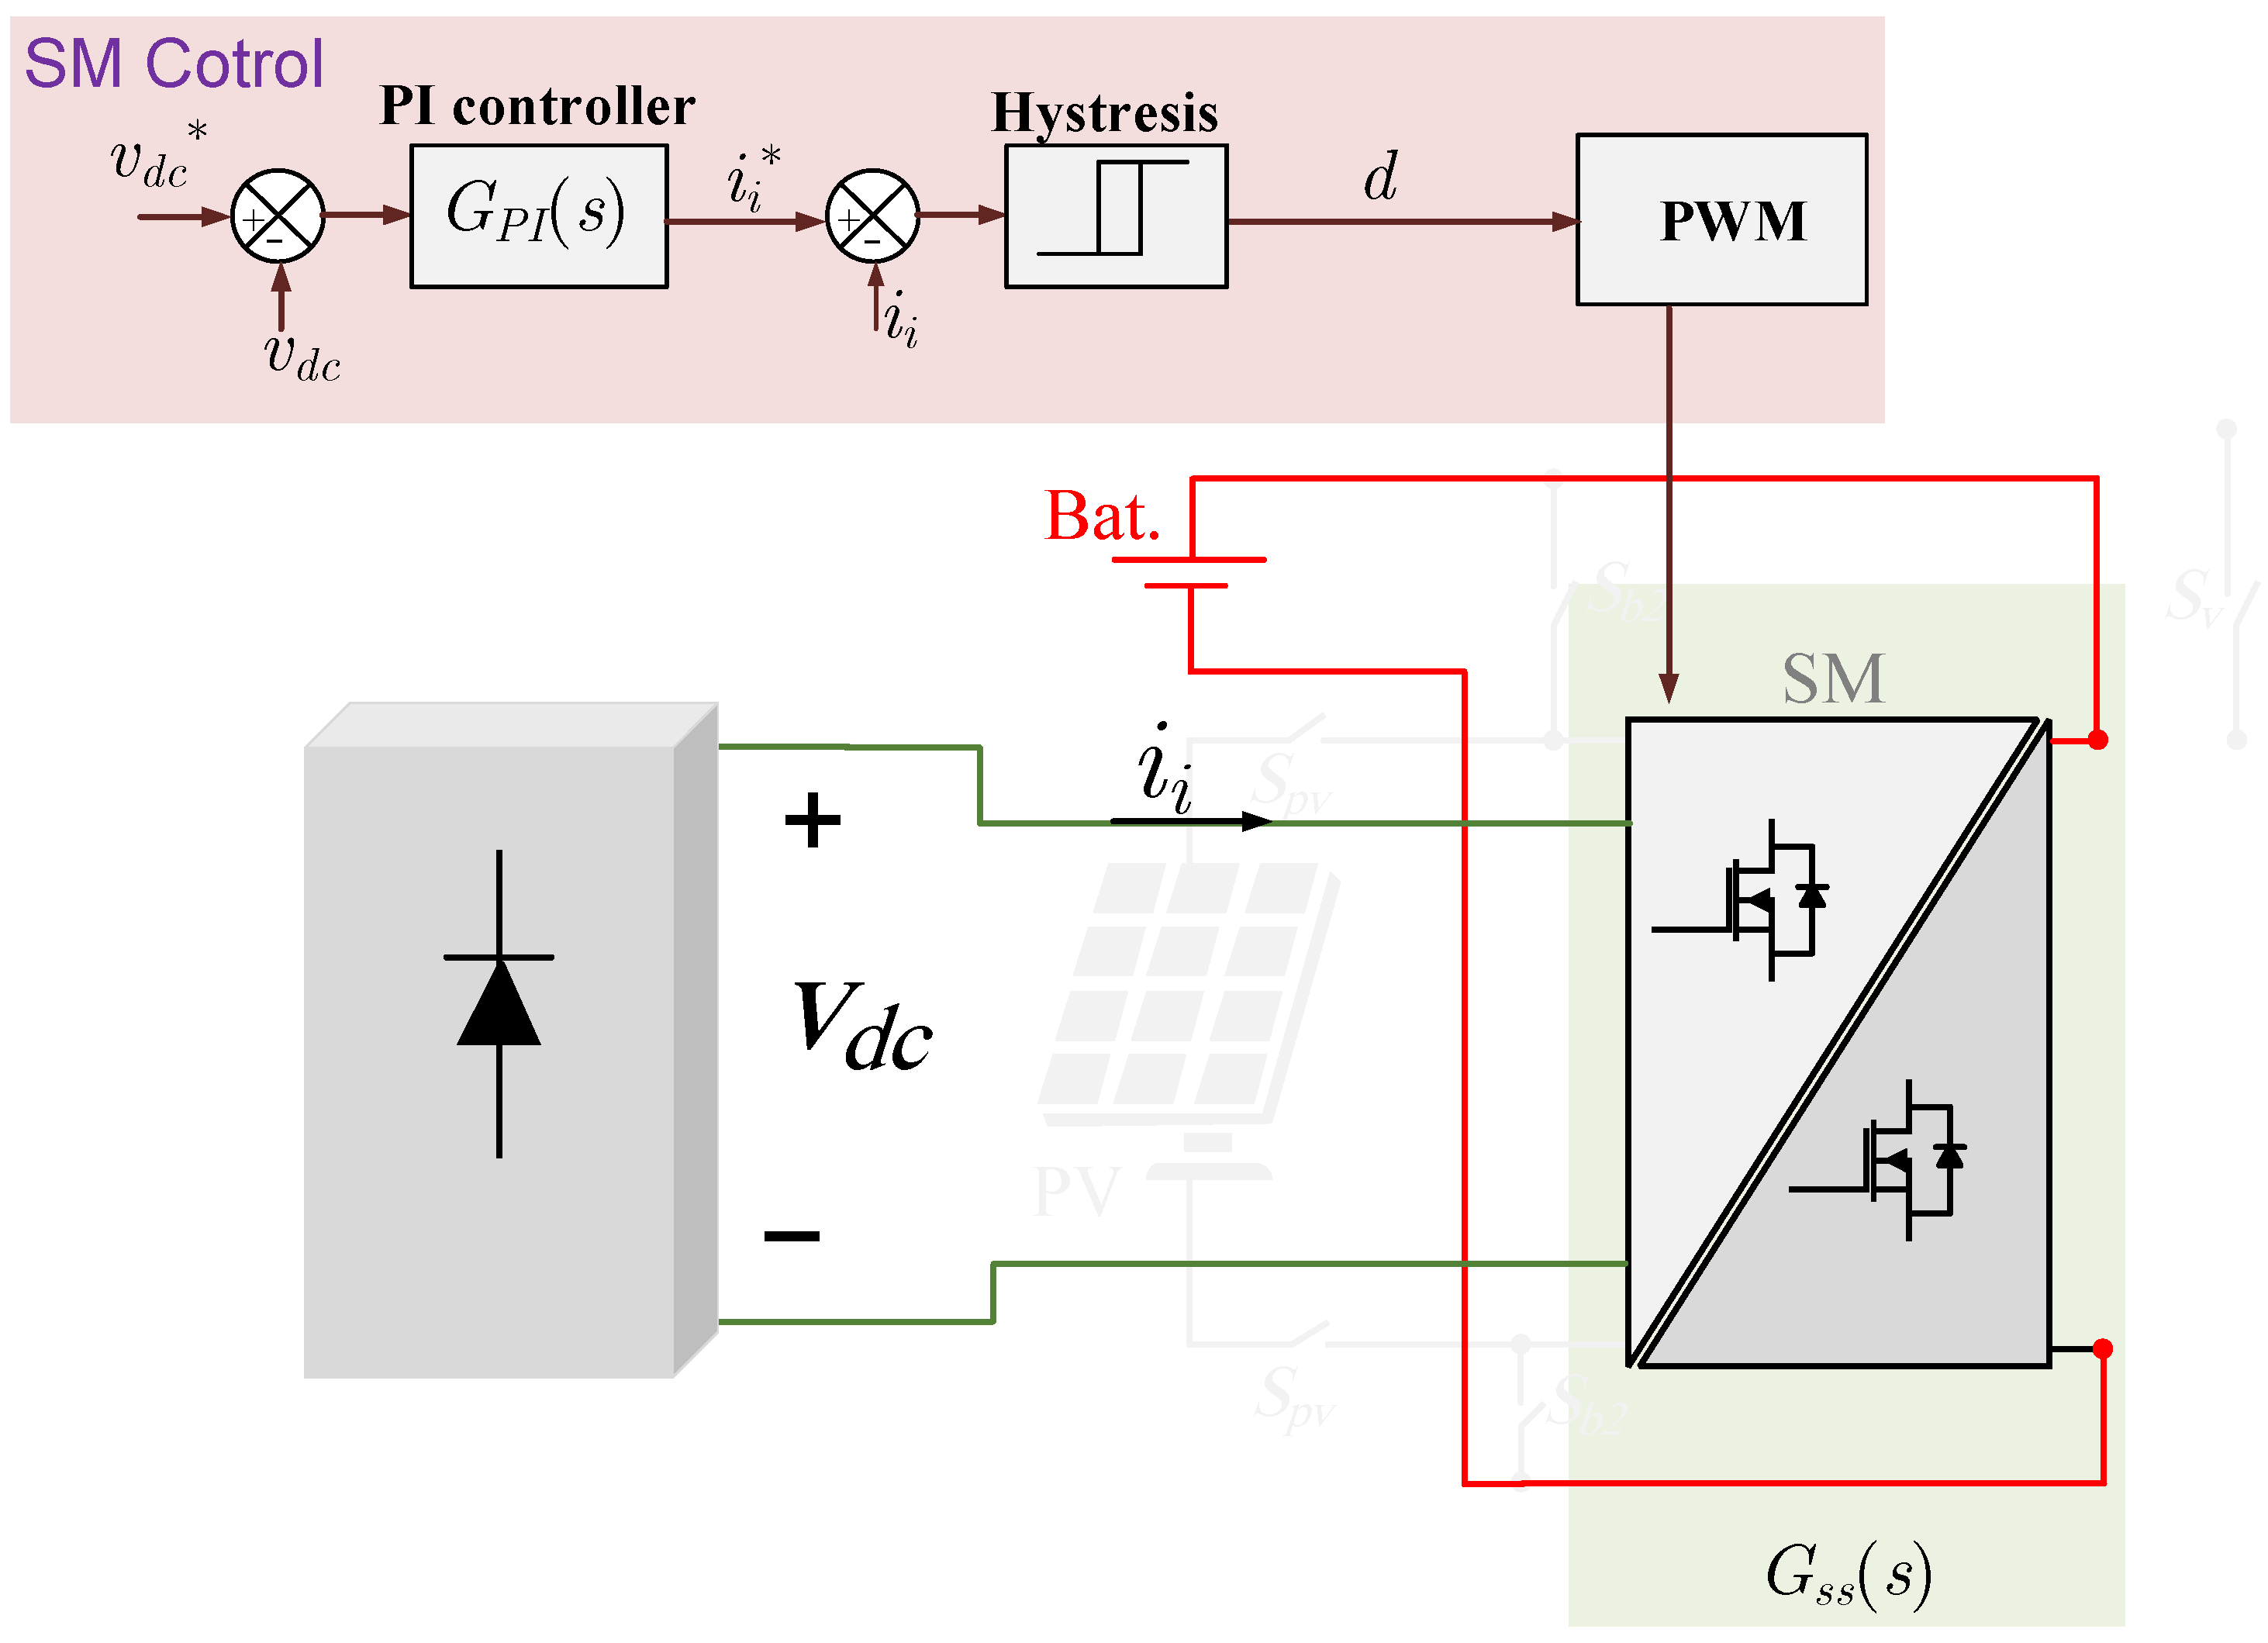
Figure 11 shows a basic control controller for charging the batteries from the MES through the SMs. Because the SMs are not connected to each others at the output side, each SM is controlled seperately using a PI controller. A hystresis controller in the inner loop adjusts the input current of the SM by controlling
d.
The controller of Mode 1 is tuned using the SISOTOOL toolbox in MATLAB/SIMULINK using the small-signal transfer function of the Cuk converter. The toolbox provides an interactive method to shape the loop gain and returns the calculated PI controller gains
kp and
ki. As shown in
Figure 12, the PI controller gains are selected at
kp = 0.5 and
ki = 8 to provide stable loops and reasonable phase and gain margins.
To show this mode, a MATLAB/SIMUINK case study is designed using the parameters shown in
Table 2.
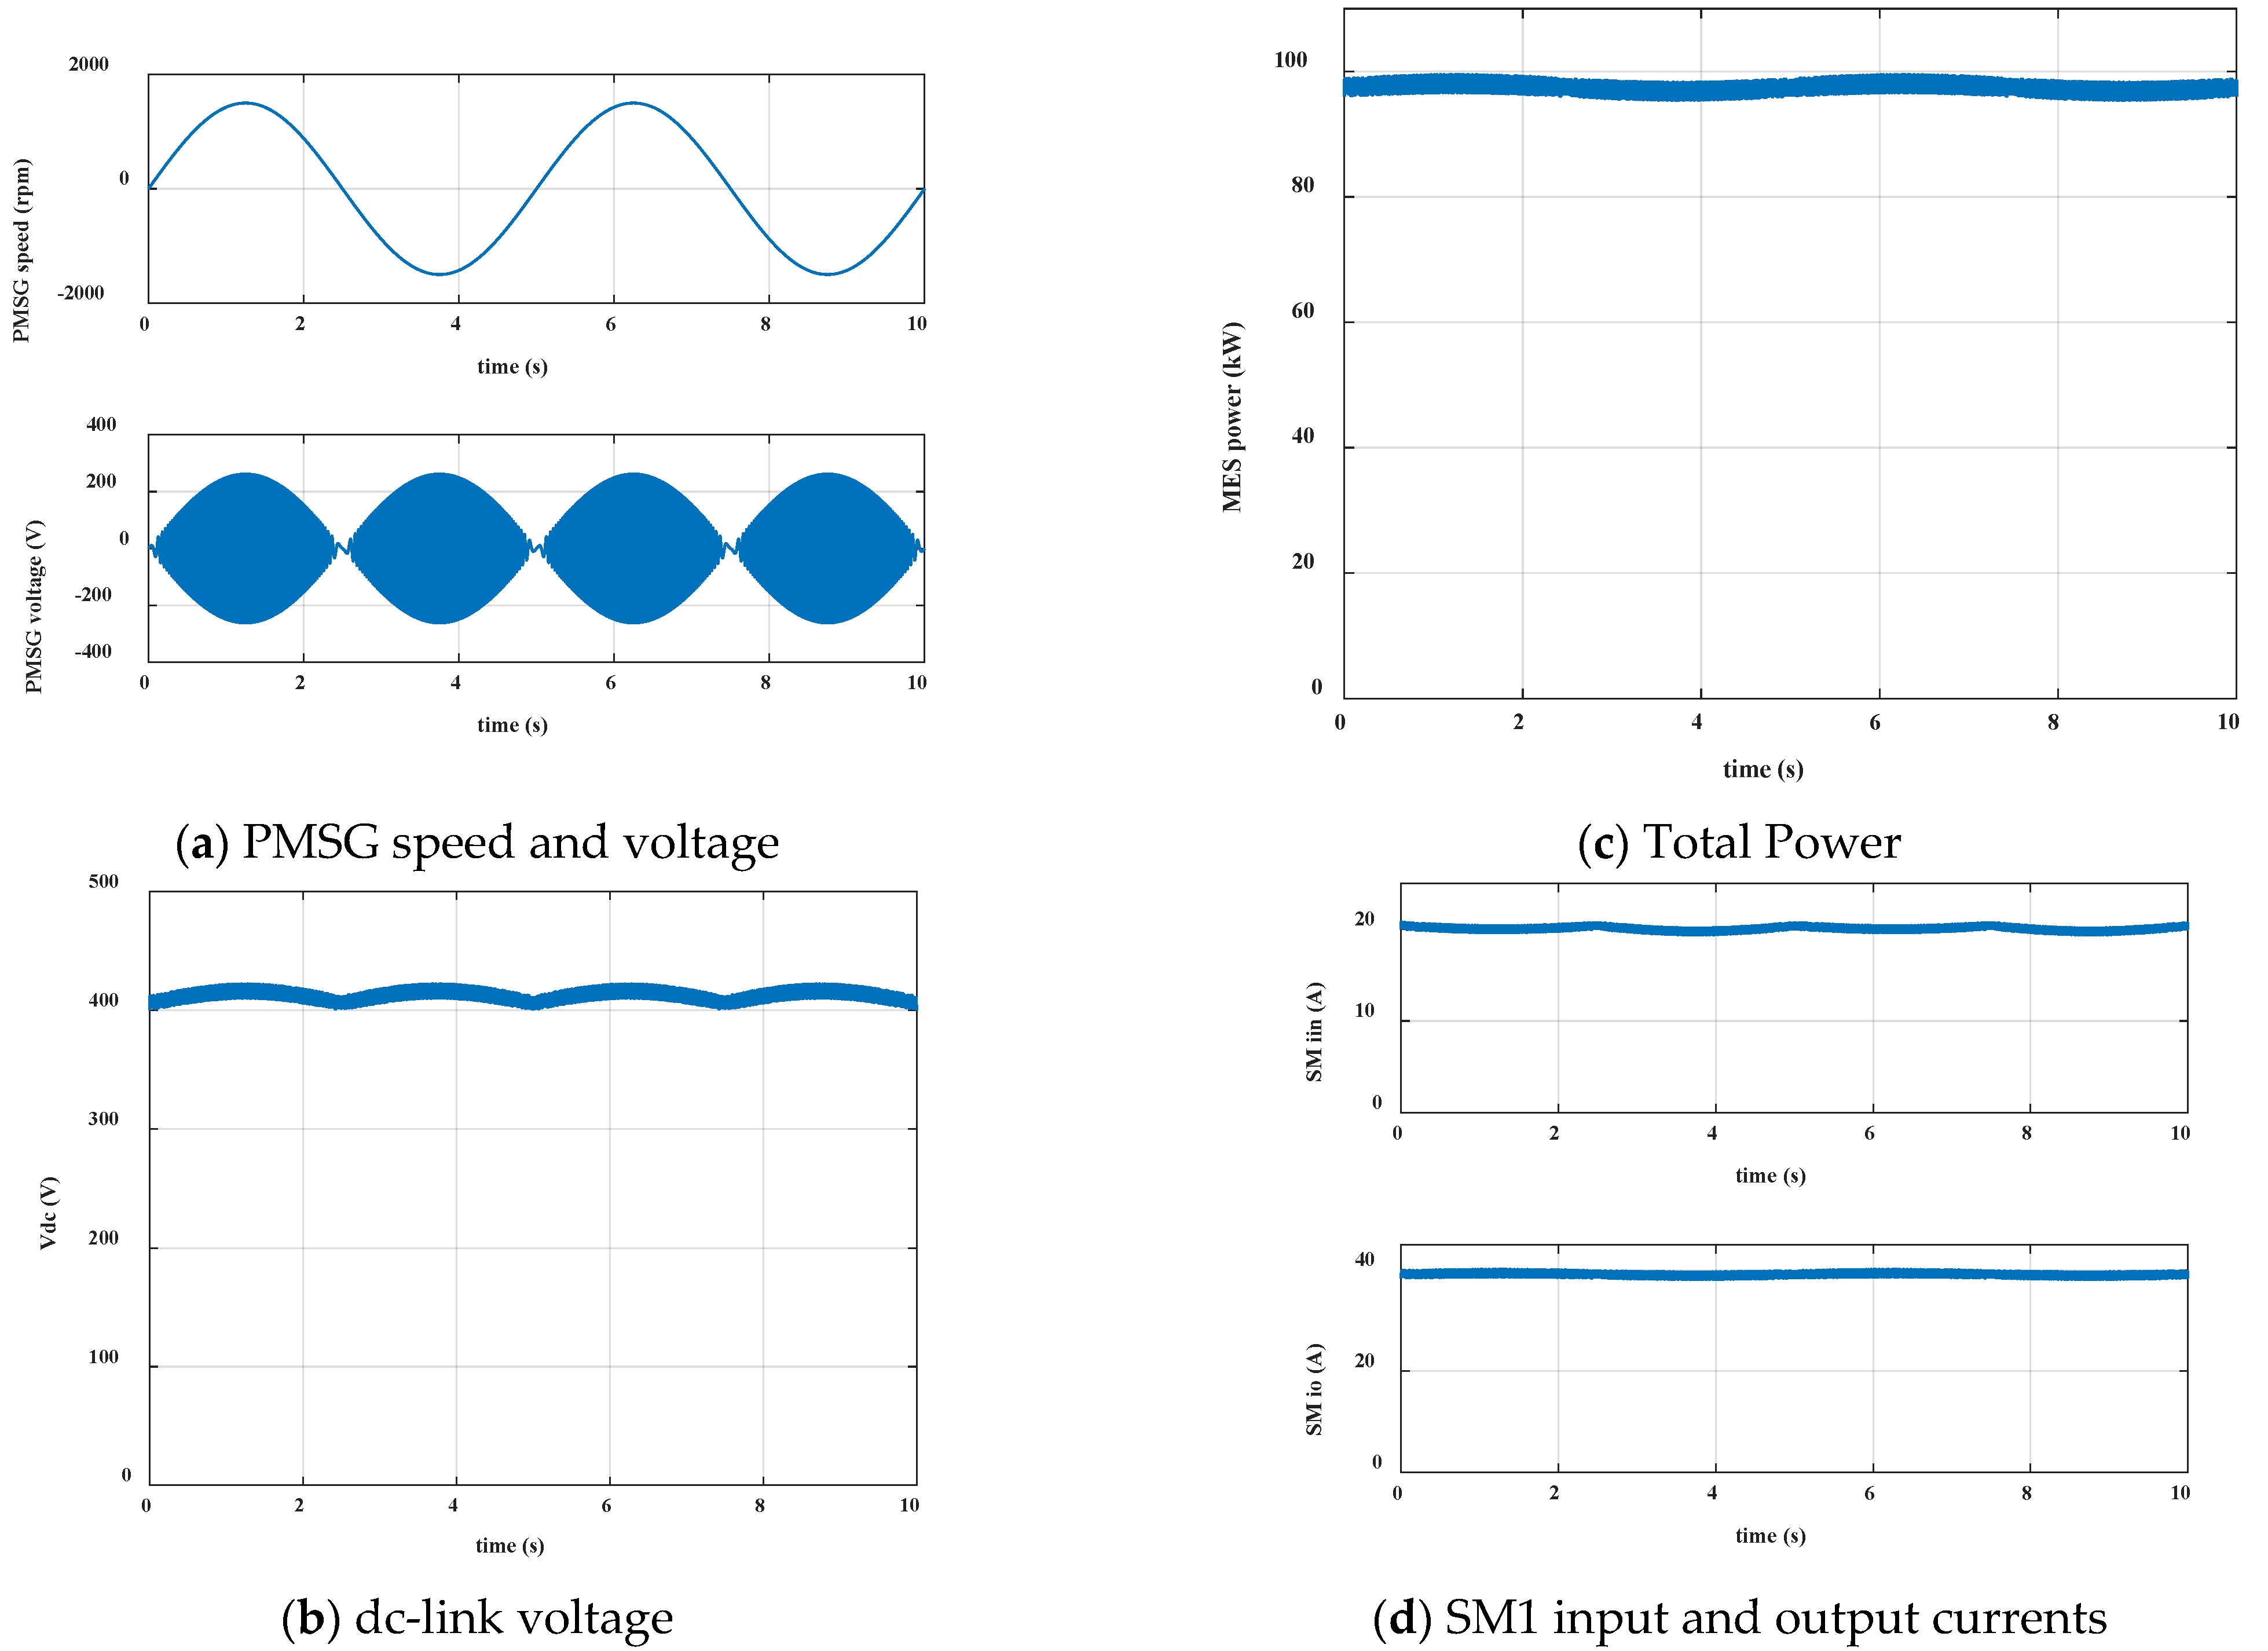
Figure 13 shows the simulation results for this mode.
Figure 13a shows the rotational speed of the PMSG with the resultant phase voltage. The dc-link voltage and the total power are shown in
Figure 13b,c. The input current of the first SM in phase
a is shown in
Figure 13d with the SM output current to charge one battery pack charged at 200 V.
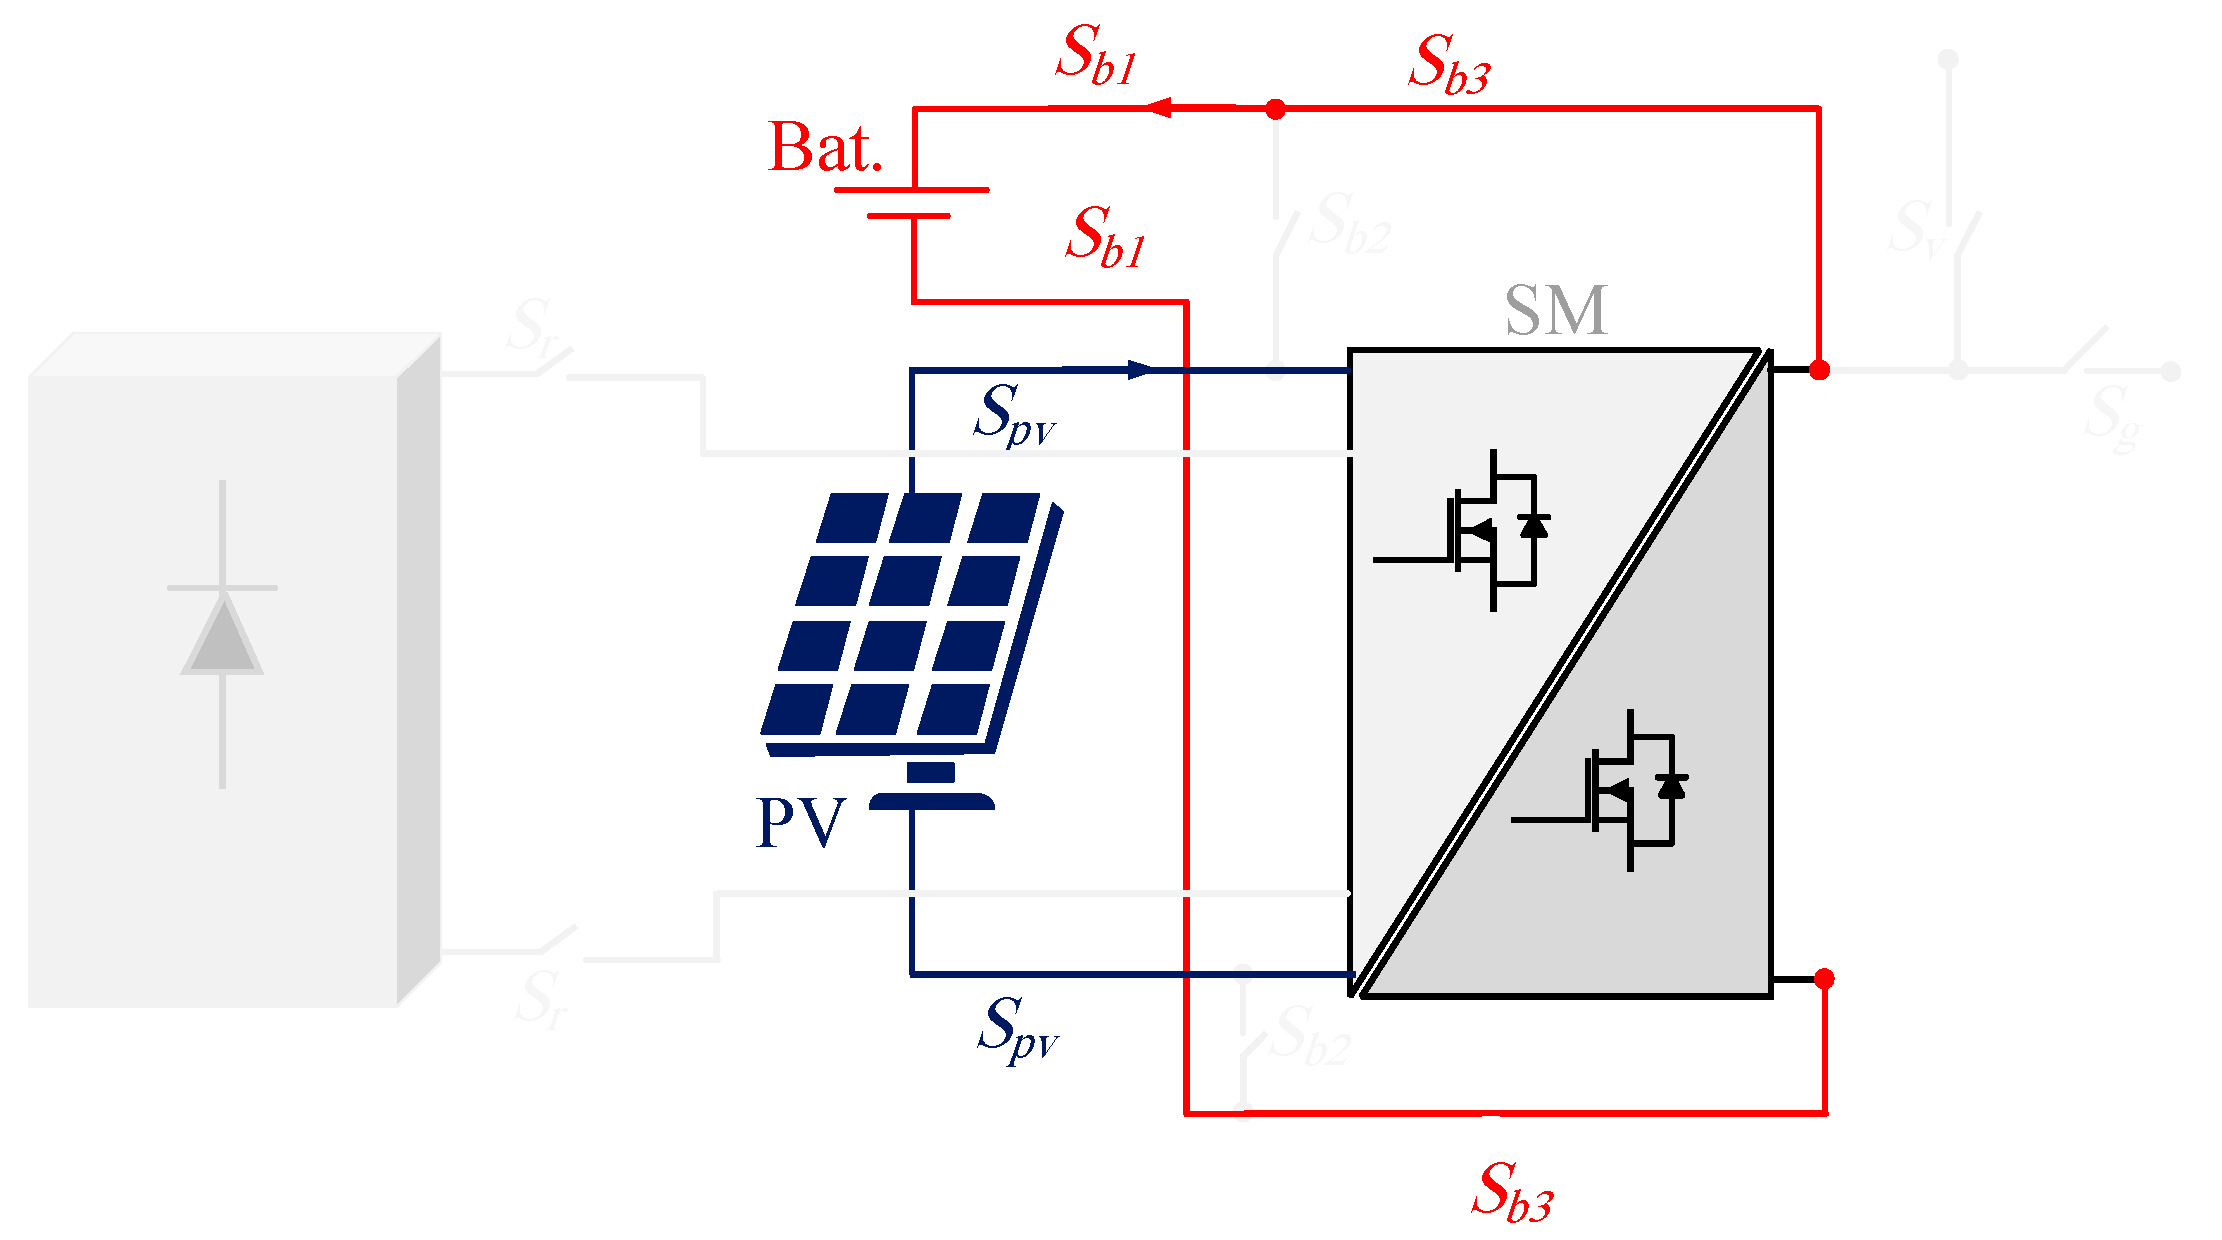
4.2. Mode 2: From PV to Batteries
Figure 14 shows the SM connection to the PV modules in order to perform Mode 2. Because the SM is still operating as a dc/dc converter, the state-space representation, as well as the modulation scheme are the same as the previous mode. However, the control scheme is slightly different because the inputs of the SMs are connected to PV modules.
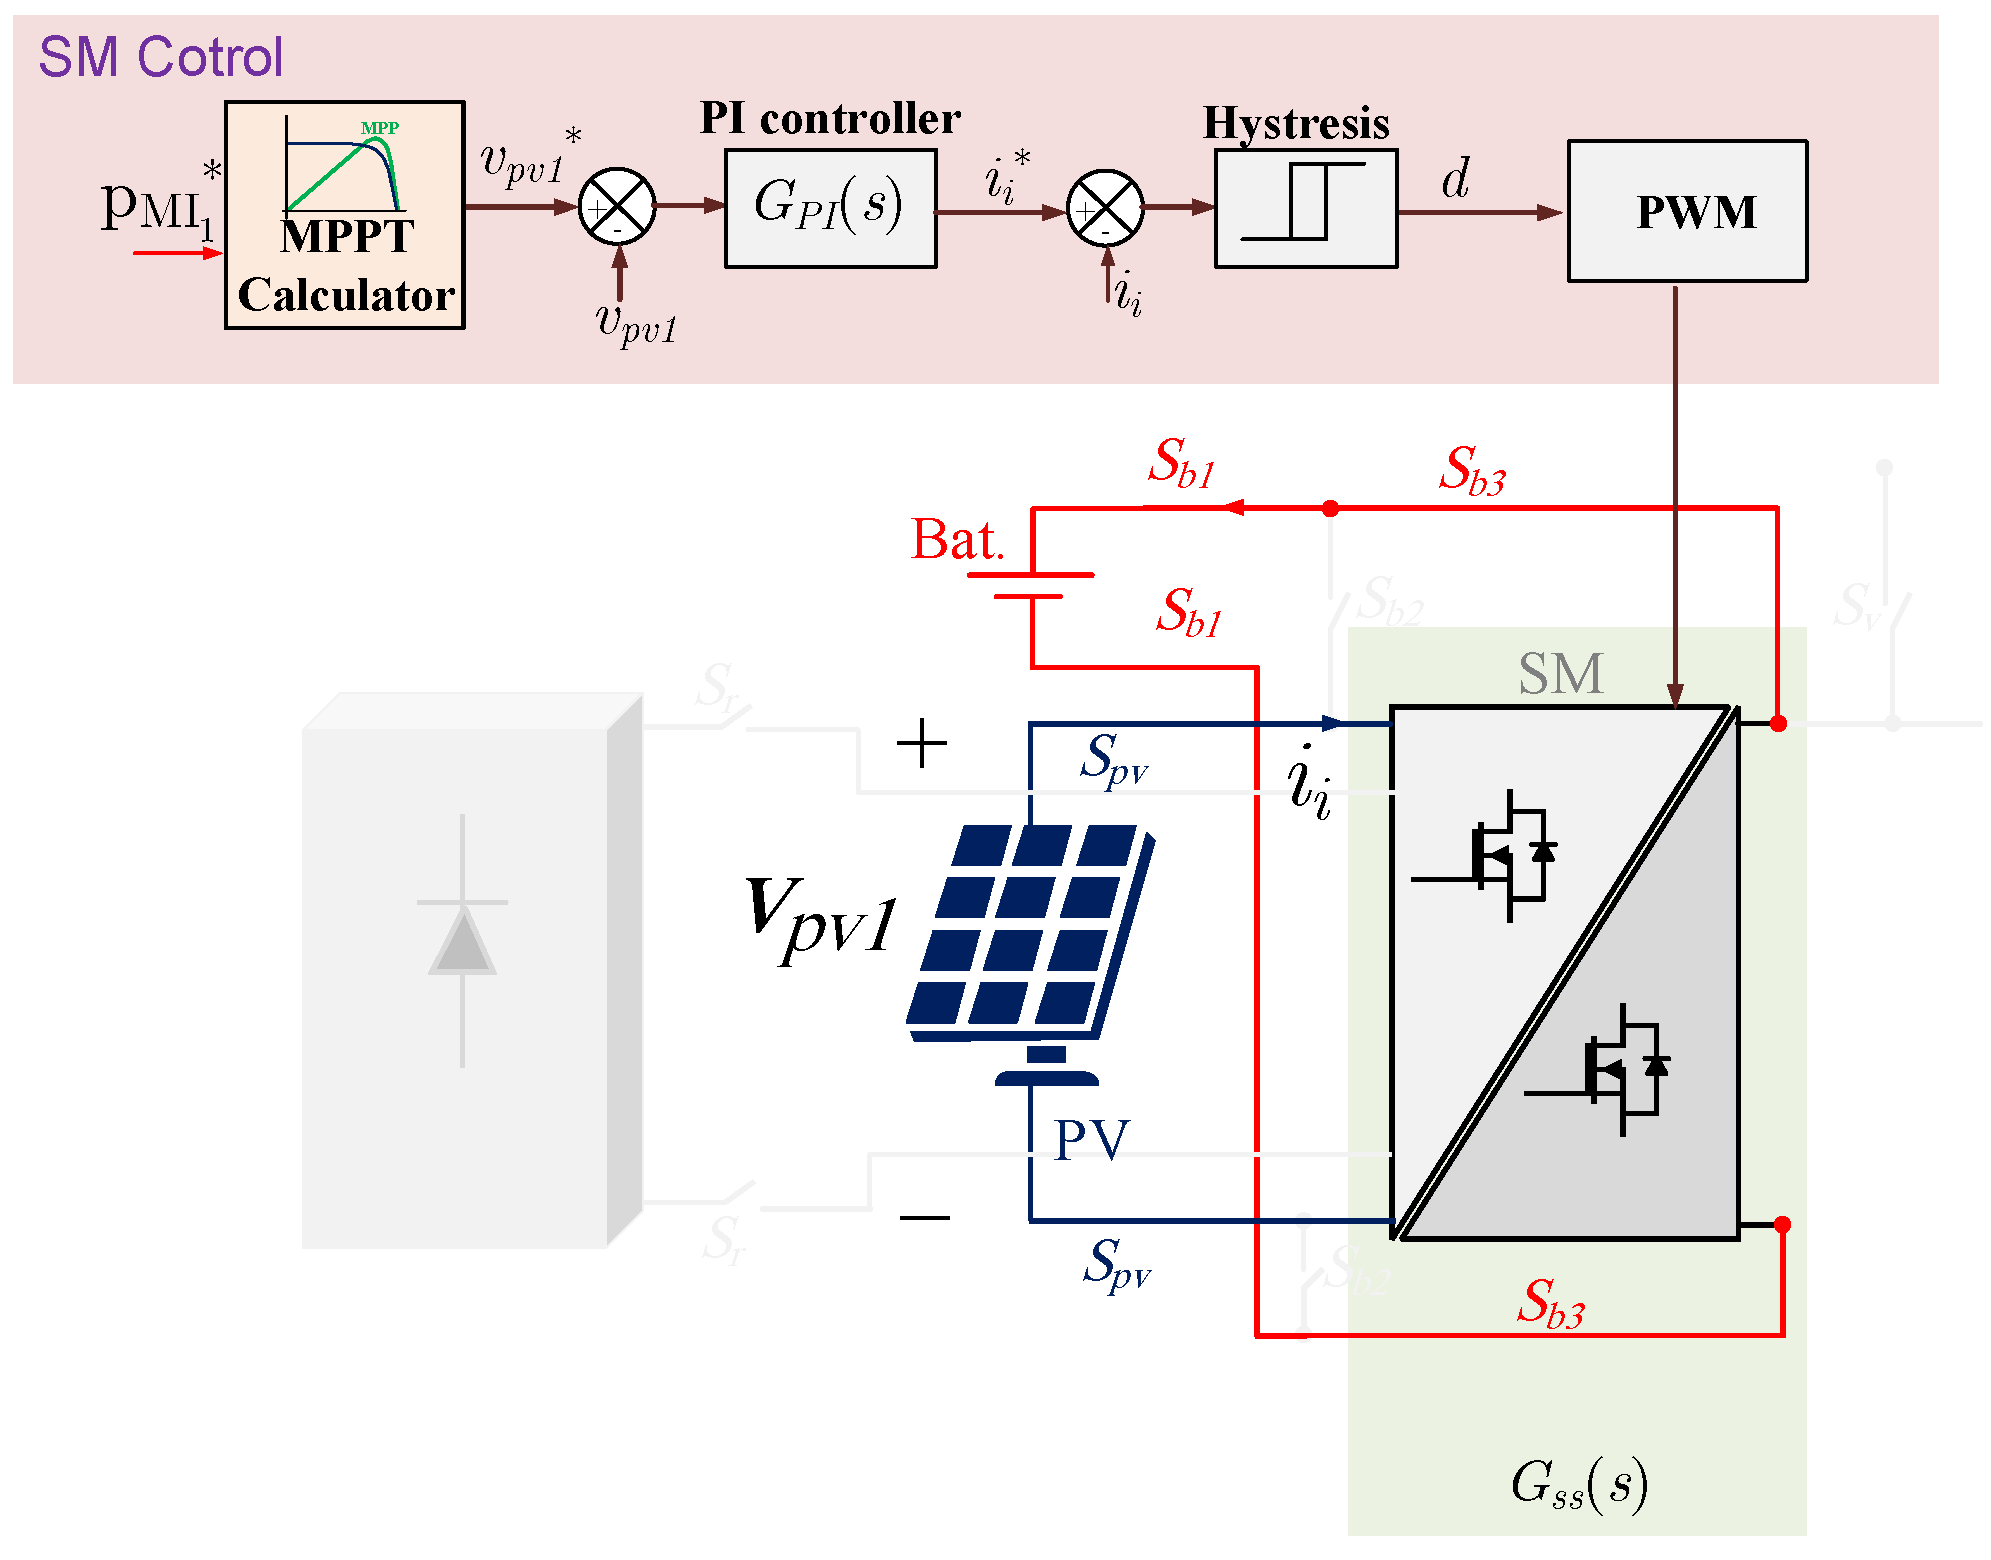
To harvest the maximum power from each PV module
Pm, an MPPT controller is required to operate each PV module at the maximum voltage
Vmpp and the maximum current
Impp points in the current–voltage PV curve. The control system for Mode 2 is shown in
Figure 15.
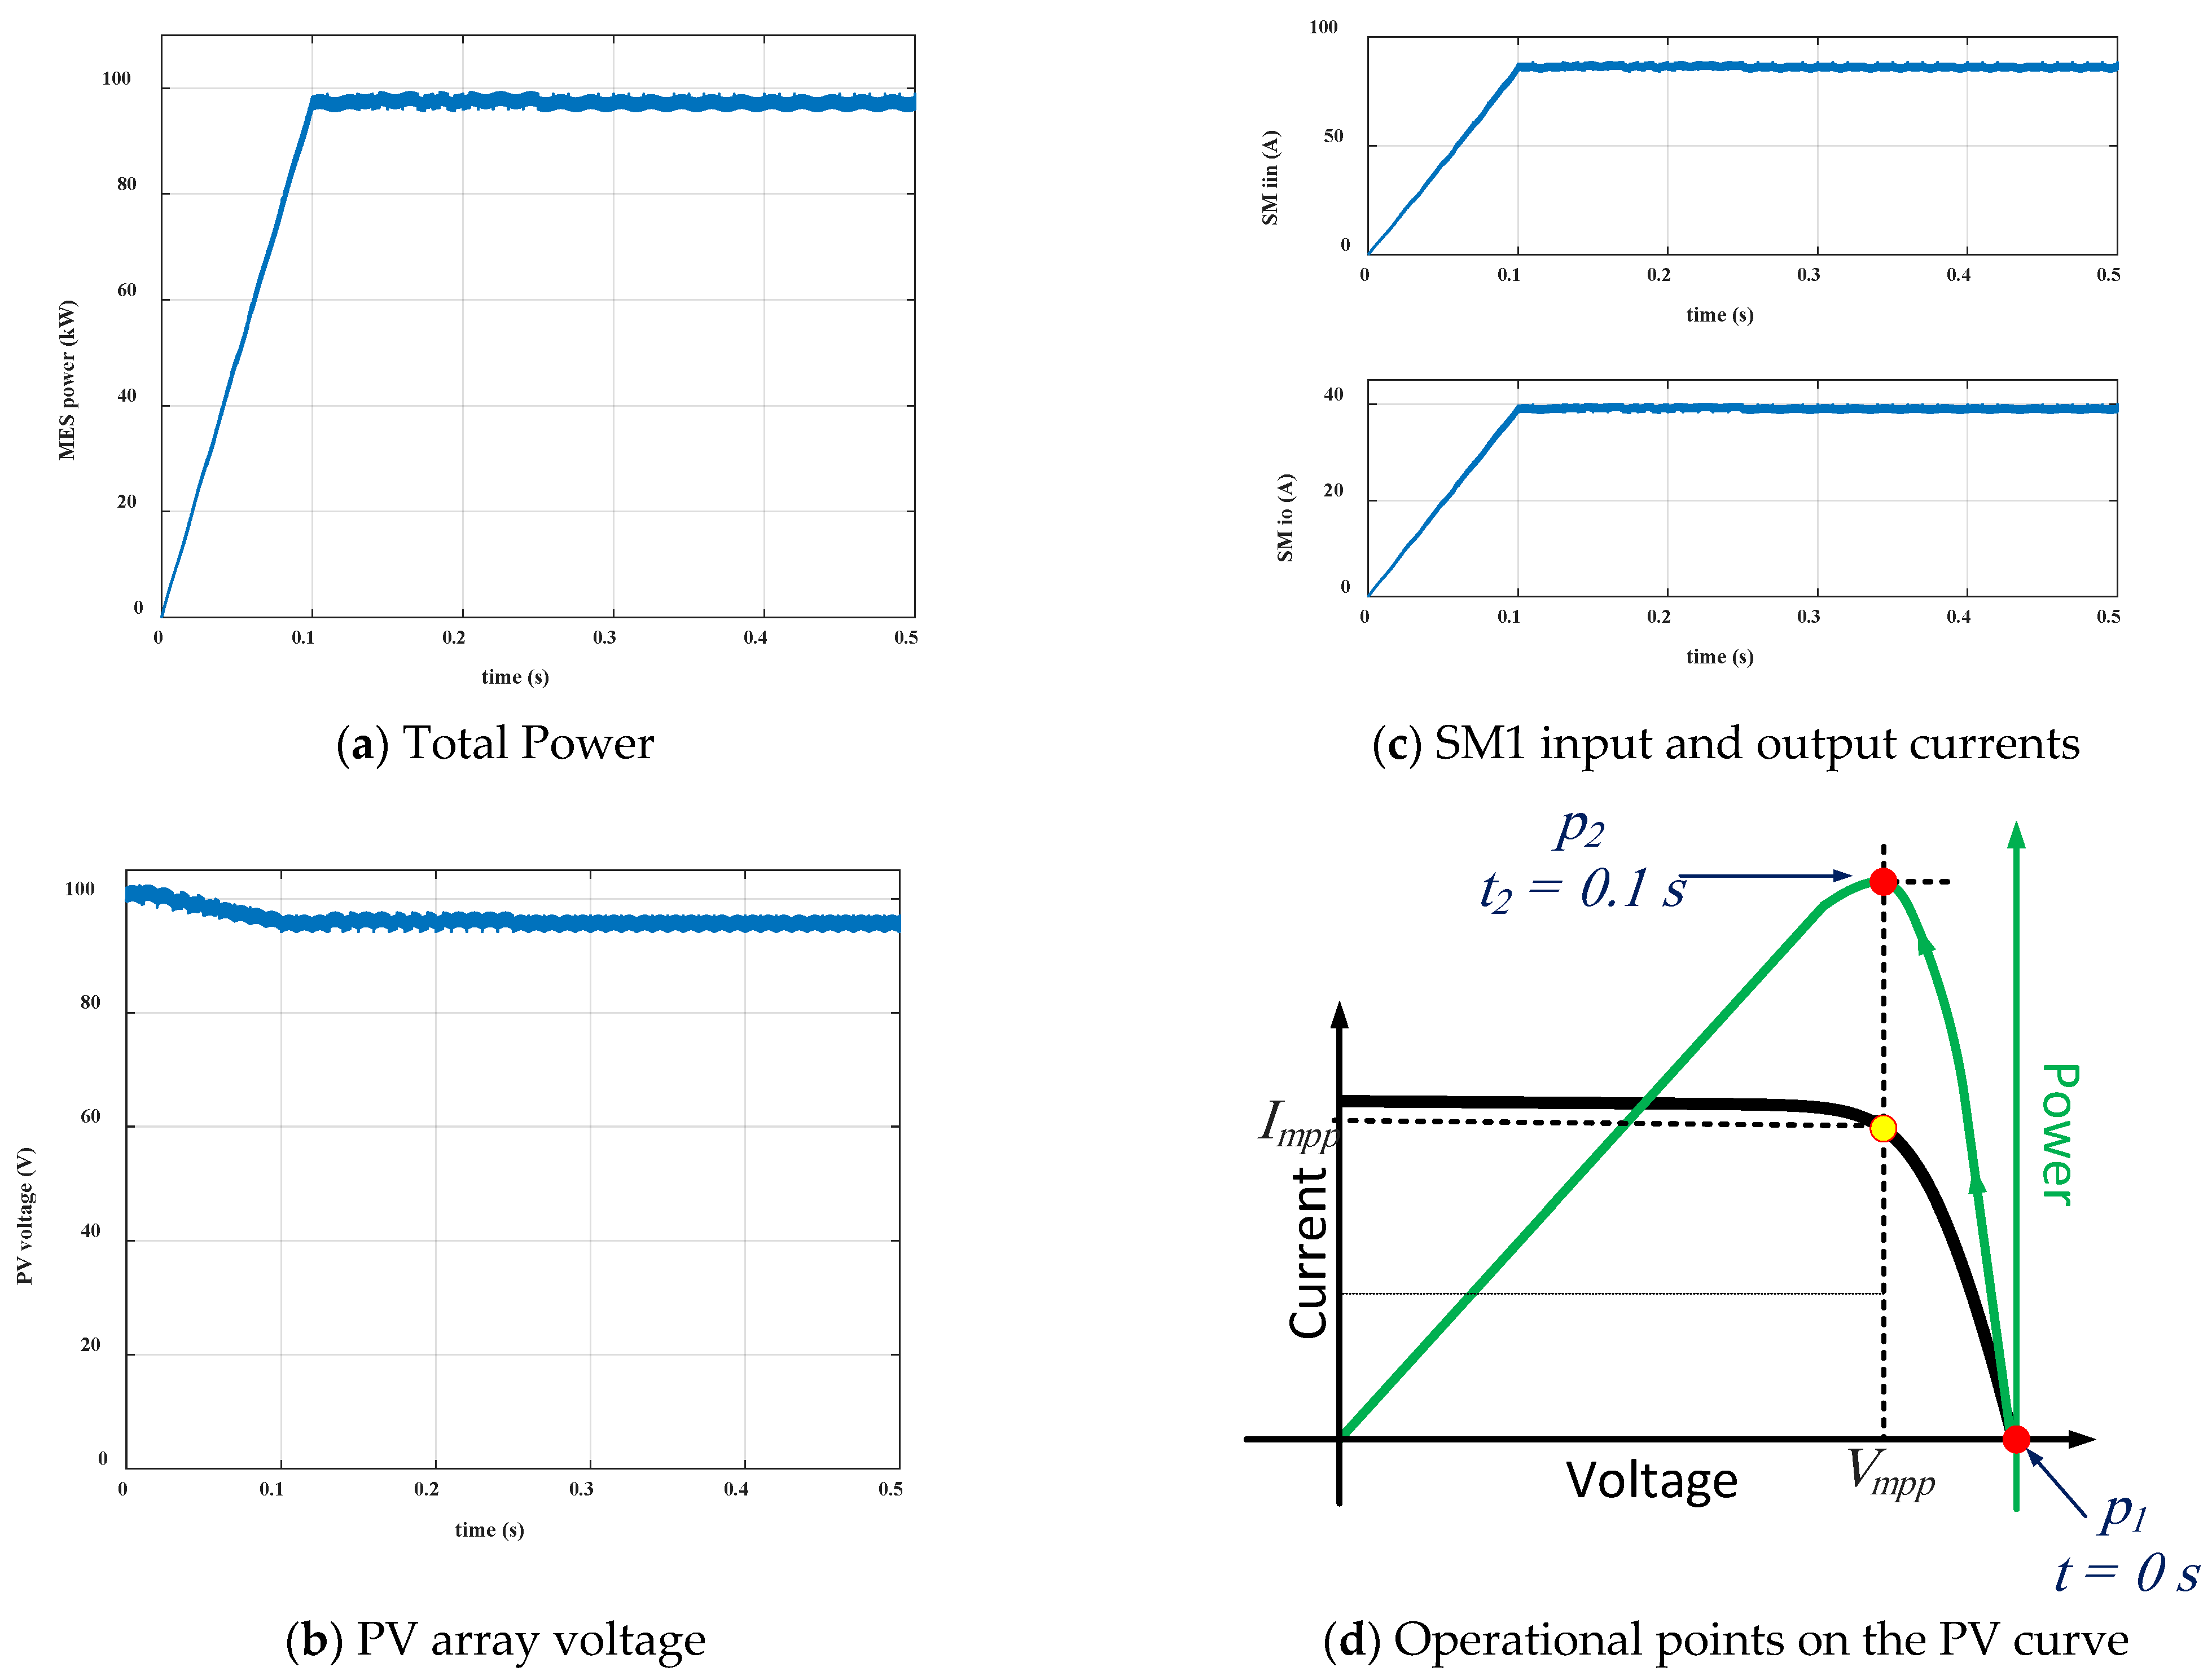
Table 3 shows the parameters used in the MATLAB/Simulink case study for Mode 2, where the PV farm produces.
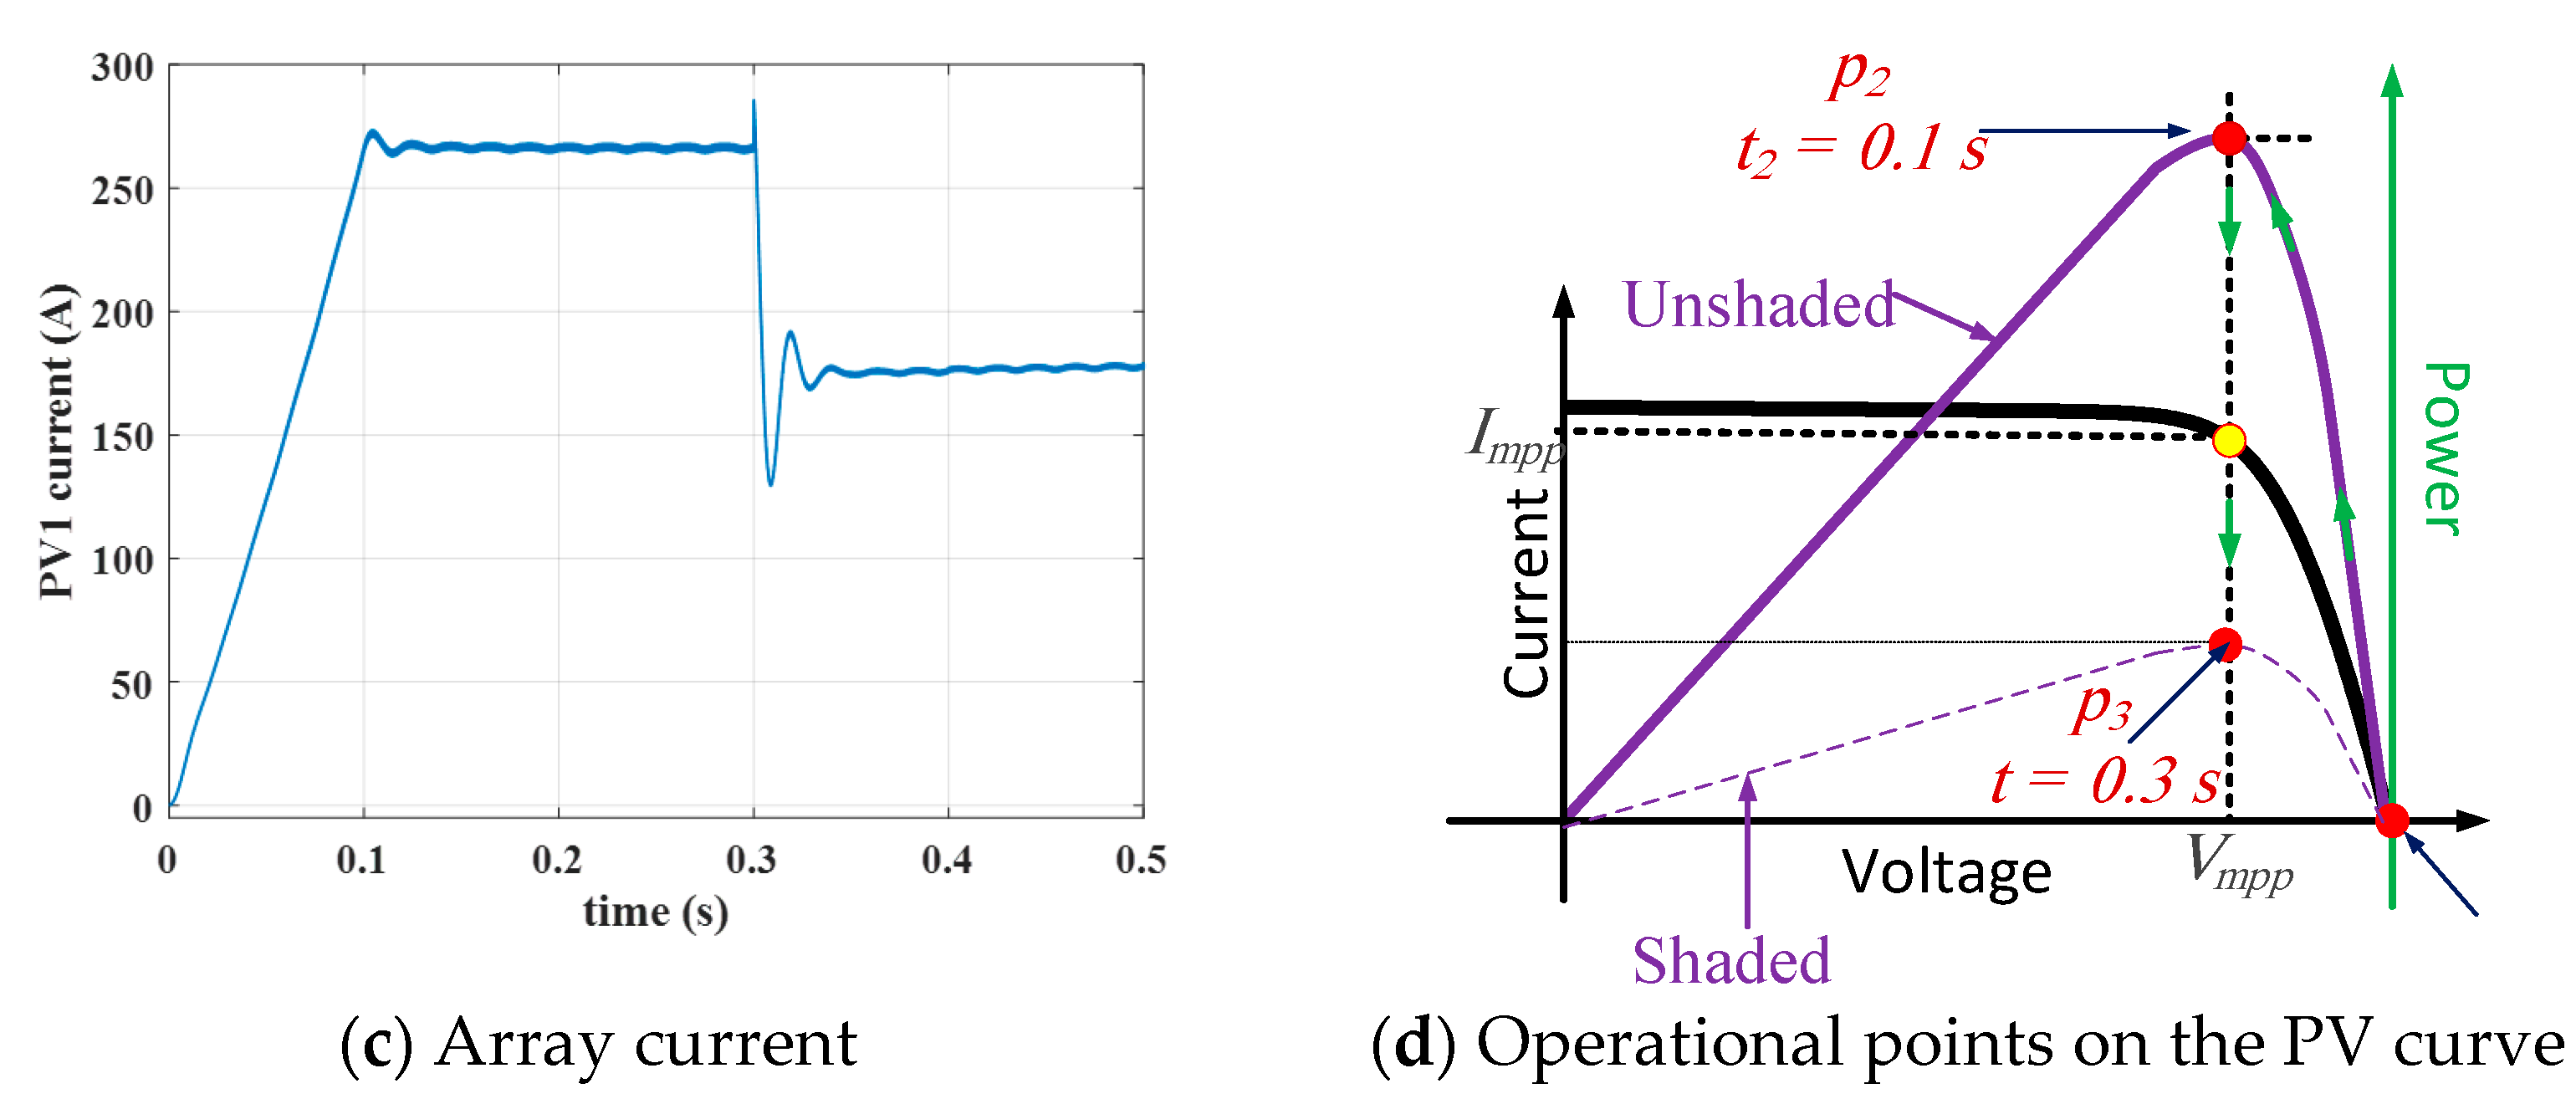
Figure 16a shows the total power of all PV modules together when the controller increases the power from zero to 96 kW (8 kW for each SM) in 100 ms.
Figure 16b shows input voltage of one SM (output of the PV array).
Figure 16c shows the output current of the SM to charge the connected battery pack.
Figure 16d shows the operational points on the PV curves at t = 0 s and t = 100 ms.
4.3. Mode 3: From Batteries to Vessel or Grid
This is the main mode of the proposed SPC system. In this mode, the CMC operates as a three-phase inverter because the SMs are working as a single-phase dc/ac current source inverter.
4.3.1. Modulation Scheme
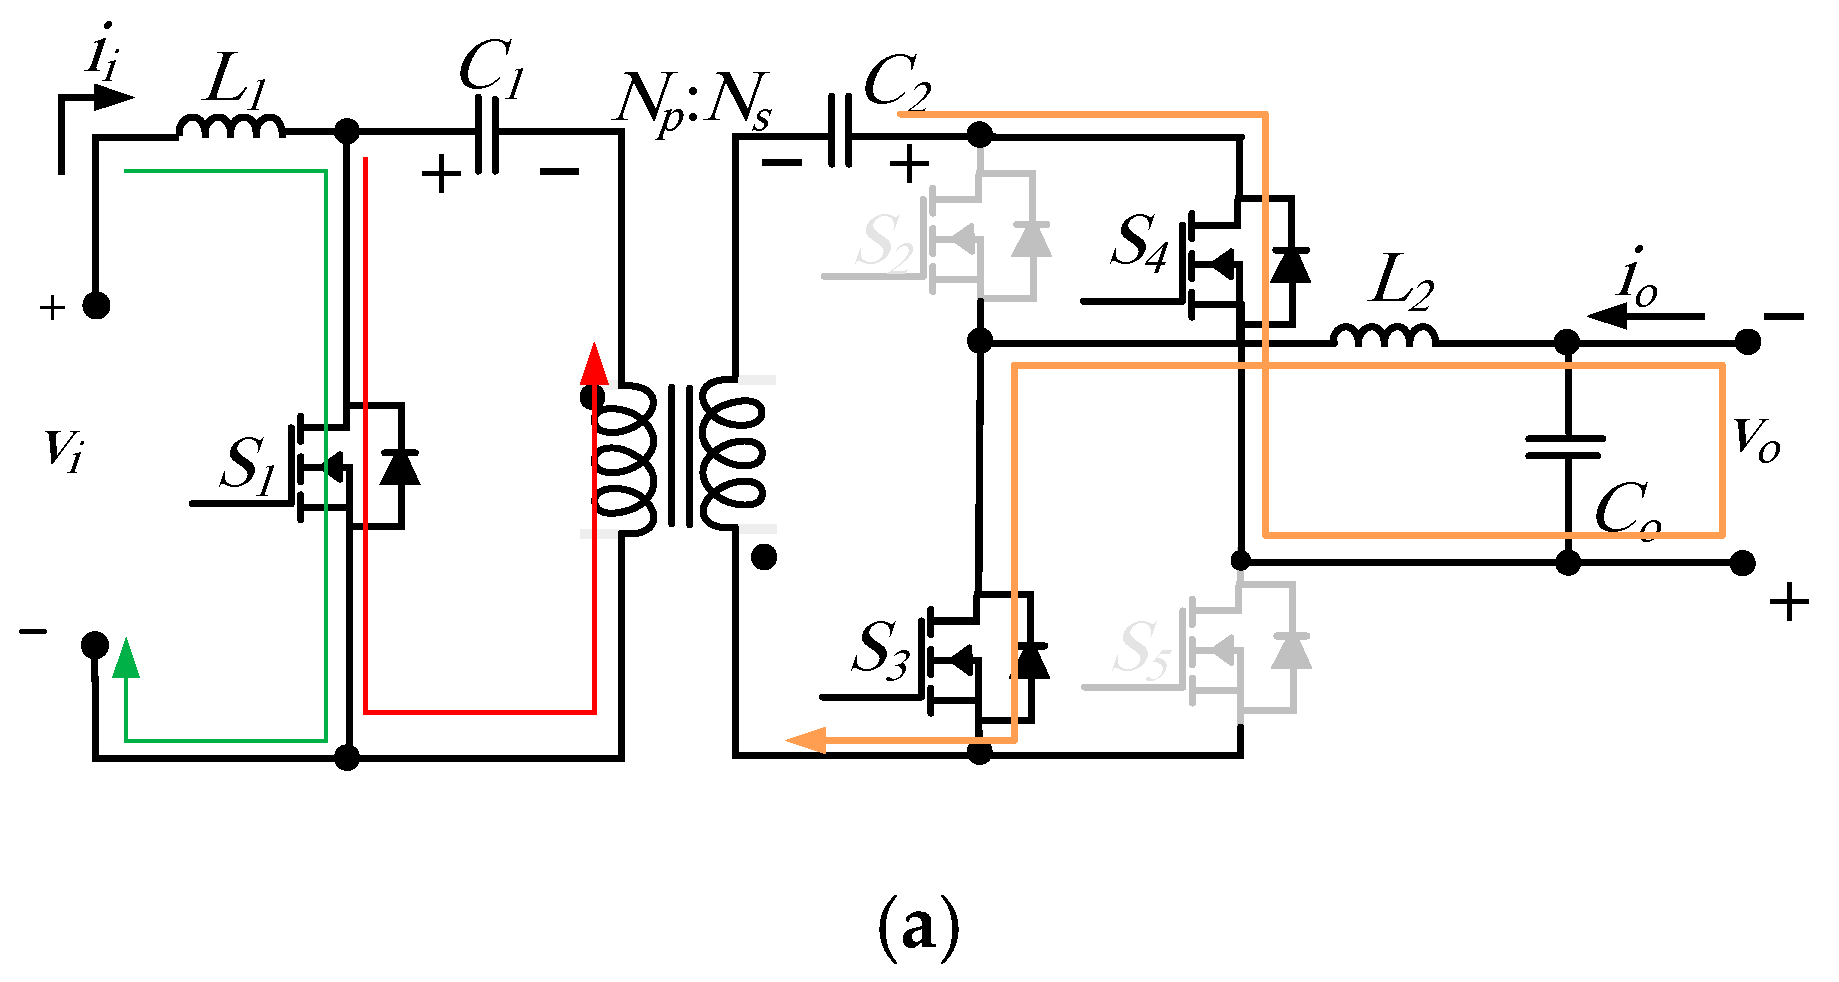
The dc/ac operation is activated when either the battery packs supply either the vessel or the grid with real power. During the positive half-cycle of the output voltage, the switches operate as follows:
During
Stac1 (0 ≤
t <
ton), switch
S1 is turned on, so the input current
ii increases and
L1 is charged. The capacitors
C1 and
C2 discharge in the output load through
S2 and
S5. As shown in
Figure 17a,
L2 is charged in this state.
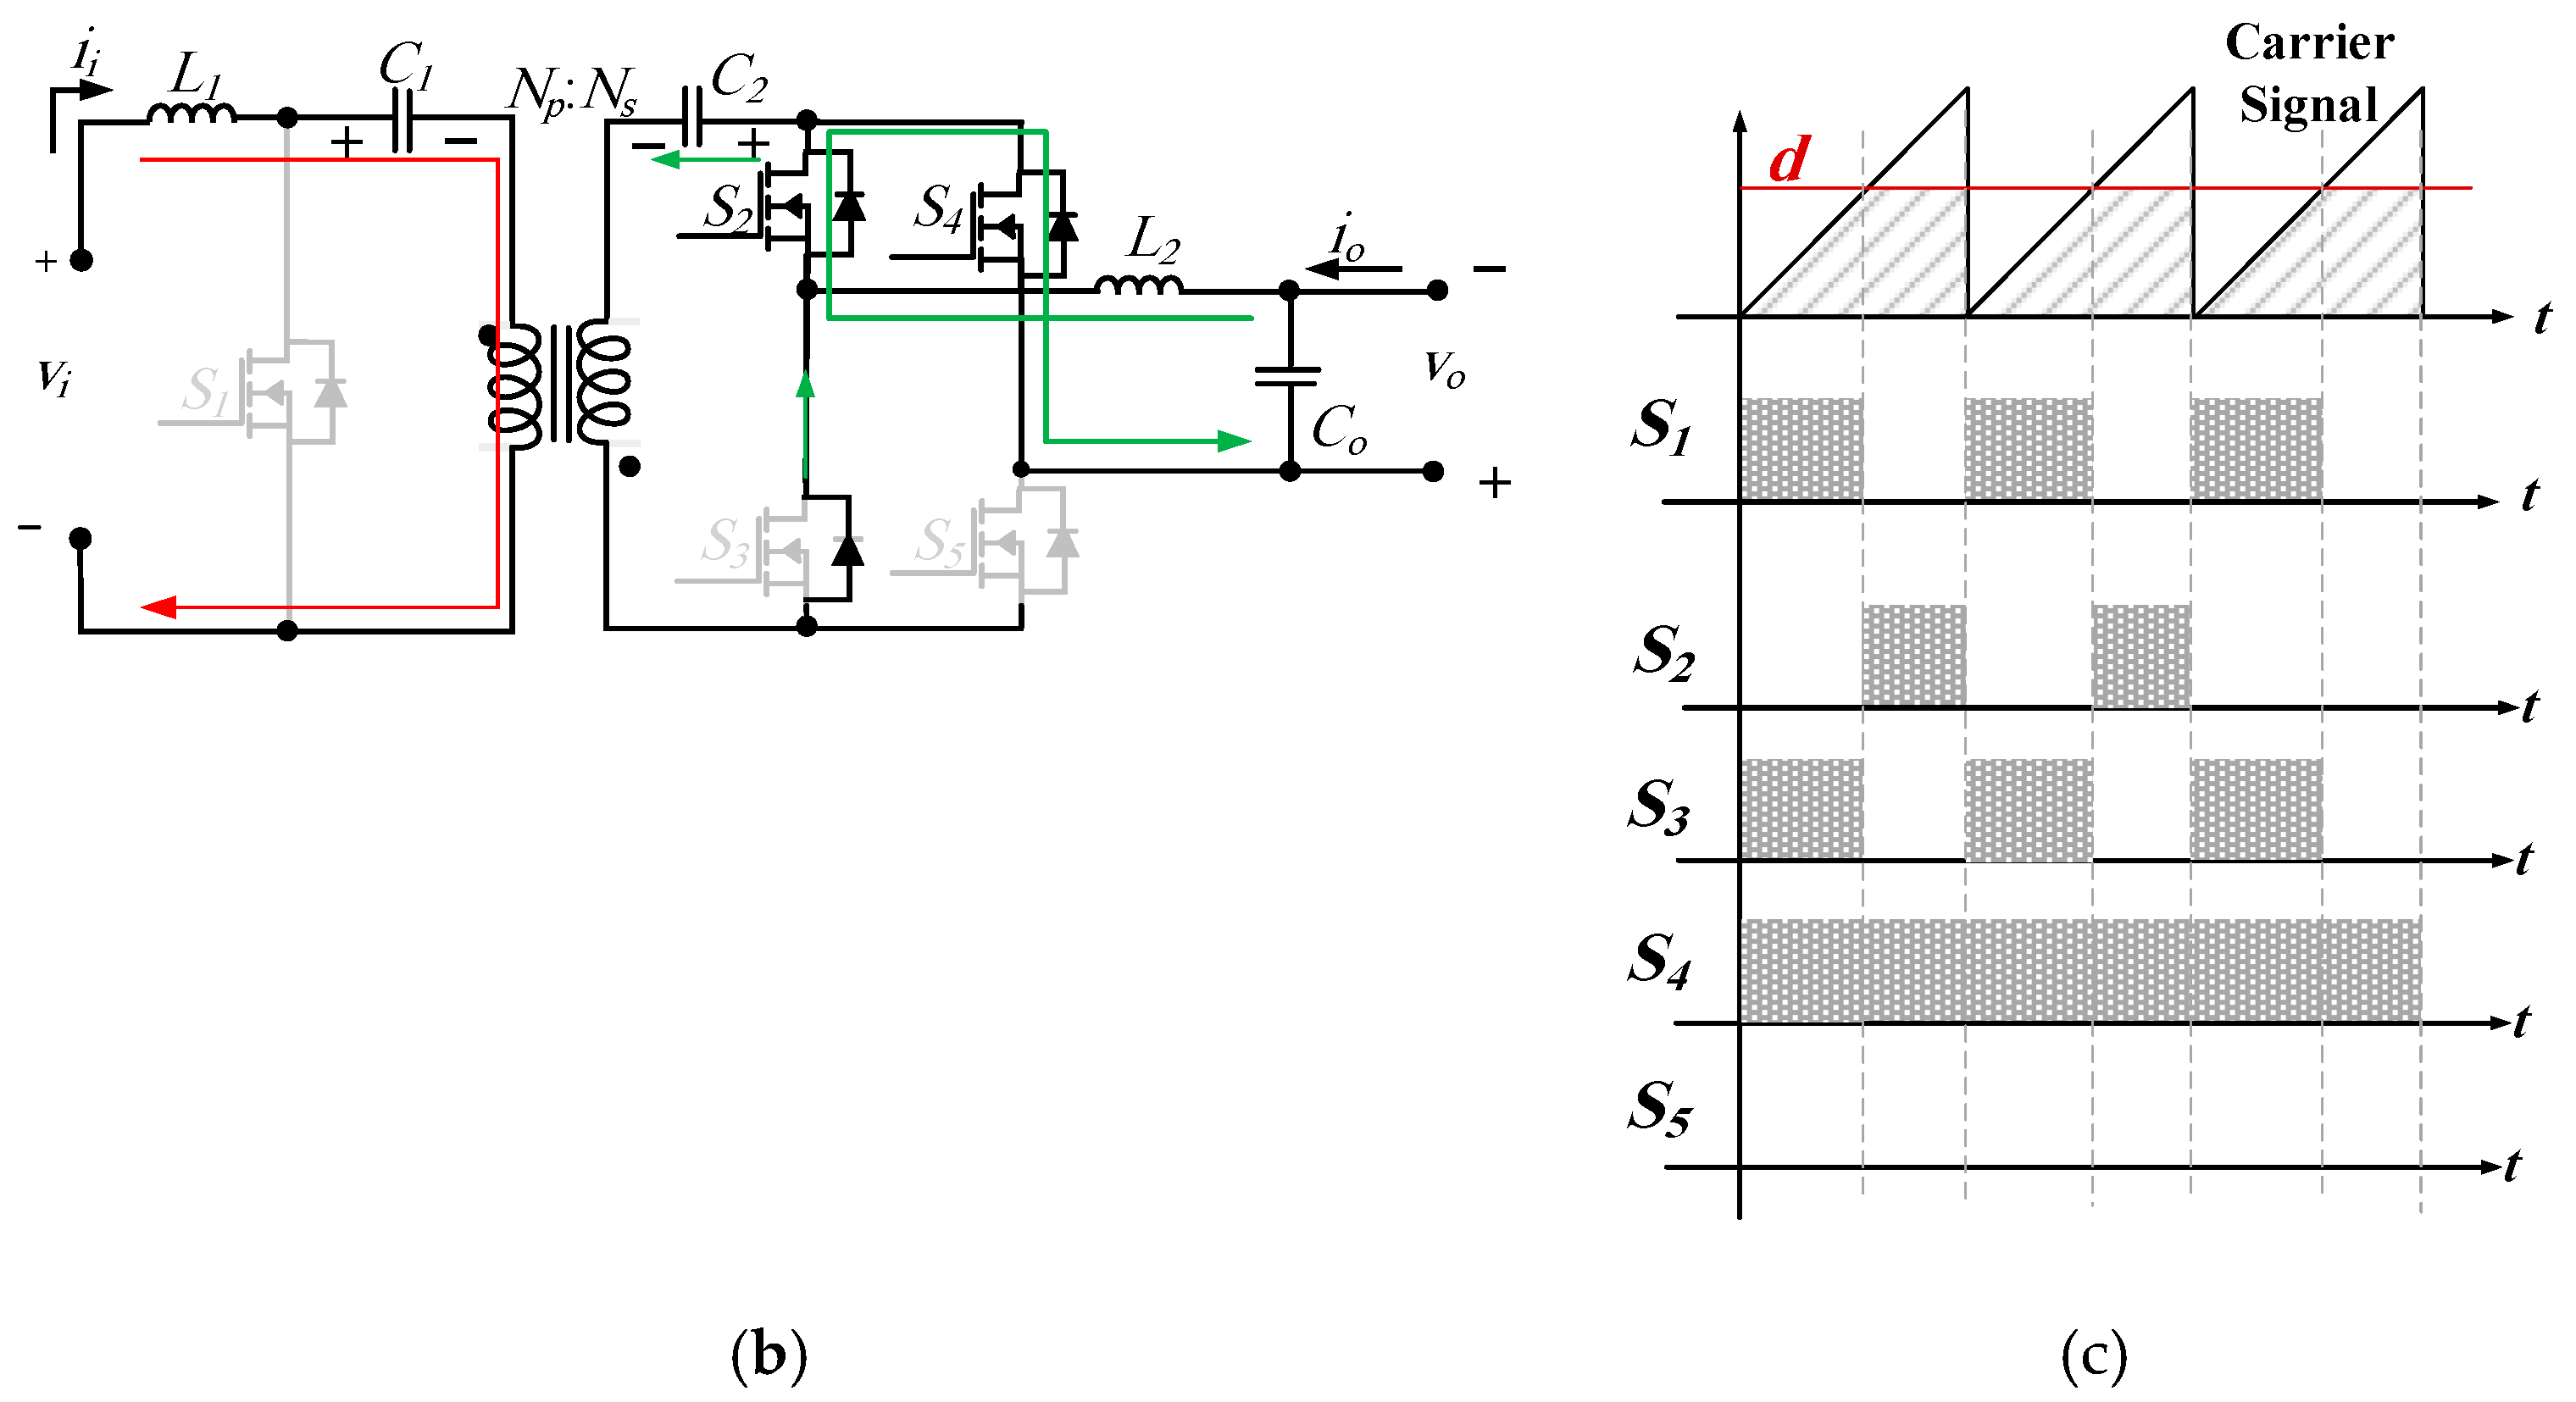
During
Stac2 (
ton ≤
t <
ts), switch
S1 is turned off and, therefore, capacitors
C1 and
C2 are still charged by turning but with the input current
ii.
S3 and
S5 will be turned on to provide a path for the current in
L2 to flow and, hence, the inductors’ currents decrease, see
Figure 17b.
Figure 17c shows the modulation scheme for the dc/ac inverter during the positive half-cycle.
During the negative half-cycle of the output waveforms,
S2 replaces
S3 and
S4 replaces
S5.
Figure 18 shows the operation during the negative half-cycle of the output voltage.
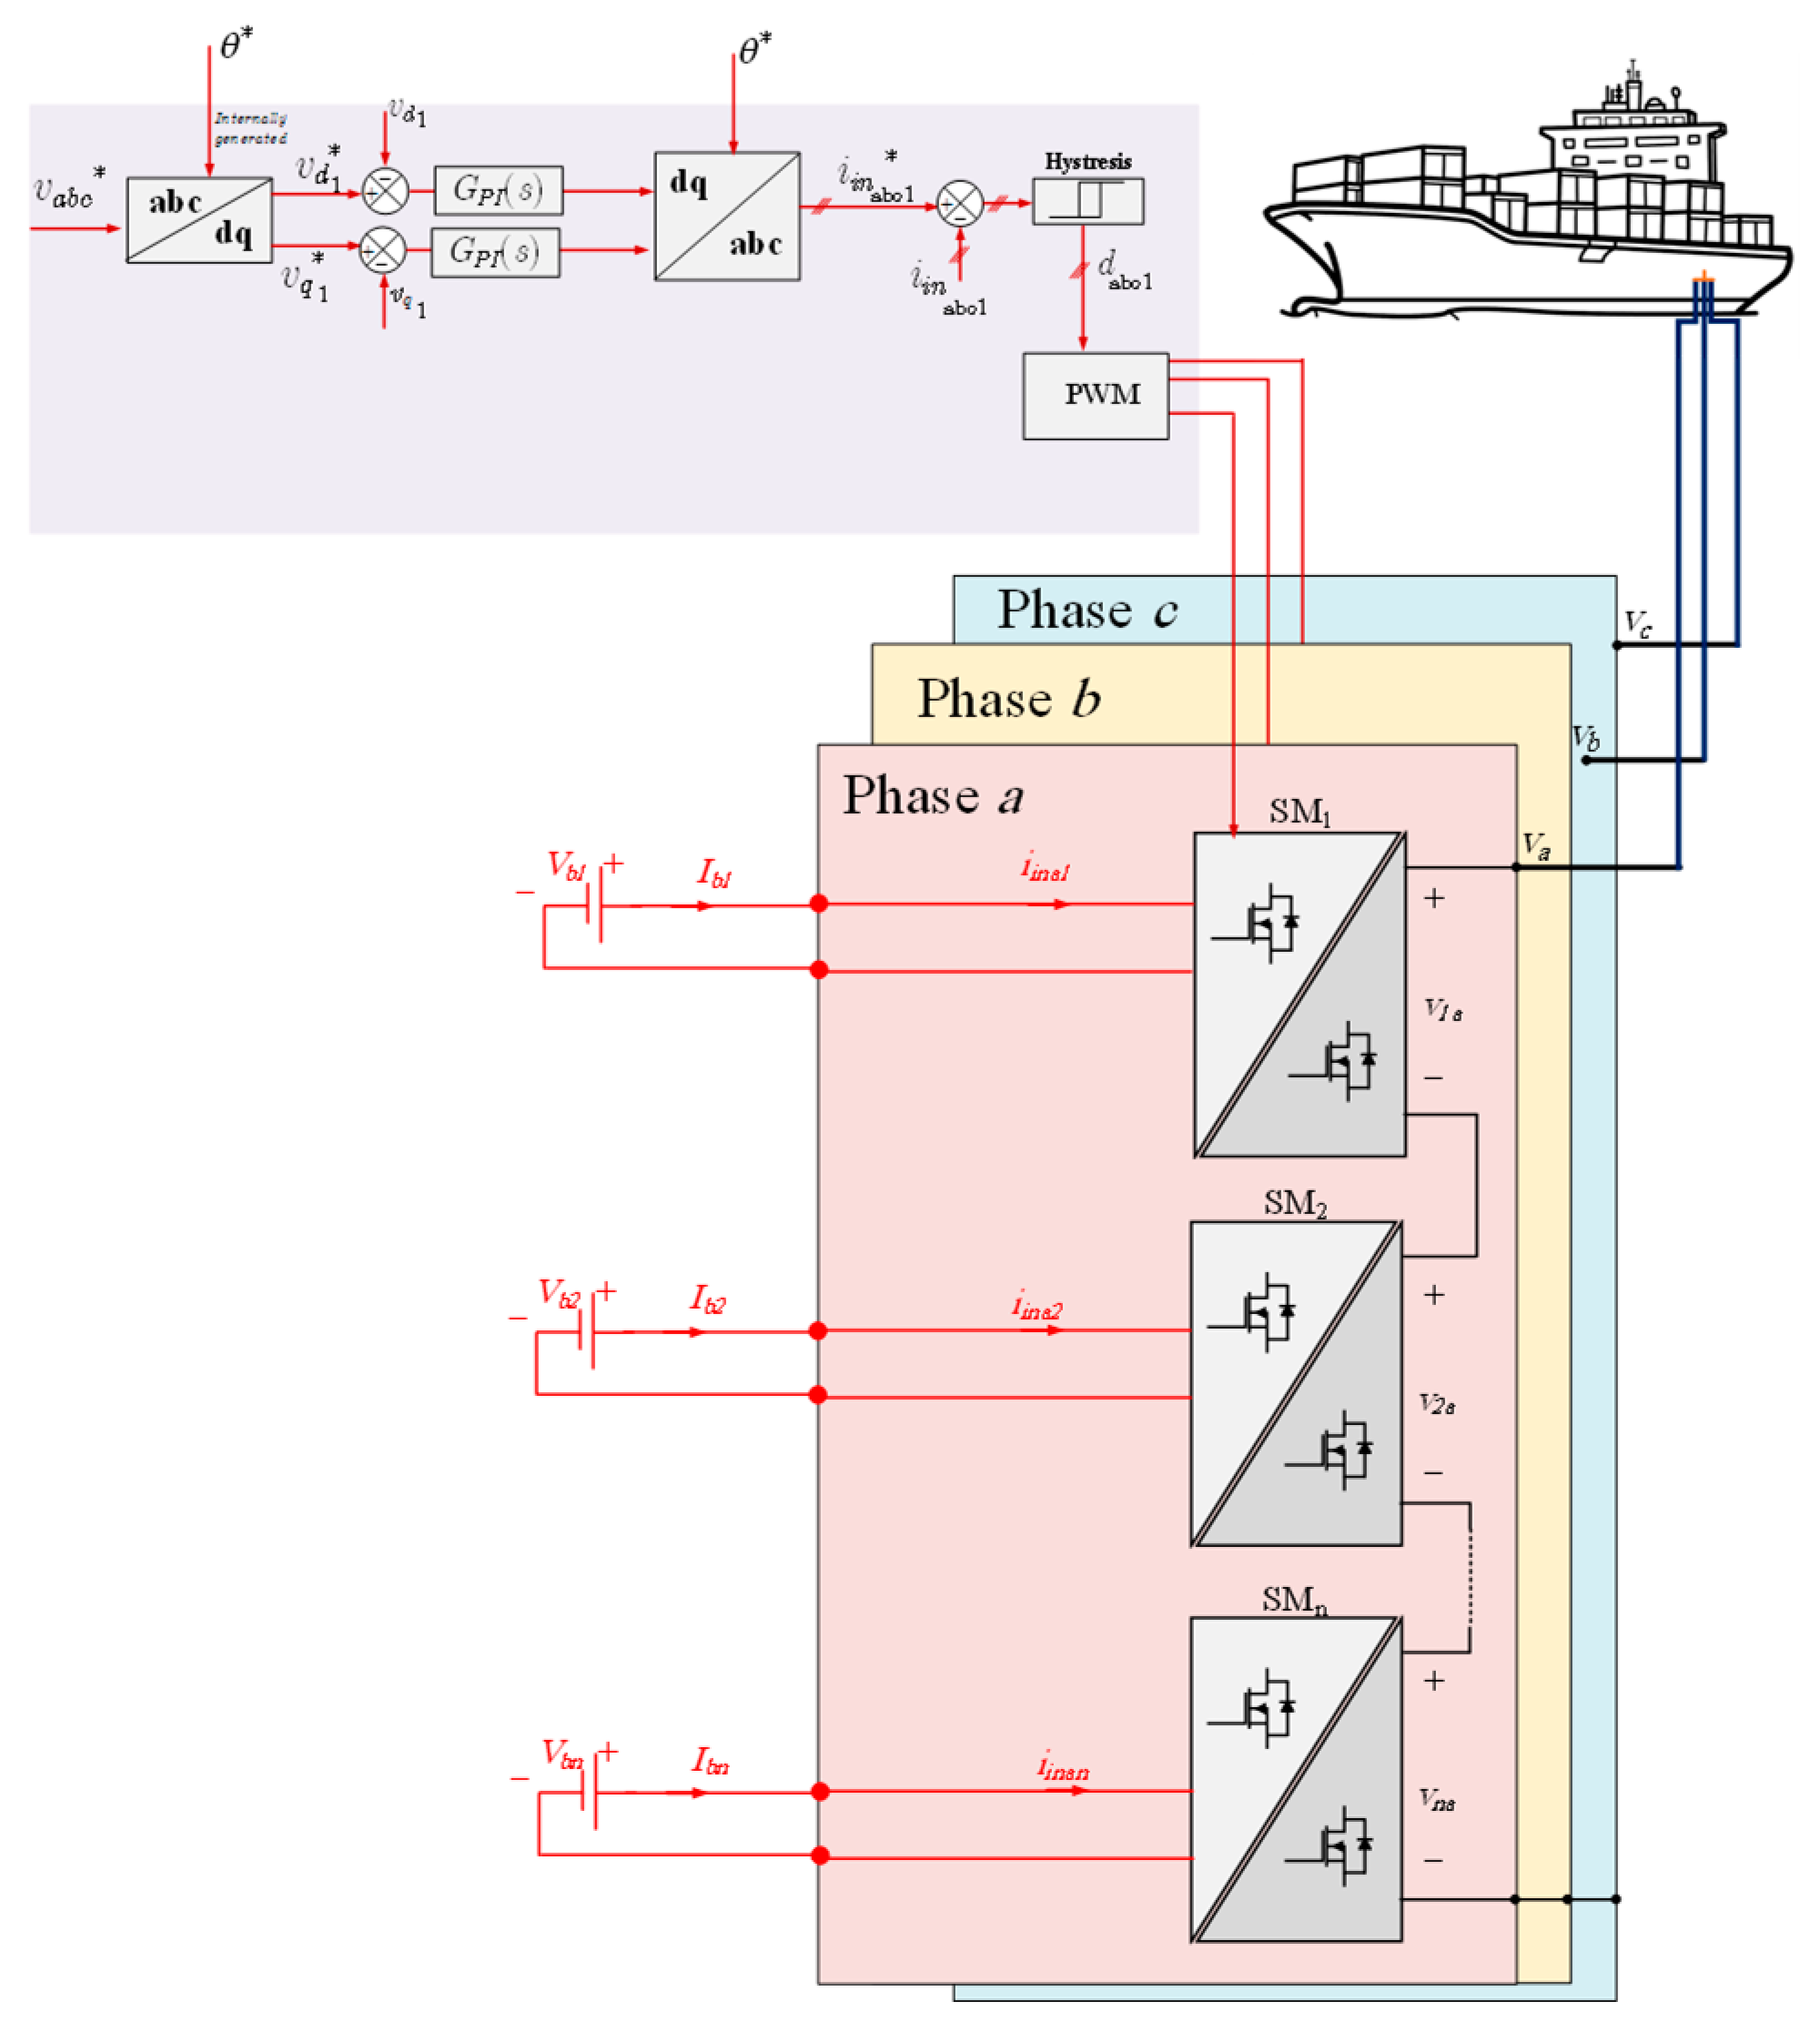
4.3.2. Control System
Figure 19 shows a basic control controller for supplying the vessel from the batteries through the SMs. The reference three-phase output voltage is transformed to the rotating synchronous dq frame and then compared with the actual voltages. The resultant error voltages are controlled by PI controllers, which will generate the reference input SM currents. A hystresis controller will be then employed to generate the gate signals to operate the SM switches.
Table 4 shows the parameters used in the MATLAB/Simulink case study for Mode 3, where the PV farm produces. When the vessel is connected to the output terminals, the dq synchronous frame is used with the PI controllers to control the output voltages, while the input currents are controlled by a hysteresis controller. In this case, the phase-locked loop (PLL) algorithm is not required and the angle
θ is generated internally in the MATLAB model in the simulations and inside the DSP code in the experiments.
When the batteries are discharging into the grid, the PR controller is used to control the output side of the inverter, as shown in
Figure 20. The PR controllers are tuned at the grid frequency to control the sinusoidal output grid currents. The reference current of each battery pack is calculated based on the state of charge (SOC), which can be estimated from the voltage–SOC curve. These input currents to the Cuk inverters are controlled by hystresis controllers, while the output sides of the Cuk inverters are controlled by PR controllers. The duty cycle ratios
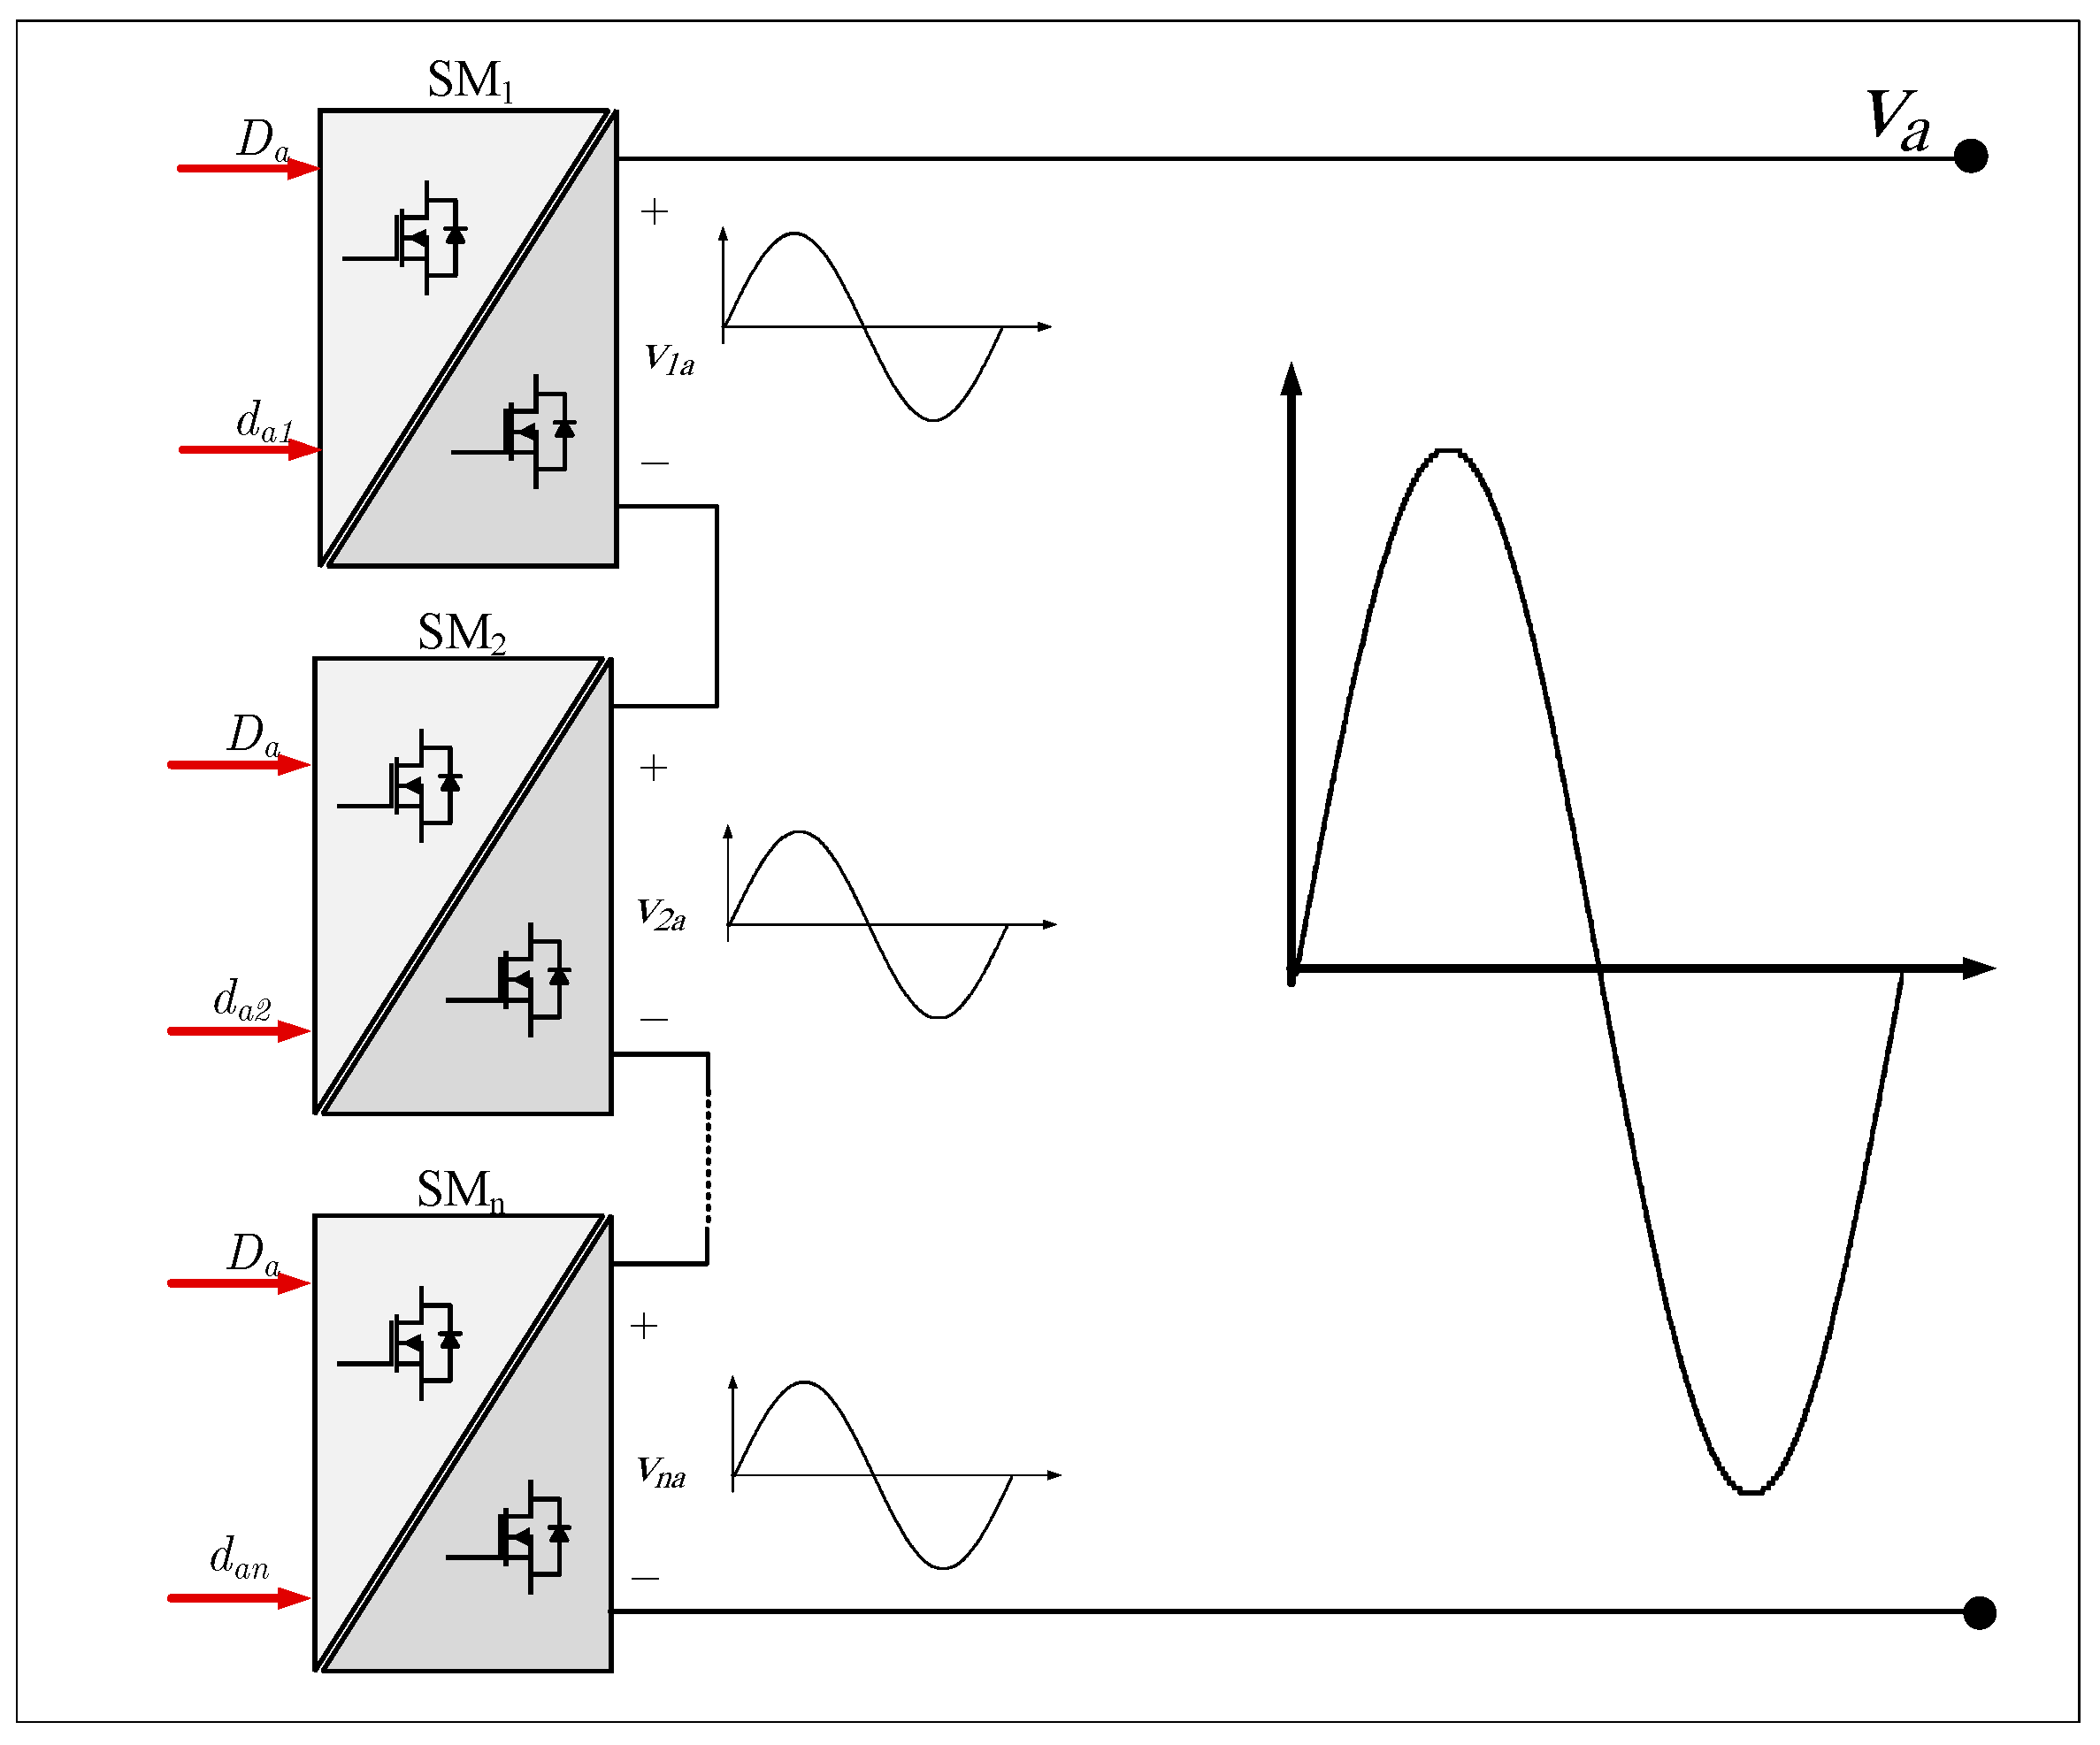
dsabc for each module will generate the output voltages. The relation between the output voltage and the duty–cycle ratio can be expressed as:
The duty–cycle ratio of each Cuk inverter
dskj is the summation of
dkj and
Dj.
Figure 21 shows the operation for phase a, where the duty–cycle ratio
Da is responsible for generating the output voltage and, hence, current. The other duty–cycle ratio
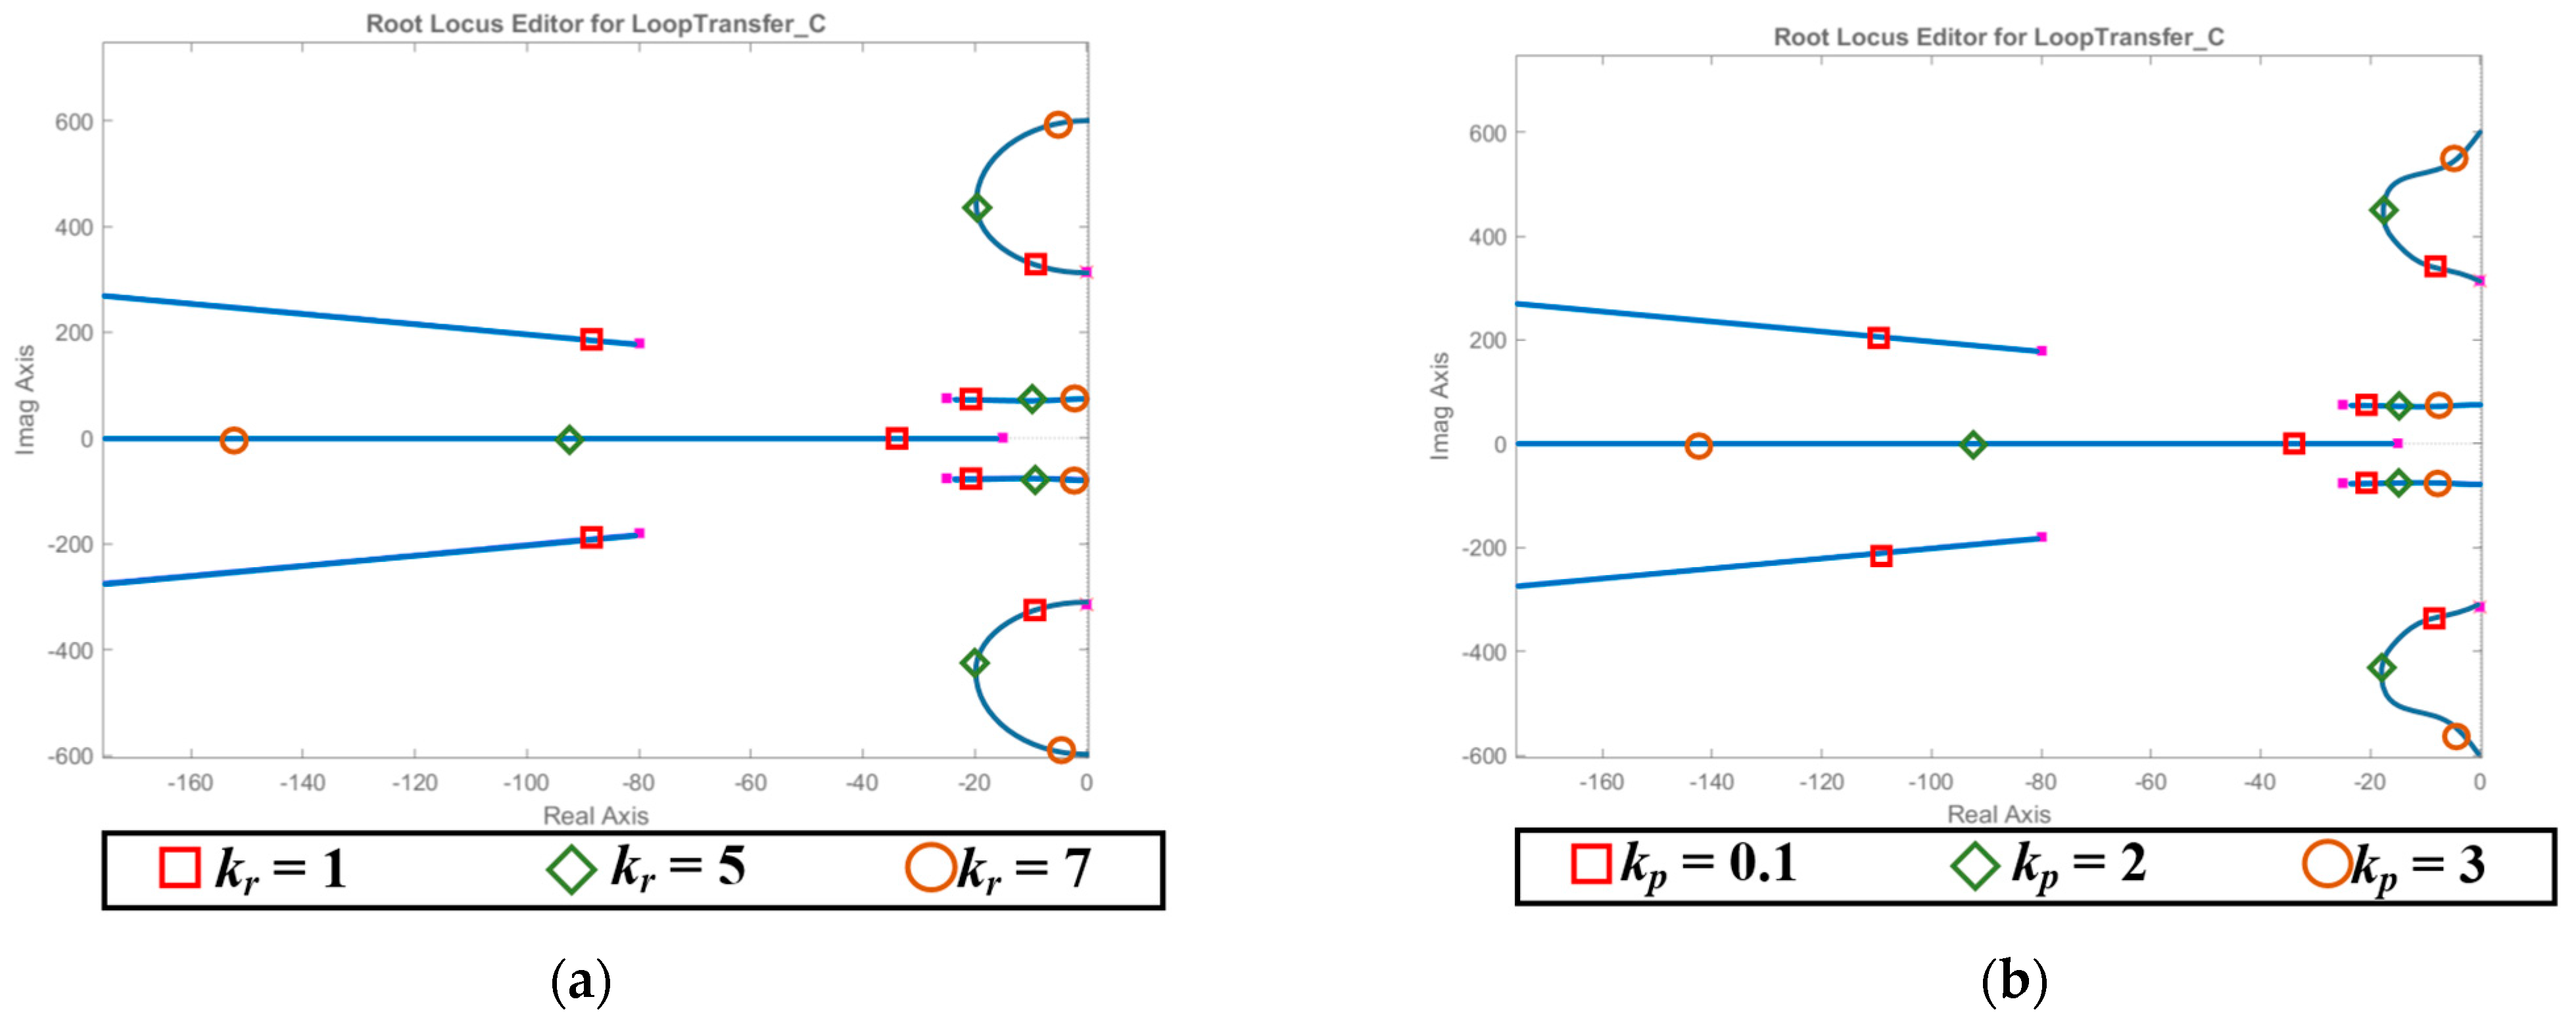
dka controls the input currents of the Cuk inverters according to the input voltages. The tuning process is more complicated for the grid-connected modes. The input currents of the SMs are controlled by a simple hysteresis controller, while the output side is controlled by a proportional resonant (PR) controller, which is tuned according to the SM small-signal transfer function between the output current and the input voltage.
The PR controller is tuned at the grid frequency
ω = 2π
f. To ease the selection of the PR controller gains
kp and
kr, an average value of the duty–cycle ratio is selected at
D = 0.5. The root loci of the PR controller with the system are plotted in two different ways using the SISOTOOL interactive toolbox in MATLAB/SIMULINK
®. Firstly, the proportional gain
kp is kept constant at 0.5 and the resonant gain
kr is increased in the range of [1:7]. Secondly,
kr is kept constant at 5, while
kp is changed from [0.1:3]. The resultant root loci are shown in
Figure 22. The values of the gains are selected in these ranges to keep the system stable, increase the bandwidth of the controller, and reduce the overshoot. A reasonable performance of the system is chosen when
kp = 0.4 and
kr = 5.
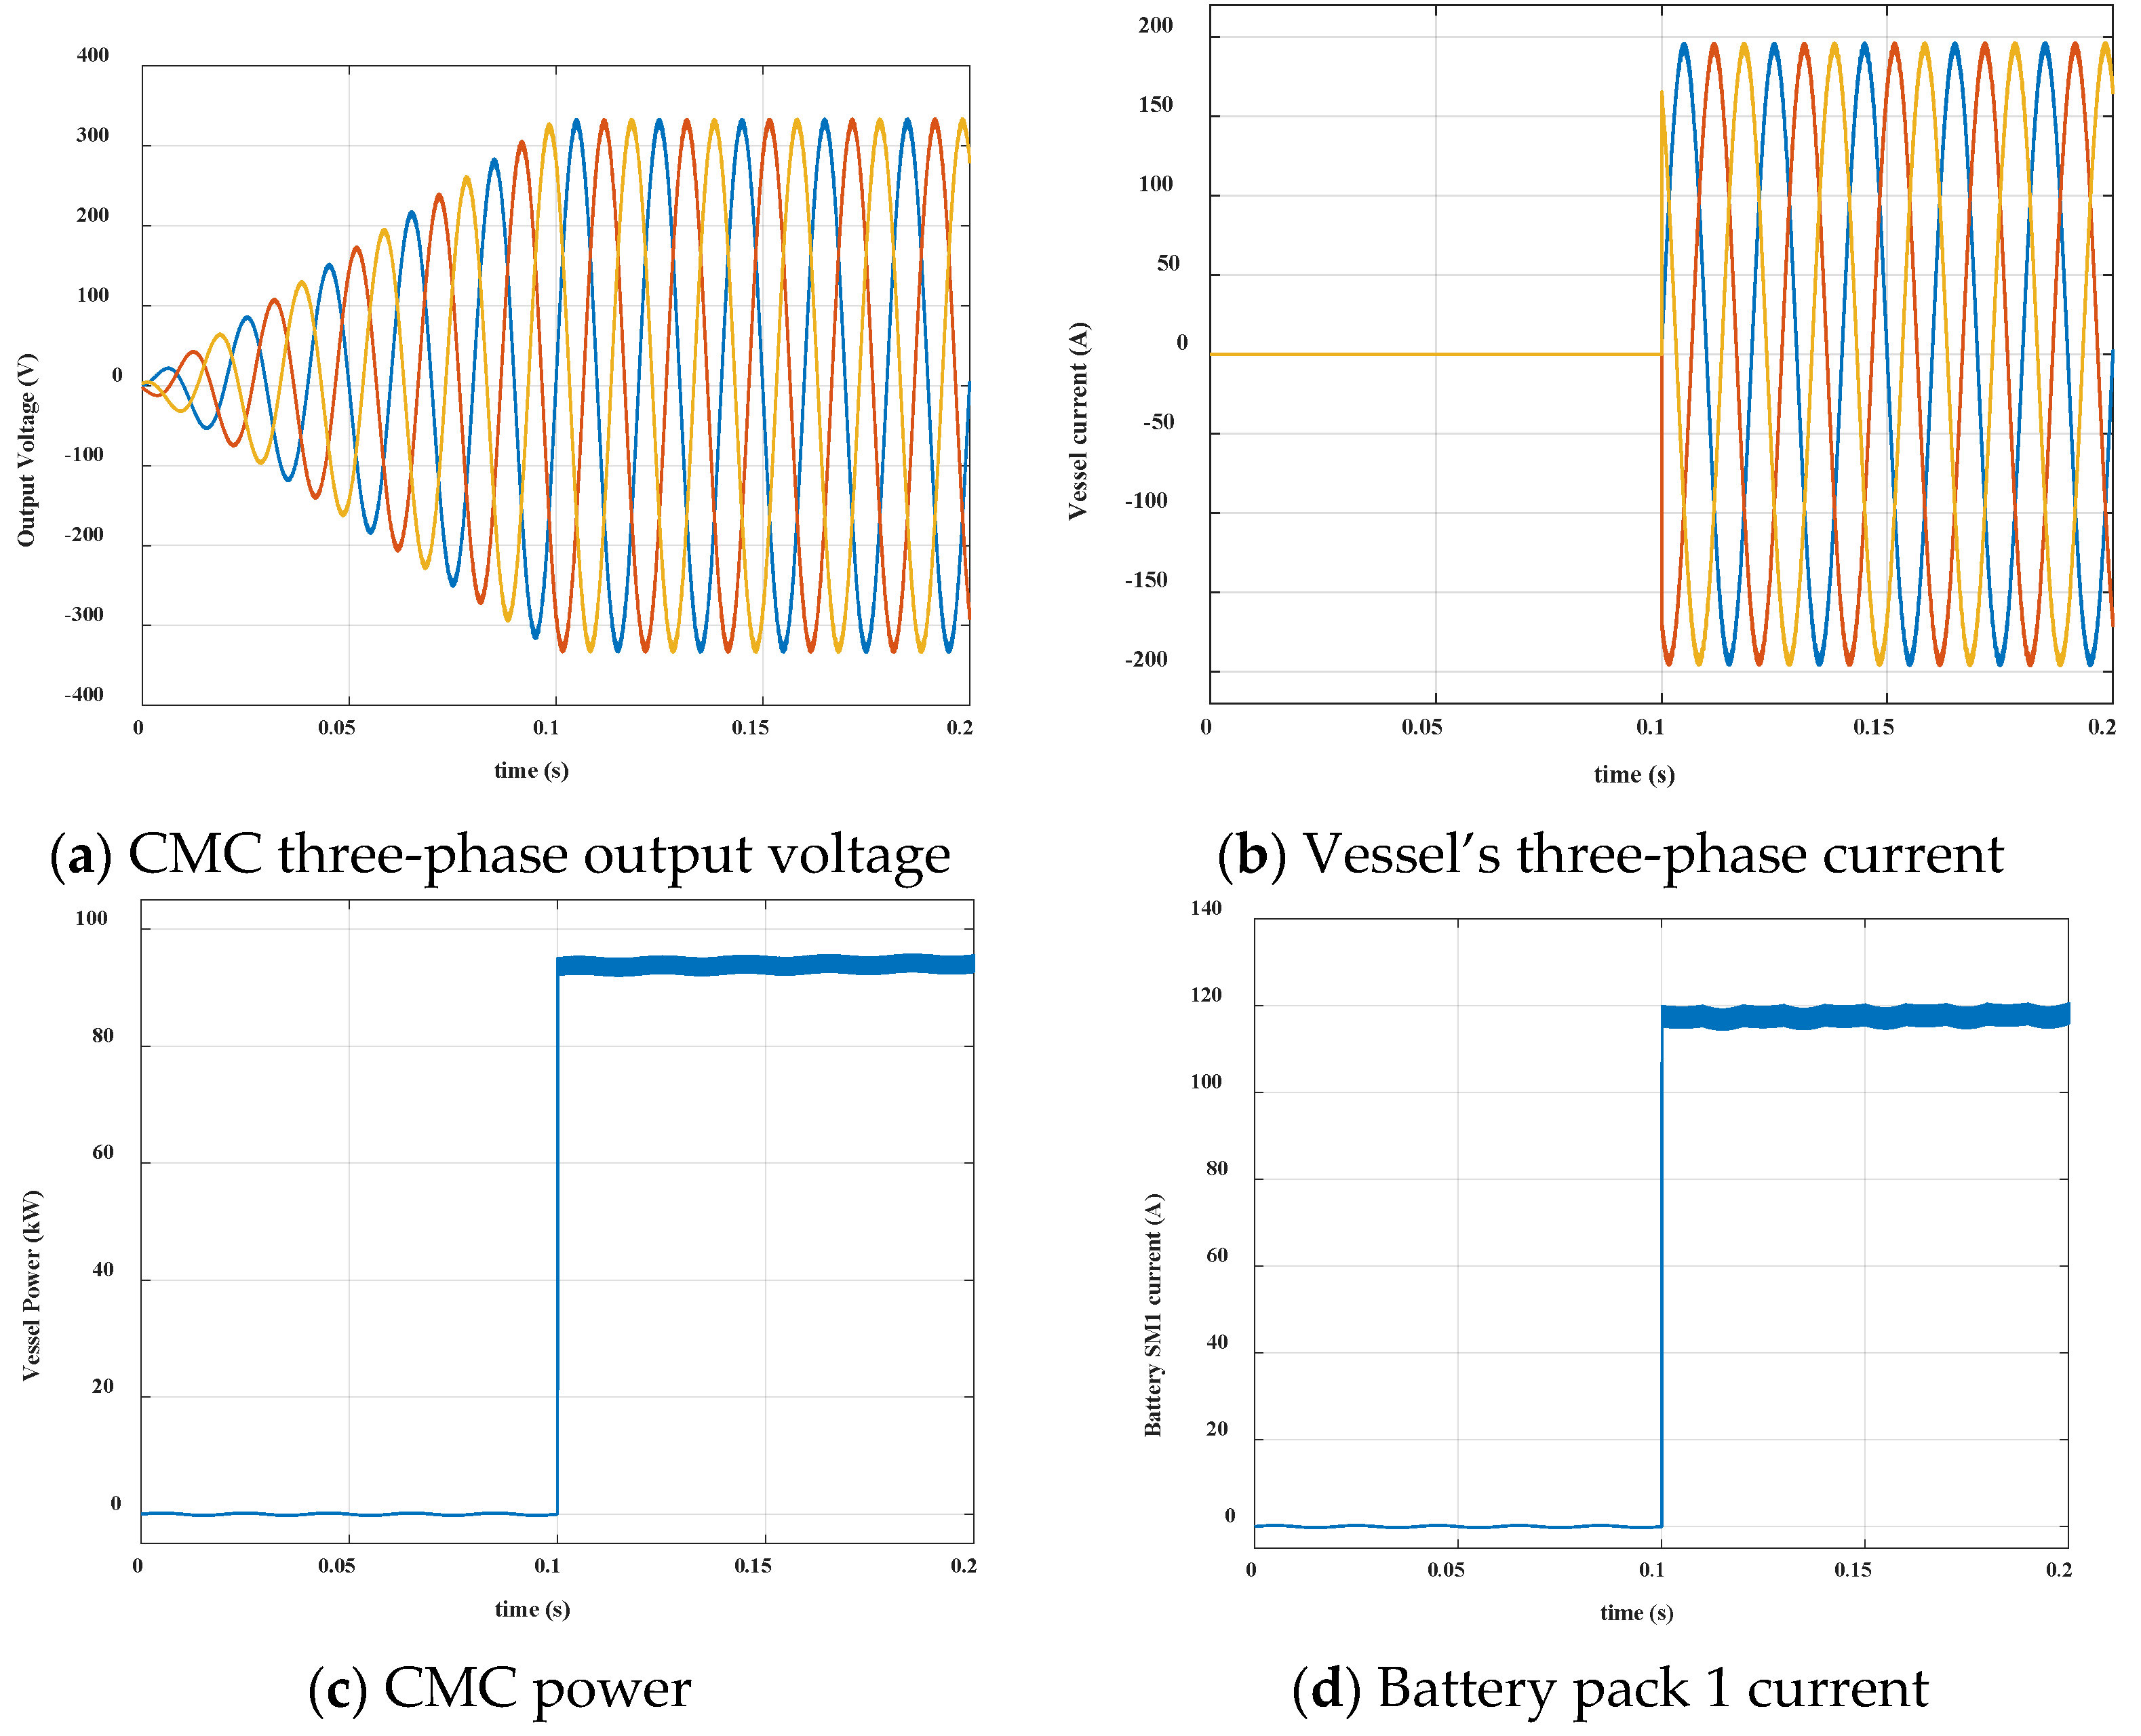
Figure 23 shows the SM-level control when the CMC is operating as a three-phase inverter and the power flows from the battery packs to the vessel. The batteries’ discharging current is controlled so the output voltage tracks the reference one. The output voltage is generated and increases gradually until t = 0.1 s. Then, the vessel’s contactor is turned.
Figure 23a shows the output voltages.
Figure 23b shows the vessel’s current. The power transferred to the vessel is shown in
Figure 23c.
Figure 23d shows the discharging current of the battery pack connected to the first SM.
4.4. Mode 4: From PV to Grid
In this mode, the CMC is still operating as a three-phase inverter and the SMs are working as single-phase dc/ac current source inverter. The power is transferred directly from the PV modules to the ac grid.
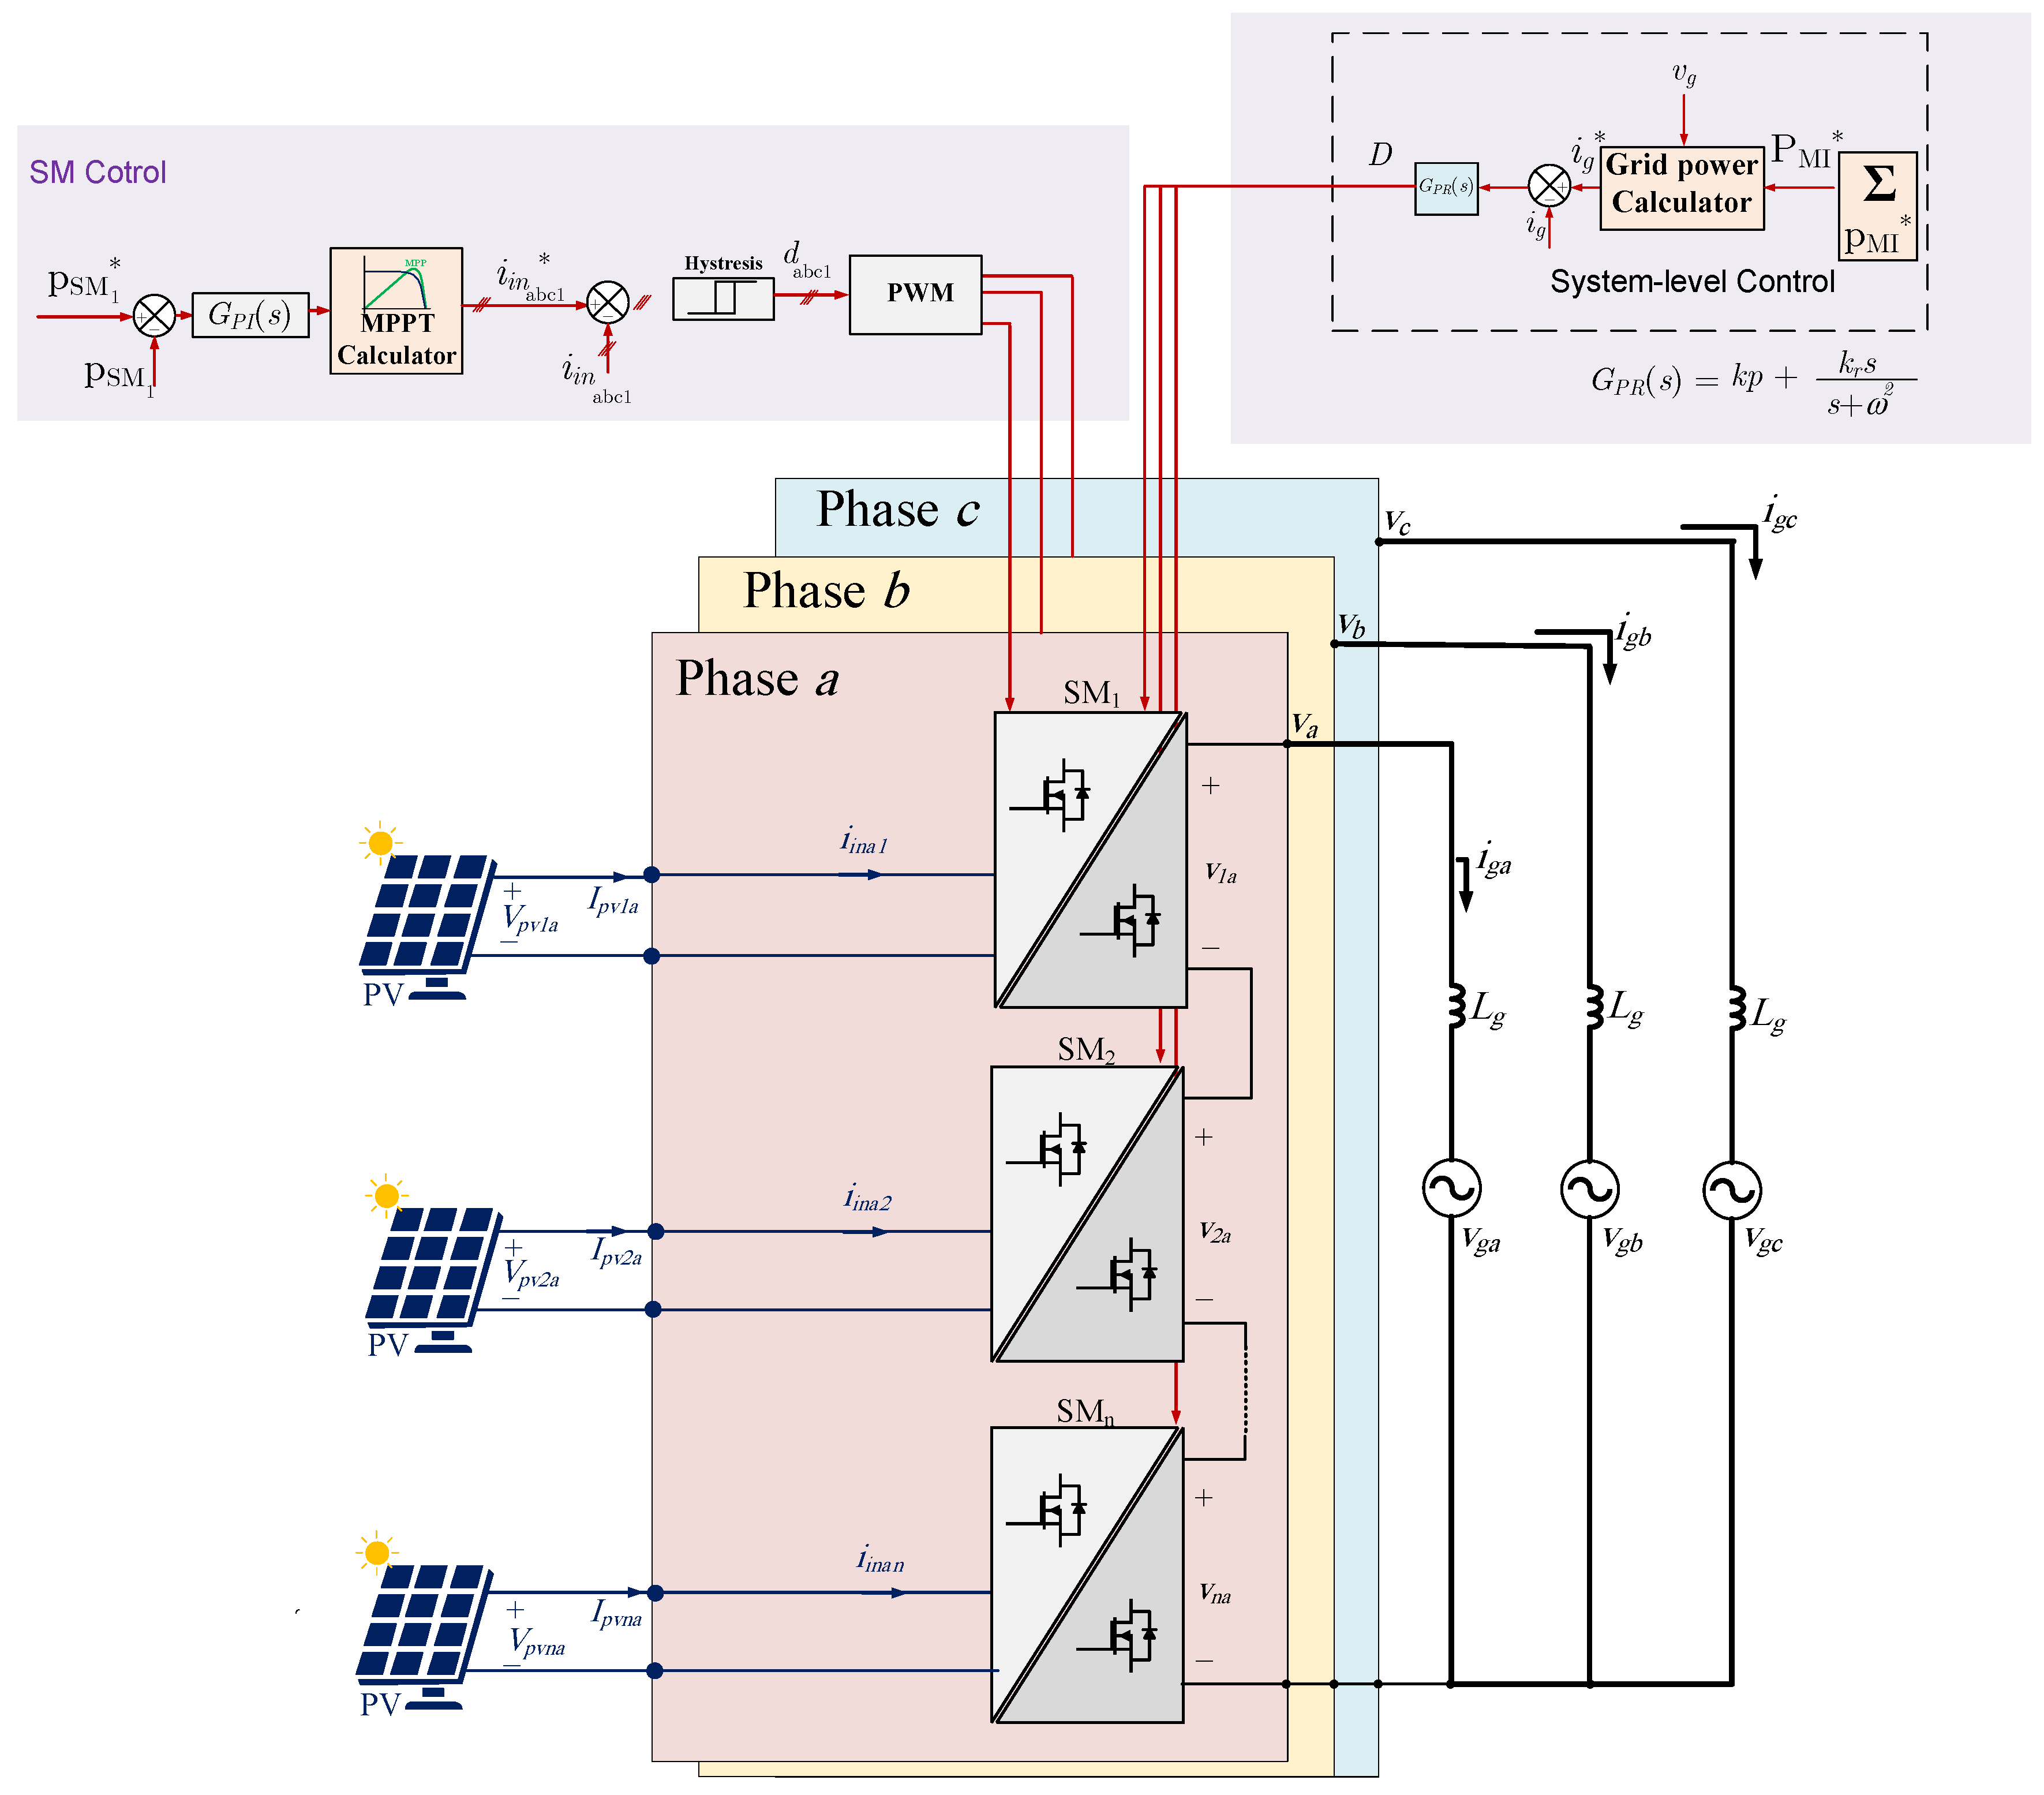
Figure 24 shows the full system with the sub-panel and system-level controllers. The MPPT algorithm itself is not in the scope of this paper and, therefore, it will be assumed that the reference power values for each sub-panel are already known and calculated. The reference current of the
kth SM is controlled by the duty–cycle ratios
dk. These ratios for different SMs will not be identical if the PV arrays have different operational points for any mismatch, such as partial shading, for example. These individual SM controllers will operate the system properly if all SMs are at identical operational points. However, a system-level controller is necessary in the case of mismatch to balance the output voltages and current of the different SMs. The system-level controller at the top right will generate a central duty–cycle ratio
D for all SMs, which will be added to the individual
dk duty–cycle ratios.
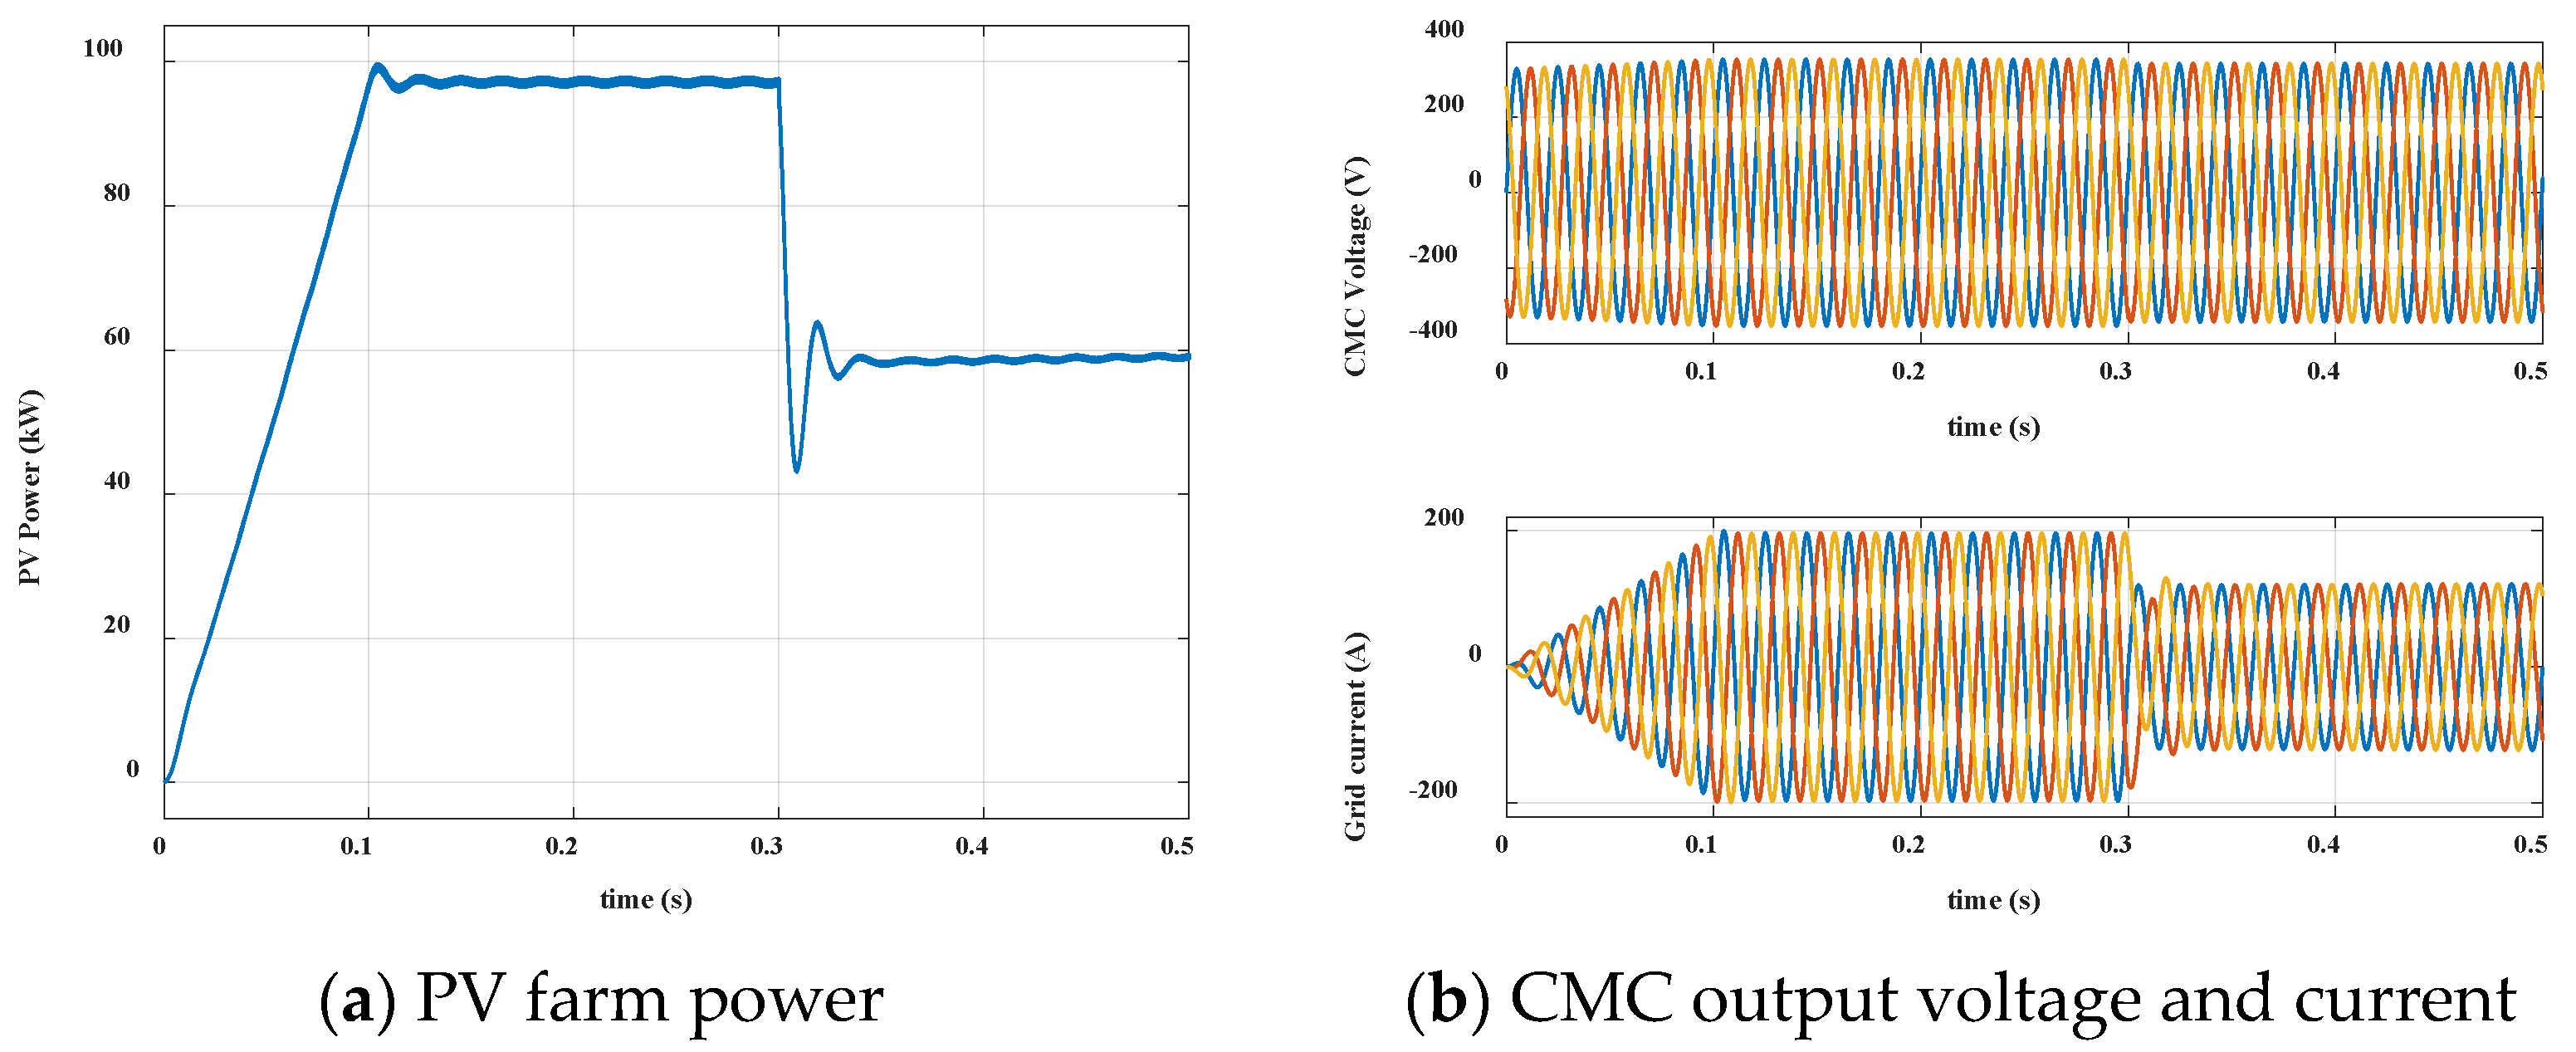
Figure 25 shows the MATLAB/SIMULINK simulation results for a case study when the power of the PV modules is increased gradually from 0 at t = 0 s to 100% at t = 0.1 s. To simulate the transient response, the PV modules’ powers are reduced to 60% at t = 0.3 s.
Figure 25a shows the total power of the PV farm.
Figure 25b shows the CMC output power with the grid current.
Figure 25c shows the input current of the first PV array, which is connected to SM1.
Figure 25d shows the PV curves with the associated operational points.
5. Experimental Results
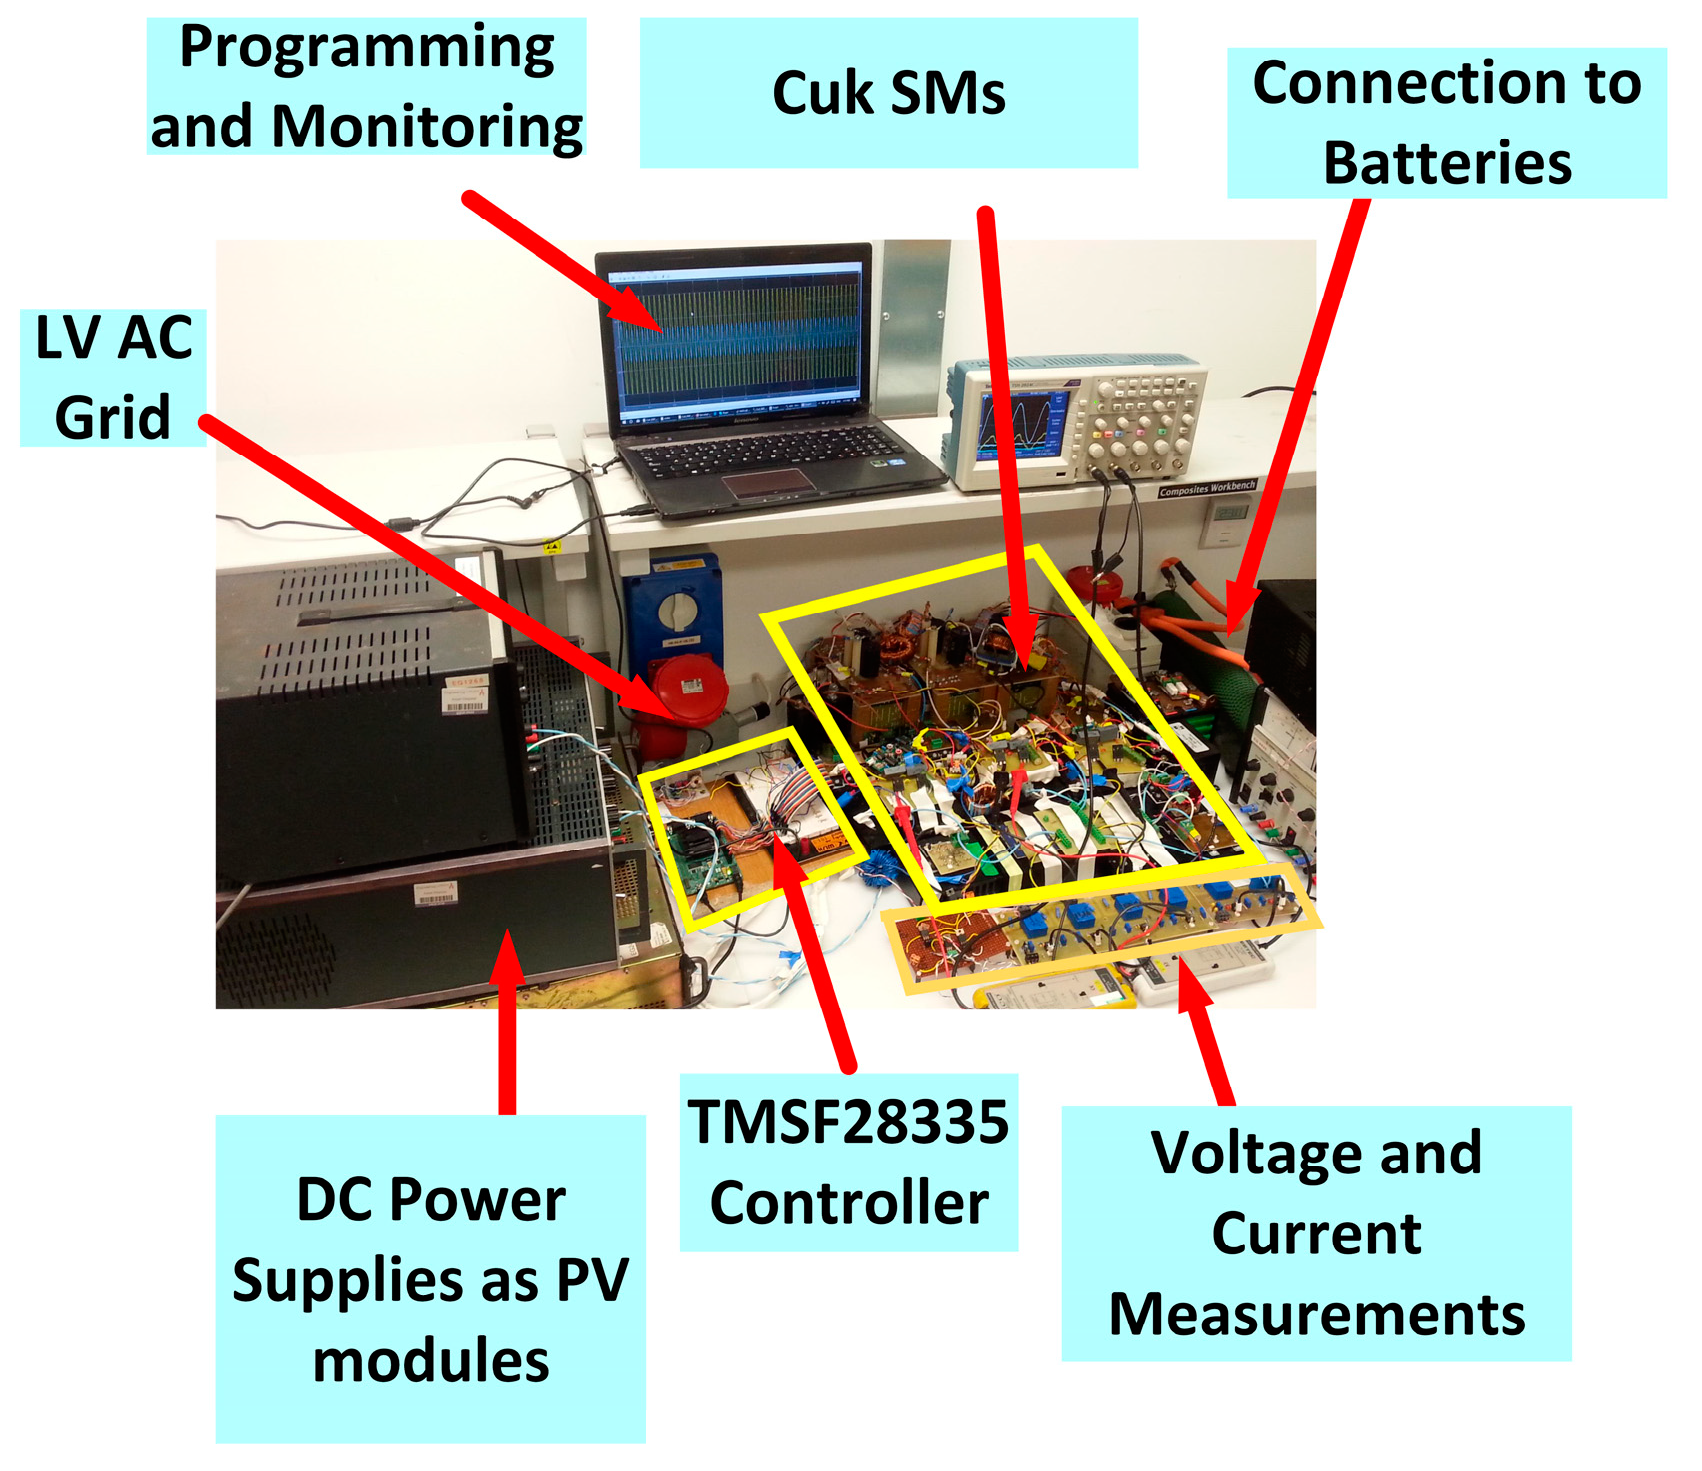
An experimental prototype is built to test the operation of the proposed CMC, as shown in
Figure 26. The three-phase CMC has 12 SMs (4 SMs per phase) each rated at 250W and, hence, the full system is rated at 3 kW. The system is controlled by a TMS32028335 DSP with the parameters in
Table 5. The DC voltage sources have been used to mimic the PV modules in the associated modes of operation.
Each SM is connected to a battery segment composed of 18 series lithium-ion battery cells at approximately 65V. The battery packs are shown in
Figure 27. To ensure the safety of the prototype, the battery packs are controlled by EMUS battery management system (BMS), which continuously monitors the voltage, temperature, and current of each cell using a dedicated cell module circuit. The cell modules transfer their voltage, current, and temperature measurements to the central controller using Controller Area Network (CAN) communication bus.
Two modes will be selected to test the operation of the CMC in order to validate the simulations and the analyses. The first is Mode 3, which is the main mode of the work, where the batteries supply the vessel’s load. The second is Mode 4, where the PV modules produce 3 kW and inject a three-phase current into the local grid. The two modes are shown in the next subsections.
5.1. Mode 3: From Batteries to the Vessel
The vessel’s load is simulated to be a passive load of
Rves = 52 Ω to produce the rated power at the vessel’s full voltage. In this experiment, the output voltage is generated by the Cuk-based SMs and is controlled to increase gradually until t = 0.1 s. Then, the vessel’s contactor is turned.
Figure 28a shows the output voltages.
Figure 28b shows the vessel’s current. The power transferred to the vessel is shown in
Figure 28c.
Figure 28d shows the discharging current of the battery pack connected to the first SM.
5.2. Mode 4: From PV Modules to AC Grid
In this experiment, the power command for the SMs will control the power injected into the grid and extract the maximum available power from the PV modules (mimicked by DC supplies) at the same time. The proposed control scheme in
Figure 24 ensures that the maximum power can be obtained, even in case of partial shading conditions.
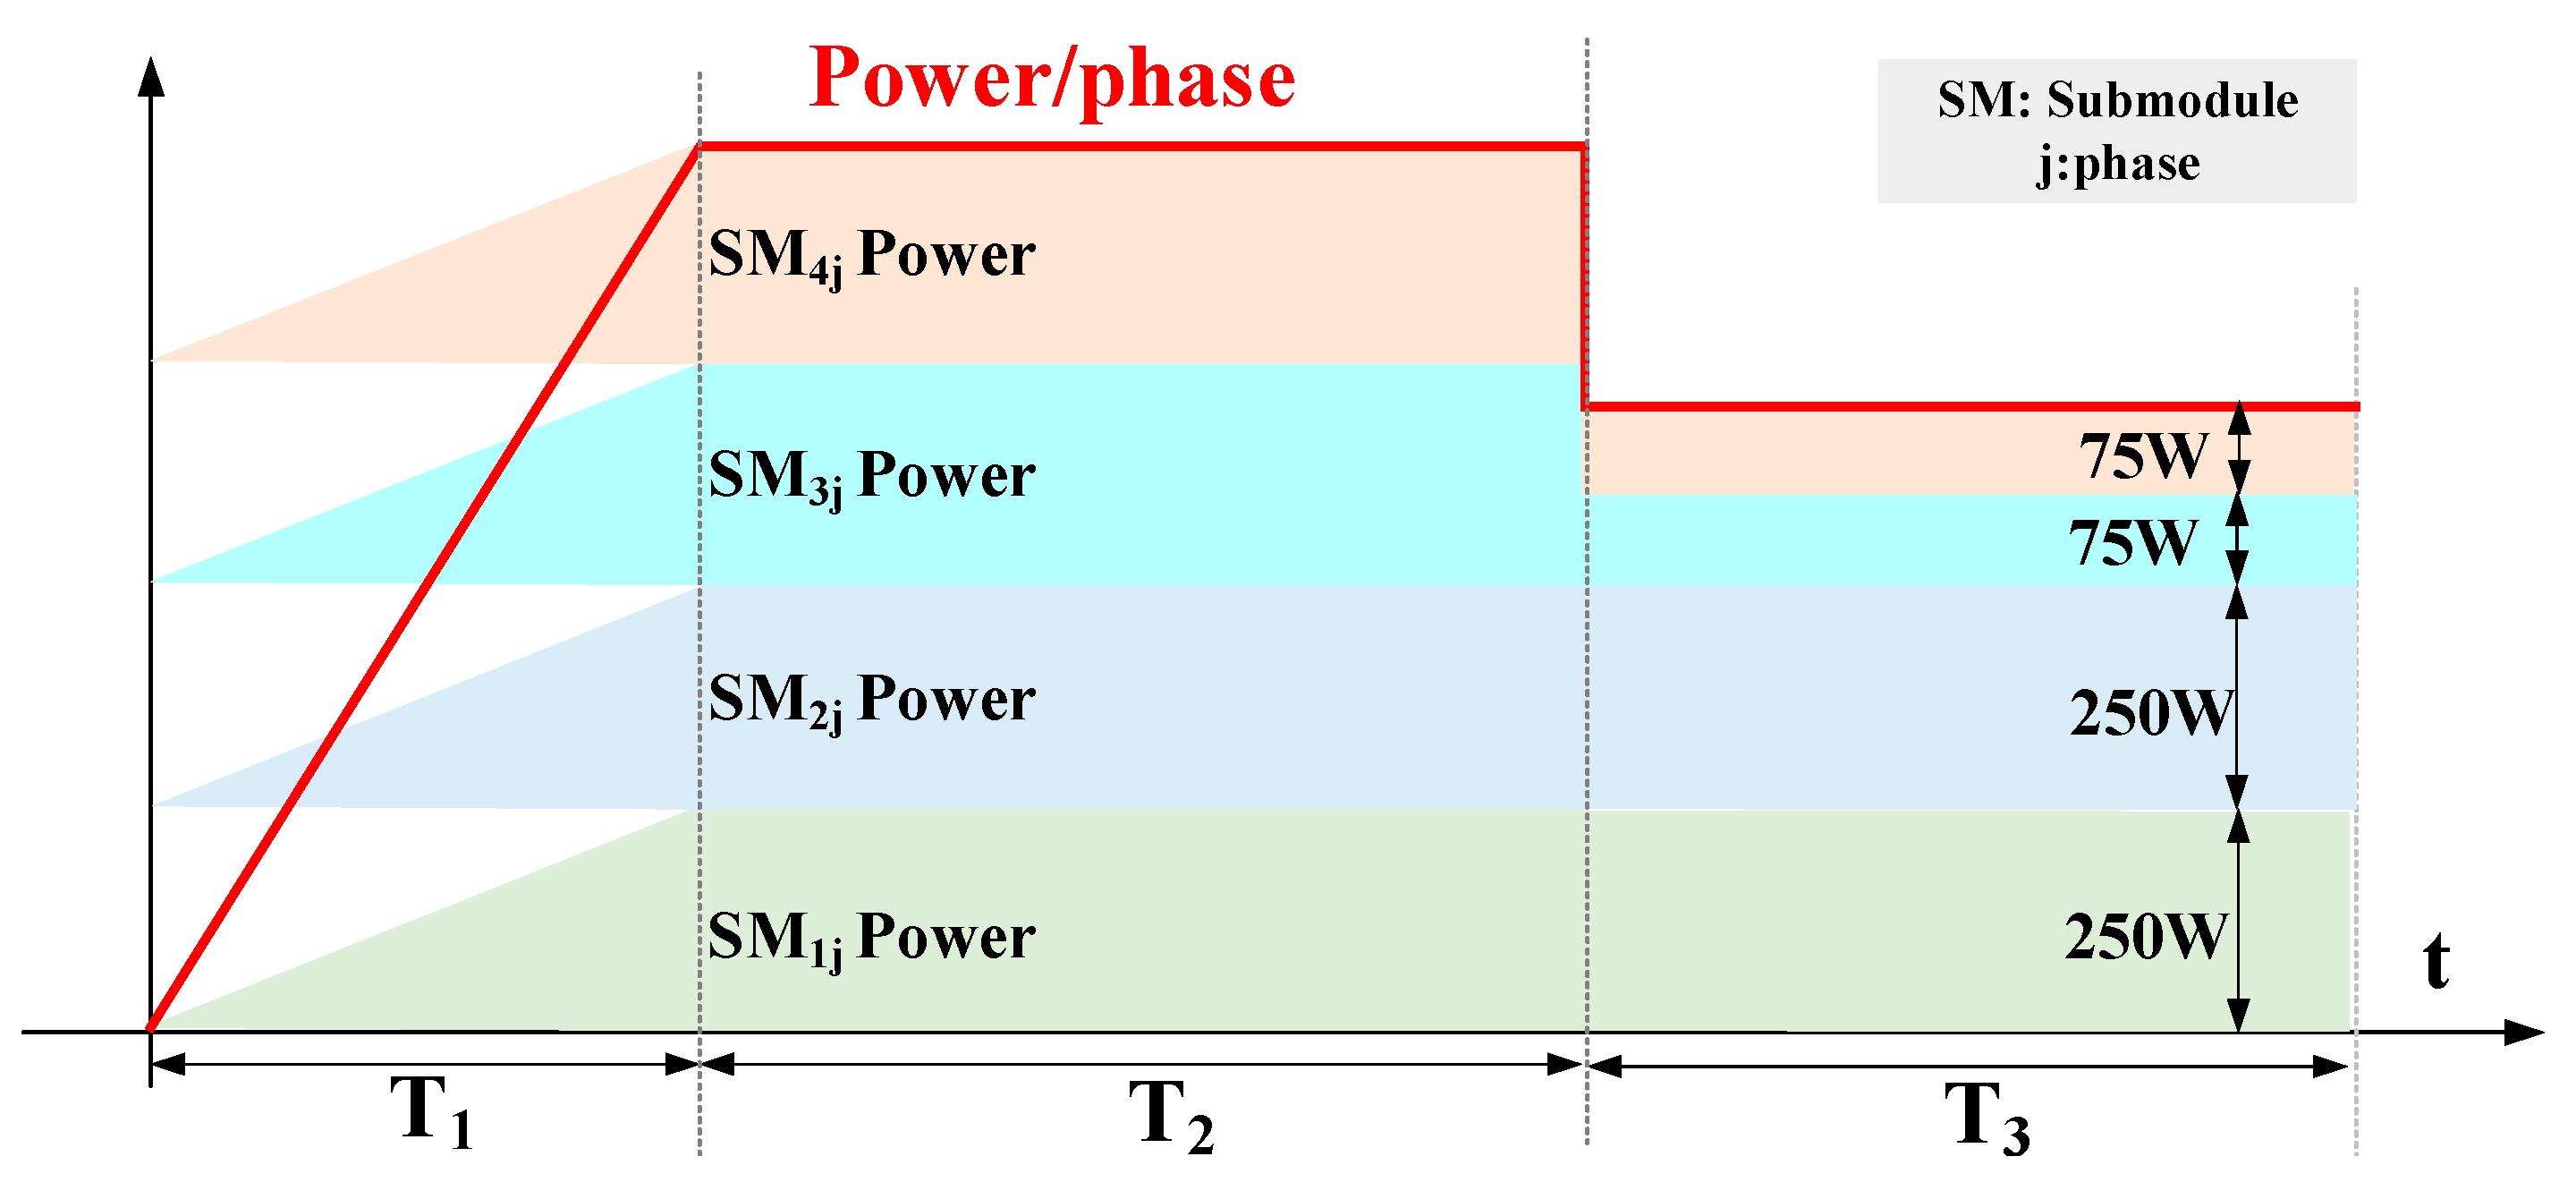
Figure 29 shows the power command of each phase to show this capability. During the period T1, the CMC has equal power sharing between the SMs in each phase when they start from zero power and increase gradually. During T2, the SMs reach the maximum power of 250W. The period T3 simulates the partial shading when the top two SMs keep generating 250W, while the other two drop to 30%, making the total power decrease to 65%.
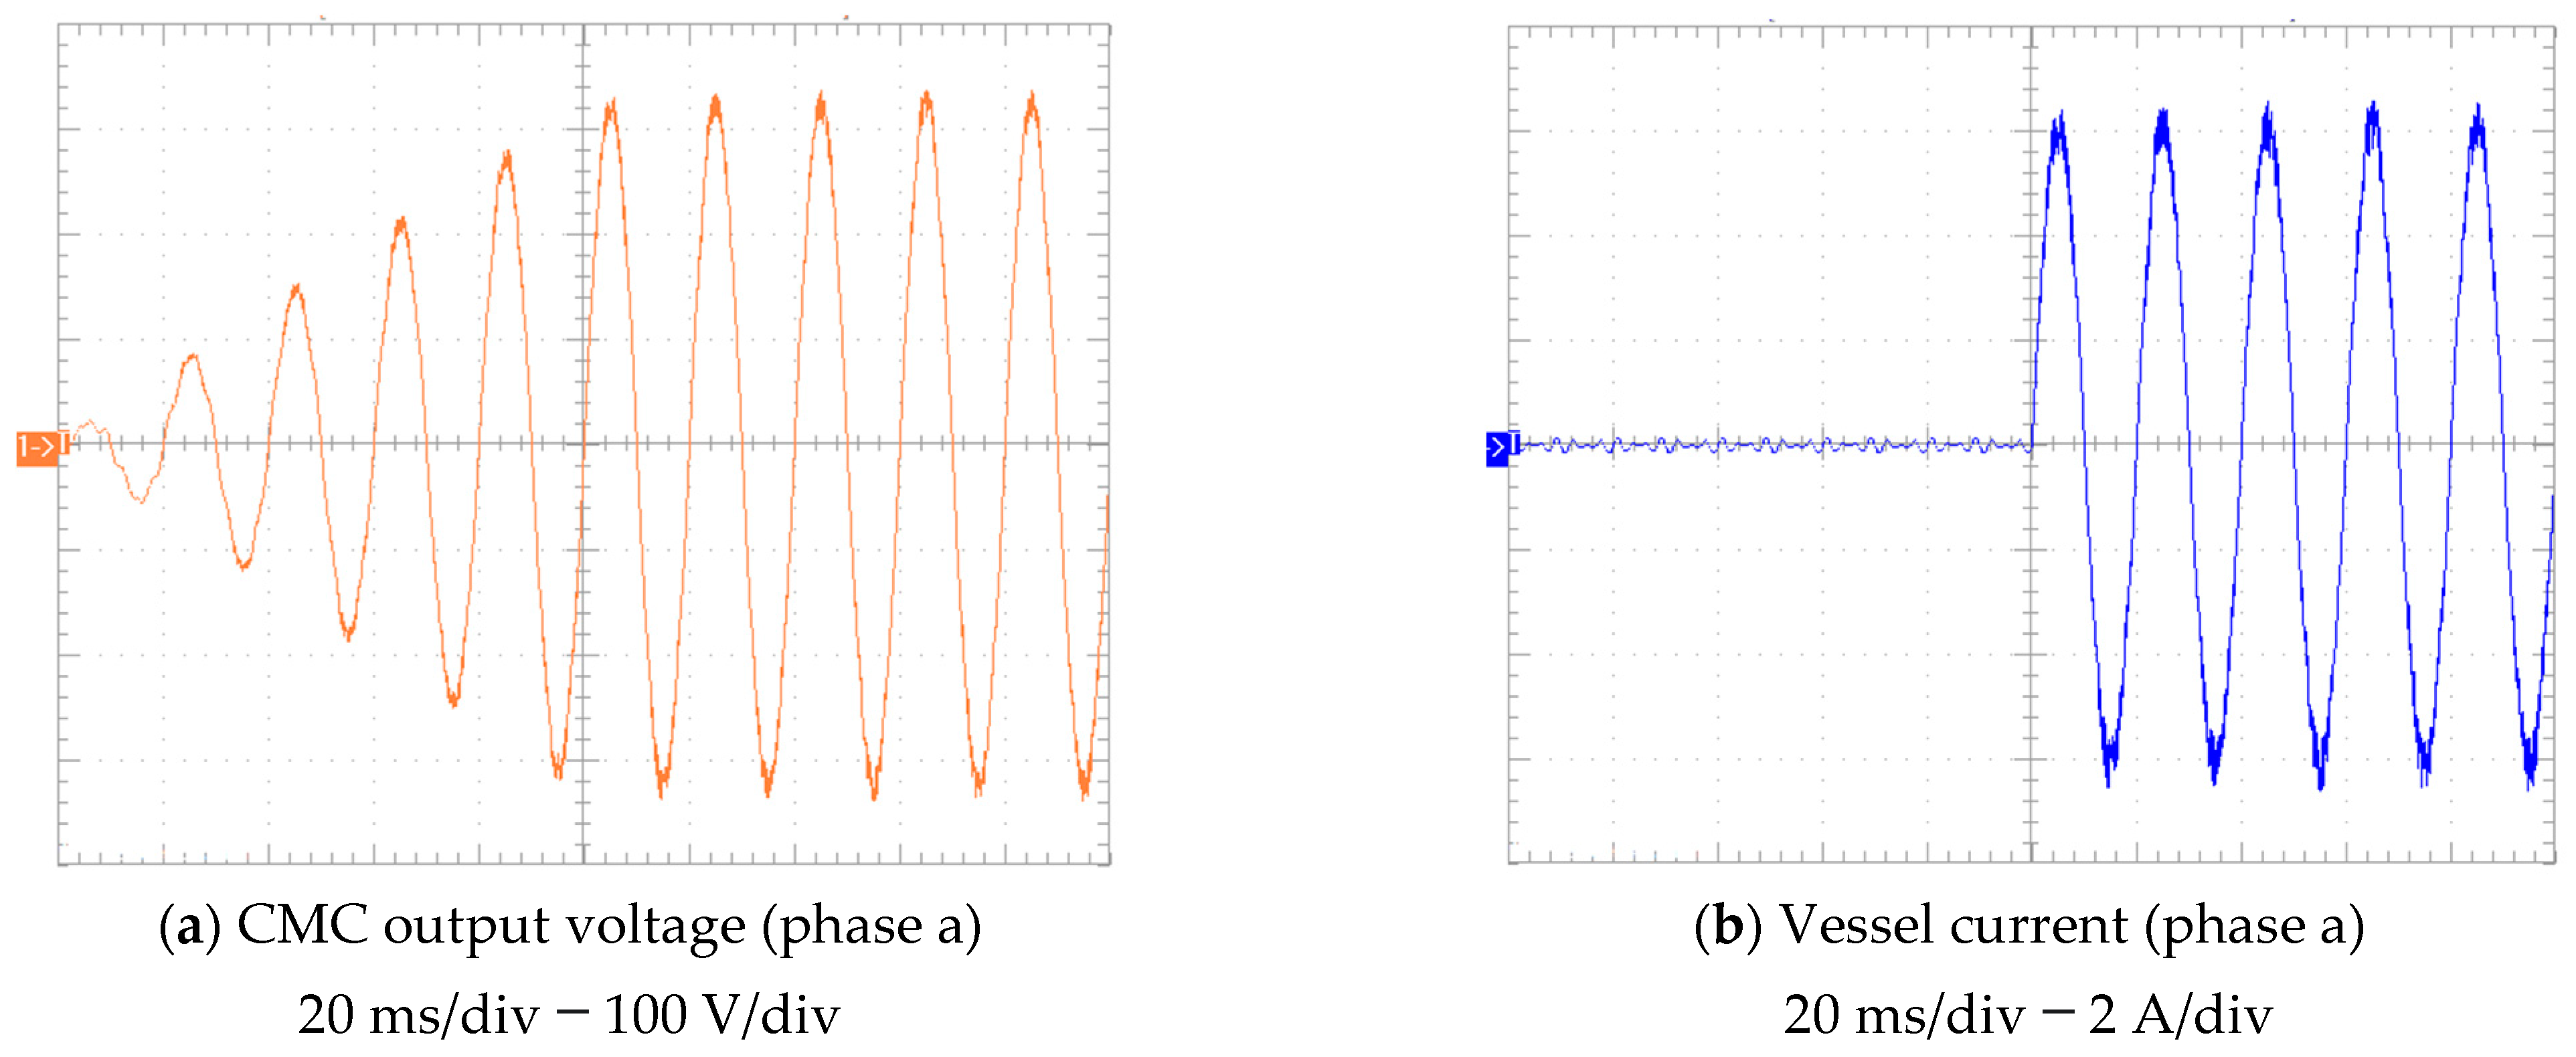
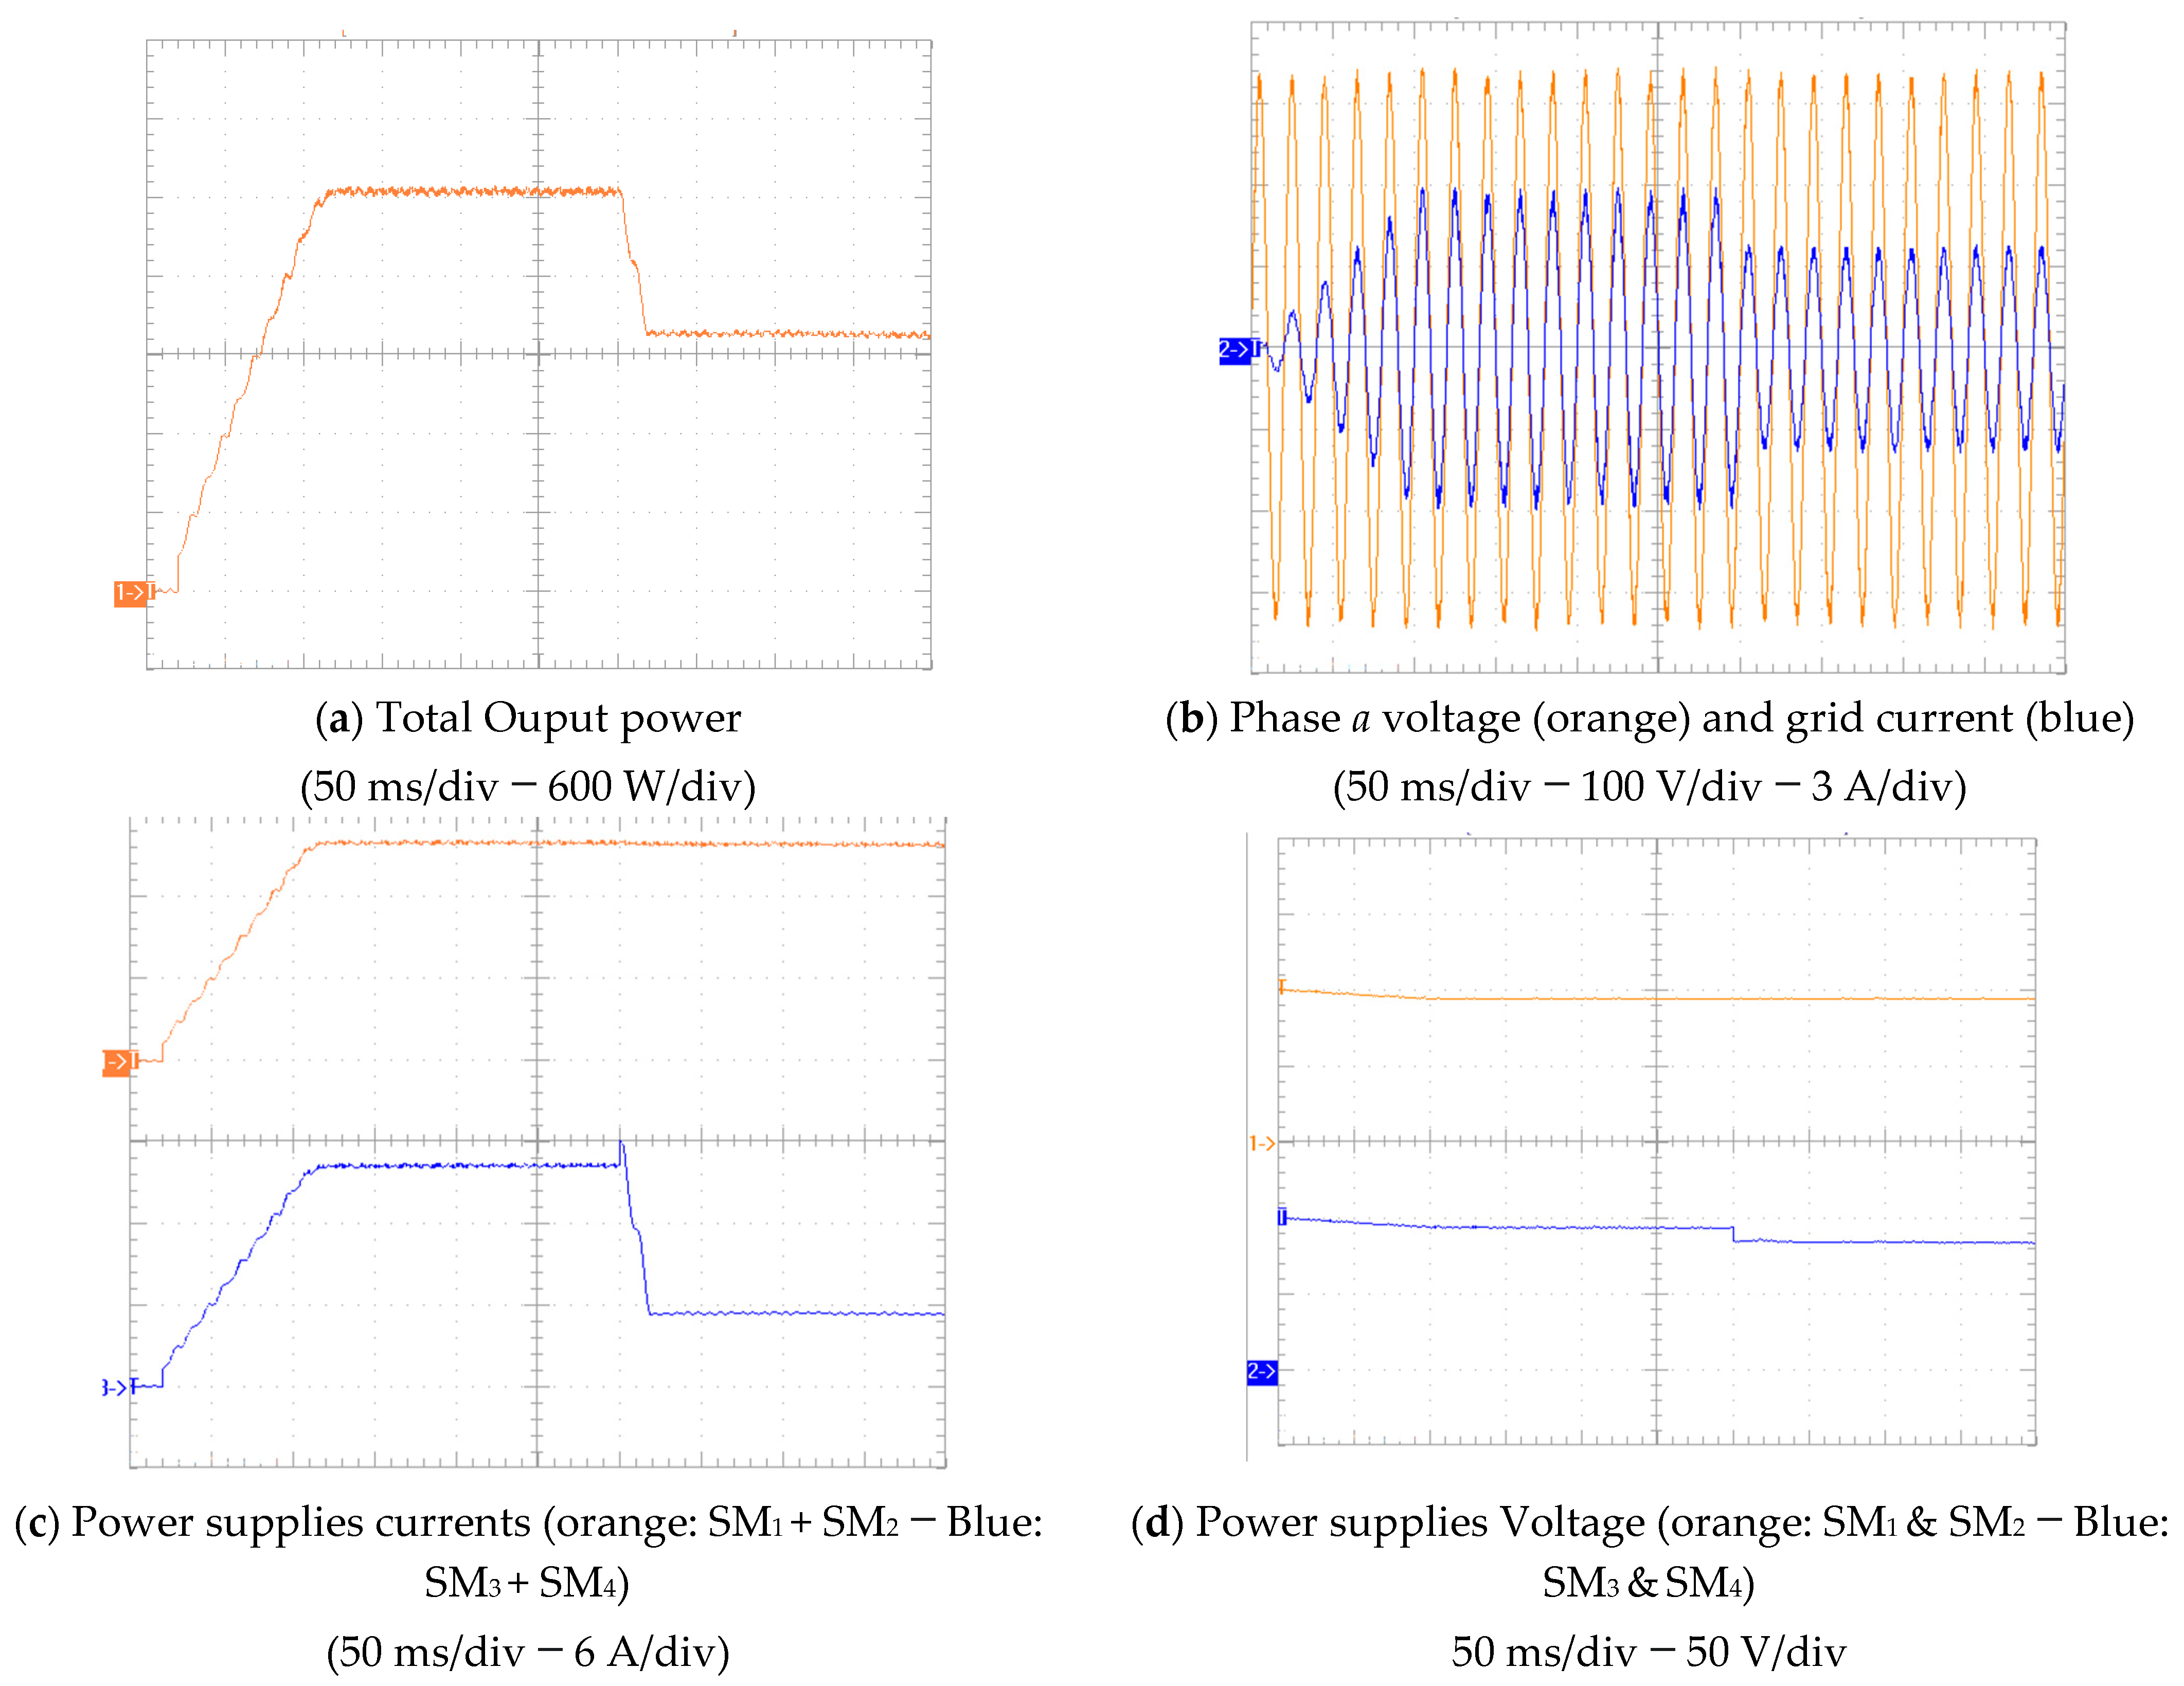
Figure 30 shows the corresponding experimental results for this case. Two power supplies are used. The first two SMs are connected to one power supply, and they will be considered as unshaded modules, while the other two SMs will be connected to another power supply as shaded modules starting from t = 0.3 s.
Figure 30a shows the total power of the system. From t = 0 s to 0.1 s, the power increases gradually until it reaches the maximum total value of 3 kW. Then, the total power drops at t = 0.3 s to 65% because two SMs are considered shaded.
Figure 30b shows phase
a voltage and current.
Figure 30c shows the currents of the two power supplies.
Figure 30d shows the two power supplies’ voltages.
5.3. Switching from Mode 2.2 (PV Modules → Batteries) to Mode 2.4 (PV Modules → Grid)
In this experiment, the modular inverter was operating originally in Mode 2.2, where the power flows from the power supplies, which are mimicking the PV modules to the batteries. When the batteries’ voltages reached the maximum limit, the operation switched to Mode 2.4, where the power has been directed to the grid using the associated switch, as explained in
Table 1. In
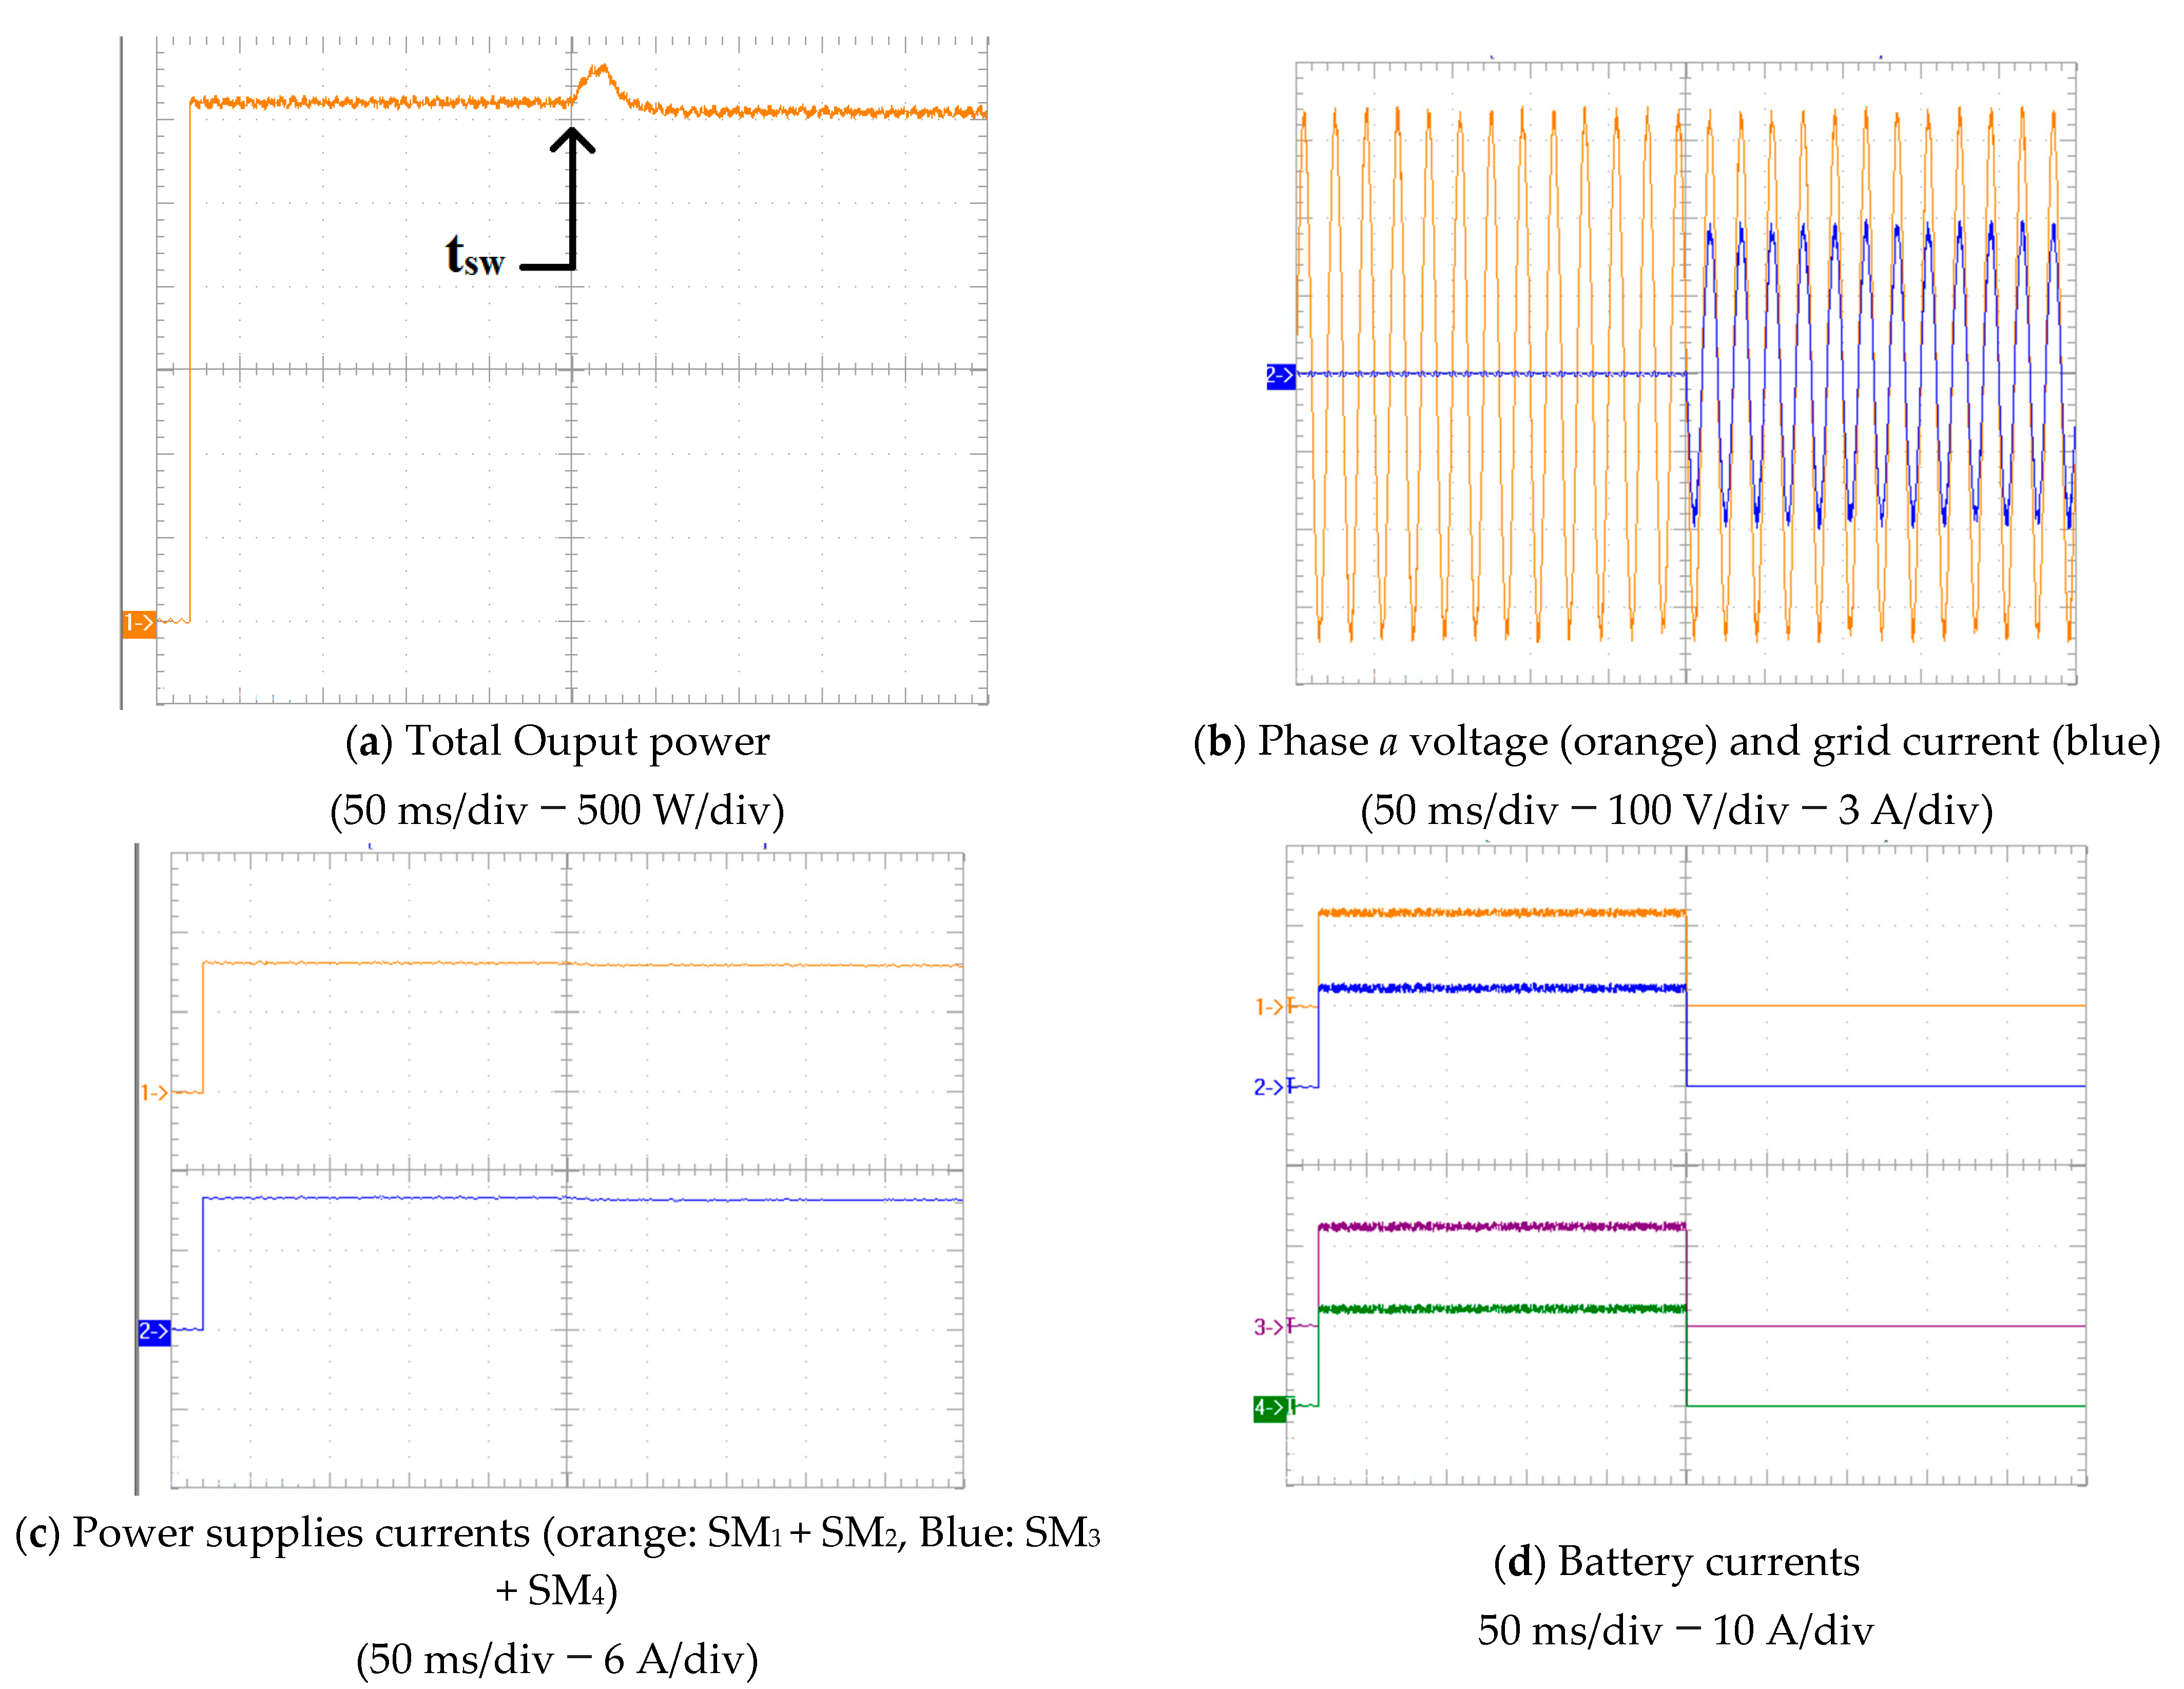
Figure 31, the system switches from Mode 2.2 to 2.4 at t = 250 ms.
Figure 31a shows the total power of the system, where the control system directed the power from the power supplies to the grid.
Figure 31b shows the grid voltage and output current of phase
a. The output current started to flow into the grid once Mode 2.4 has been activated. The power supplies’ currents are shown in
Figure 31c, where they are kept constant during the two modes.
Figure 31d shows the battery segments’ currents when they have stopped charging the batteries at
tsw.
6. Discussion
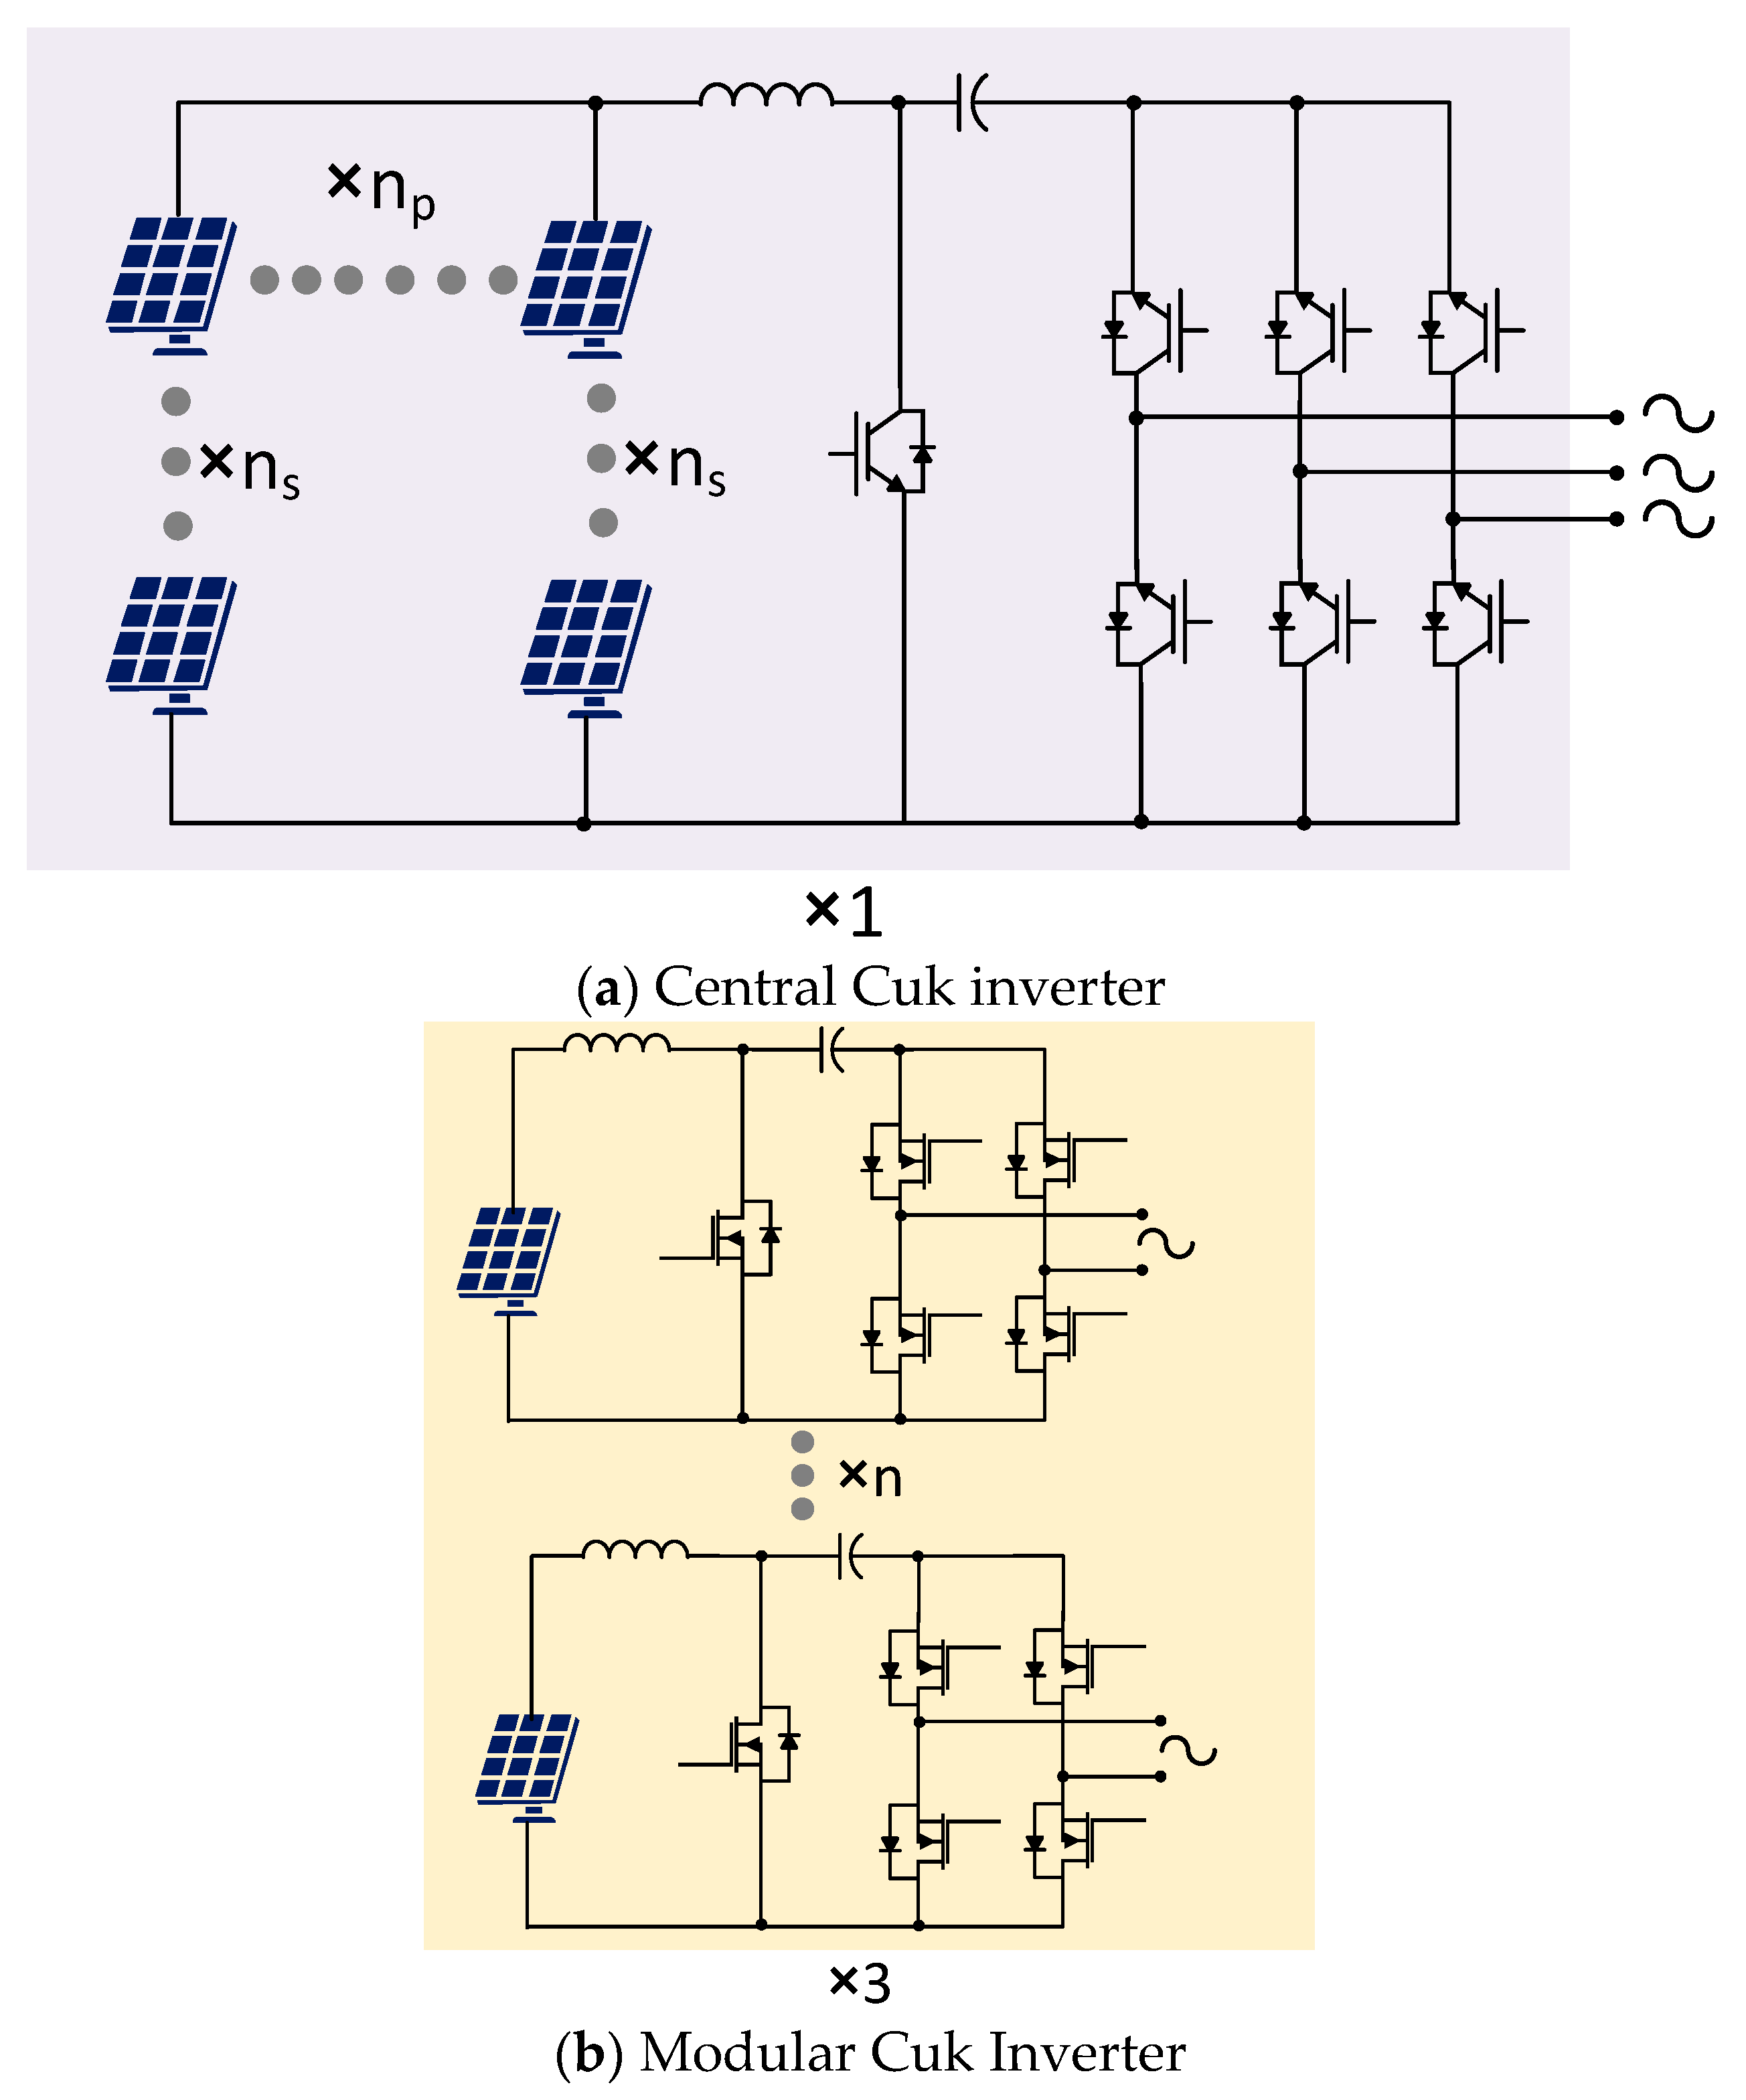
The modular energy converter provided advantages for the shore-power RES in terms of the performance, controllability, power harvesting, and fault tolerance. On the other hand, it adds the disadvantages of complexity and increased switch count. The following case study will compare between the performance of the central topology and the modular topology.
Figure 32 shows the central Cuk converter with its modular descendent. The case study will be based on the power level used for the MATLAB simulations in
Section 4, which is
P = 96 kW. The same PV modules will be chosen for both centralised and modular systems. The number of switches in the central Cuk inverter is 7, while, in the modular system,
nt = 5Χ
nΧ3. The number of PV modules is
nM =
nΧ3.
As shown in
Figure 32a, the PV modules will be connected in a series parallel combination to form one array. The number of parallel strings is np, while the number of series modules in the string is ns. Thus, the current rating of the input switch is
np × Impp. The current rating of the output switches is
Isw = P/√3
Vg. All the switches should be rated at voltage of
Vg+
nsVmpp. For the modular structure in
Figure 32b, the PV array connected to the Cuk inverter has reduced
ns and
np and, hence, the voltage and current stresses will be reduced, allowing for using smaller devices with lower on resistances and faster on/off switching times.
To compare between the number of the switches and the associated power losses, the mathematical analyses in [
27] have been followed and used in these two case studies. The power losses of the central and modular converters are summarised in
Table 6 and
Table 7, respectively.
Although increasing the number of Cuk inverters will increase the number of the switches, the rating of these switches can be lowered and, therefore, their cost and on resistances can be reduced significantly.
Table 8 provides a numerical comparison between the two systems in terms of their devices’ stresses, power losses, number, and cost. The comparison is carried out with different values of
n,
ns,
and np. For the SPC application, the modular configuration improves the efficiency by reducing the power losses in the semiconductor switches. With increasing the number of modules, MOSFET devices with low on resistance can replace the IGBTs, which improves the efficiency and the cost. However, at some point, the efficiency is reduced again because the number of the switches increases dramatically.
Although the modular configuration adds more complexity in terms of the switch count and, hence, the required gate drive boards and controller, it improves the harvested energy from the renewable energy sources because an individual MPPT controller can be used to extract the maximum available power during partial shading. Moreover, the modular configuration provides better fault tolerance when one of the inverters is faulted due to damaged switch or passive components, which means that the system can continue operation by bypassing the faulty inverter module.
7. Conclusions
The paper presented a three-phase CMC system for shore power which integrates renewable energy systems to supply the docking ships at the ports. The proposed modular converter is able to be integrated with different RESs easily and work either off-grid or on-grid. During off-grid mode, the CMC is able to direct the power from the RESs, such as marine or solar PV systems into either batteries or the vessel itself. The charged batteries can then direct the energy into the vessel when required. If connected to the grid, the CMC can control the power flow from either the PV modules or the charged batteries into the grid to sell the harvested power if the shipping demand is low in order to recover the cost of the investment in the port’s infrastructure.
Although different converter structures can be chosen in this application, the modular structure has been chosen to improve the controllability of the SMs, harvest the maximum possible energy from the RESs, provide better charging/discharging for the batteries, and provide better sharing of the voltage stresses across the semiconductor devices. The Cuk inverter has been chosen as the converter’s SM, as it can provide the required performance and provide a galvanic isolation at the same time to improve the safety and meet the grid’s standards. The Cuk SM is known for its low power losses and, hence, high efficiency; however, this specific point was not studied in this work, as it has already been considered in previous publications.


