Abstract
Based on the research background of improving personal thermal comfort and promoting building energy efficiency, personal comfort systems (PCSs) have recently received considerable attention. The thermoelectric conversion unit (TECU) has great potential in PCSs as it is compact in size, environmentally friendly and highly reliable. Aiming to improve heat exchange efficiency, this paper investigates the structural optimization of heat sink for the TECU used in PCSs. Firstly, the heat exchange mechanism of the thermoelectric module is analyzed. The structural design of the cold-side heat sink in the TECU is summarized as a multiobjective optimization problem in which four structural parameters (number of fin rows, fin thickness, fin height and thickness of base) of the heat sink are selected as the adjusting variables. Then, based on the establishment of the cold-side computational fluid dynamics simulation model, a multiobjective genetic algorithm is utilized for the optimization task. Sensitivity analysis demonstrates that the number of rows and the fin thickness have significant influence on the optimization objectives. Taking both the outlet airflow temperature and the velocity into consideration, five representative heat sinks involving two different materials are customized. A testing platform is built for performance comparison. Results show that the proposed optimization method can effectively improve the heat exchange efficiency of a TECU, which provides a reference for the TECU-based PCS design.
1. Introduction
Buildings account for around 40% of global energy use [1,2], while heating, ventilation and air-conditioning (HVAC) systems account for the majority of building energy consumption [3]. In spite of such significant HVAC energy consumption, it is difficult to meet the ASHRAE requirements of 80% occupant satisfaction with the indoor thermal environment due to the differences in occupant thermal preferences [2,4]. Personal comfort systems (PCSs) provide an effective solution to fill the gap between building energy consumption and occupant thermal comfort [5,6]. PCSs are commonly used to adjust the microenvironment of the local occupied area. This control mode addresses the requirement of each individual’s thermal comfort and the expansion of the HVAC set-point range. It may help improve the whole thermal comfort level and HVAC energy efficiency. In recent years, various PCSs have been reported to increase convective cooling, radiant heating, and conductive heating/cooling of the occupants [7,8,9,10,11]. Among them, the thermoelectric conversion unit (TECU), providing both cooling and heating functions with a better temperature control capability, has received considerable attention [10,12,13,14,15]. The TECU also has other benefits such as small size and weight, environmental protection, rapid thermal response, high reliability, etc. [16,17].
Recently, many efforts have been devoted to designing and optimizing thermoelectric devices [17,18,19,20,21,22,23]. Zhou et al. [18] optimized the thermal conductance allocation ratio and analyzed the influence of total thermal conductance and the heat capacity rate on the performance of a thermoelectric cooling system. Zhu et al. [19] optimized the total heat transfer area allocation ratio for a thermoelectric device to achieve the maximum coefficient of performance (COP) and cooling capacity. Seo et al. [17] discussed the influence of different shapes of heat sinks attached to a thermoelectric module (TEM) through numerical and experimental investigations. Although many researchers have studied the design and optimization of thermoelectric devices, relatively few studies have considered related problems in the PCSs. To list some, Zhao et al. [10] investigated the weight minimization of a thermoelectric unit used in a PCS. Hong et al. [14] designed a wearable thermoelectric device for personalized thermoregulation. Lou et al. [12] designed a lightweight thermoelectric undergarment system that could achieve potential savings of about 15% of HVAC energy without compromising personal thermal comfort. The structural parameters of heat sinks have great influence on the heat exchange efficiency of the attached TEM [17]. Yu et al. designed a novel portable cooling suit based on thermoelectric conversion refrigeration and confirmed its remarkable cooling effect through experiments [21]. To our best knowledge, the issue of optimizing the heat sink is rarely investigated for the thermoelectric devices applied to PCSs. Considering the low energy efficiency ratio of thermoelectric devices, structural optimization of the heat sink is an effective way to improve the performance of PCS.
Motivated by the above discussion, the structural optimization of the heat sink attached to the TEM is studied in this paper for potential application in PCSs. Main contributions include the following three aspects:
- (1)
- The heat exchange mechanism of TEM is analyzed. On this basis, the structural design of the attached heat sink is summarized as a multiobjective optimization problem.
- (2)
- Based on the established computational fluid dynamics (CFD) model of the heat exchange procedure, the main parameters of the cold-side plate-fin heat sink are optimized with the aid of multiobjective a genetic algorithm (MOGA). In addition, parameter sensitivity analysis is provided, and the number of rows and fin thickness show significant influence on optimization objectives.
- (3)
- Based on the simulation results, experimental tests are carried out. Results demonstrate that the developed structural optimization can effectively enhance the efficiency of heat exchange between the heat sink and the airflow in the TECU, which helps enhance personal thermal comfort.
The rest of this paper is organized as follows: The heat transfer characteristics of the TEM are analyzed, and the multiobjective optimization problem is formulated in Section 2. The CFD model of the cold-side heat exchange process is established in Section 3. The MOGA optimization process is developed, and simulation results are discussed in Section 4. Experimental tests are provided in Section 5. Finally, some conclusions and future work are given in Section 6.
2. Problem Formulation
With the goals of improving personal thermal comfort and promoting building energy efficiency, the TECU designed in this paper is applied to a PCS. Taking the cooling scenario as an example, Figure 1 shows the diagrammatic sketch of the PCS for this study.
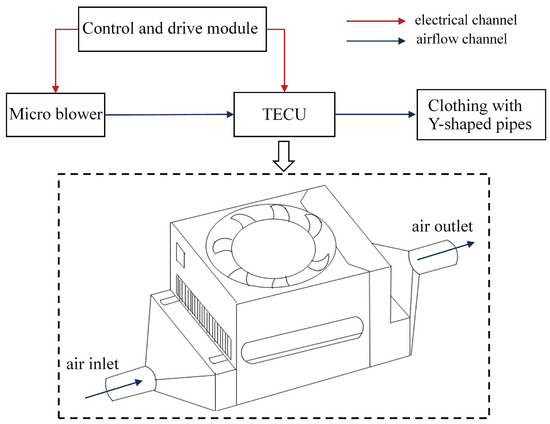
Figure 1.
Diagrammatic sketch of a PCS with a TECU.
The forced airflow generated by the microblower is blown into the special clothing with Y-shaped pipes through the TECU (see Section 5 for the physical connection diagram). In this procedure, cold airflow formed by the cold side of the TEM helps the human body achieve comfort. The TECU is the core component that is housed in a 3D-printed plastic casing, as shown in the ➅ part of the testing platform figure in Section 5.1. The TECU in Figure 1 includes from top to bottom: a hot-side fan, a hot-side heat sink, a TEM (including a hot-side ceramic substrate, a semiconductor thermocouple and a cold-side ceramic substrate) and a cold-side heat sink; from left to right, it includes: an air inlet, a heat exchange in the TECU and air outlet. Figure 2 shows the schematic diagram of a TEM with heat sinks inside the TECU package. The red-dashed rectangle contains a heat sink and a ceramic substrate at the cold side. The blue arrow points out the airflow direction. For the TEM, the heat balance equations can be found in various papers [16,17,18,24]. The heat absorbed on the cold side () and the heat released on the hot side () of the thermoelectric module can be described as follows:
where I is the input current. and are the cold and hot side temperatures, and , and are the Seebeck coefficient, the electric resistance and the thermal conductance of the TEM, respectively. The input power (P) and coefficient of cooling performance (COPc) are given as:
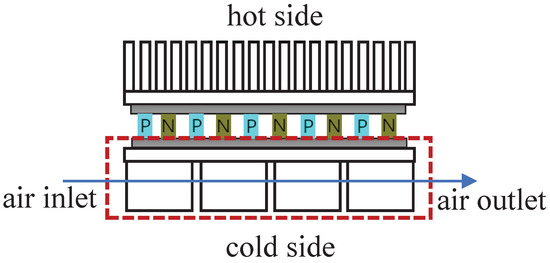
Figure 2.
Schematic diagram of a TEM with heat sinks inside the TECU package.
From Equations (1)–(4), we can obtain that and decrease with increasing temperature difference between the cold and hot sides if is constant. Moreover, the COPc also decreases with increasing the temperature difference for a given current.
In practice, to decrease the cold-side temperature, heat dissipation for the hot side is conducted using a heat sink and a cooling fan. For the cold side, the cooled airflow is delivered to the human body at a certain velocity. Considering that the cold-side heat exchange significantly affects personal thermal comfort, we summarized the determination of the cold-side heat sink’s structural parameters as an optimization problem.
To simplify the optimization process, a simulation model is established which only contains components in the red-dashed rectangle. Because the temperature at the cold-side substrate can be adjusted according to the input voltage, the above simplification for the TECU is reasonable. Figure 3a shows the simplified cold-side simulation model. The heat exchange cavity has a symmetrical structure. Airflow enters from the air inlet, exchanges heat in the cavity and then flows out from the outlet. A basic four-column plate-fin copper heat sink is selected for the optimization. Analysis indicates that the structural parameters such as the number of fin rows, fin thickness, fin spacing, etc., have great influence on the temperature and velocity of the outlet airflow. Figure 3b gives a schematic diagram of the structural parameters for the cold-side plate-fin heat sink. In Figure 3b, L and W, respectively, represent the length and width of the heat sink, h represents the height of the fin, represents the thickness of the base, represents the thickness of the fin and s represents the fin spacing. Note that there is the following constraint relationship between W, , s and the number of fin rows N:
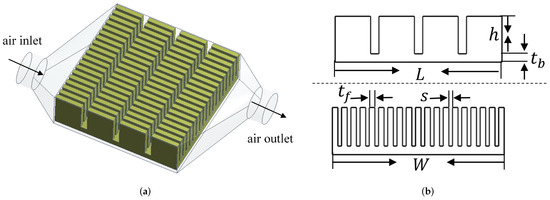
Figure 3.
Simplified simulation model and schematic diagram of heat-sink parameters: (a) simulation model with a cold-side heat sink and a ceramic substrate; (b) schematic diagram of heat-sink structural parameters W, L, h, , and s.
In this paper, we set the minimization of average outlet temperature (T) and the maximization of average outlet airflow velocity (V) as the optimization objectives. Note that both T and V are essential for further human thermal comfort adjustment. Choosing N, , h and as optimization variables, the structural design of the cold-side heat sink can be expressed as the following multiobjective optimization problem:
It is noted that during the optimization process, variables N, , and h should meet some upper and lower bound constraints. These constraints will be provided in Section 4. For the fixed W, once N and are optimized, s can be calculated according to Equation (5). Moreover, the temperature of the cold-side substrate is fixed to 12 C for the next simulation and optimization study. This condition could be achieved at the experimental stage by adjusting the input voltage of the TEM.
3. Simplified CFD Model for Heat Exchange
3.1. Meshing and Boundary Conditions
Figure 4a shows the simulation model for the cold side of a TECU with meshing. The lowest cell quality is 0.11739, and the highest one is 0.99979. The average cell quality is about 0.85713. According to the cell quality and the size of the skewness, the numbers of cells and nodes within the domain are set as 386,211 and 68,947, respectively. Since heat exchange due to radiation accounts for a smaller proportion than that due to convection, it is ignored in this study. The material of the heat sink is selected as copper. The inlet boundary is set as the velocity inlet, and the outlet is the pressure outlet. Other boundaries are set as walls.
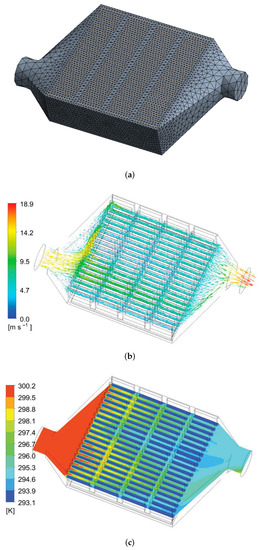
Figure 4.
CFD simulation: (a) simulation model with meshing; (b) airflow velocity distribution at a height of 6 mm; (c) temperature distribution at a height of 6 mm.
3.2. Simulation Settings
In this paper, ANSYS software is used for the simulation and calculation process. Assume that the airflow in the cavity of the TECU has turbulent characteristics. In the turbulent domain, the standard model is employed. In the near-wall domain, the standard wall function method is employed. The pressure–velocity-based coupling equation is solved using a separate solver and the SIMPLE algorithm. The gradient term is calculated based on the least squares method. The first-order upwind is utilized for the turbulent dissipation rate and turbulent kinetic energy. The second-order upwind is utilized for all another terms. If the relative change rate of residual between the maximum momentum and energy is less than the given value , the calculation reaches the convergence condition. Some parameters used in the simulation are given in Table 1.

Table 1.
Parameter settings.
A static simulation on the cold side of TECU is conducted and results are given in Figure 4b,c. It is seen that the simulation is convergent and reliable, which provides an accurate model for the structural optimization design. In this simulation, the structural parameters of the heat sink are randomly selected as: mm, N = 19, = 0.85 mm, h = 10 mm, = 2 mm, s = 1.325 mm. The resulting outlet temperature and airflow velocity (area-weighted average value) are about 294.6 K (21.5 C) and 15.6 m/s, respectively.
4. Structural Optimization of the Heat Sink
4.1. Optimization Steps Based on a MOGA
The first MOGA, which was called vector-evaluated GA, can be traced back to 1989 [25]. Then, another MOGA based on nondominated sorting (NSGA) was proposed by Srinivas and Deb [26]. An improved NSGA (NSGA-II) was provided by Deb et al. [27,28]. Simulation results demonstrated that the NSGA-II could obtain a much better spread of solutions and better convergence performance near the Pareto-optimal front than some comparison algorithms [28]. The MOGA utilized in this study is a hybrid variant of the traditional NSGA-II using controlled elitism concepts. The Pareto-ranking scheme is performed by a fast, nondominated sorting approach [29,30]. Note that the utilized MOGA supports both continuous optimization (, , h) and discrete optimization (N) in this study. The following steps are included in the parameter optimization process:
Step 1. Establishment of a CFD model. It includes building a heat-dissipation geometric model, setting model parameters and boundary conditions, verifying model accuracy, etc. (see Section 3 for details).
Step 2. Parameter optimization based on a MOGA. It includes determining the optimization variables and objectives, generating the initial population, calculating fitness values based on the CFD simulation, generating new populations via crossover and mutation and performing iteration operations until convergence or stopping criteria are met to obtain candidate points. Figure 5 shows the flow chart of parameter optimization based on MOGA.
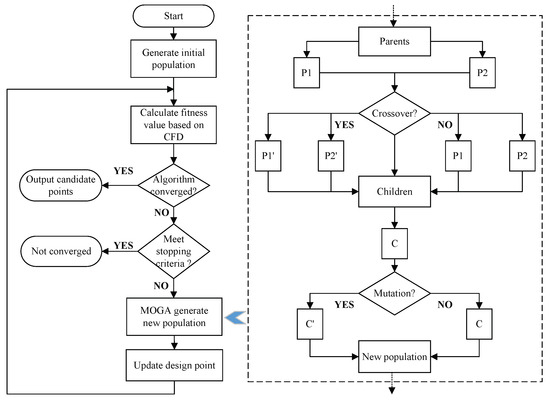
Figure 5.
Flow chart of parameter optimization based on a MOGA.
Step 3. Performance test for candidate points. Test the performance of candidate points using a full CFD simulation. On this basis, the representative heat sinks are customized for the experimental test.
4.2. Optimization Results and Analysis
For the hot side, a reasonable selection of heat sink is made through experiments. The input voltage of the TEM and the speed of the cooling fan are fixed. The experiments are conducted by choosing various hot-side heat sinks with different structural parameters. The lowest cold-side temperature means the best hot-side heat sink. The final selection is given in Table 2. When ambient temperature is 27 C, adjusting the input voltage to 4.2 V can reduce the cold-side temperature to 8 C in the selected heat sink. The subsequent cold-side structural optimization is based on these fixed hot-side conditions.
Table 2.
Parameter settings of heat sinks.
For the cold side, the MOGA is applied to optimize the structural parameters of the heat sink. T and V are set to meet the following conditions: T≤ 296 K, V≥ 15 m/s. Parameters N, , h and are set as optimization variables. Considering machining precision and portability of the TECU, some constraints are provided in Table 2. L and W are set to fixed values according to the cavity’s size (40 mm × 40 mm). The value/constraint of s in the last column of Table 2 is calculated according to Equation (5). The initial population size is set as 100.
Applying the MOGA to solve the multivariable optimization problem in Formula (6), we obtain the variations of T and V for different N shown in Figure 6. Note that the input domain of the structural optimization in this study is a four-dimensional parameter space (N, , h and ). To clearly show the relationship of T and V with different parameters, we project the optimization results to two-dimensional spaces, as given in Figure 6.
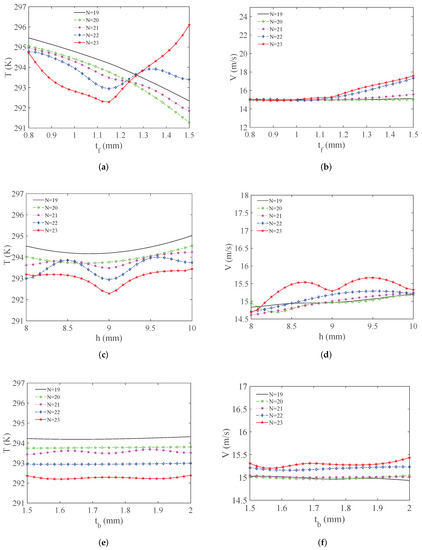
Figure 6.
Variations of T and V for different N: (a) variation of T with ; (b) variation of V with ; (c) variation of T with h; (d) variation of V with h; (e) variation of T with ; (f) variation of V with .
For h = 9 mm and = 1.75 mm, variations of T and V with are given in Figure 6a,b, respectively. From Figure 6, it is known that when N = 19 or 20, there is an approximately linear relationship between T and . The greater is; the lower T is. When N reaches 22 or 23, the curve exhibits obvious nonlinear characteristics. For example, if N is fixed to 23, T reaches the local minimum value when is about 1.15 mm. In addition, when N = 20 and = 1.5 mm, T reaches the minimum value of about 291 K. It can be seen from Figure 6b that V changes little if N = 19 or 20 (all around 15 m/s). If N = 22 or 23, V increases significantly when is larger than 1.2 mm. For = 1.15 mm and = 1.75 mm, variations of T and V with h are given in Figure 6c,d, respectively. If N = 19 or 20, with the change of h, the variation of T is little. If N = 21, 22 or 23, the variation of T is relatively obvious. However, the maximum variation is less than 1K. For , the variation of V is most obvious. This variation may be due to the changes of airflow temperature/pressure at the inlet and outlet. For = 1.15 mm and h = 9 mm, variations of T and V with are given in Figure 6e,f, respectively. It can be seen that the influence of on T and V is relatively small.
=1pt =-1pt
Figure 7 shows the local sensitivity of T and V to the structural parameters. It can be seen that when N is small (such as N = 20), has great influence on T. Its sensitivity contribution rate is close to 50%. When N is large (such as N = 22), the influence of on V increases significantly. When N changes, the influence of h on T and V almost remains unchanged. The influence of on T and V is very small. These analysis results are consistent with those obtained from Figure 6a–f.
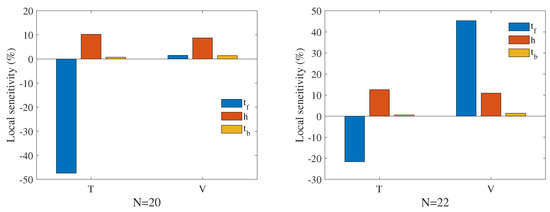
Figure 7.
Local sensitivity of T and V to structural parameters.
Figure 8 and Figure 9, respectively, show behaviors of T and V as functions of and h (N = 20 or N = 22, ). It is known that if N = 20, T reaches its minimum when = 1.4 mm and h = 9 mm. V is less affected by and h. If N = 22, the influence of h on T presents different effects with different . Taking = 1.2 mm as an example, T reaches its local minimum when h is approximately between 8mm and 9 mm. Moreover, if N = 22, V is less affected by h while more affected by .
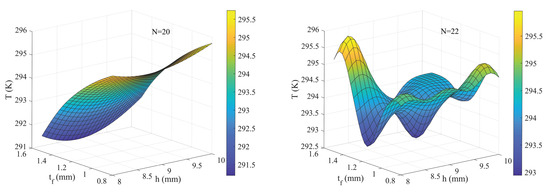
Figure 8.
Behavior of T as function of and h.
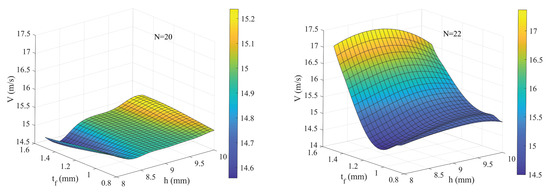
Figure 9.
Behavior of V as function of and h.
After the MOGA-based structural optimization, taking both the outlet airflow temperature and velocity into consideration, one of the candidate points is chosen (N = 22, = 1.4 mm, h = 9.5 mm, = 1.5 mm, s = 0.44 mm). A full ANSYS-based CFD simulation is performed using this candidate point. Figure 10 shows the simulation results. It is calculated that the average outlet temperature decreases about 6.5 C compared with the inlet temperature (27 C). Compared with the unoptimized heat sink in Section 4, the average outlet temperature with the optimized one decreases about 1.0 C (4.7%) and airflow velocity increases about 0.8 m/s (5.1%).
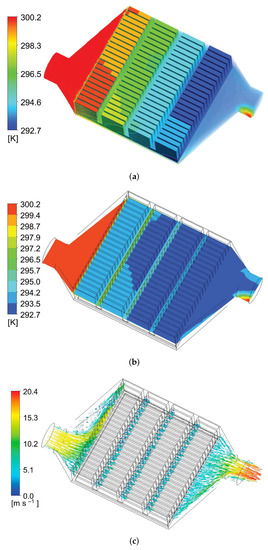
Figure 10.
CFD simulation effects for candidate point: (a) temperature distribution inside the cavity; (b) temperature distribution at the height of 6 mm; (c) airflow velocity distribution at the height of 6 mm.
However, it should also be noted that the optimization results are based on a simplified simulation model, and there are several assumptions and hypothesis as follows:
- *
- The optimization is performed under the conditions of a fixed cold-side substrate temperature, inlet airflow temperature and inlet airflow velocity (see Table 1).
- *
- Additional thermal effects, such as air density variation, radiant heat transfer, phase change heat transfer, etc., are neglected.
- *
- The cavity of the simulation model is completely enclosed. However, the actual assembled model inevitably has the phenomenon of air leakage, which leads to the error of the airflow velocity.
Considering the above factors, we designed a set of experiments based on the simulation results to verify the optimization performance.
5. Experimental Tests
5.1. Testing Platform for the TECU
To test the structural optimization effect, the corresponding experimental platform was built. The TECU was housed in a 3D-printed plastic casing as introduced in Section 2. The detailed packaging structure consisted of the air inlet part, the main body part and the the air outlet part. The physical TECU casing and the overall testing platform are shown in Figure 11 (the TECU casing is marked with a 6). In this physical picture, a microblower (WM7040, China) generates the forced airflow to the TECU. A low-power cooling fan (DELTA AFB0412SHB, China) was used for the hot-side heat dissipation. The input voltage for the TEM (TEC-12710, China) and the inlet airflow velocity could be adjusted by the Arduino-based control module. The outlet temperature and airflow velocity were measured by an anemometer (HCJYET HT-8398, China). The accuracy of the stemperature and velocity measurement were ±1 C and 1% + 1d (full scale), respectively.
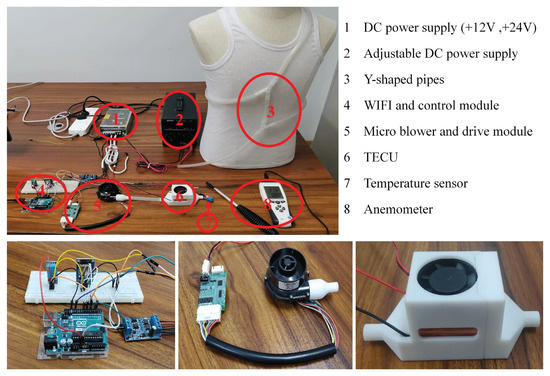
Figure 11.
Testing platform for the TECU.
According to the sensitivity analysis in Section 4, the number of rows and the fin thickness of the heat sink have significant influence on the optimization effect. Based on the analysis results and the chosen candidate point (N = 22, = 1.4 mm, h = 9.5 mm, = 1.5 mm), five representative heat sinks were customized by a local mechanical processing factory (shown in Figure 12). The fin height and the base thickness of the customized heat sinks were set as h = 9.5 mm, = 1.5 mm. Other parameters are given in Figure 12 where “Cu” means copper and “AL” means aluminum. It should be pointed out that the aluminum heat sink was not used in the simulation. In this section, it was customized for experimental comparison with the copper one. Figure 13a gives the simulation results of T as a function of for different N (h = 9.5 mm, = 1.5 mm). In Figure 13a, the positions of different parameters for four copper heat sinks are marked with ➀, ➁, ➃ and ➄ as the sequence numbers shown in Figure 12. For verifying the optimization performance, a set of experiments were conducted. Addressing the above five heat sinks, the TECU outlet temperature variation curves were recorded by adjusting the cold-side temperature of the TEM (shown in Figure 13b). For each heat sink, five different cold-side temperatures (10 C, 12 C, 14 C, 16 C and 18 C) were set by adjusting the input voltage for the TEM. The average of three measured outlet temperatures were recorded for each heat sink. In Figure 13b, represents the experimental outlet airflow temperature. represents the cold-side temperature of the TEM (measured on the cold-side ceramic substrate).
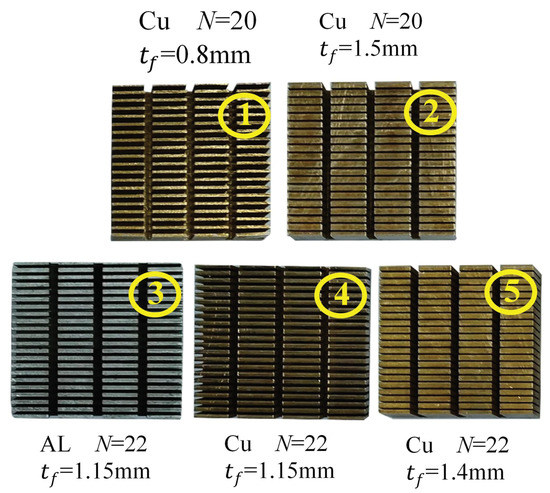
Figure 12.
Five customized heat sinks.
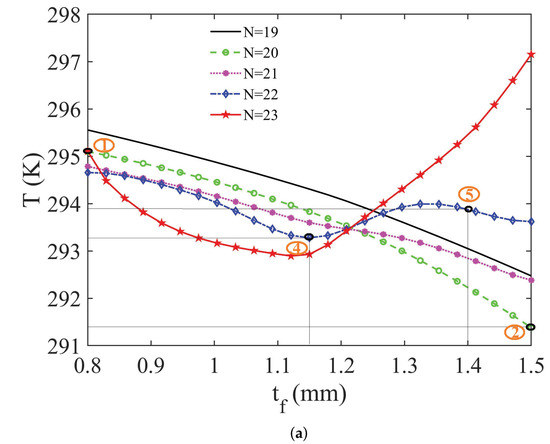
Figure 13.
Variations of outlet temperature: (a) simulation results of outlet temperature as a function of for different N (the cold-side temperature of the TEM is fixed to 12 C); (b) experiment results of outlet temperature for different cold-side temperatures of the TEM.
5.2. Experimental Results
From the experiment’s results (Figure 13b), corresponding to the five cold-side temperatures, the outlet temperatures with the No. 2 heat sink (N = 20, = 1.5 mm, Cu) are lowest, outlet temperatures with the No. 1 heat sink (N = 20, = 0.8 mm, Cu) are highest. The outlet temperatures with the No. 5 heat sink (N = 22, = 1.4 mm, Cu) are higher than those with the No. 4 heat sink (N = 22, = 1.15 mm, Cu). According to these experimental results, it is seen that the performance ranking of the four customized heat sinks is consistent with the simulation results (Figure 13a), which demonstrates the effectiveness of the optimization simulation. From the result of the material comparison, the copper heat sink (No. 4) has a better heat exchange effect compared with the aluminum heat sink (No. 3).
The simulation accuracy is also investigated here. The cold-side temperature of the TEM is set to be consistent with the simulation condition (12 C, see Table 1). Taking the No. 5 heat sink as an example, the resulting outlet temperature is measured at 22.1 C. The absolute error is 1.3 C compared with the simulation results (20.8 C, see Figure 13a). For the four copper heat sinks, the maximum temperature error between experimental and simulation results is 2.4 C. The average one is 1.8 C.
Similarly, the inlet airflow velocity is adjusted to be 15m/s, consistent with the simulation condition (see Table 1). This fixed velocity is measured by the same anemometer as the outlet velocity. In addition, taking the No. 5 heat sink as an example, the outlet airflow velocity is measured at 12.8 m/s (average value of three dependent measurements). The absolute error is 3.6 m/s compared with the simulation result of 16.4 m/s. The relatively large error on airflow velocity can be mainly attributed to the following reason: the cold side of the TECU is in a fully enclosed package in the simulation. However, the experimental TECU is assembled with three 3D-printed parts that have air leakage. Moreover, there may be other reasons responsible for the above large error, such as the assumption of constant air density in the simulation and the measurement error of airflow velocity in the experiment.
6. Conclusions
This paper studies the structural optimization of the cold-side plate-fin heat sink for the TECU used in a PCS. Firstly, the heat transfer structure design is summarized as a multiobjective optimization problem. In this problem, four structural parameters of a cold-side heat sink are selected as the optimization variables, and the minimization of a TECU’s outlet temperature and the maximization of outlet velocity are chosen as the optimization objectives. Then, based on the establishment of the cold-side CFD model with the aid of ANSYS software, a MOGA is used to optimize the structural parameters. Simulation results verify that the structural optimization can effectively reduce the outlet temperature and guarantee the outlet airflow velocity. In addition, sensitivity analysis shows that the number of rows and fin thickness have significant influence on the optimization objectives. Finally, experimental tests are carried out to demonstrate the effectiveness and applicability of the proposed structural optimization method. From the simulation results, the TECU’s average outlet temperature with optimized heat sink decreases about 1.0 C (4.7%), and the outlet velocity increases about 0.8 m/s (5.1%) compared with the unoptimized one. Experimental results on the outlet temperature of four customized heat sinks are consistent with the simulation results (average value: 20.3 C). The maximum and average temperature errors between experiment and simulation are 2.4 C and 1.8 C, respectively. In our future work, the air-tightness of the TECU will be further improved to reduce the outlet airflow velocity loss. The TECU-based PCS will be constructed and its performance will also be investigated.
Author Contributions
Conceptualization, G.T.; methodology, W.X.; software, X.C. and Z.L.; formal analysis, X.C.; data curation, X.C.; writing—original draft preparation, W.X.; writing—review and editing, G.Z.; supervision, K.L.; funding acquisition, K.L. All authors have read and agreed to the published version of the manuscript.
Funding
This work is supported by National Natural Science Foundation of China under Grant No. 61873114; “Six Talent Peaks” Program of Jiangsu Province under Grant No. JZ-053 and Jiangsu University Research Foundation for Talented Scholars under Grant No. 14JDG168.
Institutional Review Board Statement
Not applicable.
Informed Consent Statement
Not applicable.
Data Availability Statement
The data that support the findings of this study are available from the corresponding author upon reasonable request.
Conflicts of Interest
The authors declare that they have no conflict of interest.
Nomenclature
| ASHRAE | American society of heating, refrigerating and air-conditioning engineers |
| TEM | thermoelectric module |
| TECU | thermoelectric conversion unit |
| CFD | computational fluid dynamics |
| PCS | personal comfort system |
| MOGA | multiobjective genetic algorithm |
| HVAC | heating, ventilation and air-conditioning |
| COP | coefficient of performance |
| COPc | coefficient of cooling performance |
| heat absorbed on the cold side, W | |
| heat released on the hot side, W | |
| I | electric current, A |
| cold-side temperature, K | |
| hot-side temperature, K | |
| seebeck coefficient | |
| R | electric resistance, |
| K | thermal conductance, W/m·K |
| P | input power, W |
| T | average outlet temperature, K |
| V | average outlet airflow velocity, m/s |
| W | width of heat sink, mm |
| L | length of heat sink, mm |
| N | number of fin rows |
| thickness of base, mm | |
| thickness of fin, mm | |
| h | height of fin, mm |
| s | spacing between fins, mm |
| generic variable | |
| diffusion coefficient | |
| generalized source term |
References
- Liu, Y.; Yan, H.; Lam, J. Thermal comfort and building energy consumption implications—A review. Appl. Energy 2014, 115, 164–173. [Google Scholar]
- Chaudhuri, T.; Soh, Y.C.; Li, H.; Xie, L. A feedforward neural network based indoor-climate control framework for thermal comfort and energy saving in buildings. Appl. Energy 2019, 248, 44–53. [Google Scholar] [CrossRef]
- Huang, Y.; Niu, J.L. A review of the advance of HVAC technologies as witnessed in ENB publications in the period from 1987 to 2014. Energy Build. 2016, 130, 33–45. [Google Scholar] [CrossRef]
- Ashrant, A.; Burcin, B.G. Energy Consequences of Comfort-driven Temperature Setpoints in Office Buildings. Energy Build. 2018, 177, 33–46. [Google Scholar]
- Kim, J.; Schiavon, S.; Brager, G. Personal comfort models–A new paradigm in thermal comfort for occupant-centric environmental control. Build. Environ. 2018, 132, 114–124. [Google Scholar] [CrossRef] [Green Version]
- Taub, M.L. Power to the People: Personal Control in Offices for Thermal comfort and ENERGY Savings. Master’s Thesis, University of California, Berkeley, CA, USA, 2013. [Google Scholar]
- Lassen, N. Case study of personal heaters in a Plus energy building—Simulations of potential energy savings and results from a field test. IOP Conf. Ser. Earth Environ. Sci. 2019, 352, 012051. [Google Scholar] [CrossRef]
- Vesely, M.; Molenaar, P.; Vos, M.; Li, R.; Zeiler, W. Personalized heating–Comparison of heaters and control modes. Build. Environ. 2016, 112, 223–232. [Google Scholar] [CrossRef] [Green Version]
- Rawal, R.; Schweiker, M.; Kazanci, O.B.; Vardhan, V.; Lin, D. Personal Comfort Systems: A review on comfort, energy, and economics. Energy Build. 2020, 214, 109858. [Google Scholar] [CrossRef]
- Zhao, D.; Lu, X.; Fan, T.; Wu, Y.S.; Lou, L.; Wang, Q.; Fan, J.; Yang, R. Personal thermal management using portable thermoelectrics for potential building energy saving. Appl. Energy 2018, 218, 280–291. [Google Scholar] [CrossRef]
- Ma, Z.; Zhao, D.; She, C. Personal Thermal Management Techniques for Thermal Comfort and Building Energy Saving. Mater. Today Phys. 2021, 20, 100465. [Google Scholar] [CrossRef]
- Lou, L.; Shou, D.; Park, H.; Zhao, D.; Fan, J. Thermoelectric air conditioning undergarment for personal thermal management and HVAC energy saving. Energy Build. 2020, 226, 110374. [Google Scholar] [CrossRef]
- Wang, Z.; Warren, K.; Luo, M.; He, X.; Smith, M.J. Evaluating the comfort of thermally dynamic wearable devices. Build. Environ. 2019, 167, 106443. [Google Scholar] [CrossRef]
- Hong, S.A.G.; Seo, J.K.; Wang, J.; Liu, P.; Meng, Y.S.; Xu, S.; Chen, R. Wearable thermoelectrics for personalized thermoregulation. Sci. Adv. 2019, 5, eaaw0536. [Google Scholar] [CrossRef] [Green Version]
- Ga, L.; Zhang, Z.; Xu, D. Performance of thermoelectric conversion device with power management module based on shallow soil-air temperature difference. Case Stud. Therm. Eng. 2021, 28, 101582. [Google Scholar] [CrossRef]
- Zhao, D.; Tan, G. A review of thermoelectric cooling: Materials, modeling and applications. Appl. Therm. Eng. 2014, 66, 15–24. [Google Scholar] [CrossRef]
- Seo, Y.M.; Ha, M.Y.; Park, S.H.; Lee, G.H.; Kim, Y.S.; Park, Y.G. A numerical study on the performance of the thermoelectric module with different heat sink shapes. Appl. Therm. Eng. 2017, 128, 1082–1094. [Google Scholar] [CrossRef]
- Zhou, Y.; Yu, J. Design optimization of thermoelectric cooling systems for applications in electronic devices. Int. J. Refrig. 2012, 35, 1139–1144. [Google Scholar] [CrossRef]
- Lin, Z.; Tan, H.; Yu, J. Analysis on optimal heat exchanger size of thermoelectric cooler for electronic cooling applications. Energy Convers. Manag. 2013, 76, 685–690. [Google Scholar]
- Zhu, L.; Yu, J. Optimization of heat sink of thermoelectric cooler using entropy generation analysis. Int. J. Therm. Sci. 2017, 118, 168–175. [Google Scholar] [CrossRef]
- Yu, X.A.; Zl, A.J.A. Man-portable cooling garment with cold liquid circulation based on thermoelectric refrigeration. Appl. Therm. Eng. 2021, 200, 117730. [Google Scholar]
- Chen, L.; Liu, R.; Shi, X. Design and fabrication of thermoelectric devices. In Thermoelectric Materials and Devices; Elsevier: Amsterdam, The Netherlands, 2021; pp. 221–267. [Google Scholar] [CrossRef]
- Ranjbar, B.; Mehrpooya, M.; Marefati, M. Parametric design and performance evaluation of a novel solar assisted thermionic generator and thermoelectric device hybrid system. Renew. Energy 2021, 164, 194–210. [Google Scholar] [CrossRef]
- Min, C.; Snyder, G.J. Analytical and numerical parameter extraction for compact modeling of thermoelectric coolers. Int. J. Heat Mass Transf. 2013, 60, 689–699. [Google Scholar]
- Schaffer, J.D. Multiple Objective Optimization with Vector Evaluated Genetic Algorithms. In Proceedings of the International Conference on Genetic Algorithm and Their Applications, Pittsburg, PA, USA, 24–26 July 1985; pp. 93–100. [Google Scholar]
- Srinivas, N.; Deb, K. Multiobjective Optimization Using Nondominated Sorting in Genetic Algorithms. Evol. Comput. 1994, 2, 1301–1308. [Google Scholar] [CrossRef]
- Deb, K.; Goel, T. Controlled Elitist Non-dominated Sorting Genetic Algorithms for Better Convergence. In Proceedings of the First International Conference on Evolutionary Multi-Criterion Optimization, Zurich, Switzerland, 7–9 March 2001; pp. 385–399. [Google Scholar]
- Deb, K.; Pratap, A.; Agarwal, S.; Meyarivan, T. A fast and elitist multiobjective genetic algorithm: NSGA-II. IEEE Trans. Evol. Comput. 2002, 6, 182–197. [Google Scholar] [CrossRef] [Green Version]
- Konak, A.; Coit, D.W.; Smith, A.E. Multi-objective optimization using genetic algorithms: A tutorial. Reliab. Eng. Syst. Saf. 2006, 91, 992–1007. [Google Scholar] [CrossRef]
- Park, S.K.; Lee, S.B.; Lee, W.C. Goal-Pareto based NSGA-II Algorithm for Multiobjective Optimization. J. Korean Inst. Commun. Inf. Sci. 2007, 32, 1079–1085. [Google Scholar]
Publisher’s Note: MDPI stays neutral with regard to jurisdictional claims in published maps and institutional affiliations. |
© 2022 by the authors. Licensee MDPI, Basel, Switzerland. This article is an open access article distributed under the terms and conditions of the Creative Commons Attribution (CC BY) license (https://creativecommons.org/licenses/by/4.0/).