Abstract
As part of the RFCS project, which aimed to improve transport safety in mines, ITG KOMAG proposed a system for monitoring loads and geometric of arch support. The system’s function is to control safety, mainly during suspended monorail runs. This paper presents a hardware model and a measurement method based on the use of vibrating wire strain gauges and draw-wire sensors. The challenge was to properly adapt the vibrating wire strain gauge operation to the requirements of the ATEX directive on the safe use of electrical equipment in underground mines. The signal transducer algorithm and potential mounting locations for the proposed sensors were discussed. The results of tests carried out using the ŁP arc support are presented, reflecting the actual behavior of the casing during loading in accordance with the test methodology proposed by the Central Mining Institute. In order to compare the results with another measurement method, film strain gauges were additionally applied. The results confirm the usefulness of the proposed method for testing in real conditions. The speed and simplicity of installation of vibrating wire strain gauges provides an advantage over the use of film strain gauges, which are very difficult to install in underground conditions.
1. Introduction
Coordinated by KOMAG Institute of Mining Technology (ITG KOMAG) and financed by RFCS (Research Fund for Coal and Steel) the INESI project (Increase Efficiency and Safety Improvement In Underground Mining Transportation Routes) aims to improve work efficiency and crew safety in underground hard coal mines. One of the main objectives of the project is to increase speed while improving safety in underground mining transport. Increasing the speed of suspended trains is related to the necessity of developing an effective braking system [1,2] and monitoring transport routes.
Monitoring of engineering structures is a very important issue, both in terms of proper functioning of the monitored object, as well as safety of use and impact on the environment. Safety issues are especially important in the case of mining infrastructure. Science is constantly trying to improve technical solutions, proposing the introduction of new technologies to monitoring, such as IoT (Internet of Thing) [3,4], artificial intelligence (e.g., machine learning) [5,6].
In publication [7], the authors present a system for monitoring lateral wall deflection in a mine based on strain measurement, by means of designed components using film strain gauge bridges. Based on tests, it is shown that the accuracy and resolution of the proposed method is sufficient for this type of measurement. The designed system is widely applicable to provide up-to-date data for safety assessment to prevent unexpected destruction of underground excavations as well as other engineering structures.
There are already known ways of monitoring the geometry of powered roof support geometry. The publications [8,9] presents the results of testing the geometry system of mechanized support sections using inclinometers, which were made in accordance with the requirements of the ATEX directive. One of the challenges related to controlling and monitoring parameters of powered roof support section is mapping its geometry and mutual arrangement of individual elements. Tests of the system were carried out on a real object in laboratory conditions. Test results will be used during implementation of the system in real conditions.
In the case of arch supports in mine tunnels with suspended monorails, the need for continuous monitoring has not been noted to date. Measurements of tunnel dimensions are made by qualified personnel only during tunnel construction and are intended to ensure proper routing of the excavation. Increasing the speed of suspended monorail in mines forces monitoring of the geometry and loading of the supports, as deformation of the supports can cause deformation of the monorail track and create a risk of accident. In addition, the increased speed of the train itself can cause a change in geometry, such as when clamps are already at the limit of the loads that can cause the support to slide and lower.
The project proposed a measuring system, dedicated to roadway support, the idea of which is presented in Figure 1 [10].
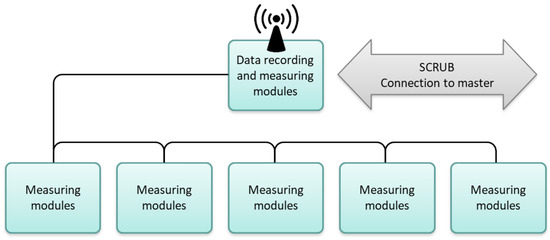
Figure 1.
Structure of measuring system [10].
The monitoring system consists of multiple identical measurement modules connected in series. Each measuring module is equipped with draw-wire sensors and vibrating wire strain gauges. The information is successively transferred from one module to another, and at the end of the line it is collected by the recording module. This topology minimizes the amount of wiring needed and, in the case of a wireless solution, allows the monitoring system to extend its range. The collected data is read by an external computer system, from one module. The hardware module is supported by software designed to record, analyze measurement data and generate warnings about the risks associated with the deformation of the route of the train, based on the developed expert module. The change of the geometry of the roadway supports, caused by the slides on the clamps and by the abnormal load, can cause the lowering of the suspension and as a result the change of the angle between the rail sections, on which the monorail moves. Permissible values of sling lowering are included in technical conditions for suspended monorails.
KOMAG developed the concept of the measuring system, which was presented in detail in an earlier publication [10]. During the development of the concept, modifications were introduced, consisting in changing the location of the vibrating wire strain gauges (Figure 2).
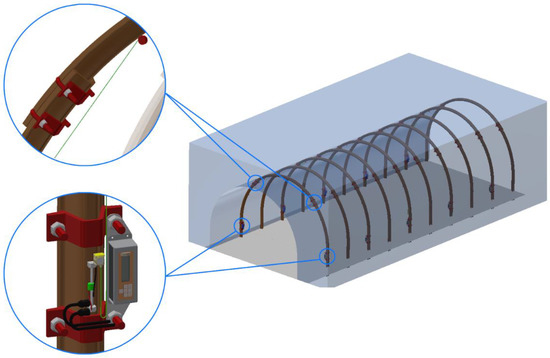
Figure 2.
Concept of installation measuring modules.
The concept is to use two measuring modules (on both sides of the arc case). Directly at each module, vibrating wire strain gauge is attached (by gluing) to the profile. The sensor is additionally protected by a shield and, if necessary, can be protected by filling it with resin. The draw-wire sensor will be built in the same shield, and the measuring wire will be attached to another part, allowing the displacement measurement between the parts of the roadway support.
The aim of the research was to verify the proposed measuring method a vibrating wire strain gauges and to verify the work of the measuring module. The verification of the measurement method is based on the comparison of the results obtained from the measurements by two methods—vibrating wire strain gauges and film strain gauges. Film strain gauges are commonly used to measure strain in monitoring different engineering structures [11,12]. In industry, they are often used as main measurement systems, while in scientific publications it is common to find the use of strain gauges as a reference source [13,14].
The following sections present the proposed measurement method, describe the construction of the hardware model of the measurement module, discuss the principles of determining the load from the wire vibration frequency, and present and analyze the test results.
2. Materials and Methods
2.1. Measuring Method
The arch support monitoring system is based on a proprietary measurement method, consisting of simultaneous measurement of slide on the support locks (with the use of linear sensors) and on assessment of loads in structure of the roadway. Such a solution makes it possible to assess the dynamics of geometry changes and to predict them. The prediction is possible by comparing the current slide and load values and relating them to the values declared by the manufacturers and designers of support systems, which are additionally verified during testing of casings conducted at the Central Mining Institute on a dedicated test stand.
As a result of market analysis, it was decided that transducers with vibrating wire strain gauges will be used to measure the deformation of the arch support (Figure 3) [15]. Vibrating wire strain gauges have many advantages, including a reasonable price, easy to install and the manufacturer’s declared operating time of 25 years [16,17]. The construction of such transducers enables their application in difficult environmental conditions. The use of vibrating wire strain gauges is not the most convenient solution, especially for mining. Nevertheless, assuming that for monitoring overhead rail routes, sensors should be mounted at most every few arcs support, this method seems to be the most advantageous. The use of foil strain gauges would require precision cleaning of the steel. It would probably require the use of power tools, the use of which is severely limited in mine conditions. The easiest solution would be to use force sensors. Unfortunately, market solutions that are approved for use in mines are very expensive. Assuming a large number of necessary sensors, the estimated price of the monitoring system caused rejection of this solution after initial concepts.
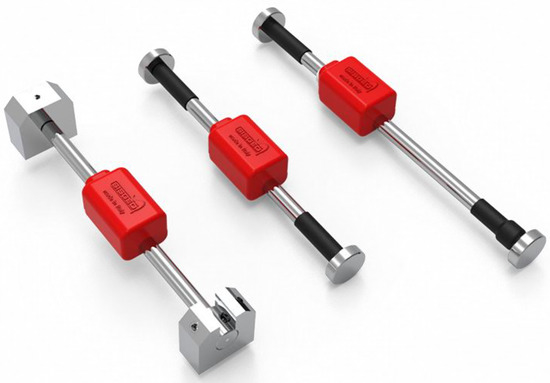
Figure 3.
Example of vibrating wire strain gauges [15].
Adaptation to the requirements of the ATEX Directive can be realized by protecting the transducer with a resin and connecting it to an intrinsically safe power supply system [18]. Moreover, an important advantage of these transducers is the linear characteristic of wire vibration depending on deformations, confirmed in [10].
The principle of operation of vibrating wire strain gauges is presented in Figure 4. The vibrating steel wire, stretched between two mounting points, is excited by a magnetic field, generated by coil. A change in the distance between the mounting points of the wire causes a change in the frequency of its natural vibrations. The vibrations are detected by the measuring system and then converted into microstrain of the material on which the wires are mounted.
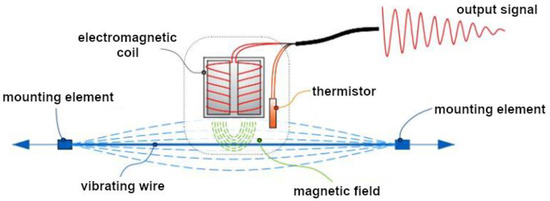
Figure 4.
Principle of operation of transducers with a vibrating wire strain gauge [19].
The data processing is based on formulae (1) and (2) [15]. Knowing the vibrating wire strain gauge constants, provided by the manufacturer, and the vibration frequency of the wire, it is possible to determine the microstrain value. This is a dimensionless value, but it is often expressed in m/m or inch/inch:
where:
- f—vibration frequency of wire [Hz],
- G—measuring constant, provided by the manufacturer in wire strain gauge’s certificate [1/Hz2]. Nominal values for the strain gauge model VK4000 = 4.043.
The follow-up measurements refer to the reference measurement:
where:
Δμε = Li − L0
- L0—reference measurement [με]
- Li—follow-up measurement in [με]
Reference reading (or reference measurement) shall be taken carefully once the installation is performed, after the stabilization and baseline period, and the instrument is in operating conditions. The strain could be used in order to calculate stresses or forces (3), according to Hooke’s law:
where:
σ = ε × E
- σ—stress [MPa]
- ε—deformation [με in μm/m]
- E—elastic modulus of material [MPa]
Finally, it is possible to determinate the force acting on the support in the place of the gauge installationn (4):
where:
F = σ × S
- σ—stress [MPa], equivalent to pressure in [N/mm2]
- F—force [N]
- S—surface of the section [m2]
Relationships (1)–(4) are included in the article in order to present the method of determining the deformation (microstrain), stresses and force acting on the monitored element (in the axis of the sensor). All the relations were used during the conducted research. Relationships (1) and (2) were used to convert the frequency of the vibrating wire to the deformation of the casing arch. Equations (3) and (4) were used to determine the forces acting on the tested section of the profile during preliminary tests in order to verify the obtained deformation values. The results of these tests were presented in another publication [10].
2.2. Hardware Model
Another issue, in the presented monitoring system, is an application of the developed measurement method in conditions of methane and/or coal dust explosion hazard. Therefore, when designing electronic components, the principles of intrinsic safety must be applied. The design of intrinsically safe systems is a very important process due to potential consequences of incorrect selection of devices and incorrect execution of connections between them (loss of intrinsic safety). The method of analysis, evaluation and documentation of intrinsically safe systems, based on the PN-EN 60079-25:2011 (Explosive atmospheres—Part 25: Intrinsically safe systems), should be applied at the stage of designing each system intended for operation in explosion hazard zones. By following the rules outlined in the above mentioned standard, it is possible to obtain the certification that is required in the underground mining industry. The KOMAG Institute of Mining Technology develops mechatronic systems certified under the ATEX Directive [20,21,22].
Ensuring intrinsic safety in electronic systems consists in:
- a proper selection of voltage and current protections in order to maintain certain parameters of the device’s operation,
- designing an electronic system with the selection of elements not exceeding the permitted operating temperatures,
- maintaining adequate insulation distances,
- designing mechanical connections that meet the requirements of non-damageable connections,
- a selection of protective fillers that comply with the ATEX directive standards.
The hardware model has been designed in accordance with the principles of intrinsic safety. The electronic system has been developed at KOMAG by a team of electronics engineers and consulted with experts in intrinsic safety. The main issue was the need to limit the power of the string excitation coil to the value allowed by the ATEX directive (3 W), while obtaining a clean sensor response (vibration frequency). The power supply system was protected against uncontrolled overvoltages by Zener diodes. With this protection, the energy stored in the coil does not allow the ignition of methane gas. In addition, the coil is factory sealed and the sensor cable is shielded.
The preliminary tests, which were discussed in [10], as a confirmation of the measurement method, were conducted with the use of a commercial reader, whose usage in mining conditions would be impossible. Within the framework of the INESI project, a hardware model of the measuring system was developed to process signal from vibrating wire strain gauge. The block diagram is shown in Figure 5.
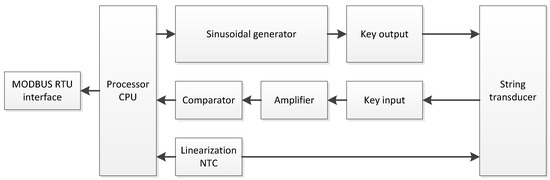
Figure 5.
Block diagram of measuring system based on vibrating wire strain gauge.
The measurement of the wire vibrations is carried out in two stages. First, an excitation by the electromagnet via the output key, installed directly at the wire, causing the wire vibrations are conducted. The electromagnet stimulates the wire with 100 periods of sinusoidal waveform at a specific frequency. After the excitation impulse is generated, the keys are switched and the signal from the electromagnet is amplified by the signal conditioning system. Figure 5 shows a block diagram of the signal processing system of vibrating wire strain gauge. The natural vibration of the wire depends on temperature so the vibrating wire strain gauge is equipped with a temperature sensor. An NTC thermistor is used for the measurement. A linearization system and an ADC converter are used to process the temperature by the measuring system.
To measure the deformation using a vibrating wire strain gauge, it is required to excite the wire to a certain frequency and then read the vibration frequency of the wire after excitation. The algorithm of the transducer operation is shown in Figure 6.
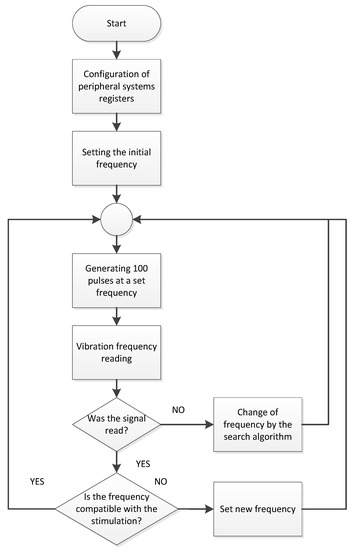
Figure 6.
Wibrating wire strain gauge operating algorithm.
In the first stage the frequency of 1.5 kHz is set. This is the catalog value of the natural frequency of the wire in the unstressed state. The excitation takes the form of 100 periods of sinusoidal waveform. If no frequency response is detected, an algorithm sets successive frequencies, from an array entered into the software. If the frequency of wire vibration is read, a correction is made according to the detected frequency. Read frequency and temperature of the wire are written to registers and then sent to the microcontroller via MODBUS RTU protocol.
Electronic circuits are encased in a hermetic polyester casing with an EX certificate. Figure 7 shows a complete device with handles printed in 3D technology, which is ready for mounting on the frame of the arch support, using standard clamps.
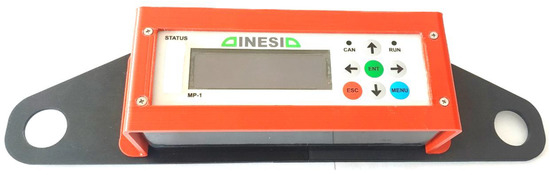
Figure 7.
View of the hardware model prepared for mounting on the support.
The front panel includes a membrane keypad (to operate the device during testing), an LCD display (to present measurement results and messages), and two LEDs, mounted on the main board of the device (to inform the train operator of the device status). Detailed data will be transferred to the aggregation module (at the beginning of the communication line) and then stored on the FLASH memory or sent to the master system. On the rear panel, M12 connectors are provided, to which vibrating wire strain gauge, wire transducers, power supply and communication bus will be connected. The casing will be fixed with a dedicated stainless steel bracket.
The measuring system consists of 3 PCBs with different functionality, connected together (Figure 8):
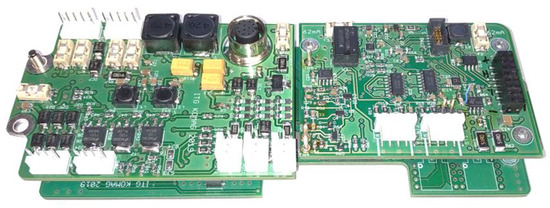
Figure 8.
The hardware model of the measuring device.
- mainboard (bottom), with support of: LCD display, membrane keyboard, wireless communication module, RTC clock, ADC converters for draw-wire sensors,
- power supply board with voltage adjusted to the requirements of the ATEX directive and with energy backup in the form of a supercapacitor (left side),
- vibrating wire strain gauge transducer board (right side).
2.3. Computer Application
The main task of the software supporting the hardware module is to record, analyze measurement data and generate warnings about hazards related to a deformation of the railway route based on the developed proprietary expert system. The main task of the expert system is to predict hazards in a roadway on the basis of developed rules taking into account current measurement results, archival data and requirements included in valid regulations (Figure 9).
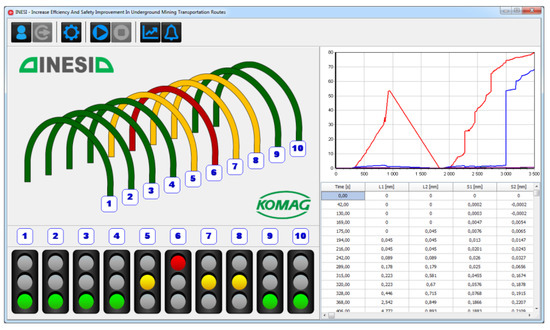
Figure 9.
Main window of software supporting the hardware module.
Within the project realized at KOMAG, the following scope of the software functionality was implemented:
- monitoring the short and long-term trends as well as a prediction of hazards based on the rules of expert system,
- a visualization of present trends,
- logging of users with adequate level of access,
- recording and browsing the archival data,
- modular structure of the software with separation among the results, knowledge and the system data.
3. Results
As part of the INESI project, the developed measurement method was tested. Test measurements of deformations of frame of arch support, type ŁPP10/V29/4/A/I, with the use of vibrating wire strain gauges, were carried out on the test stand of the Central Mining Institute. The testing methodology is based on the PN-G-15000-05:1992 Standard, which defines the method of loading the frame of support, presented in Figure 10. Active and passive forces are applied to the support by hydraulic cylinders, powered from a pumping unit. Asymmetric loads on the support frame can also be applied during the tests, e.g., by independent control of the cylinders [23].
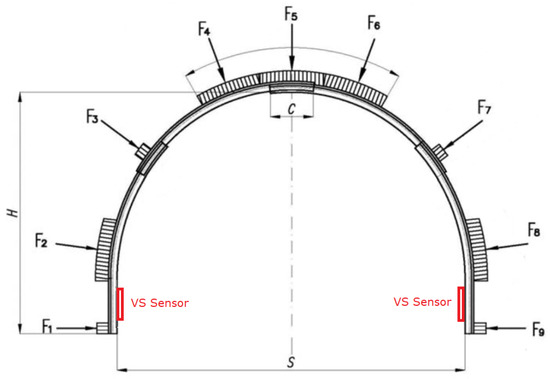
Figure 10.
Diagram of loading ŁPP10/V29/4/A/I arch support frame during stand tests: F4, F5, F6—active forces; F1, F2, F3, F7, F8, F9—reaction forces (so-called passive resistance forces) based on [23].
The arc support consists of several steel arches, connected with friction locks. Until the moment when static friction in the lock is able to counteract the movement of arches (under the pressure acting on the support), the construction works as a rigid support, showing sensitivity to loads only within the limits of elastic deformation of the material. When the forces applied to the support increase and are able to overcome the friction forces in the locks, they are suddenly slipped (Figure 11). The rock mass deformation process is slow, which leads to a load decrease on the support and, at some point, the friction forces in the lock are again able to counteract the displacement. Until the next state of balance is exceeded, the support will operate as rigid [24].
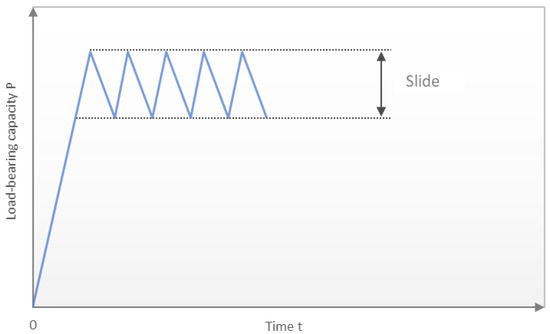
Figure 11.
Roadway support lock operation [24].
Tests were performed on a full-size arc support installed in a test stand. The arch support frame is loaded from the roof side by three hydraulic cylinders. The response from the side wall was mapped using 6 hydraulic cylinders according to the diagram shown in Figure 10. The load applied to the structure is estimated by measuring the pressure in the hydraulic system.
During the measurement, slides were recorded in the joints between the roof arch and the side wall arch, using draw-wire displacement sensors. An additional displacement sensor was provided to measure the extension of the F5 cylinder. The deformation of the profile was recorded using two vibrating wire straining gauges mounted on both sides of the arc support. Sensor data was collected by using a measuring module developed within the project (Figure 12). The measurement module records the frequency of vibration of the measuring wire in the sensor. This value, must be converted to strain, using the relationships, provided by the sensor manufacturer [15].
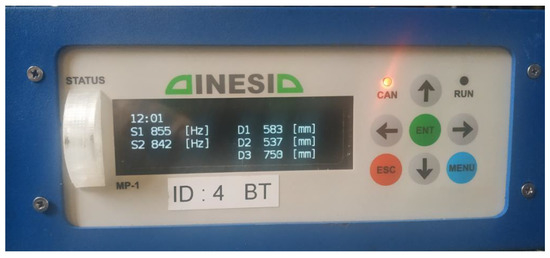
Figure 12.
View of the measuring module during tests.
In order to verify the measurement method, film strain gauges (Figure 13) were additionally applied to the arch of arc support. It is the most common solution for measuring tensile, compressive and stress forces. Resistance film strain gauges are characterized by high sensitivity and accuracy and resistance to vibration and shock. The biggest disadvantage of this solution is their fragile construction (on foil) and the associated difficult and lengthy installation. The use of solutions in the form of force sensors, in turn, is associated with a significant expense, especially in the case of ATEX solutions. Data from strain gauges were recorded with the SPIDER 8 measurements amplifier (0.2% ampli-fier class) and CATMAN EASY software.
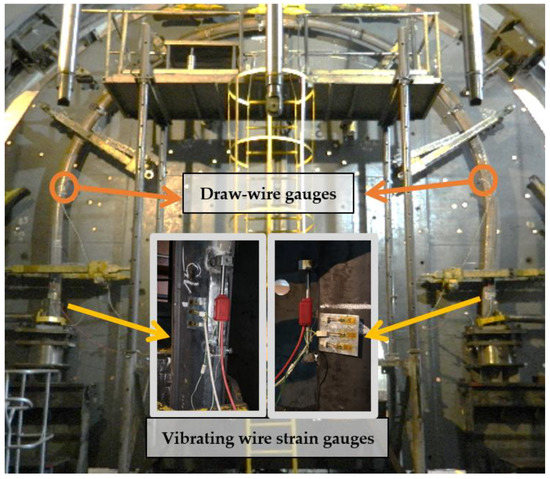
Figure 13.
View of the testing facility.
Correctly designed support for roadways behind the front of longwall will maintain their functionality for the entire intended period of use. During the design of the support for roadways behind the front of longwall, an important issue is to accurately predict the convergence parameters that will occur during the expected service life [24]. Such on approach will permit the choosing of the right size of the roadway support frame. The deformation of roadways makes the mines to carry out reconstruction work. This is the only way to restore the required profile dimensions of a roadway. Reconstruction of roadways is also a time-consuming and costly operation, additionally disrupts the operation of the roadway. In the INESI project, additional factors, influencing the stability of roadway supports, were analyzed, such as the increase of speed of suspended trains.
The place of installation of vibrating wire stain gauge is very important. Preliminary research, conducted using a 30 cm section of the V29 profile, was loaded on a test stand in KOMAG. The vibrating wire strain gauge was mounted by welding the handles on the side of the profile (Figure 14). This location of the sensor was dictated by concern for its mechanical protection.
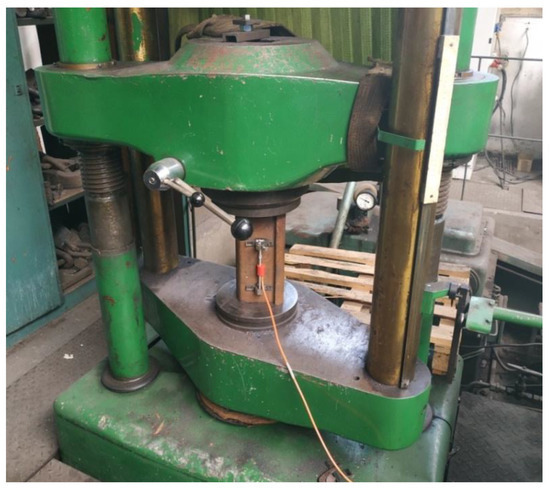
Figure 14.
Preliminary research test stand [10].
During preliminary testing, inconclusive results were recorded with the vibrating wire strain gauge. This could be due to the fact that the profile was not cut perfectly and therefore, there was more load on one of its edges, causing uneven deformation. After preliminary research, the most suitable position for an installation of sensors on the arch surface was selected. Sensors were mounted on the thickest, flat wall of the profile (Figure 15). Such a location of the sensor minimizes the influence of improper conditions, i.e., support the profile on edge, side bending forces, etc.
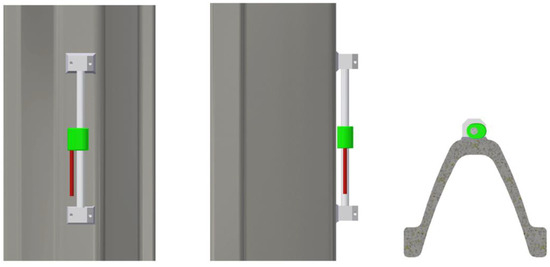
Figure 15.
The section of the V29 profile with wire strain gauge.
In addition to the vibrating wire strain gauges, both sides of the arch support frame were additionally mounted with film strain gauges for a later comparison of results.
The data from the wire strain gauges, recorded during the tests, are compared and presented in Figure 16 and Figure 17, which show that the recorded deformation and slide values are very similar on the joints of the support.
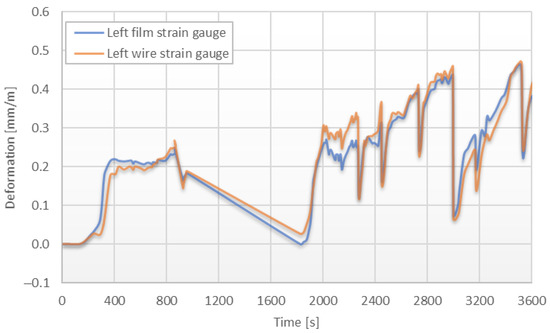
Figure 16.
Results of deformation (left side).
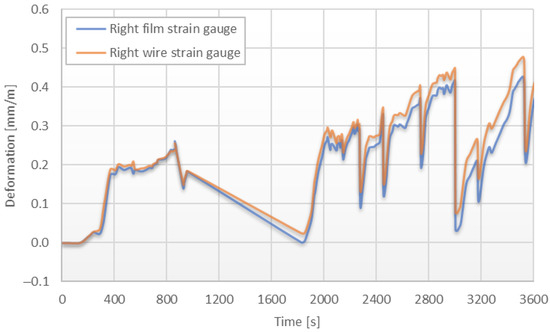
Figure 17.
Results of deformation (right side).
Based on the results of the research mentioned above, a comparative analysis of both measurement methods (i.e., the method of arch support deformation measurement using film strain gauges and vibrating wire strain gauges) was carried out using Spearman correlation and the Bland and Altman method [25].
Figure 18 and Figure 19 show dispersion diagrams with a regression line for selected pairs of variables, i.e., arch support deformation (left and right side of arch) measured by film strain gauges and vibrating wire strain gauges, respectively.
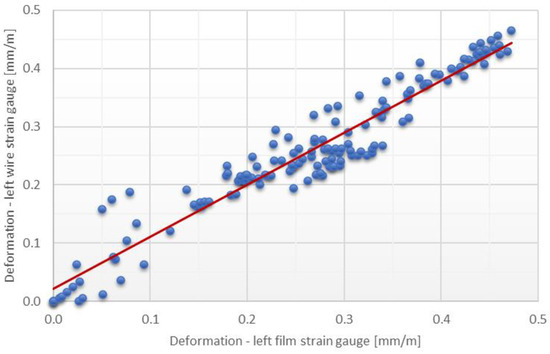
Figure 18.
Scatter plot—relation between deformation measurement film strain gauge and wire strain gauge (left side of arch support frame).
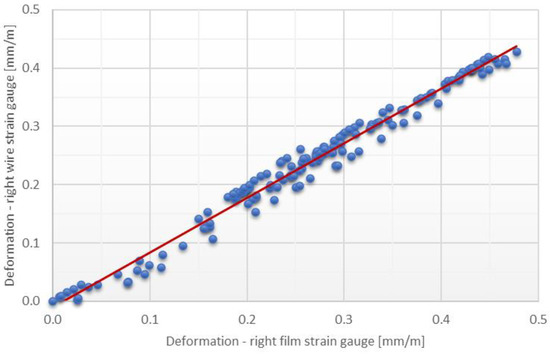
Figure 19.
Scatter plot—relation between deformation measurement film strain gauge and wire strain gauge (left side of arch support frame).
The graphs show a strong positive correlation between the two measurement methods, which is confirmed by the values of the Spearman coefficient. For the data presented, the values of this coefficient are, respectively: R = 0.951 (p < 0.05) (Figure 18) and R = 0.986 (p < 0.05) (Figure 19). The null hypotheses are that the measurements made by the two methods (independently for the left and right side of the arch) are not linearly related. Very small probability values (p-values are less than the significance level α = 0.05) allow us to conclude that measurements with film strain gauges and vibrating wire strain gauges are correlated. However, a high correlation does not mean that the two methods are compatible because R measures the strength of the relationship between two variables, not the compatibility between them. In view of the above, in the next step of the analyses, for the purpose of assessing the differences between the measurement methods, the data obtained were presented in a graph of the difference between the methods in relation to their mean (the so-called Bland-Altman graph). This plot (also known as the Tukey mean difference plot) is most commonly used in chemometrics and biostatistics. It represents the degree of agreement between two different samples or indicators and therefore one of its main applications is the comparison of two clinical indicators, each of which is subject to some measurement error [26,27,28,29]. It can also be used to compare and assess the equivalence of quantitative measurement techniques. The plot of difference against the mean also allows the examination of the possible relationship between the measurement error and the true (real) value. The true value is not known and the average of two measurements is the best estimate that can be obtained. It would be a mistake to plot the difference against either value separately because the difference will be related to each, a well-known statistical artefact.
An assumption of the Bland-Altman limits of agreement is that the differences are normally distributed. Statistical tests have been used to determine if the distribution is normal, since in some cases normality cannot be determined simply by observing the histogram plot (Figure 20 and Figure 21). A test for normal distribution (Kolmogorov-Smirnov test, Shapiro-Wilk test, D’Agostino-Pearson) have been carried out, for the hypothesis that the distribution of the observations in the sample is normal (if p < 0.05 then rejected normality) (Table 1 and Table 2).
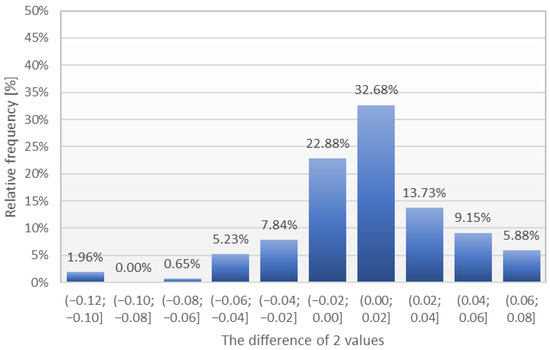
Figure 20.
Distribution plot of differences between measurement by methods (left side of arch support frame).
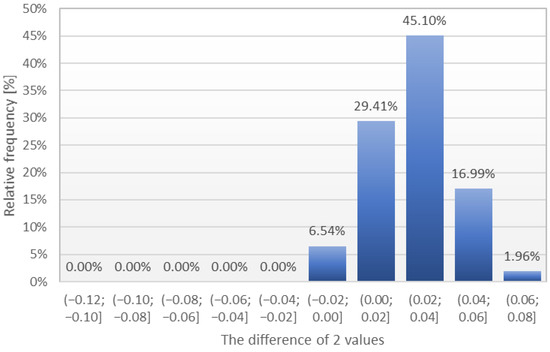
Figure 21.
Distribution plot of differences between measurement by methods (right side of arch support frame).

Table 1.
Statistical tests for normality (left side of arch support frame).
Table 2.
Statistical tests for normality (right side of arch support frame).
Figure 22 shows a comparison of the deformation of the left arch of the support measured by a film strain gauge and with a vibrating wire strain gauge. The mean difference is 0.0064 with 95% confidence interval 0.001 to 0.012. Thus, wire strain gauge tends to give a higher reading, by between 0.001 and 0.012. Despite this, the limits of agreement (−0.0605 and 0.0732) are small enough for us to be confident that the new method can be used in place of the foil strain gauge method. Limits of agreement (LoA) estimate the interval within which a proportion of the differences between measurements lie. Table 3 shows all the Bland and Altman plot statistics.
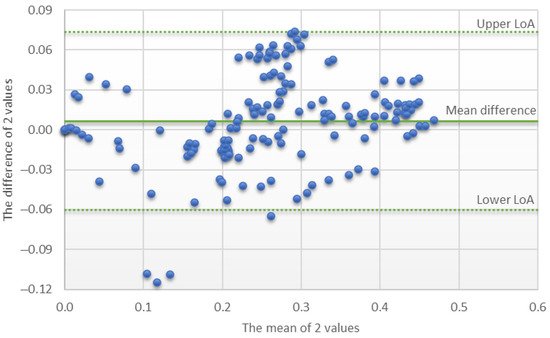
Figure 22.
Bland and Altman plot—agreement between methods (deformation of left side of arch support frame).
Table 3.
Bland and Altman plot statistics (left side of arch support frame).
Figure 21 shows a comparison of the deformation of the right arch of the support measured by a film strain gauge and with a vibrating wire strain gauge. The mean difference is 0.0265 with 95% confidence interval 0.024 to 0.029. Thus, wire strain gauge tends to give a higher reading, by between 0.024 and 0.029. Despite this, the limits of agreement (−0.0073 and 0.0602) are small enough for us to be confident that the new method can be used in place of the foil strain gauge method. Table 4 shows all the Bland and Altman plot statistics.
Table 4.
Bland and Altman plot statistics (right side of arch support frame).
In a Bland and Altman plot system the differences can be also expressed as percentages of the values on the axis. This option is useful when there is an increase in variability of the differences as the magnitude of the measurement increases. Figures 24 and 25 represent the same data as Figure 22 and Figure 23, plotted as percentage of differences. The bias (mean difference) is 5.44% and 17.05%, and it is higher for the very low values. The agreement limits are from −68.35% to 79.22% (Figure 24) and from −41.78% to 75.88% (Figure 25).
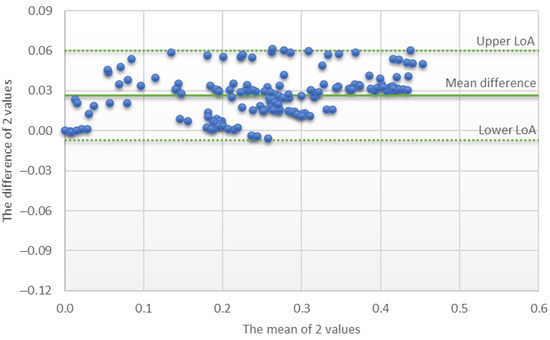
Figure 23.
Bland and Altman plot—agreement between methods (deformation of right side of arch support frame).
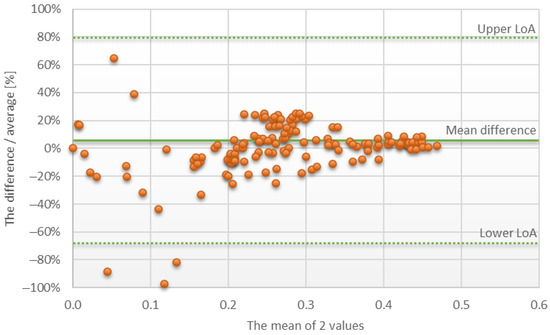
Figure 24.
Plot of differences between methods, expressed as percentages of the values vs. the mean of the two measurements (deformation of left side of arch support frame).
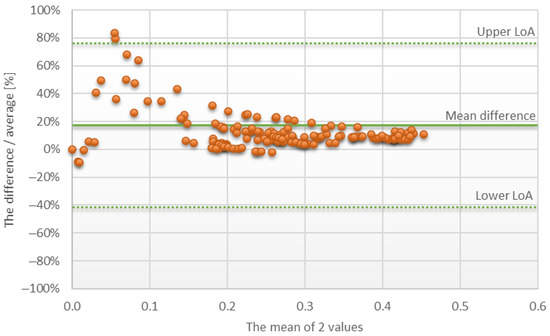
Figure 25.
Plot of differences between methods, expressed as percentages of the values vs. the mean of the two measurements (deformation of right side of arch support frame).
On this basis, it was concluded that the vibrating wire sensors can be used to assess the change of the roadway support load (Table 5).
Table 5.
Bland Altman and Spearman correlation coefficient of the values of deformation by different methods.
An estimation of the support geometry requires a measurement of the friction lock slide. Figure 26 shows the time waveforms of the slide values, recorded by draw-wire sensors, which are placed on both sides of the support in front of the locks in such a way that the wire runs from the sensor to the anchorage point behind the lock. The third sensor was mounted on a stand and measured the extension of the main load actuator.
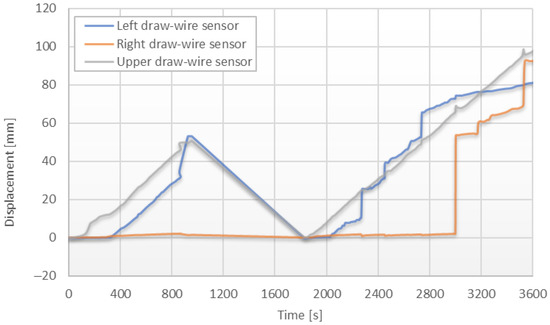
Figure 26.
Results of displacement measurements with use of draw-wire sensors (the second step of tests).
The displacements between arch support parts due to slides during testing can be seen in Figure 27.
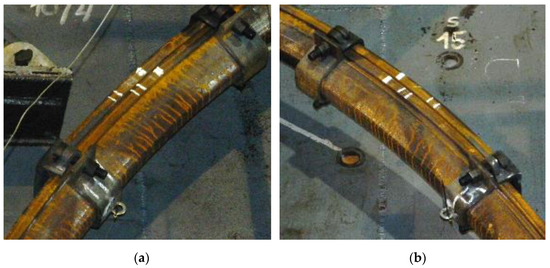
Figure 27.
Slide on the support’s frame joints: left side (a), right side (b).
Displacements can in reality be much larger, which will lower arc support by up to several tens of centimeters.
4. Discussion
The research and analysis of the test results achieved during the project allows to conclude that the vibrating wire strain gauges, which are increasingly used to monitor structures, can be used to measure the deformation of the arch support. The results obtained from vibrating wire strain gauges and film strain gauges are similar. In the case of tests carried out in-situ, it is important to take into account the difficulties that may occur on a larger scale.
The measurement of the sliding distance between the elements of the support with the use of vibrating wire strain gauges, applied in the target measurement system, allowing the estimation of the changes in the support geometry. Collected data enable the analysis of possibility of mounting the vibrating wire strain gauges on the support installed in the roadway, which already shows some signs of deformation. Moreover, the results, achieved during the tests, are a valuable contribution to the expert system, which will be used to assess the operating conditions of the support in terms of increasing the speed of suspended trains.
Due to the way the roadway support is operated and the elastic and plastic deformations occur in it, a determination of the exact geometry of the support in real conditions is an impossible task. However, the aim of INESI project is not so much to measure the geometry accurately but to alert that the slide has occurred or (basing on the load measurement) may occur soon. This makes it possible to send information to the train operator that there may be obstacles on the route.
Directions for further work should focus on teaching the expert system using results from tests of different types of arch support, under different loading conditions (static and dynamic). Currently, the final results during testing were converted from measured values of wire vibration. It is planned to implement into the software an automatic conversion of vibration frequency, to deformations and forces acting in the arch support structure. This will make it possible to directly analyze current results and compare them with reference data and generate appropriate warnings or alarm conditions.
In the process of work, important knowledge was acquired in the field of application and maintenance of vibrating wire strain gauges in mining conditions. The functioning of the designed and constructed measuring module, complying with the requirements of the ATEX directive, was verified. Comparable test results recorded by sensors with a vibrating wire strain gauges and film strain gauges confirmed the correctness of the monitoring system. The analysis of the test results of the sensors placed in different places of the steel profile allowed selecting the place where the vibrating wire strain gauges is the least sensitive to the disturbance of the measurement signal. As part of the testing, the vibrating wire strain gauge mounts were welded to the steel profiles of the arch support. However, this type of mounting would not be acceptable in underground mines, so it was determined that gluing the mounts was an equally good mounting method (provided the adhesive recommended by the sensor manufacturer was used).
5. Conclusions
The arc support monitoring system was designed for use in underground mining. Therefore, several solutions were implemented to adapt the measuring module to the requirements of the ATEX directive. These restrictions made it very difficult to operate the vibrating wire strain gauge, because the energy to stimulate the wire had to be reduced to a minimum, which in turn caused problems with the correct reading of the wire frequency. Of course, this solution can also be applied outside the mining industry and the absence of ATEX restrictions will increase the reliability of the device and lower the manufacturing costs. Proper protection of the electronics and the vibrating wire strain gauge will allow the monitoring system to be used even in difficult weather conditions.
Author Contributions
Conceptualization, M.W., J.R.-R. and K.S.; methodology, M.W. and J.R.-R.; validation, K.S.; formal analysis, K.S.; writing—original draft preparation, J.R.-R. and M.W. All authors have read and agreed to the published version of the manuscript.
Funding
The article was prepared within the realization framework of the European project INESI “Increase efficiency and safety improvement in underground mining transportation routes”. (Contract number 754169), financed by the Research Fund for Coal and Steel.
Institutional Review Board Statement
Not applicable.
Informed Consent Statement
Not applicable.
Data Availability Statement
Data sharing not applicable.
Conflicts of Interest
The authors declare no conflict of interest.
References
- Szewerda, K.; Tokarczyk, J.; Pytlik, A. Suspended monorail emergency braking trolley computational model verification based on bench tests. IOP Conf. Ser. Earth Environ. Sci. 2019, 261, 012052. [Google Scholar] [CrossRef]
- McRae, J.; Simmonds, A. Long-term stability of vibrating wire instruments, one manufacturer’s perspective. In Proceedings of the 3rd International Symposium on Field Measurements in Geomechanics, Oslo, Norway, 9–11 September 1991; Sorum, G., Ed.; August Aimé Balkema: Rotterdam, The Netherlands, 1991; Volume 1, pp. 283–293. [Google Scholar]
- Dong, L.; Shu, W.; Sun, D.; Li, X.; Zhang, L. Pre-alarm system based on real-time monitoring and numerical simulation using internet of things and cloud computing for tailings dam in mines. IEEE Access 2017, 5, 21080–21089. [Google Scholar] [CrossRef]
- Mishra, M.; Lourenço, P.B.; Ramana, G.V. Structural health monitoring of civil engineering structures by using the internet of things: A review. J. Build. Eng. 2022, 48, 103954. [Google Scholar] [CrossRef]
- Hou, Y.; Li, Q.; Zhang, C.; Lu, G.; Ye, Z.; Chen, Y.; Wang, L.; Cao, D. The state-of-the-art review on applications of intrusive sensing, image processing techniques, and machine learning methods in pavement monitoring and analysis. Engineering 2021, 7, 845–856. [Google Scholar] [CrossRef]
- Thai, H.-T. Machine learning for structural engineering: A state-of-the-art review. Structures 2022, 38, 448–491. [Google Scholar] [CrossRef]
- Chen, H.; Liang, H.; Tang, M.; Jiang, S.; Hu, H. The Real-Time Automated Monitoring System for Lateral Deflection of Underground Structures. Adv. Civ. Eng. 2020, 2020, 6102062. [Google Scholar] [CrossRef]
- Jasiulek, D. Monitoring of the Mining Powered Roof Support Geometry. J. Mach. Constr. Maint. 2019, 3, 73–79. [Google Scholar] [CrossRef]
- Jasiulek, D.; Bartoszek, S.; Lubryka, J. Efektywność wykorzystania i bezpieczeństwo techniczne górniczej obudowy zmechanizowanej. Masz. Górnicze 2019, 37, 73–79. [Google Scholar]
- Woszczyński, M.; Tokarczyk, J.; Mazurek, K.; Pytlik, A. Monitoring of loads in arch support with wire strain gauge. Min.-Inform. Autom. Electr. Eng. 2019, 57, 48–58. [Google Scholar] [CrossRef]
- Kushchenko, V.; Nechytailo, O. Monitoring of Dynamic Loads on Steel Headframes. In Lecture Notes in Civil Engineering; 100 LNCE; Springer: Berlin/Heidelberg, Germany, 2020; pp. 245–252. [Google Scholar]
- Rager, K.; Jaworski, D.; von der Heide, C.; Kyriazis, A.; Sinapius, M.; Constantinou, I.; Dietzel, A. Space-filling curve resistor on ultra-thin polyetherimide foil for strain impervious temperature sensing. Sensors 2021, 21, 6479. [Google Scholar] [CrossRef]
- Flintsch, G.; Salado, F.; Xue, W. Monitoring pavement responses throughout its life cycle using heavy vehicle simulator. In Proceedings of the 8th International Conference on Maintenance and Rehabilitation of Pavements, MAIREPAV 2016, Singapore, 27–29 July 2016; pp. 986–991. [Google Scholar]
- Cheilakou, E.; Tsopelas, N.; Anastasopoulos, A.; Kourousis, D.; Rychkov, D.; Gerhard, R.; Frankenstein, B.; Amditis, A.; Damigos, Y.; Bouklas, C. Strain monitoring system for steel and concrete structures. Procedia Struct. Integr. 2018, 10, 25–32. [Google Scholar] [CrossRef]
- Vibrating Wire Strain Gauges. Available online: https://www.sisgeo.com/products/strain-gauges-and-thermometers/item/vibrating-wire-strain-gauges.html (accessed on 4 December 2021).
- Cieplok, G.; Bednarski, Ł.; Sieńko, R. The use of self-excited vibrations for dynamic strain measurements carried out by vibrating wire tensometers. Mech. Control. 2015, 34, 1–8. [Google Scholar] [CrossRef]
- Simmonds, A. Long term monitoring using vibrating wire sensors. In Proceedings of the 6th International Conference on Structural Health Monitoring of Intelligent Infrastructure, Hong Kong, China, 9–11 December 2013. [Google Scholar]
- Figiel, A. Technical safety of machinery and equipment in the aspect of the activities of the KOMAG Division of Attestation Tests, Certifying Body. Min. Mach. 2020, 1, 2–8. [Google Scholar] [CrossRef]
- Bednarski, Ł.; Sieńko, R. Pomiary odkształceń konstrukcji przetwornikami strunowymi [Structural deformation measurements with vibrqating wire strain gauge]. Inżynieria i Budownictwo 2013, 11, 615–619. [Google Scholar]
- Stankiewicz, K. Mechatronic systems developed at the KOMAG. Min. Mach. 2020, 2, 59–68. [Google Scholar] [CrossRef]
- Lutyński, A. KOMAG activities in the domestic and international research areas. Min. Mach. 2021, 4, 47–60. [Google Scholar] [CrossRef]
- Jasiulek, D.; Bartoszek, S.; Perutka, K.; Korshunov, A.; Jagoda, J.; Plonka, M. Shield Support Monitoring System—Operation during the support setting. Acta Montan. Slovaca 2019, 24, 391–401. [Google Scholar]
- Pytlik, A. Stanowisko i metodyka badań obudowy podporowo-kotwiowej w skali naturalnej. Przegląd Górniczy 2017, 73, 18–23. [Google Scholar]
- Nazimko, V.V.; Alexandrov, N.S.; Zakharov, S.V. Prognozowanie zaciskania wyrobisk podziemnych. Bud. Górnicze I Tunelowe 2001, 2, 23–29. [Google Scholar]
- Hauke, J.; Kossowski, T. Comparison of Values of Pearson’s and Spearman’s Correlation Coefficients on the Same Sets of Data. Quaest. Geogr. 2011, 30, 87–93. [Google Scholar] [CrossRef] [Green Version]
- Bland, J.M.; Altman, D.G. Statistical methods for assessing agreement between two methods of clinical measurement. Lancet 1986, 327, 307–310. [Google Scholar] [CrossRef]
- Bunce, C. Correlation, Agreement, and Bland–Altman Analysis: Statistical Analysis of Method Comparison Studies. Am. J. Ophthalmol. 2009, 148, 4–6. [Google Scholar] [CrossRef] [PubMed]
- Doğan, N.Ö. Bland-Altman analysis: A paradigm to understand correlation and agreement. Turk. J. Emerg. Med. 2018, 18, 139–141. [Google Scholar] [CrossRef] [PubMed]
- Giavarina, D. Understanding Bland Altman analysis. Biochem. Med. 2015, 25, 141–151. [Google Scholar] [CrossRef] [PubMed] [Green Version]
Publisher’s Note: MDPI stays neutral with regard to jurisdictional claims in published maps and institutional affiliations. |
© 2022 by the authors. Licensee MDPI, Basel, Switzerland. This article is an open access article distributed under the terms and conditions of the Creative Commons Attribution (CC BY) license (https://creativecommons.org/licenses/by/4.0/).