1. Introduction
In recent years, as a consequence of the need to mitigate climate change, an ideological current has been developed that seeks to establish a new, more efficient, and environmentally friendly constructive model. Due to the industrial revolution legacy, we know that fossil resources are finite, that our production model has an expiration date, and that there has been an increase in annual temperature due to the amount of generated waste and greenhouse gas emissions.
According to the European Commission, buildings are responsible for about 40% of energy demand and cause 36% of the CO
2 emissions, being the greatest energy consumer in Europe [
1]. In the area of energy consumption of buildings, directive 2010/31/EU of 19 May on the energy efficiency of buildings established that from 31 December 2020, all new buildings must have nearly zero energy consumption (nZEB). This has developed new vectors of innovation in architecture, such as “Smart cities”, “Smart Buildings”, or some materials for reducing cooling needs in buildings [
2,
3].
The energy performance of buildings directive (EPBD) requires that EU countries set some cost-optimal energy performance requirements for new buildings, for existing buildings undergoing major renovation, and for the replacement or retrofit of building elements (e.g. heating and cooling systems, roofs and walls). Each Member State should establish a long-term renovation strategy to support the renovation of the national stock of residential and non-residential buildings, both public and private, into a highly energy-efficient and decarbonized building stock by 2050, facilitating the cost-effective transformation of existing buildings into nearly zero-energy buildings [
4].
Nowadays, due to the new technological advances, new fields of research have been developed around intelligent materials, whose properties can contribute to the improvement in the energy performance of the building. An example is the chromogenic materials that change technical behavior according to the external stimulus. This type of material opens up a wide range of new possibilities when applied to construction [
5,
6,
7].
In recent years, there have been discussions with regard to a new roof concept called “cool roofs” [
8], where, thanks to a high level of reflectance, they prevent overheating in summer. The reduction of the energy consumption of cool roofs has been widely reported in different climate zones and building typologies [
9]. Cool roofs reduce cooling energy in buildings during the summer and improve thermal comfort in buildings with no air conditioning buildings [
10,
11,
12,
13].
A few studies show that [
14,
15] cool roofs are the best solution in temperate and Mediterranean climates, especially in comparison to traditional roofing because they reduce the surface temperature. Similar studies compare the effect of cool materials with thermochromic materials on the energy efficiency of buildings [
16,
17] and they show that static cool roofs cause significant heating penalties during cold seasons but provide cooling energy savings during summer seasons. This last review shows the importance of understanding the climate in order to apply one system or another.
The chromogenic materials that make it possible to change from light to dark colors and return to light, in response to external stimuli (temperature increase) are those that have aroused the interest of the research. These types of dynamic materials lend properties that a priori can offer improvements in the energy efficiency of buildings in a passive way [
18].
A previous study compared the properties of thermochromic paints exposed to solar radiation at an ambient temperature of 35 °C. It was shown that a thermochromic paint after it changes color, manages to absorb the same as a conventional paint [
19].
The skin of the building is the element that is in contact with the exterior environment; it forms the envelope in charge of guaranteeing the interior comfort of users, as well as energy efficiency, and at the same time, has a landscape connotation. The reflectance and absorptance of the exterior surface of the building make a significant contribution to energy efficiency [
20,
21].
There are some reported analyses on the potential energy savings for switchable reflectance roofs. The effect of the application of a thermochromic façade was simulated in a single-family house [
22], in a case located in Madrid with a 1.29 W/m
2·K thermal transmittance of the wall (U
wall) and absorptances (α) between 0.65–0.70. Results showed a reduction in total energy demand values for the use of thermochromic materials. Some other studies have evaluated the impact of this technology in windows, and it was observed that the energy performance can be improved by around 6.14% compared to an ordinary single window [
23].
An energy performance analysis of a variable reflectivity envelope system for commercial buildings has been evaluated in four different climates in the USA [
24]. It has been reported that dynamic cool roofs save an additional 7% in annual heating and cooling energy cost as compared to static roofs. Moreover, it has also been reported that dynamic cool roofs provide the same savings in cooling energy use as static ones. However, this conclusion focuses the attention on dynamic roofs, which leaves cool roofs behind in terms of energy consumption. Nowadays the studies of thermochromic materials applied in opaque surfaces to reduce the energy demand are mostly paints [
19,
25] and cement [
26,
27].
Other studies have tested energy savings by integrating a thermochromic thin film in windows [
23,
28,
29,
30]. Some others demonstrated annual energy consumption can be reduced by introducing thermochromic windows in Mediterranean climates [
31,
32]. For this reason, the aim of this study is to provide more scientific data, which contributes to reinforcing the need to continue research into the commitment to thermochromics in the construction sector.
Some studies reported the analysis of a thermochromic coating in five different cities in China. The thermochromic coating evaluated has a transition temperature of 25 °C, the color range in yellow, and the absorptances (α) between 0.46 and 0.84. Results showed energy savings in the annual consumption, but not in one of the samples. In a mild climate, the temperature never becomes higher than 25 °C and the coating stays in the same color the whole year [
23]. It is interesting to study the monthly affectation to define a transition temperature for each climate.
Most of the main findings of the thermochromic application as a roof system are energy and cost savings as a common denominator [
22,
33,
34,
35]. Cost savings in the long term have not been tested.
The purpose of this paper was to assess the energy impact emerging from the application of thermochromic materials as roof cover (opaque envelope) in tertiary-use buildings in Spain. No specific thermochromic material was simulated, instead, extreme reflective coating characteristics for the cover were considered. In other words, the study proposes to take a step back from the characteristics of simulated materials in previous studies [
22,
33,
34,
35] to define in what range of thermal transmittances and climates make more sense for it to be applied. Therefore, conclusions will be drawn if it makes more sense for it to be applied in new construction or energy rehabilitation.
In the first part of the paper, climate zone, building typology, and constructive systems (materials and technical performances) are described. Subsequently, a preliminary assessment is made in two Spanish climates using white and black colors (colors with high extreme opposite absorptances) to detect in which thermal transmittance the color change has more affectation to focus the investigation on one. Then, the results of the simulation analysis by month are discussed to determine which surface color is more suitable for minimizing the energy demand of the building. Previous studies have analyzed similar aspects in other building uses with thermal transmittances around 1.29 W/m
2·K, and in buildings with the same use with thermal transmittances of U
value 0.19 W/m
2·K [
22,
23,
24,
25,
26,
27,
28,
29,
30,
31,
32,
33,
34,
35]. After monthly application analyses, a summary of the annual demands for the study cases is offered. After monthly and annual analyses, a daily simulation for black and white surfaces has been made, to detect when the transition temperature will be more optimal in terms of energy performance. Finally, the calculation of the optimal cost is provided to determine whether it is worth applying this technology nowadays, instead of using the cool roofs method. In addition, a long-term view is offered to discuss the optimal cost.
The study methodology has been based on Spanish regulations, but the methodology is replicable in other climates and countries.
2. Methodology and Calculation
The energy demand analyses of the case study were based on simulations using the simulation tool DesignBuilder version 6 software [
36]. DesignBuilder is one of the most well-known and advanced user interfaces in relation to EnergyPlus [
37], the industry-standard Building Energy Simulation tool. It provides access to the most commonly required simulation capabilities covering building fabric, thermal mass, glazing, shading, renewables, HVAC, and financial analysis. EnergyPlus has been repeatedly validated through analytical, comparative, and empirical tests through ASHRAE 14-2002 guidelines [
38] and the HVAC simulation results have shown a good agreement with other well-known simulation tools, such as DOE-2.1E, TRANSYS, and ESP-r [
39].
The case study considered the two most representative climates of two cities in Spain, namely Barcelona and Madrid, with tertiary-use buildings.
In the investigation, the two most reflective coating values of the roof were considered to test whether it really makes sense to apply a color change to the cover. The same construction system was applied to these different characteristics, but with different thermal transmittance values depending on the regulations of the year of application.
Finally, the optimal cost was calculated according to the European Union methodology ‘’cost-optimal’’ as stated in the Energy Performance of Buildings Directive (EPBD, 2010/31/EU) [
40]. To assess the technology and its economic impact, to obtain data that promote new lines of research in the creation of new materials.
2.1. Climate Zone
The two most representative climates of the two cities in Spain with tertiary-use buildings were considered. According to Spanish state regulations (CTE), the climatic classification for Barcelona is C2, the difference in temperatures between summer and winter is moderate and the temperature in summer is normally high, which means that there is a Mediterranean climate. The climate in Madrid is Continental (D3 according to CTE) and it means higher average temperatures in summer and lower average temperatures in the winter.
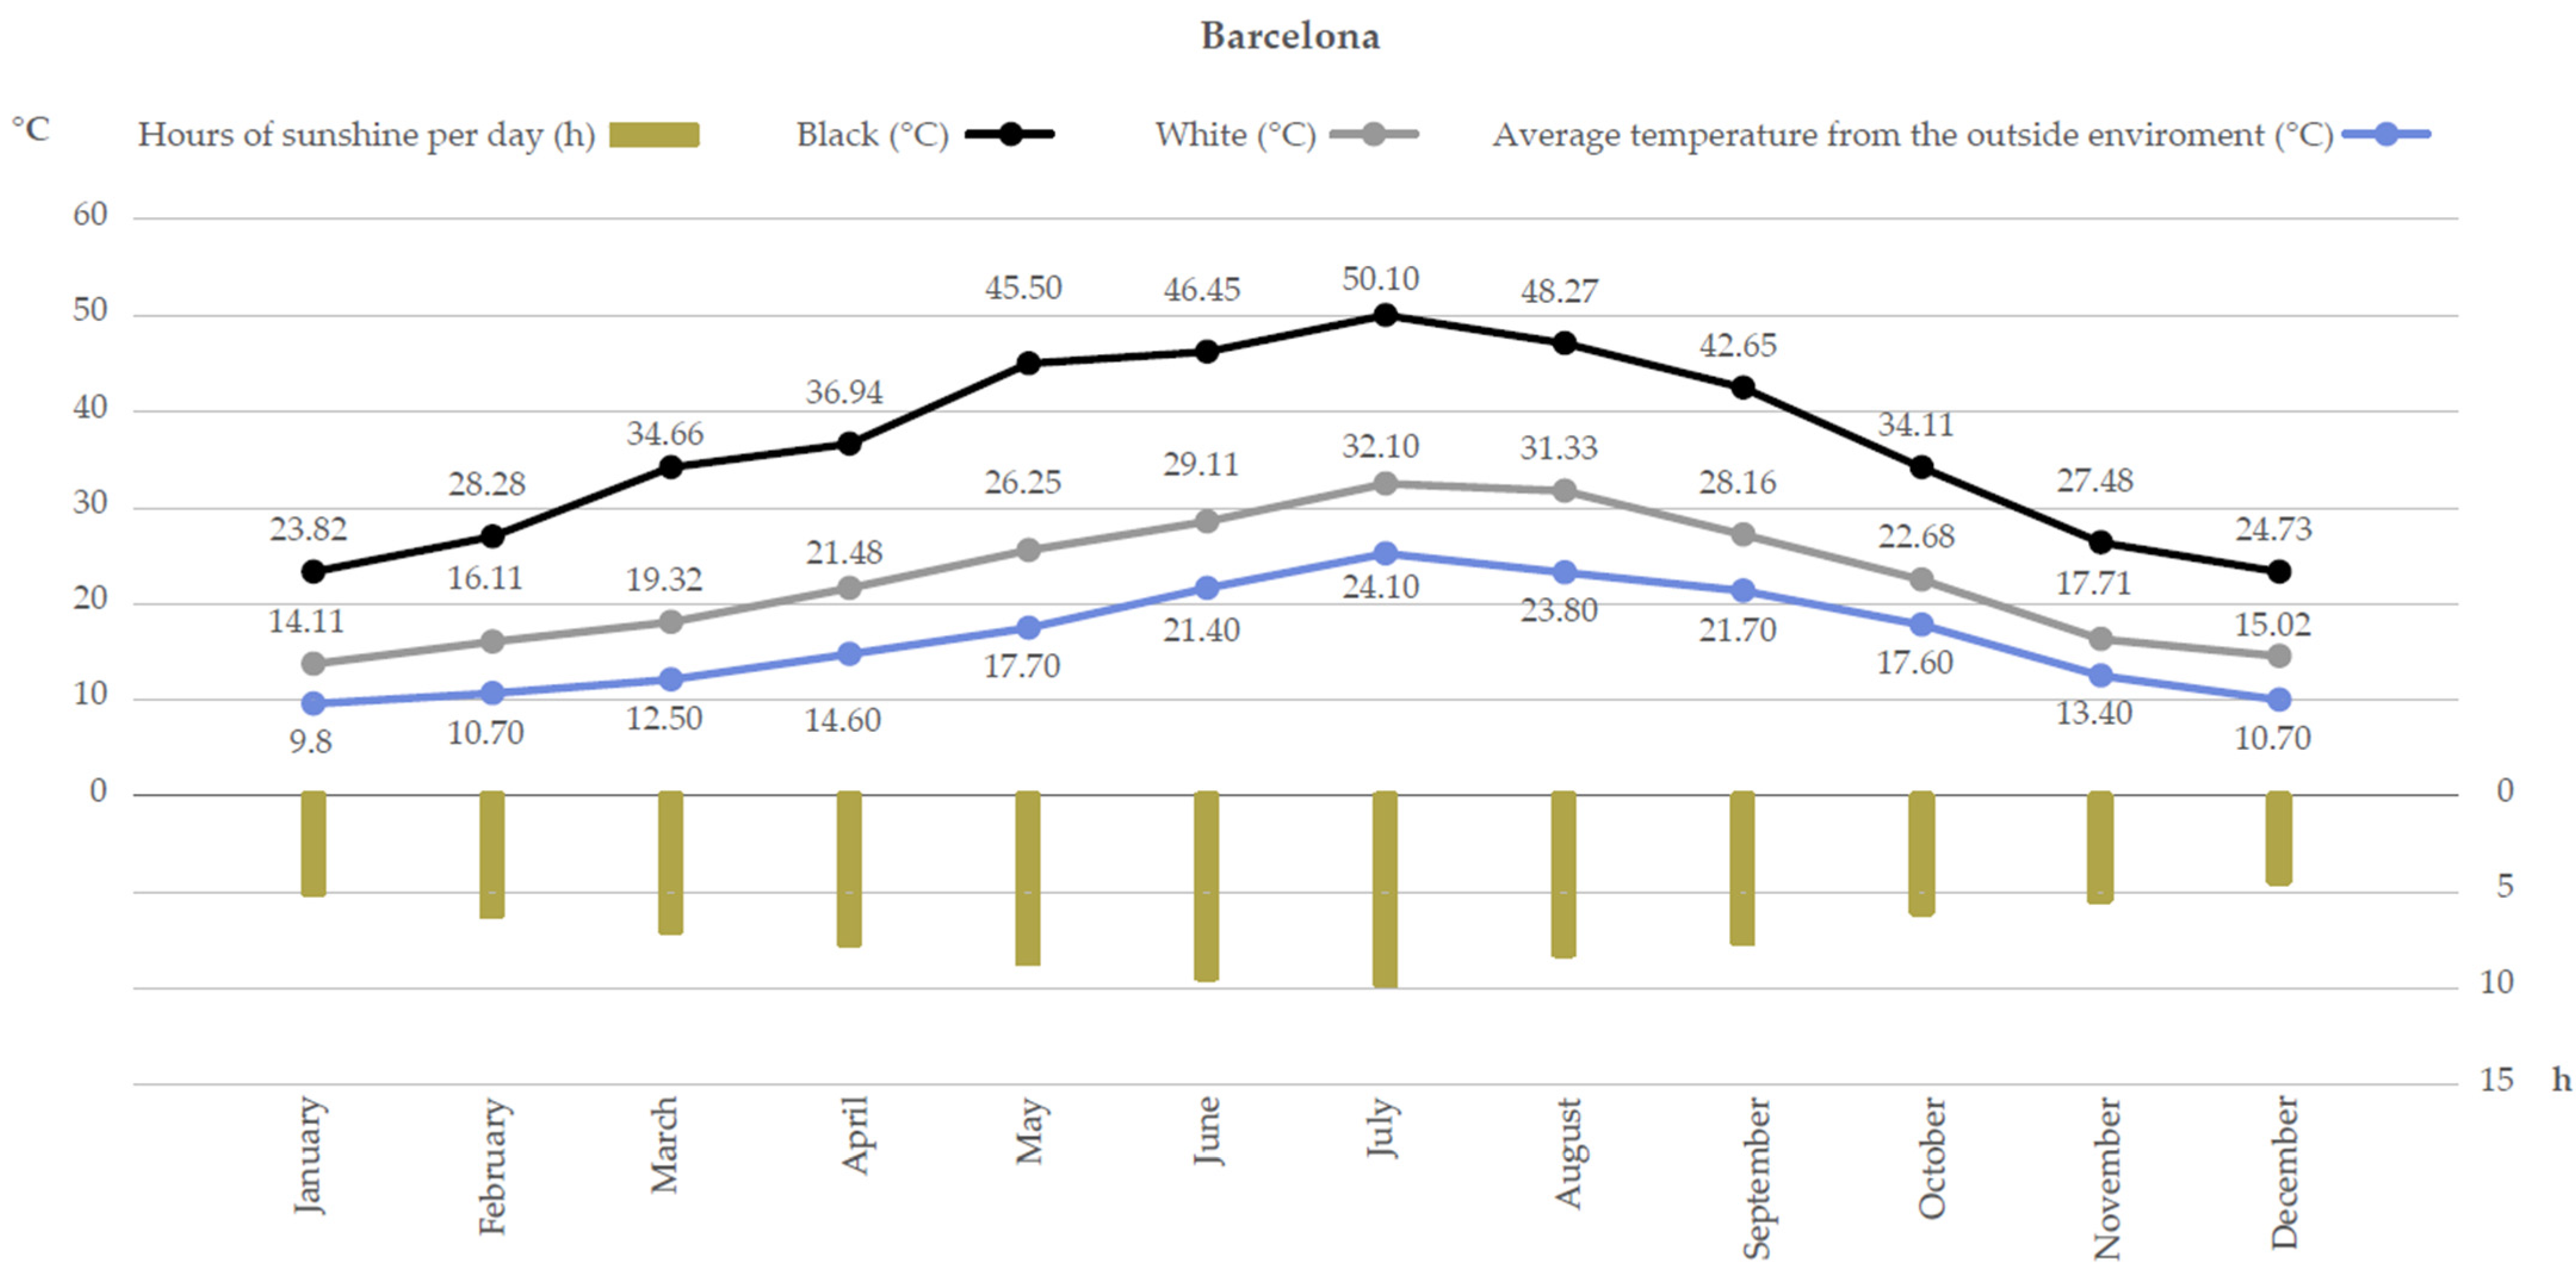
The optical properties of materials can significantly influence their surface temperatures depending on how these properties affect the relationship between the surfaces and solar radiation. The surface finish temperature depends on the location and is related to building energy consumption [
41]. A previous study developed a cementitious finish with phase change materials and thermochromic pigments. Results showed that the it is possible to control high surface temperatures with high emissivity, and low surface temperatures with low emissivity [
27].
The surface temperature also changes according to the climate and the optical properties of the surface finish. As shown in
Figure 1, for Barcelona, the surface temperature of white roofs reached temperatures of 32.10 °C in July, approximately 20 °C below that of black roofs. Meanwhile, in December, black roofs reached temperatures of 23.82 °C, approximately 10 °C above that of white roofs.
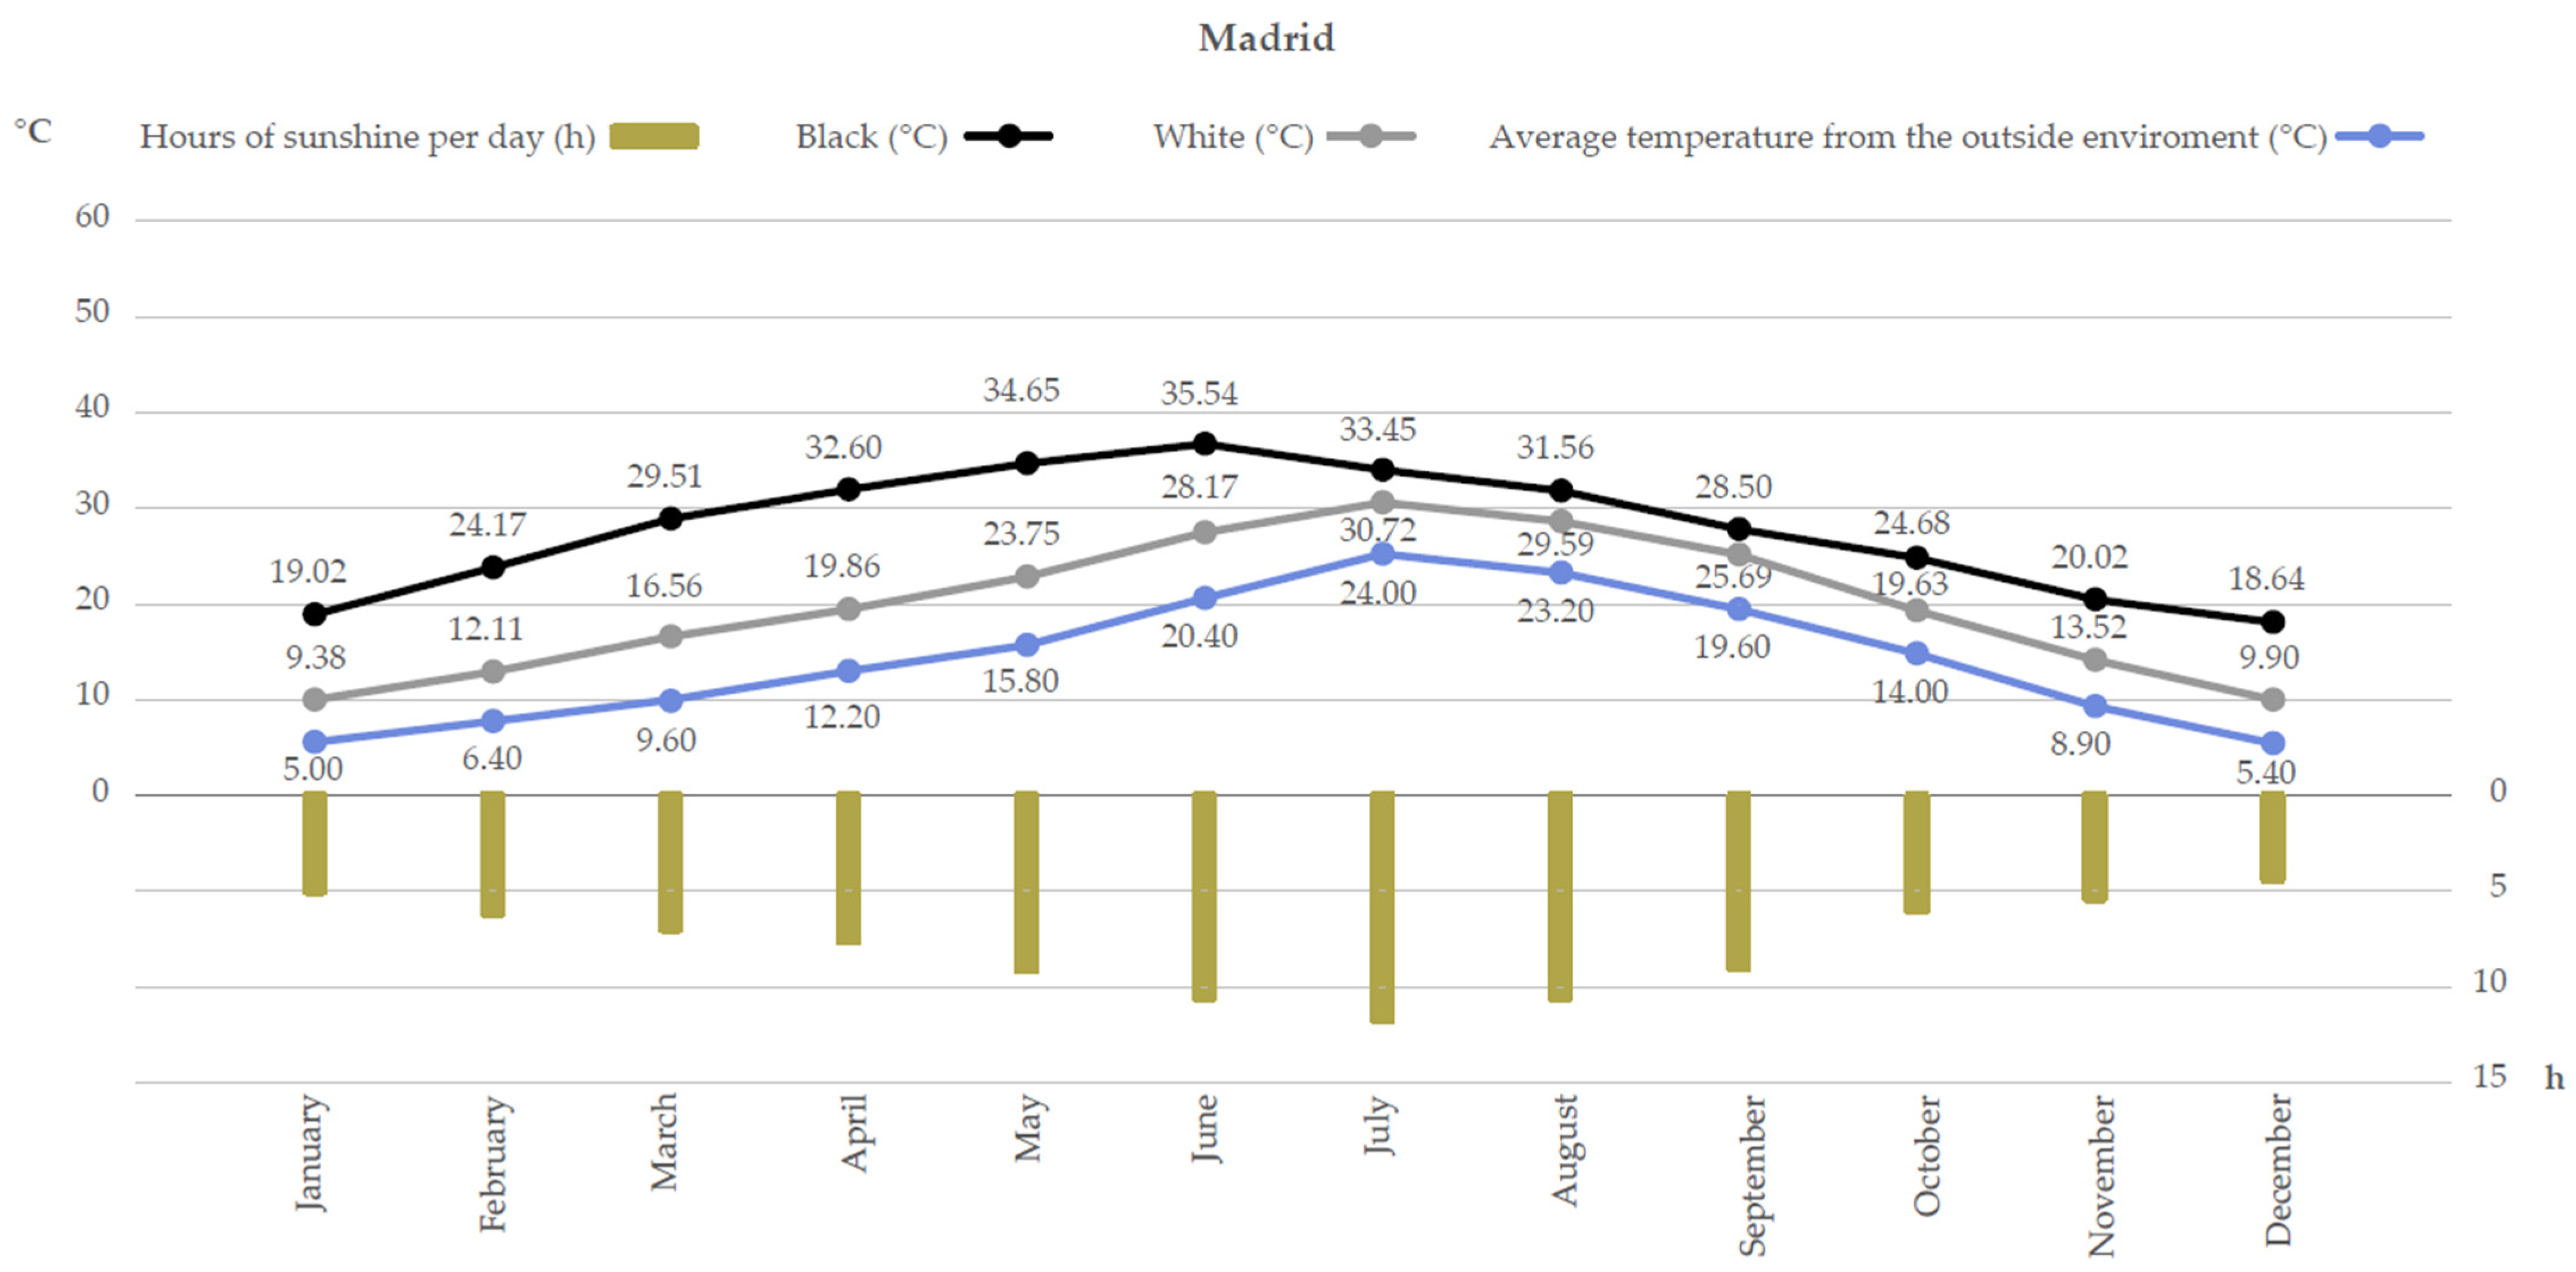
For Madrid,
Figure 2 shows that the surface temperature for black roofs varied by approximately 10 °C from that of white roofs in January–May.
2.2. Building Description
An isolated tertiary building with a large roof area was chosen for the case study, with the typical one floor and without shadow affectation on its roof. It is part of the most replicated built heritage of industrial areas, such as Besós and Zona Franca in Barcelona or Villaverde in Madrid.
The commercial sector institutions have great potential because they consume energy for long periods and in many different ways (i.e., heating, cooling, and lighting) and because they host a large number of consumers. The energy consumption of these establishments shows that 45% of the consumption belongs to lighting, 45% to air conditioning, and the remaining 10% to other uses, such as mechanical transport, industrial cooling, and others [
43].
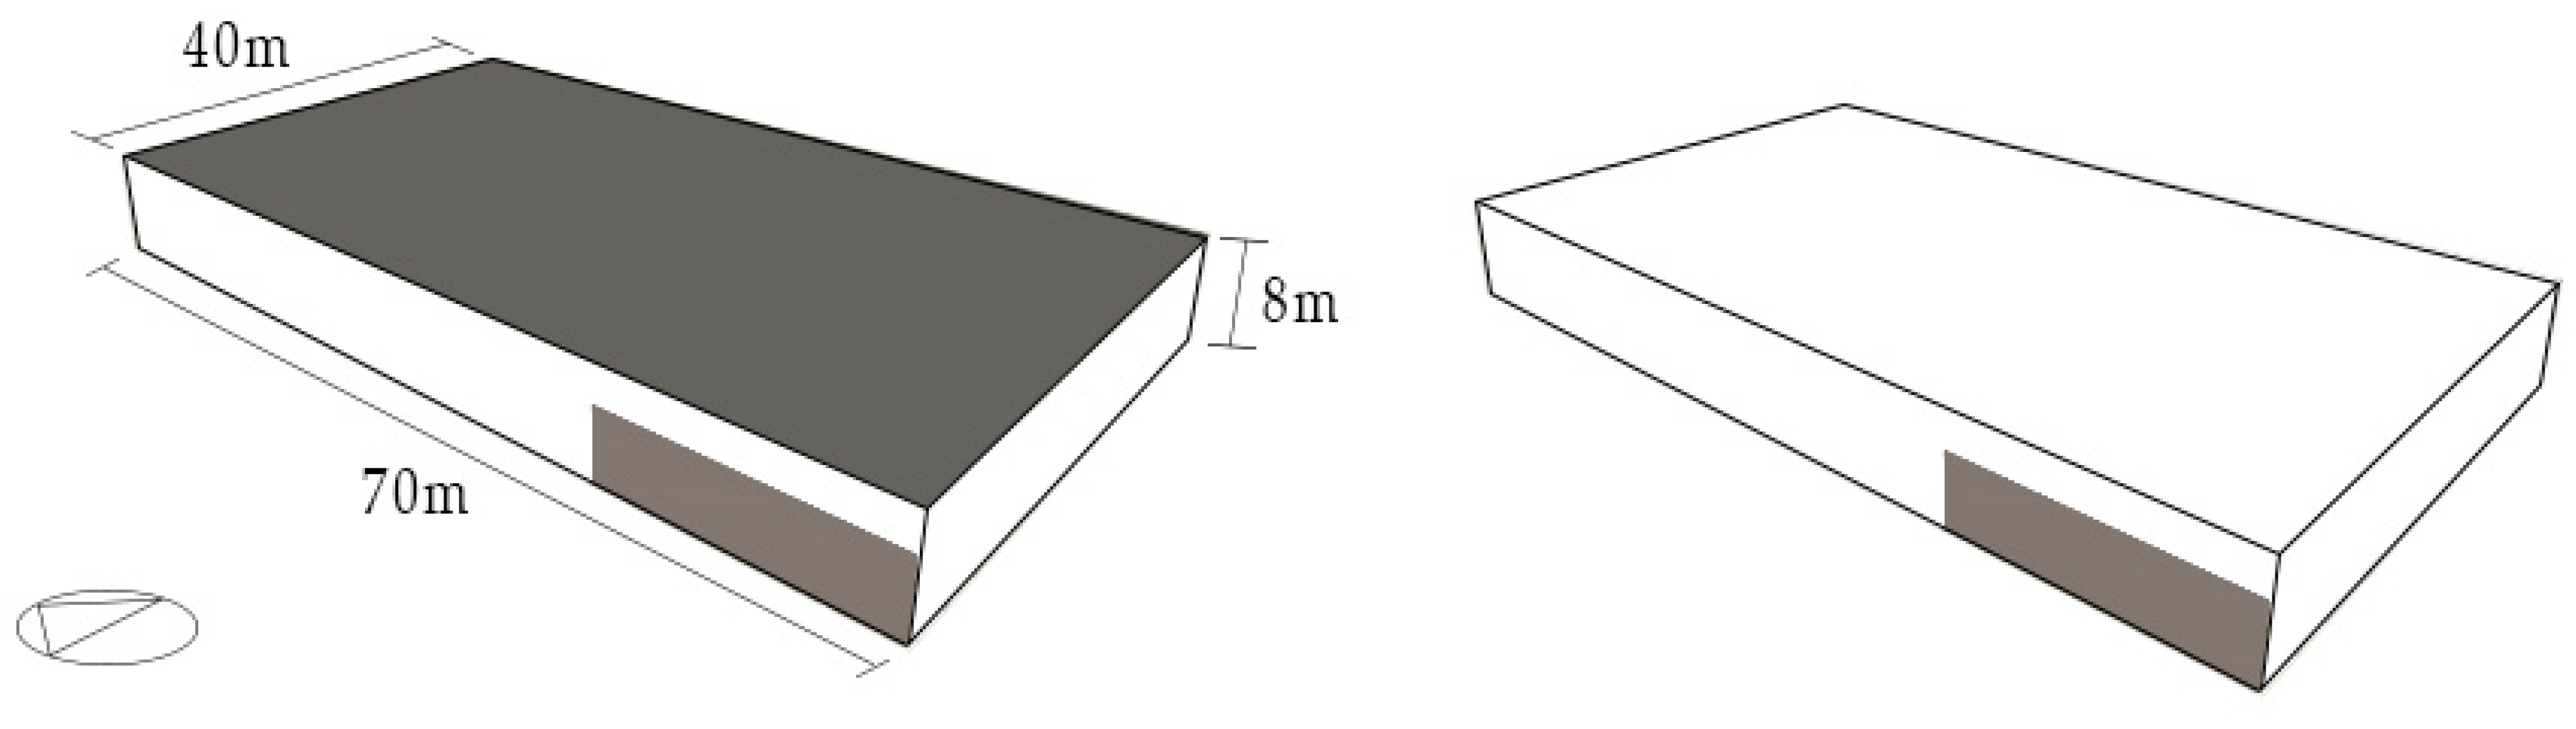
A prototypical commercial building is considered in this study. A building typology with a 70 × 40 m floorplan with a total conditioned floor area of 2800 m
2 (
Figure 3). A building with a single floor of 8 m height was considered and in total a conditioned volume of 22,400 m
3. The building window-to-wall ratio was 10% for the west orientation.
Table 1 summarizes the areas per façade and roof used for the simulation.
2.3. Roof Coating—Thermal Transmittance
In Spain, the construction of tertiary buildings in industrial areas is characterized by light elements and dry execution for rapid construction. Sandwich panels on the façade and roof are considered the most replicable construction model in this sector.
The thermal transmittance of the enclosures was considered according to the evolution of state regulations in order to be able to compare a wider range of behaviors of the thermochromic materials (
Table 2).
For buildings constructed before 2006, the NBE-CT-79 standard was considered. Meanwhile, for buildings constructed between 2006 and 2017, the CTE DB-HE 2006 was used (although CTE may have had different updates, a simplification has been made). Finally, for newly constructed buildings the values of Appendix E of the CTE DB-HE 2017 (values closer to European standards, such as the Pasivhouse) were used [
6]. Existing studies have already tested the benefits of thermochromic surface finishes in low U
values with positive solar gains [
44].
2.4. Optical Properties
Extreme reflective coating characteristics for the cover were considered in order to test whether it really makes sense or not to apply a color change. For all simulations, quite a “pure” absorptance and emittance were considered, without taking into account how durability or maintenance can affect these final values, as follows in
Table 3.
The aim is to define in which months should change the color to make the technology more efficient and reduce the energy demand. Existing studies have tested some thermochromic materials with real values of absorptance around 0.3–0.7 [
22,
24], values less extreme that have already shown trends in energy savings in annual demand.
2.5. Building Parameters
The thickness and building components of the enclosures were considered according to the evolution of state regulations (
Table 4). The properties of standard materials used in the simulations were taken from the software defaults (
Table 5). Sandwich panels on the façade and roof were considered with the composition of three layers: steel, foam-polyurethane, and steel.
2.6. Internal Loads
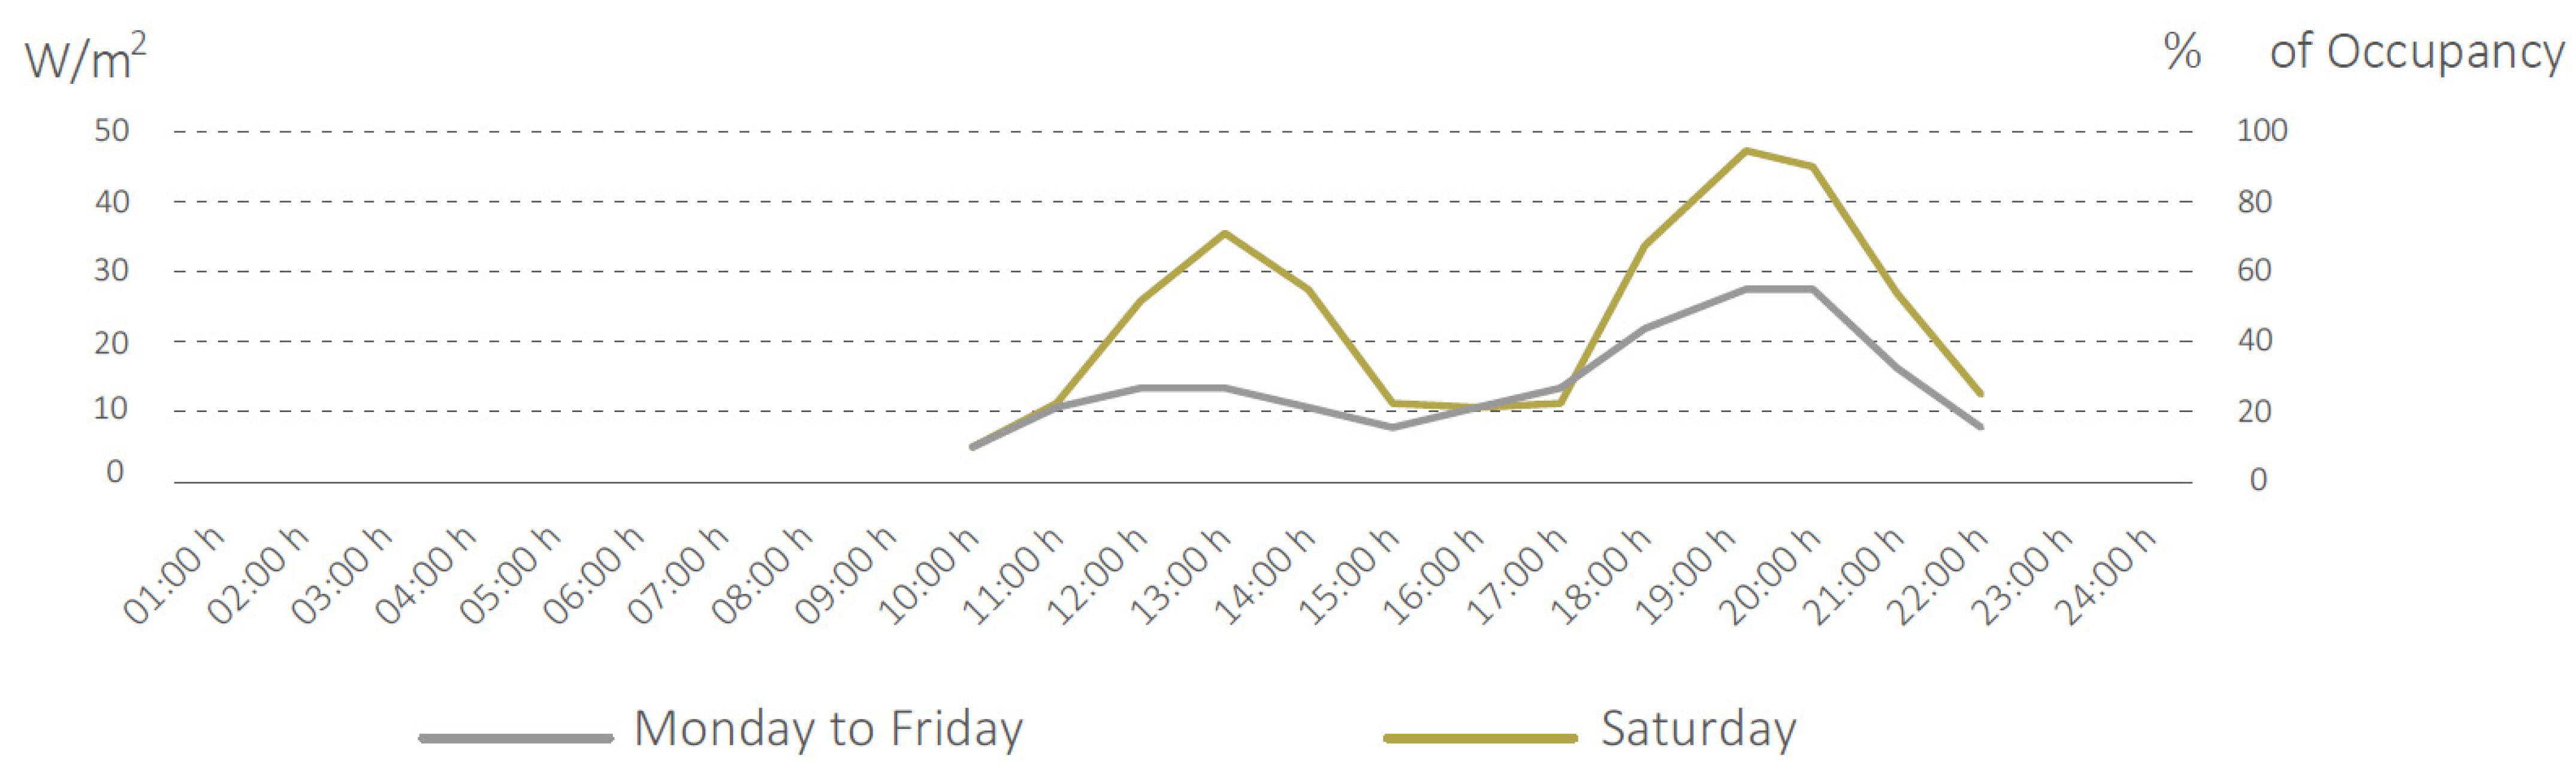
To ensure the simulations were as real as possible, occupancy data were introduced according to CTE-DB-SI regulations [
45], such as operating hours of the chosen building and its equipment [
42]. According to the building typology, a commercial building is occupied between 10 am through 22 pm, Monday to Saturday with a different occupation range during the day (
Figure 4). The internal loads’ range increases from 4 W/m
2 for hours with lower occupancy to 20 W/m
2 for hours with higher occupancy from Monday to Friday. For Saturday the values range is from 4 W/m
2 to 45 W/m
2.
For lighting loads, the year of application was considered according to the Spanish regulations (
Table 6). A value of 3.71 W/m
2 of internal loads by machinery and technological elements was considered.
3. Results
The simulations of the case study detailed below were developed with DesignBuilder software. For each case, two cover simulations were carried out, the first with a highly reflective surface finish (white) and the other with a highly absorbent finish (black). Each simulation was based on the same time but in two different climate zones (CZs), namely, Barcelona and Madrid. The intention was not only to find the percentages of energy savings but also to be able to establish in which months a value of absorption is required to optimize the demands.
The objective of the current study was to detect in which months, depending on the color (i.e., black or white), the demands were less in order to establish a range of applications for a thermochromic surface finish.
3.1. Preliminary Conclusions of the Color Change on Cover
A previous study was undertaken, to detect in which situations the color change has more affectation.
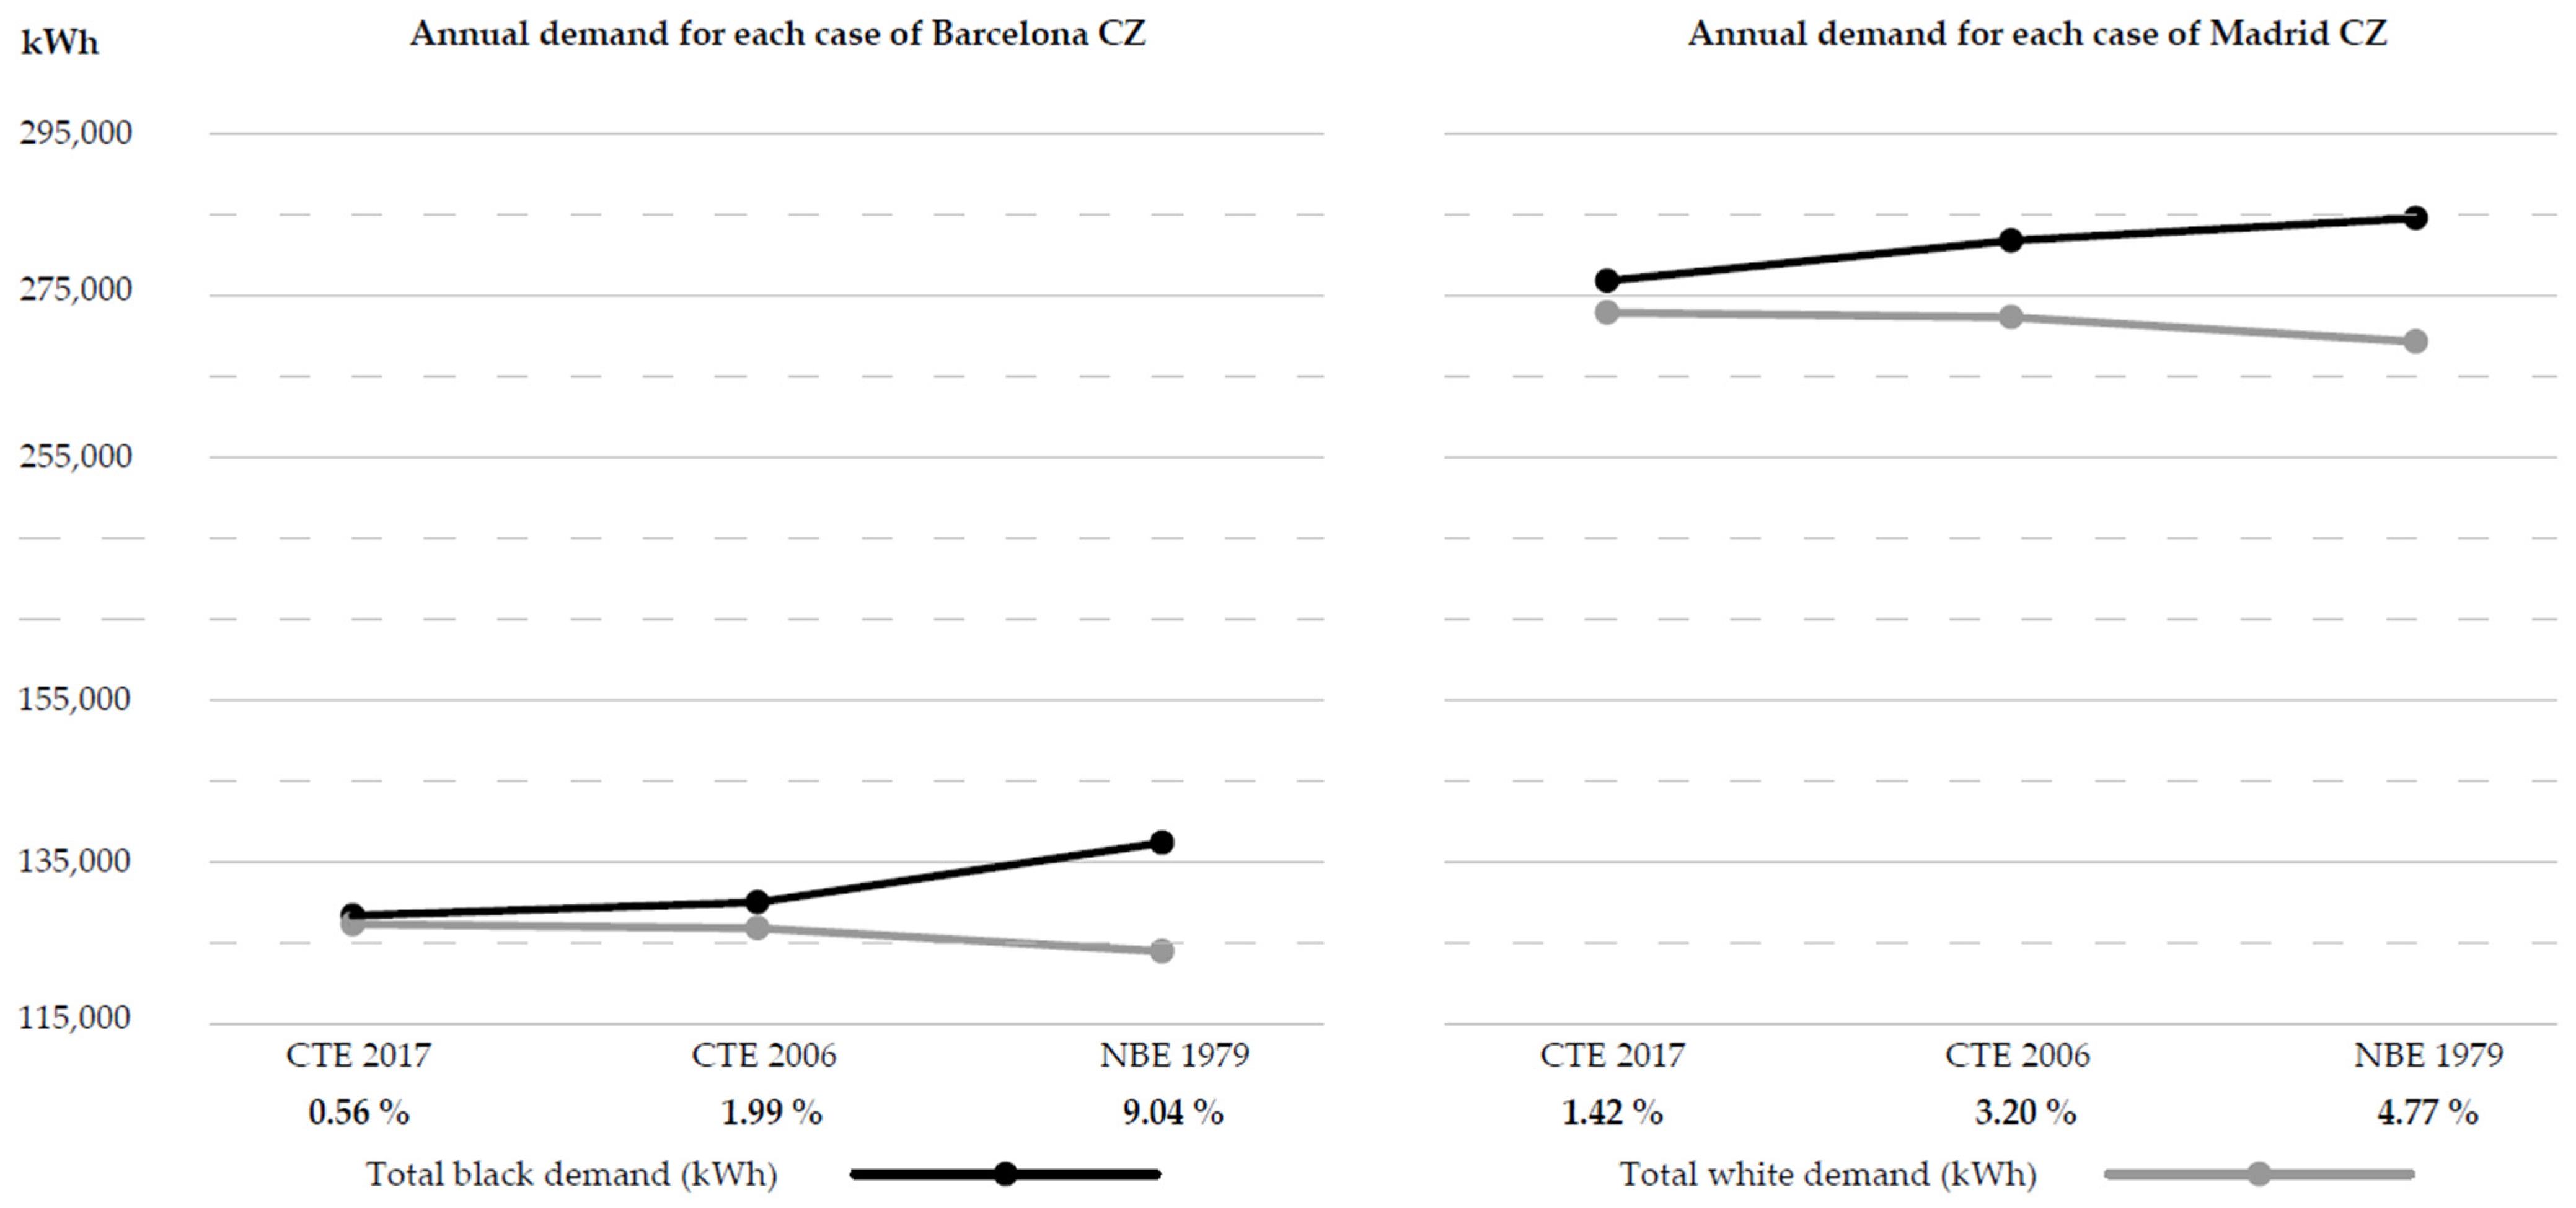
Figure 5 shows the summary of the annual demands for each case study in the two CZs with black and white surface finishes, observing that the values were always higher in the case of a black rather than a white surface finish.
In relation to the CZ in the Barcelona case, the surface color change on the roof had an impact on the annual demand for values ranging from 0.56% to 9%, according to the thermal transmittance of the enclosure. In the case of Madrid, the range of percentages of savings was more limited and the maximum value was half that of Barcelona; despite this, the absolute value of savings in kilowatt-hours was higher in Madrid.
It is appreciated that for buildings with low thermal transmittance, the color change will have less of an effect than those with high thermal transmittance. Given that in the two CZs there is demand for both cooling and heating [
43], it was considered interesting to focus on the behavior of the thermochromic surface finish by month in order to establish which surface color is more suitable for minimizing the energy demand of the building according to the time of the year.
In previous studies [
46], a thermochromic coating with five different colors has been analyzed. In this case, the thermochromic changed its color from dark to light. The results showed that thermochromics with a low absorptance of 0.3 (yellow) are the ones with the highest energy consumption. Moreover, thermochromic coatings with a high absorptance of 0.6 (i.e., green, blue, black) are the ones with less energy consumption. This is because, during the color change, its optical properties also change significantly and make the material absorb or reflect solar radiation when it is needed.
3.2. Thermochromic Monthly Demand Assessment
3.2.1. NBE-79 Assessment of the Monthly Demand in the Barcelona Climate Zone
As seen above, the results are more favorable for buildings with high thermal transmittance; therefore, monthly simulations are shown for this case study to see the influence of the thermochromic finish month by month.
The main goal of the analysis was to determine the best area to apply the thermochromic technology. As previously mentioned, detecting the months of color change in each case of study is important in order to understand where energy savings are produced.
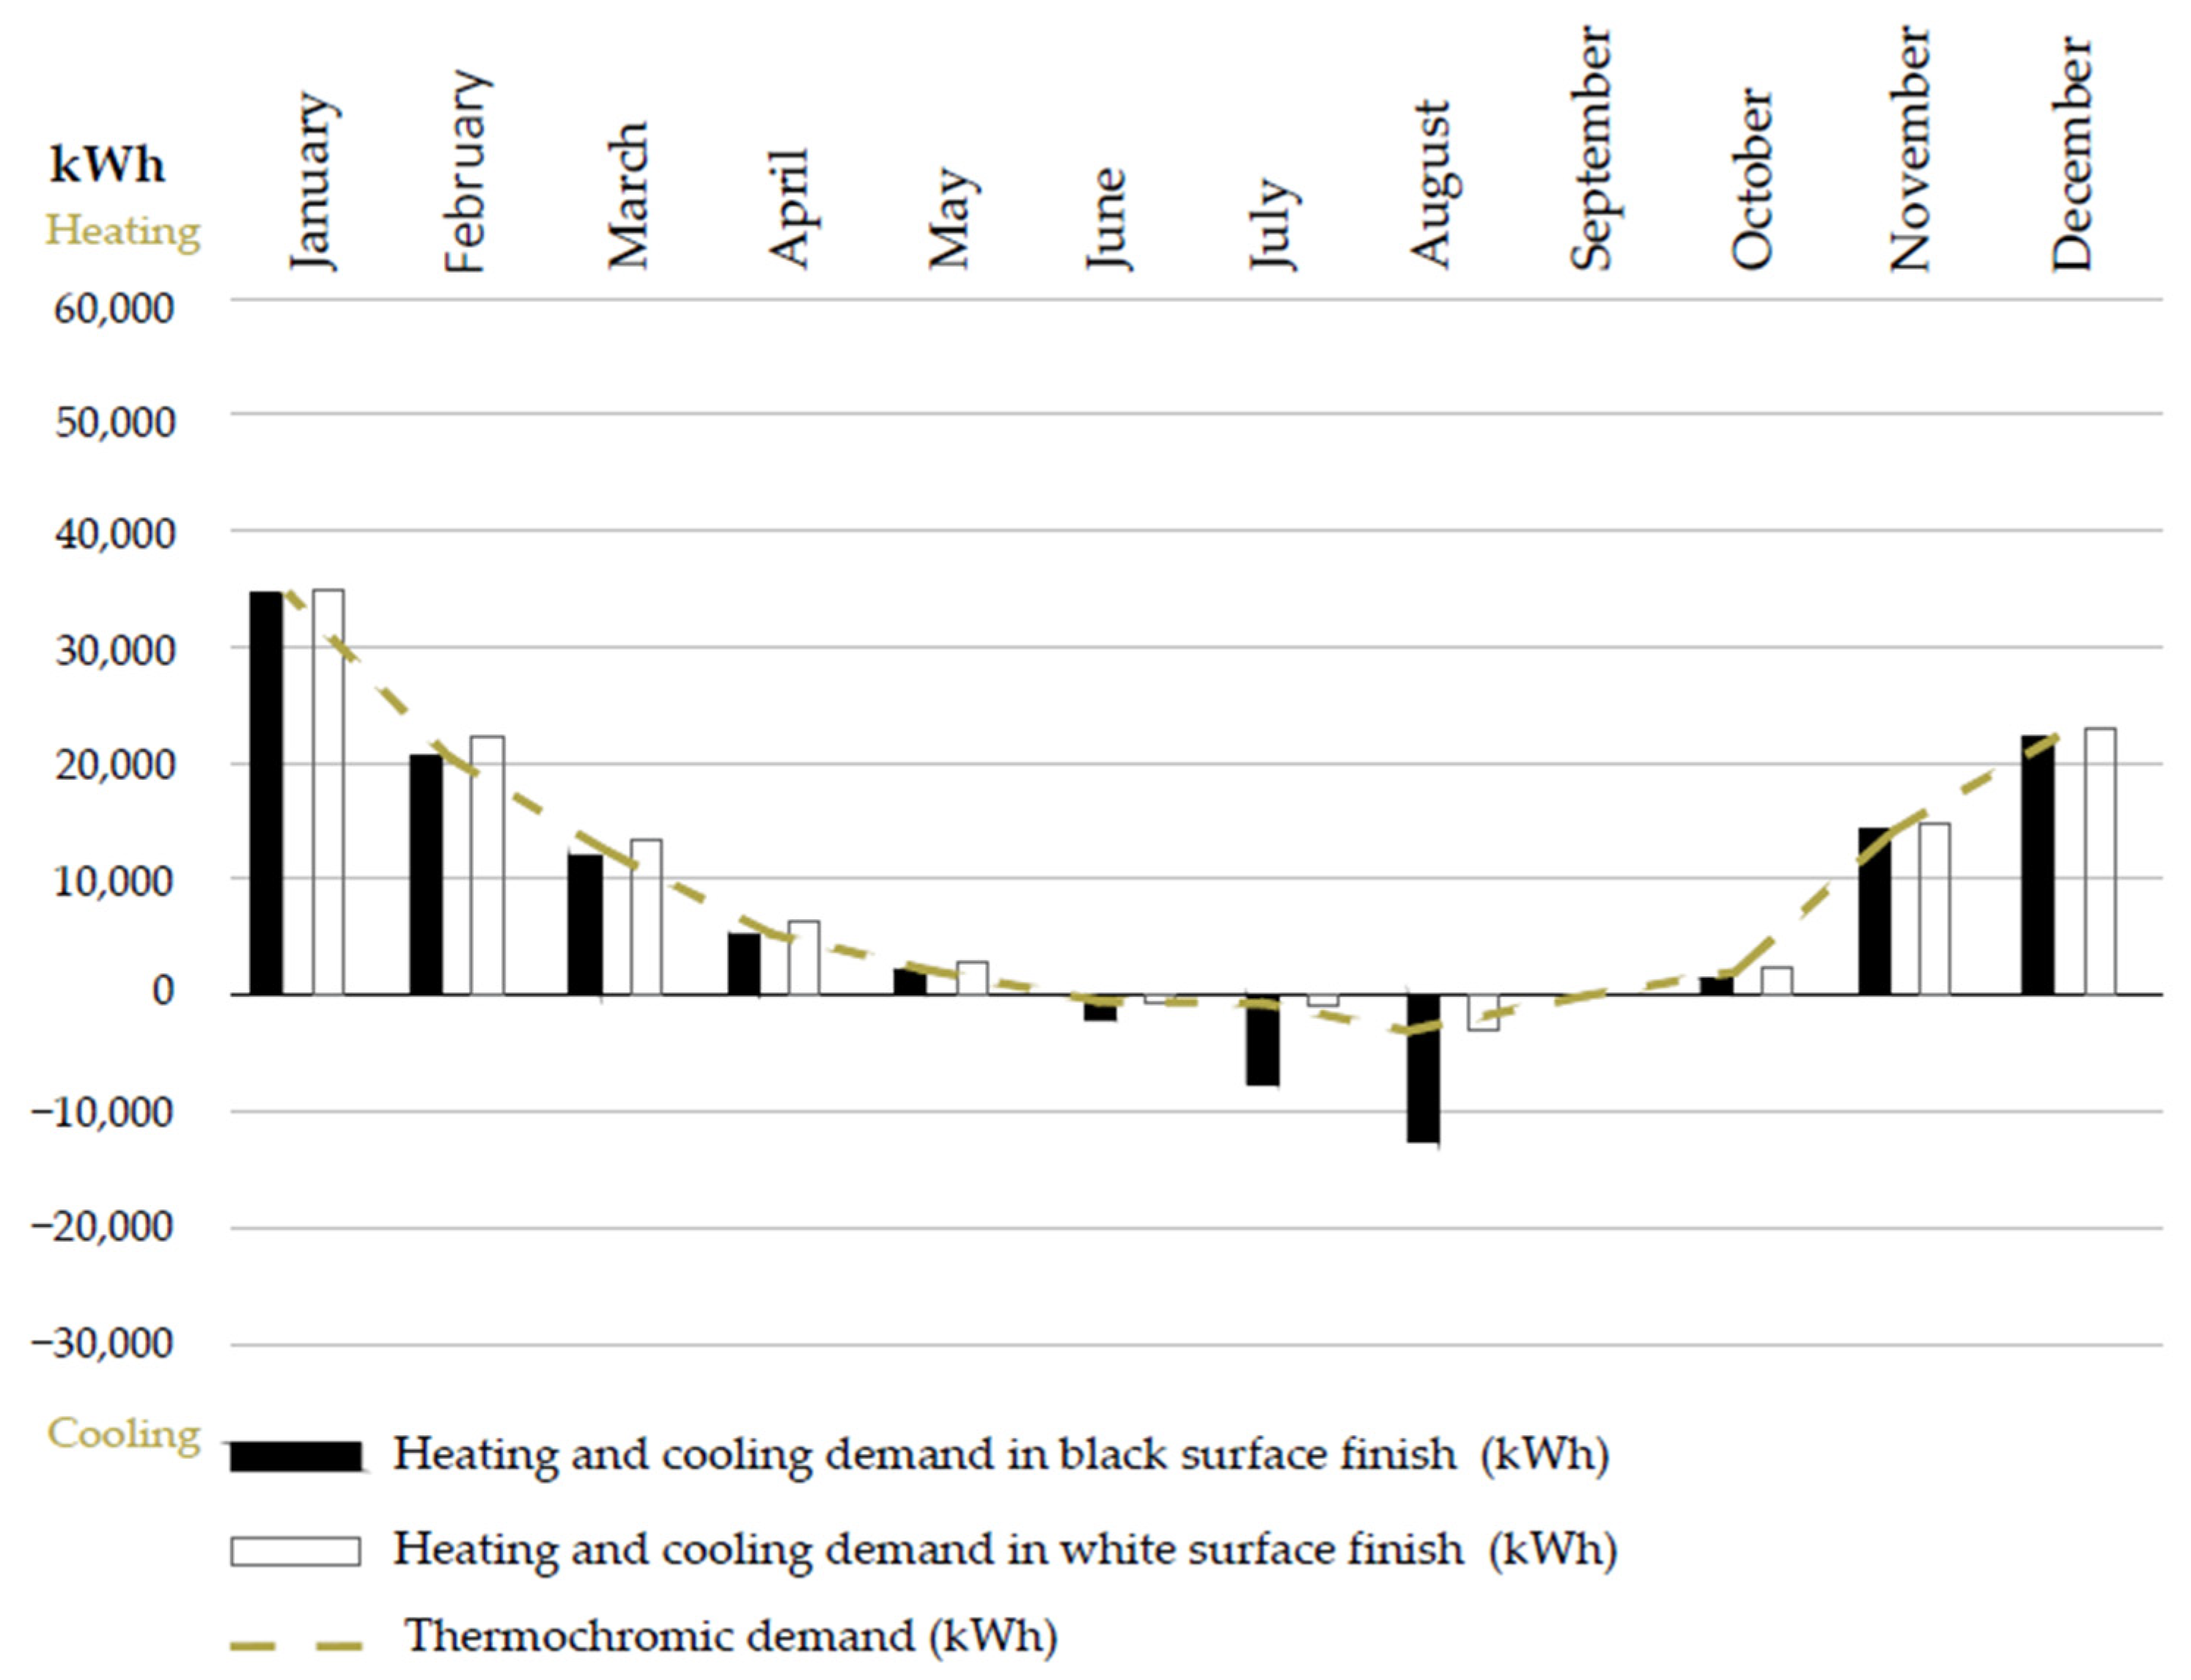
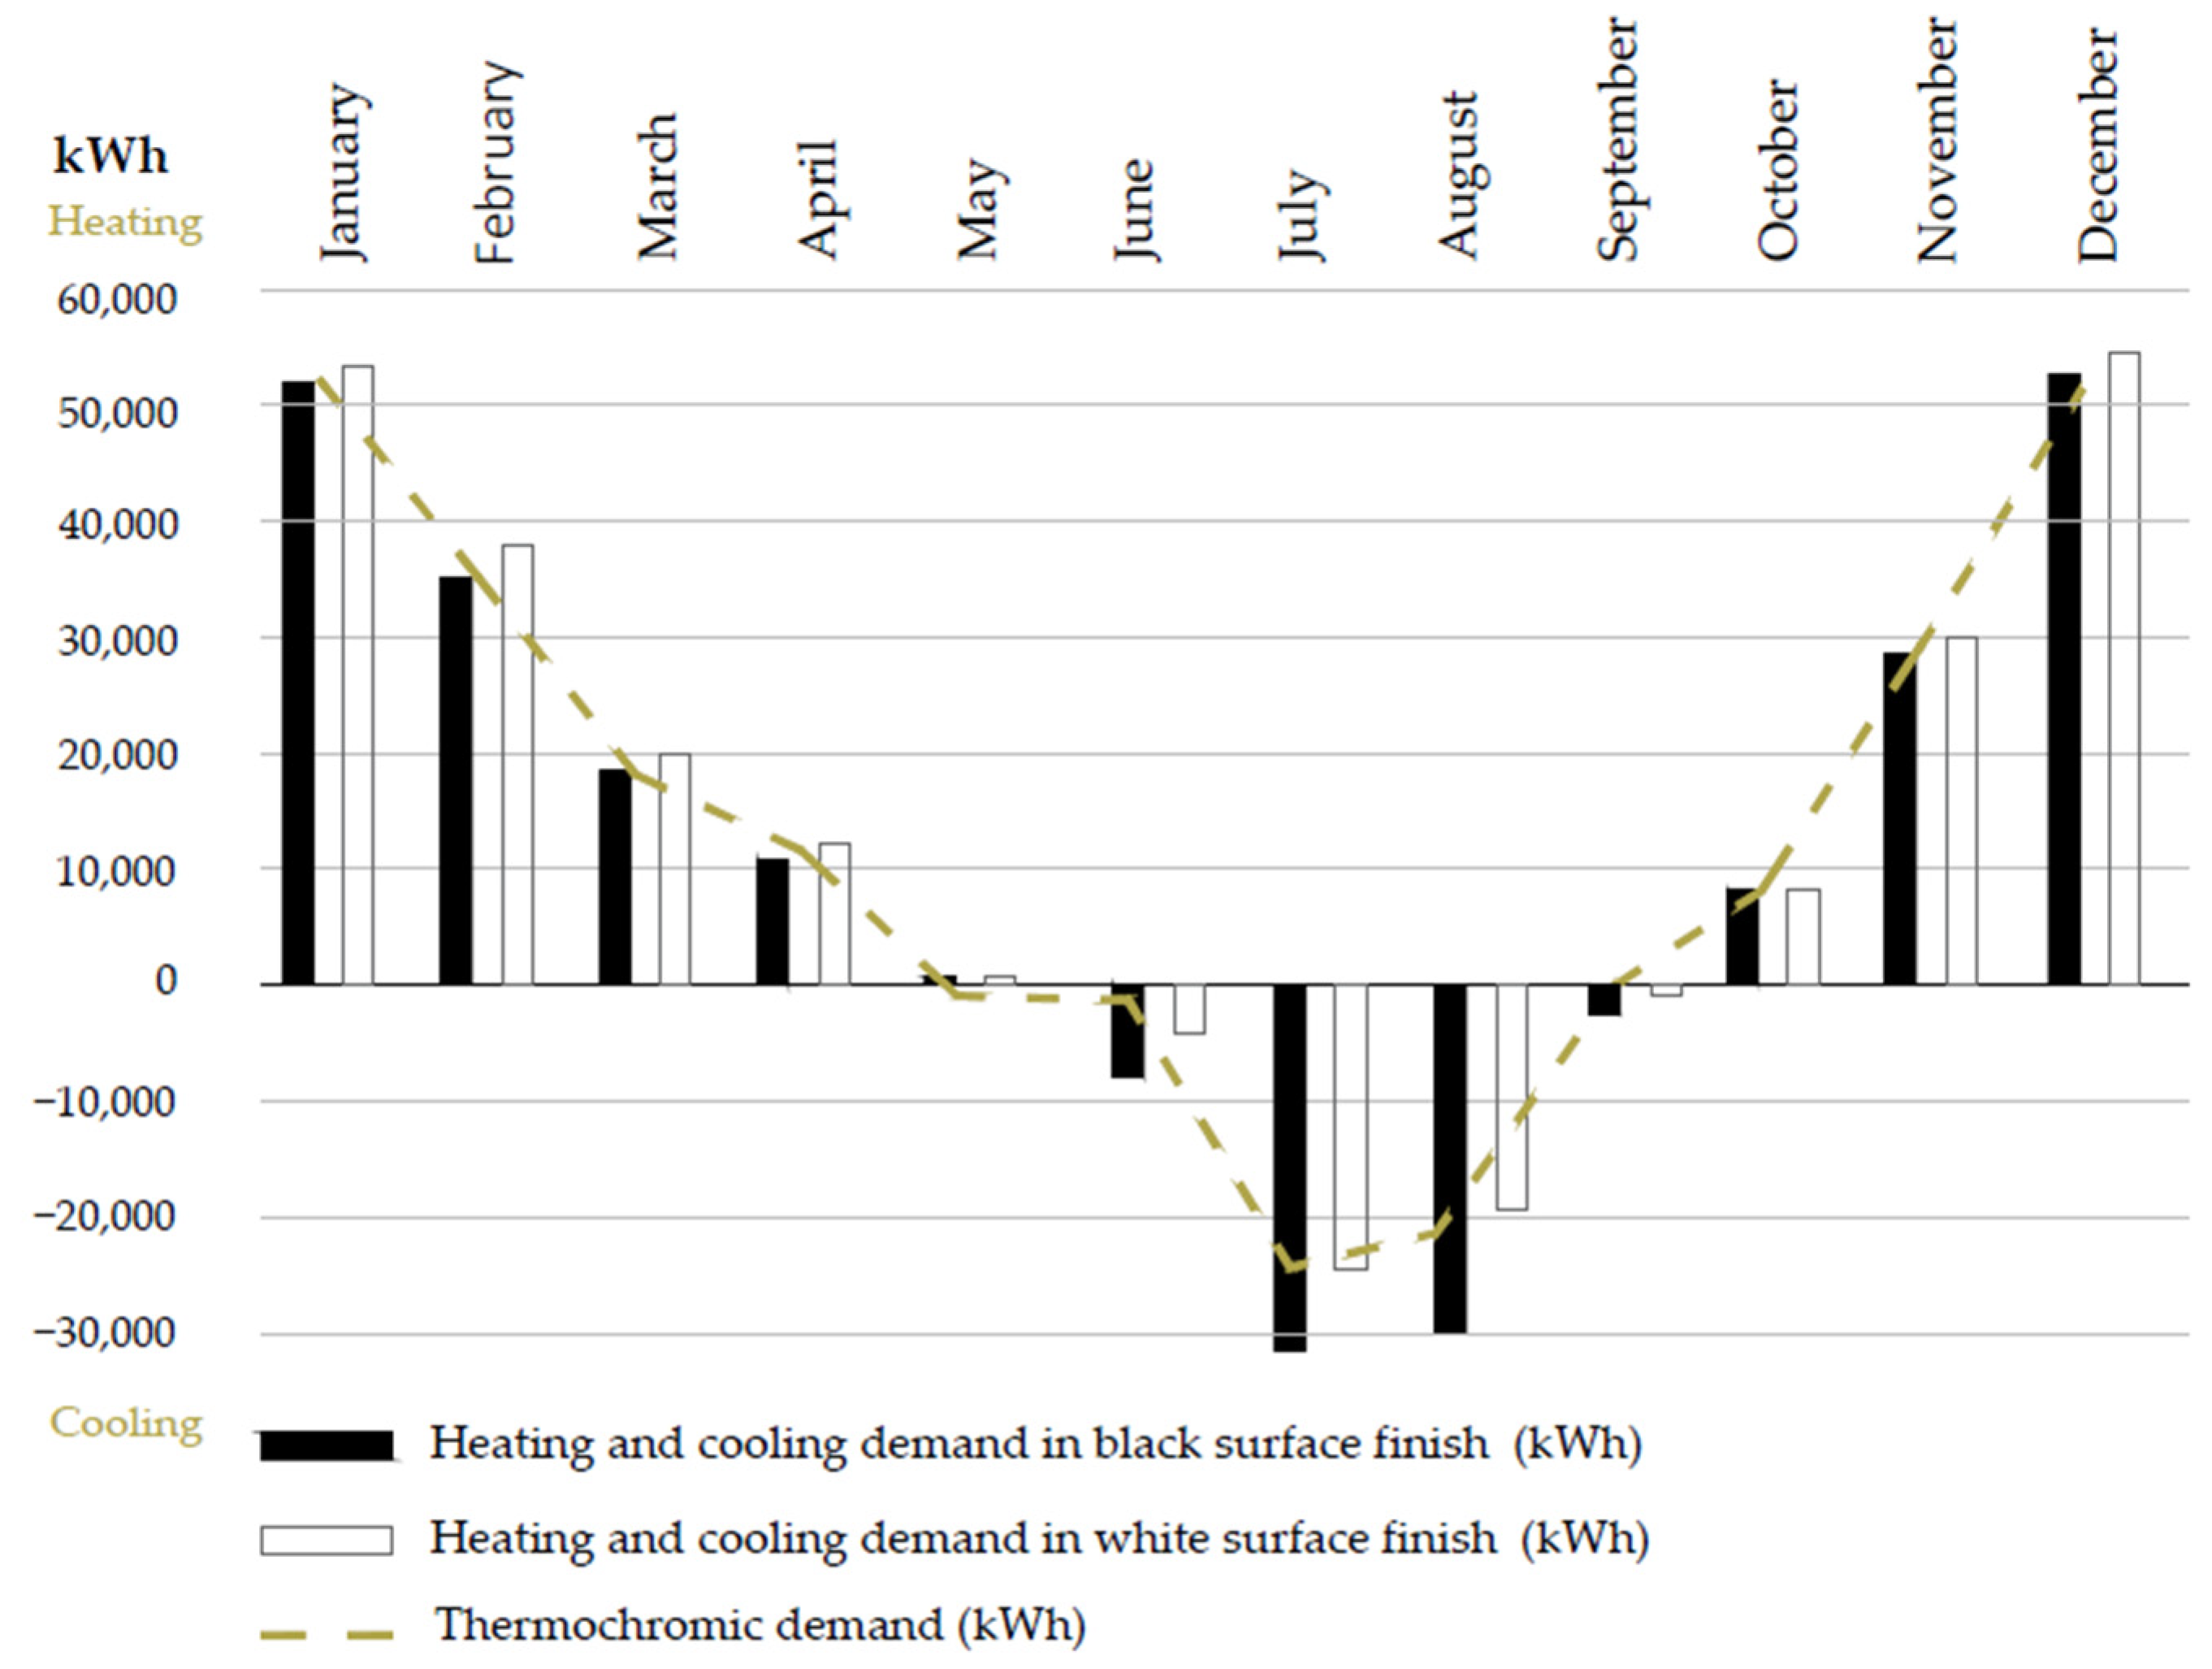
In
Figure 6, for a white surface finish, the heating demands were higher for the months of September–May, while for the months of June–August, the cooling demands were lower. Therefore, thermochromic materials would work from September to May with a black surface finish, and from June to August with a white surface finish.
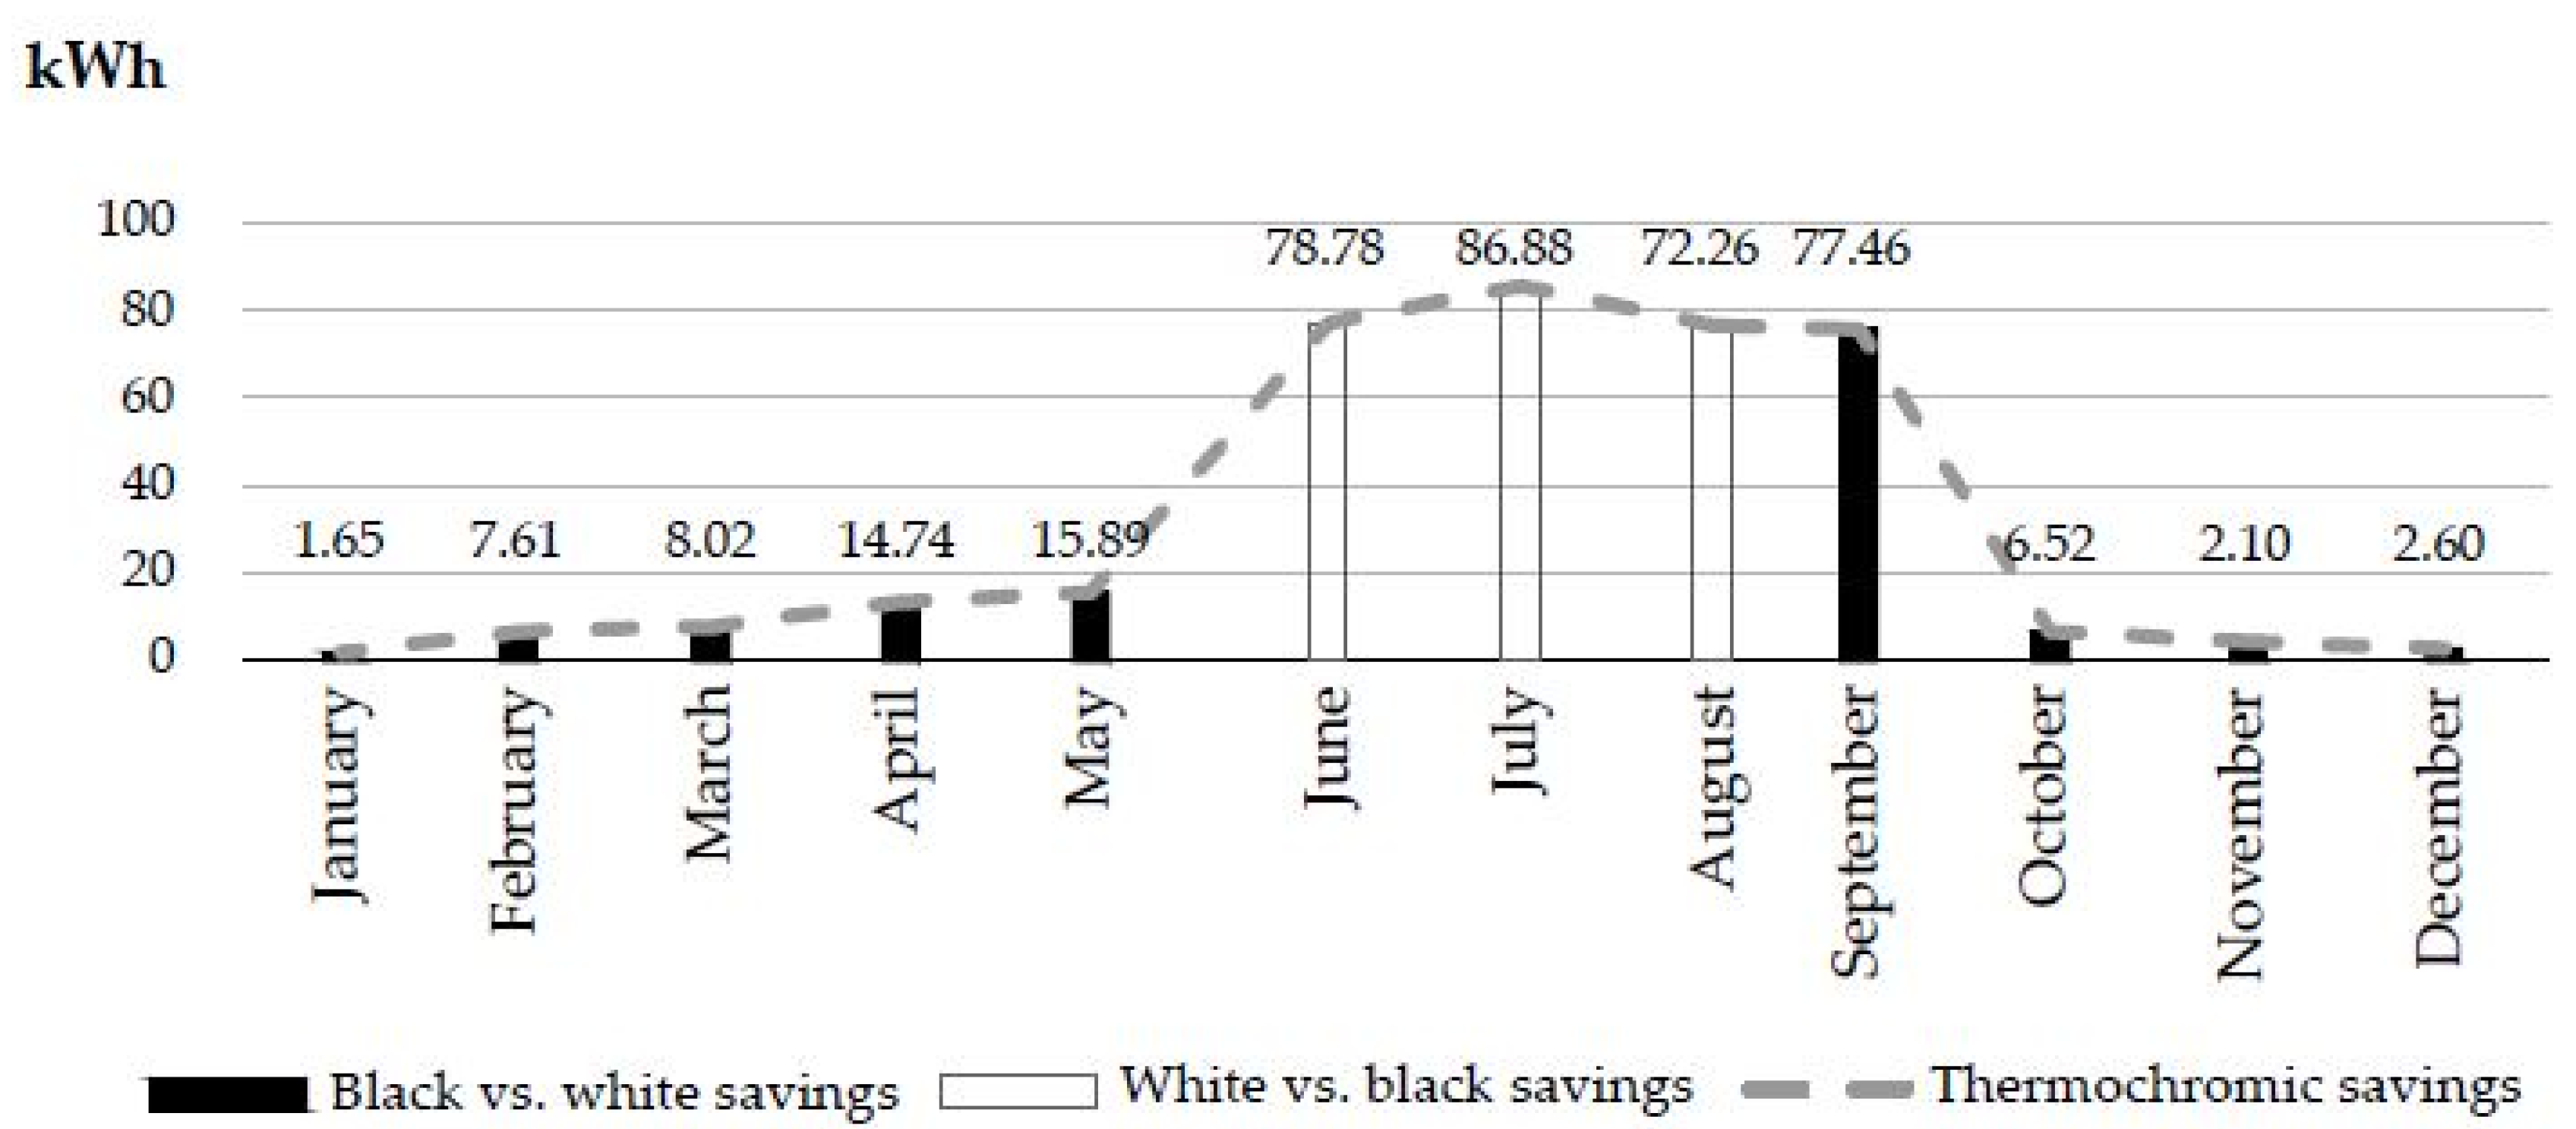
Although
Figure 7 shows that the percentage of savings was higher than 70% in September and June, the monthly demands were very small compared to the total. This is why the application of thermochromic materials would achieve energy savings in the months of July and August, with approximately 77% of the color changed to white. In the months of September–May, a black surface finish would be preferable, with a savings range from 1.65% in January to 15.8% in May.
3.2.2. NBE-79 Assessment of Monthly Demand in the Madrid Climate Zone
It is observed from
Figure 8 that for the months of June–September, the demands for cooling were smaller with the white surface finish, while for the months of October–May the demands for heating were smaller for the black surface finish. This is why the thermochromic surface finish in Madrid should be white from June to September and black from October to May.
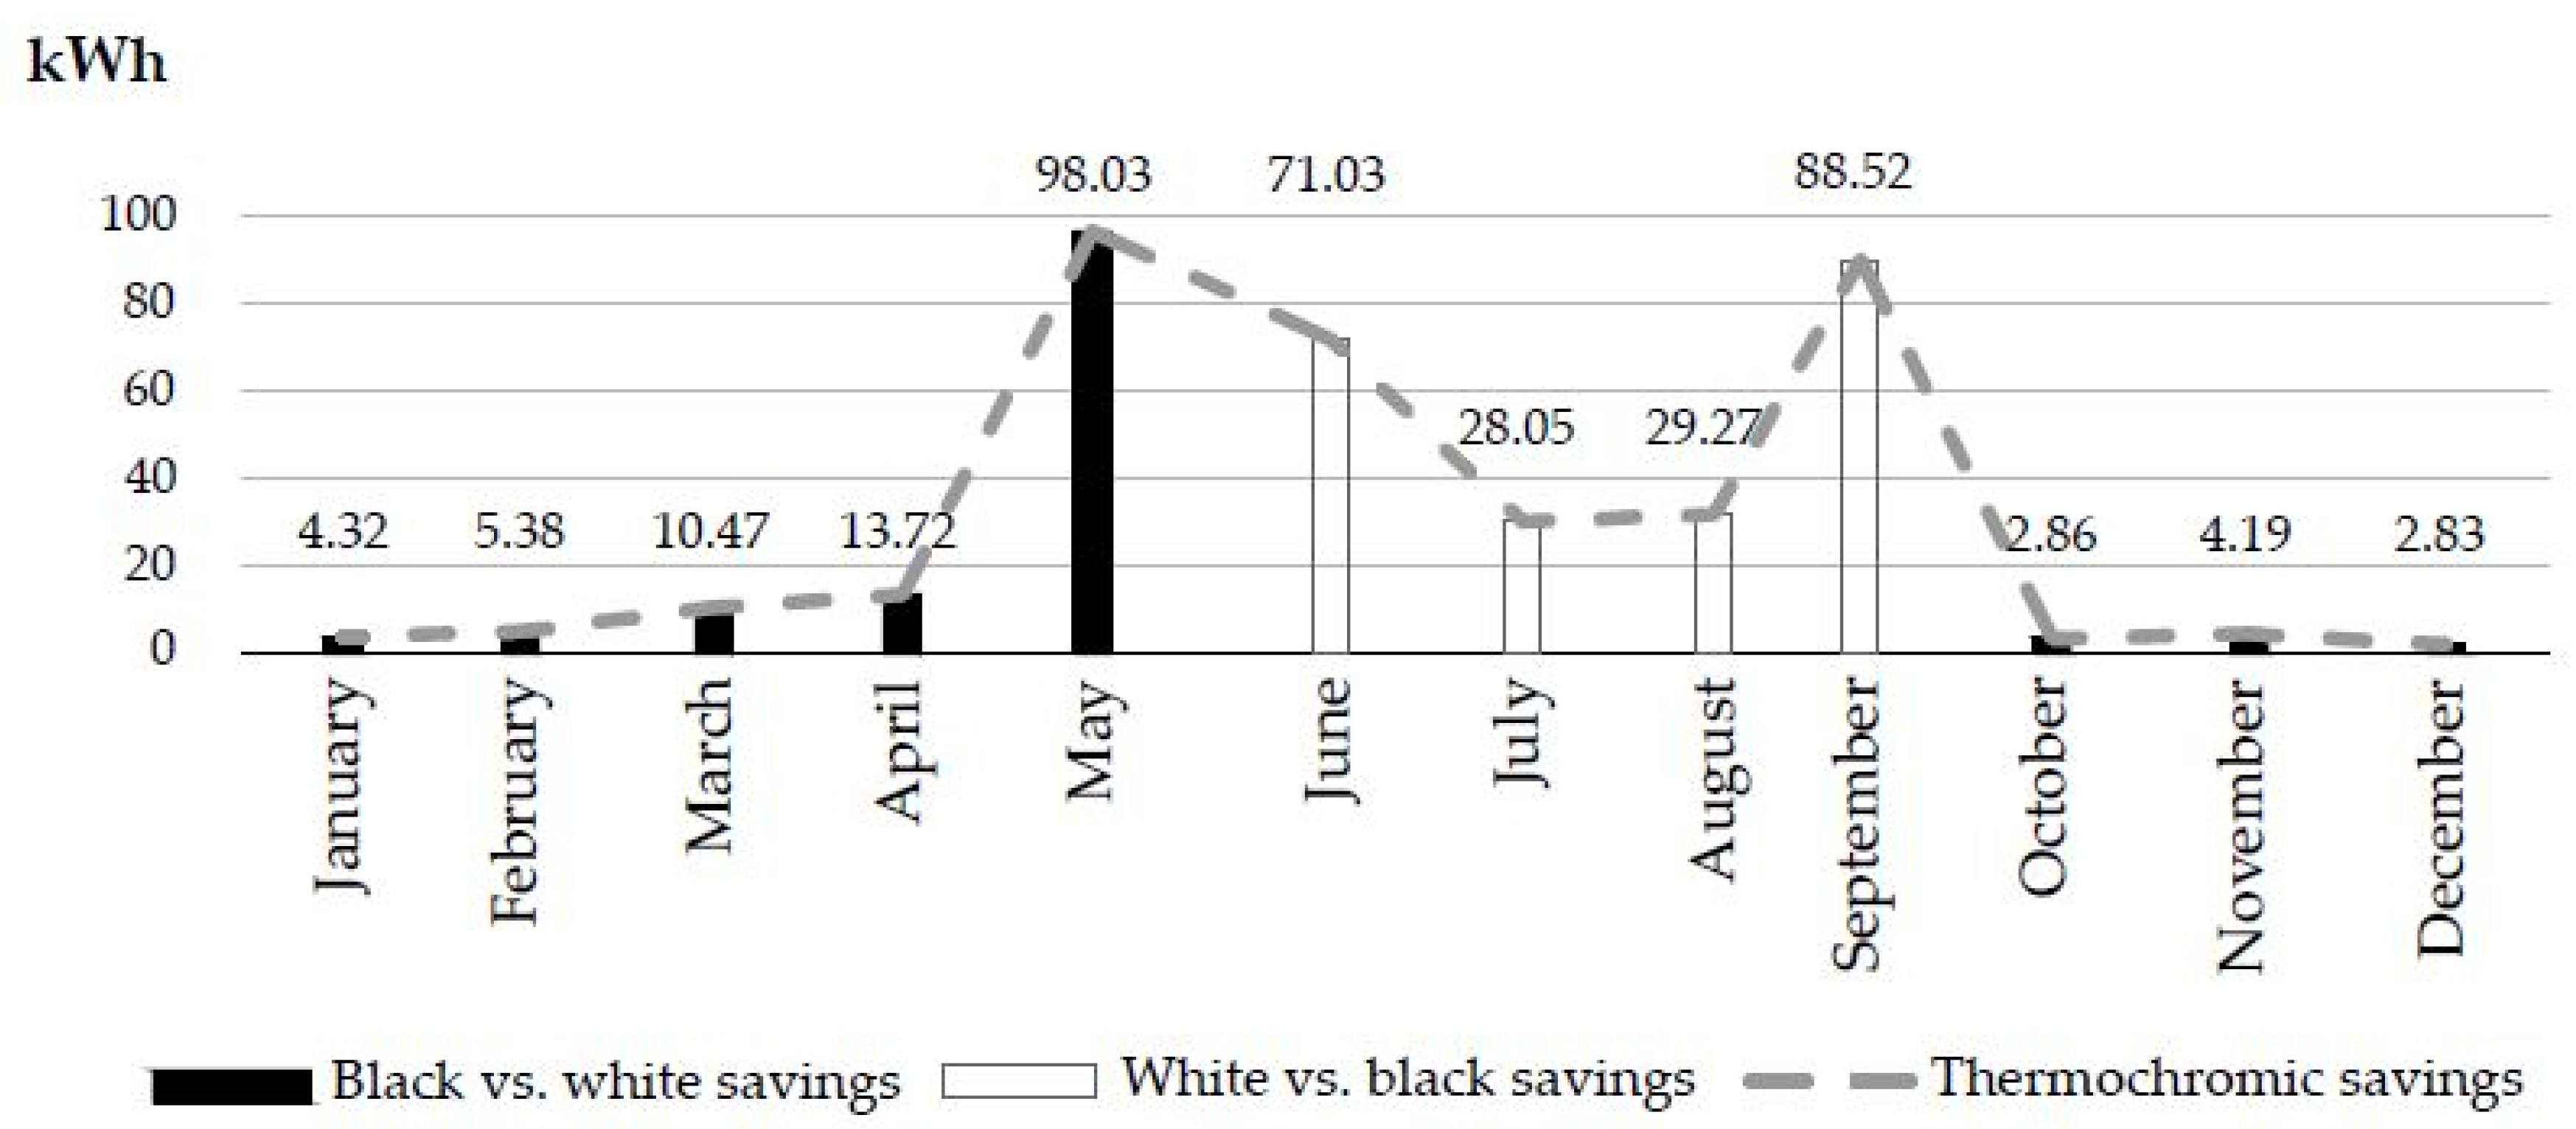
Although
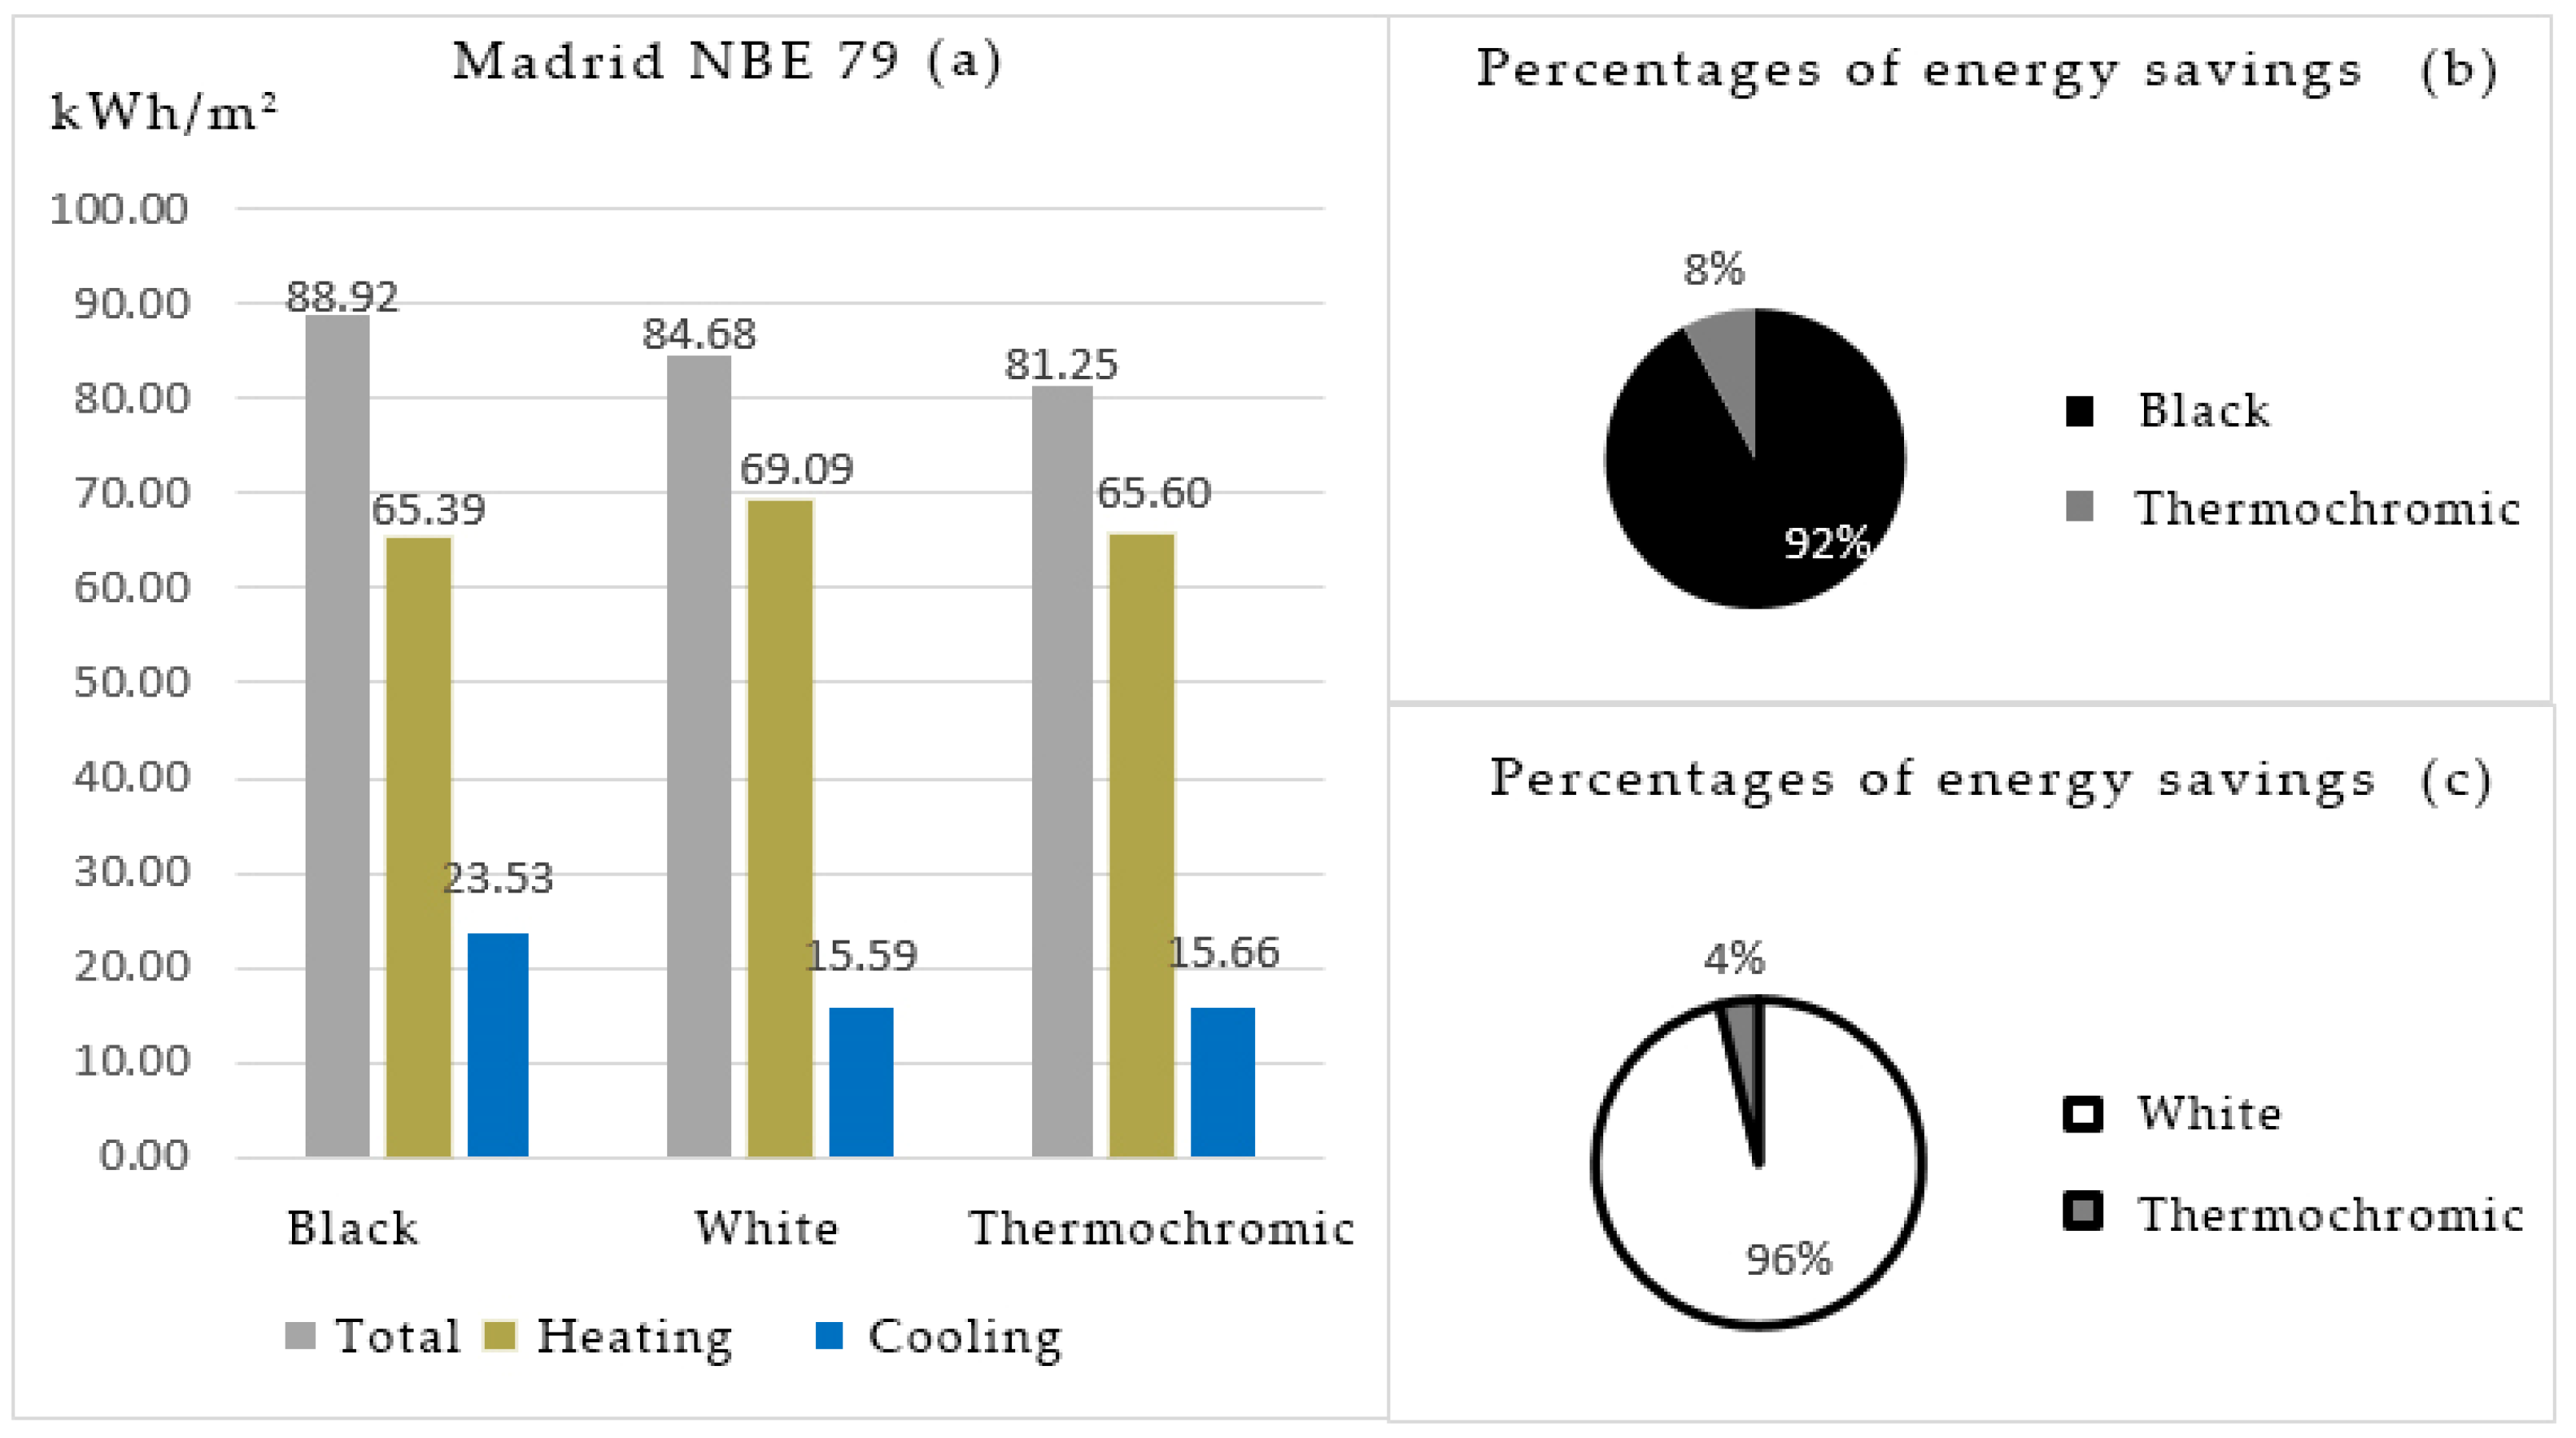
Figure 9 shows that in September and May, the percentage of savings was higher than 88%, the monthly demands were very small compared to the total. This is why the application of thermochromic materials would achieve energy savings in the months of July and August, with almost 30% color changed to white. In the months of October–May, a black surface finish is preferable, with a savings range from 2.86% in October to 13.72% in April.
3.3. Annual Simulations with Thermocromic Surface Finishes
Below is a summary of annual heating and cooling demands for each case study in the two CZs with black, white, and thermochromic surface finishes.
After analyzing the monthly application, it is interesting to understand what happens annually with different thermal transmittance values. For this reason, below are summaries of the annual demands for the three cases, i.e., a black, a white, and a thermochromic surface finish.
In this case, the thermochromic surface finish was not simulated but was instead based on the union between the black surface finish in the months with lower demand for heating and the white surface finish in the months with lower demand for cooling.
3.3.1. Evaluation of the Annual Demand in the Barcelona Climate Zone
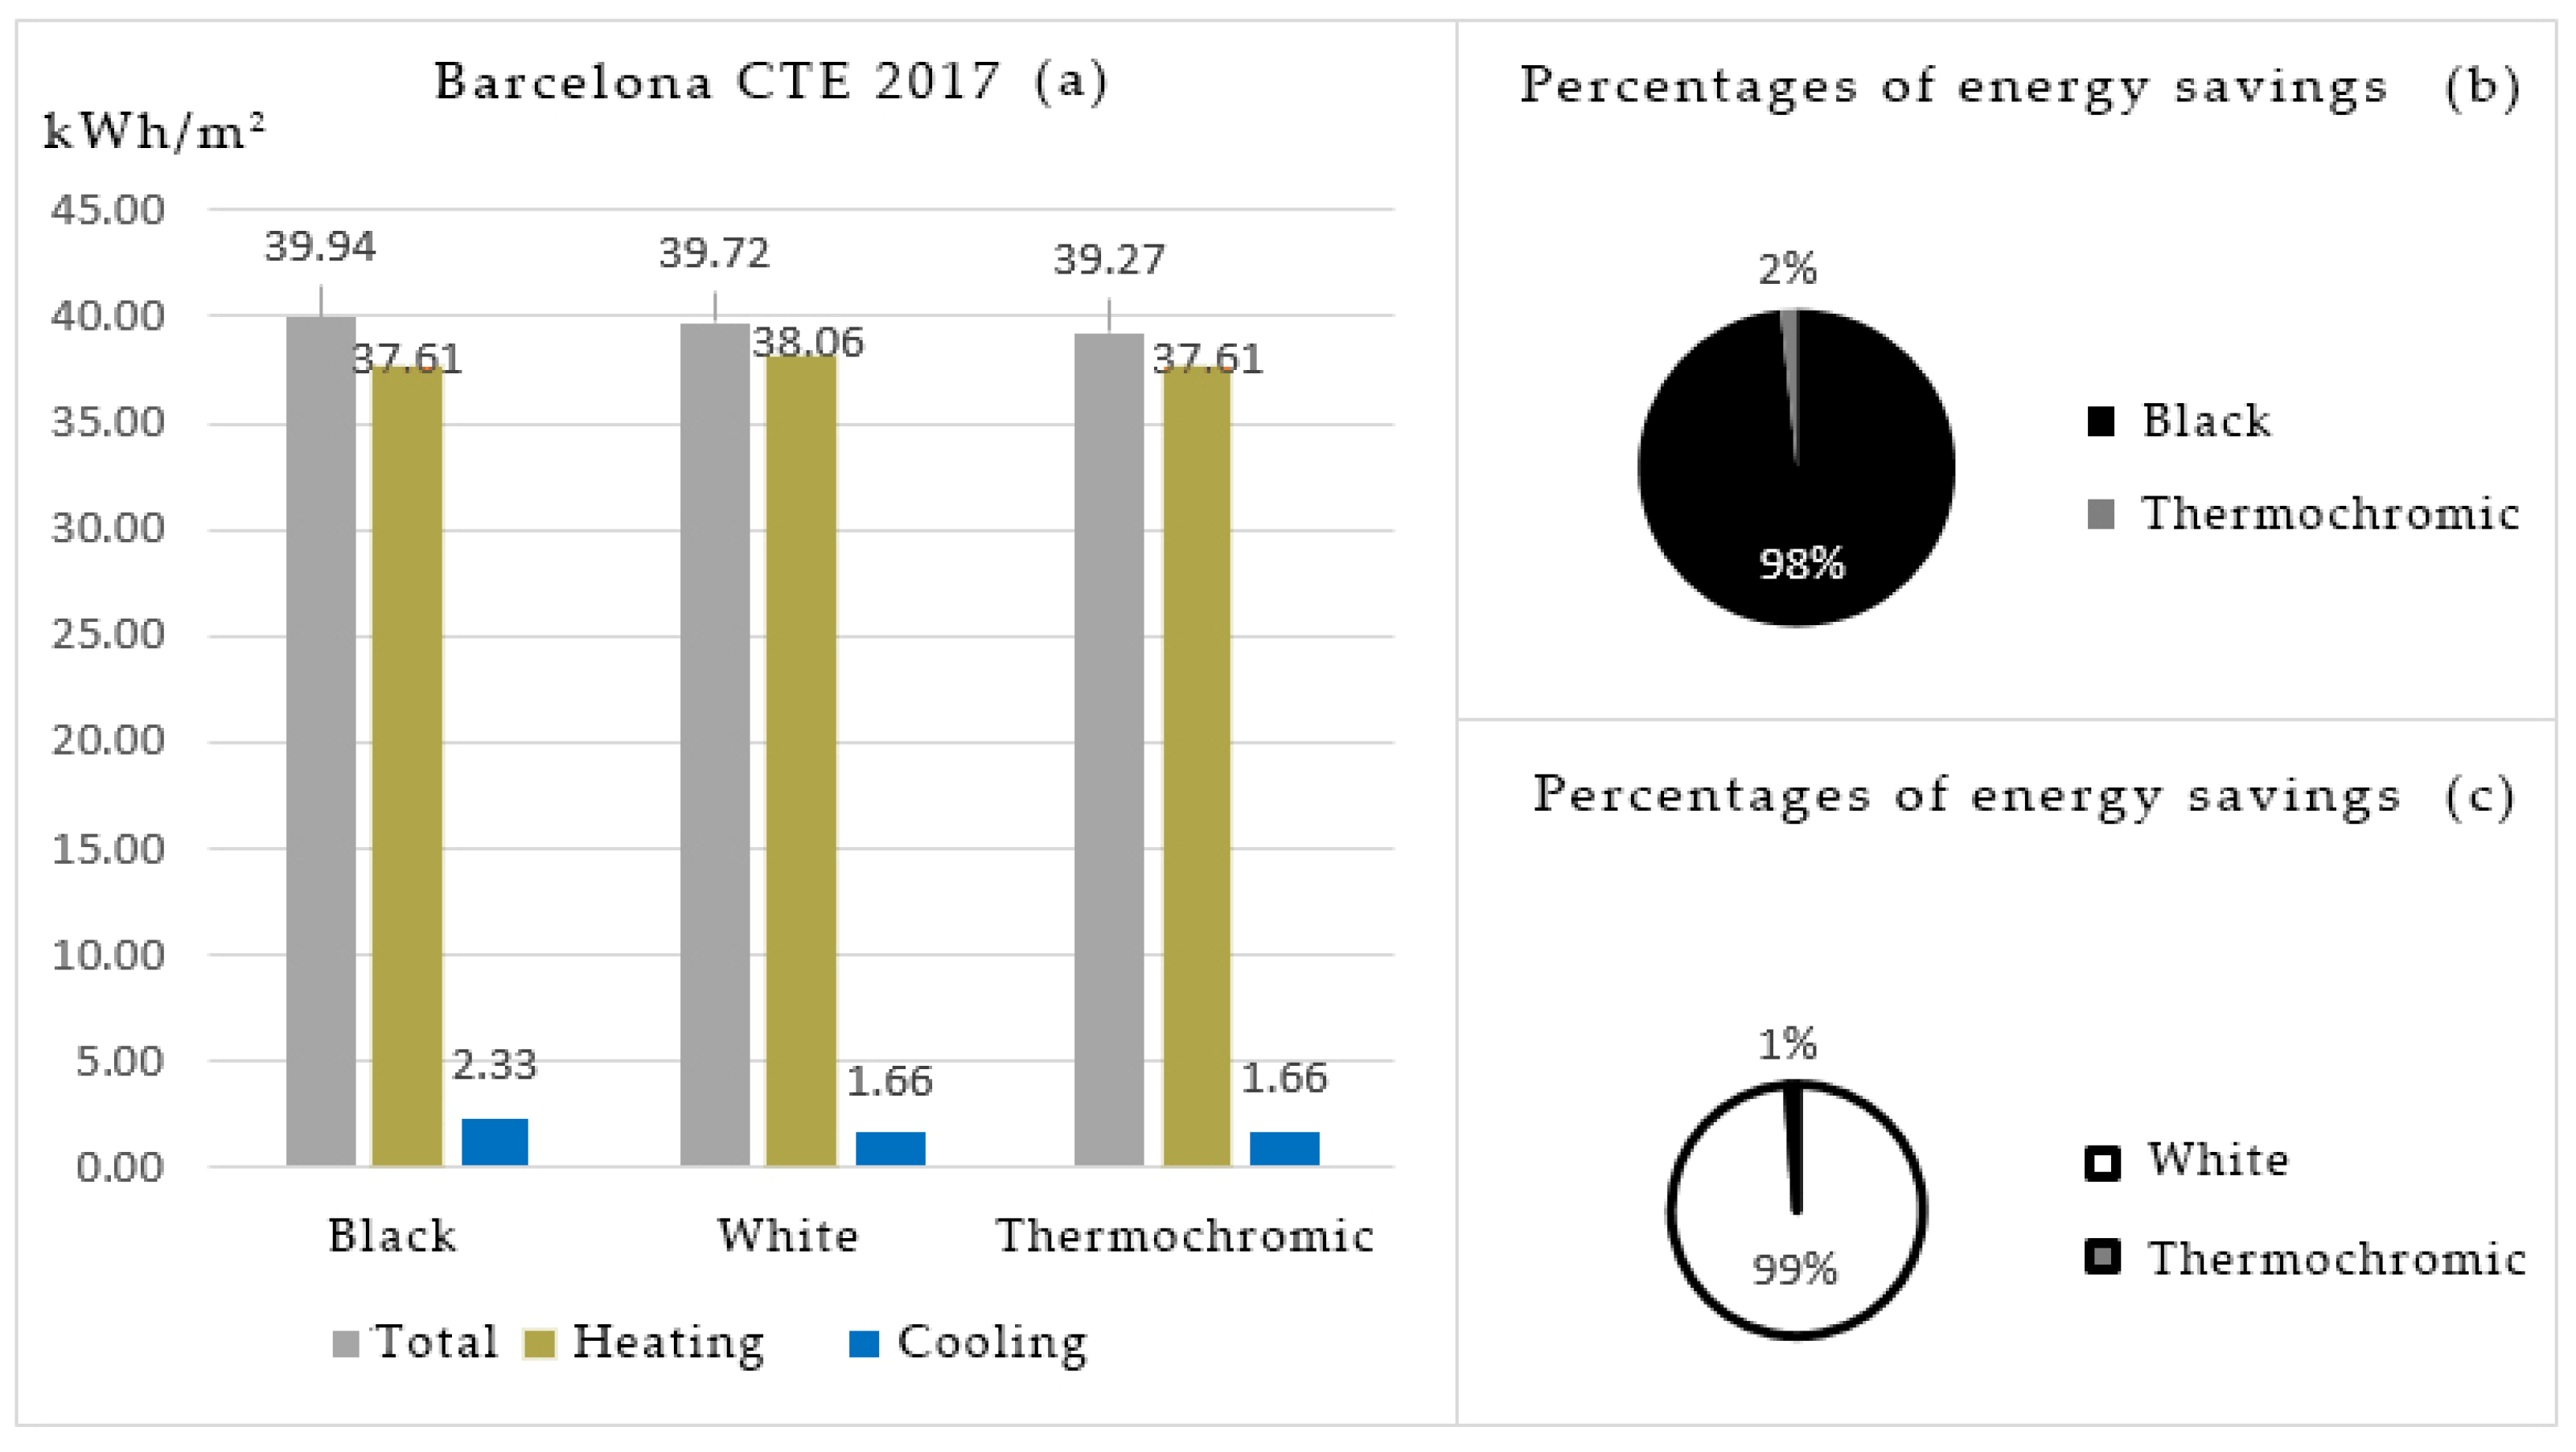
As expected, the case of the thermochromic surface finish had a lower demand than the others. To be more precise, this represented a saving of 1% with respect to the white surface finish and 2% with respect to the black surface finish for transmittance values of 0.23 W/m2 K in the case of CTE 2017.
These a priori values seem very small, but the 1% reduction in demand for this case was 1436.2 kWh, which translates into 531.4 kg of CO
2, which equals the annual CO
2 absorption of 27 trees [
47]. Thus, a small percentage of savings could become of significant value if global repetition was added (
Figure 10).
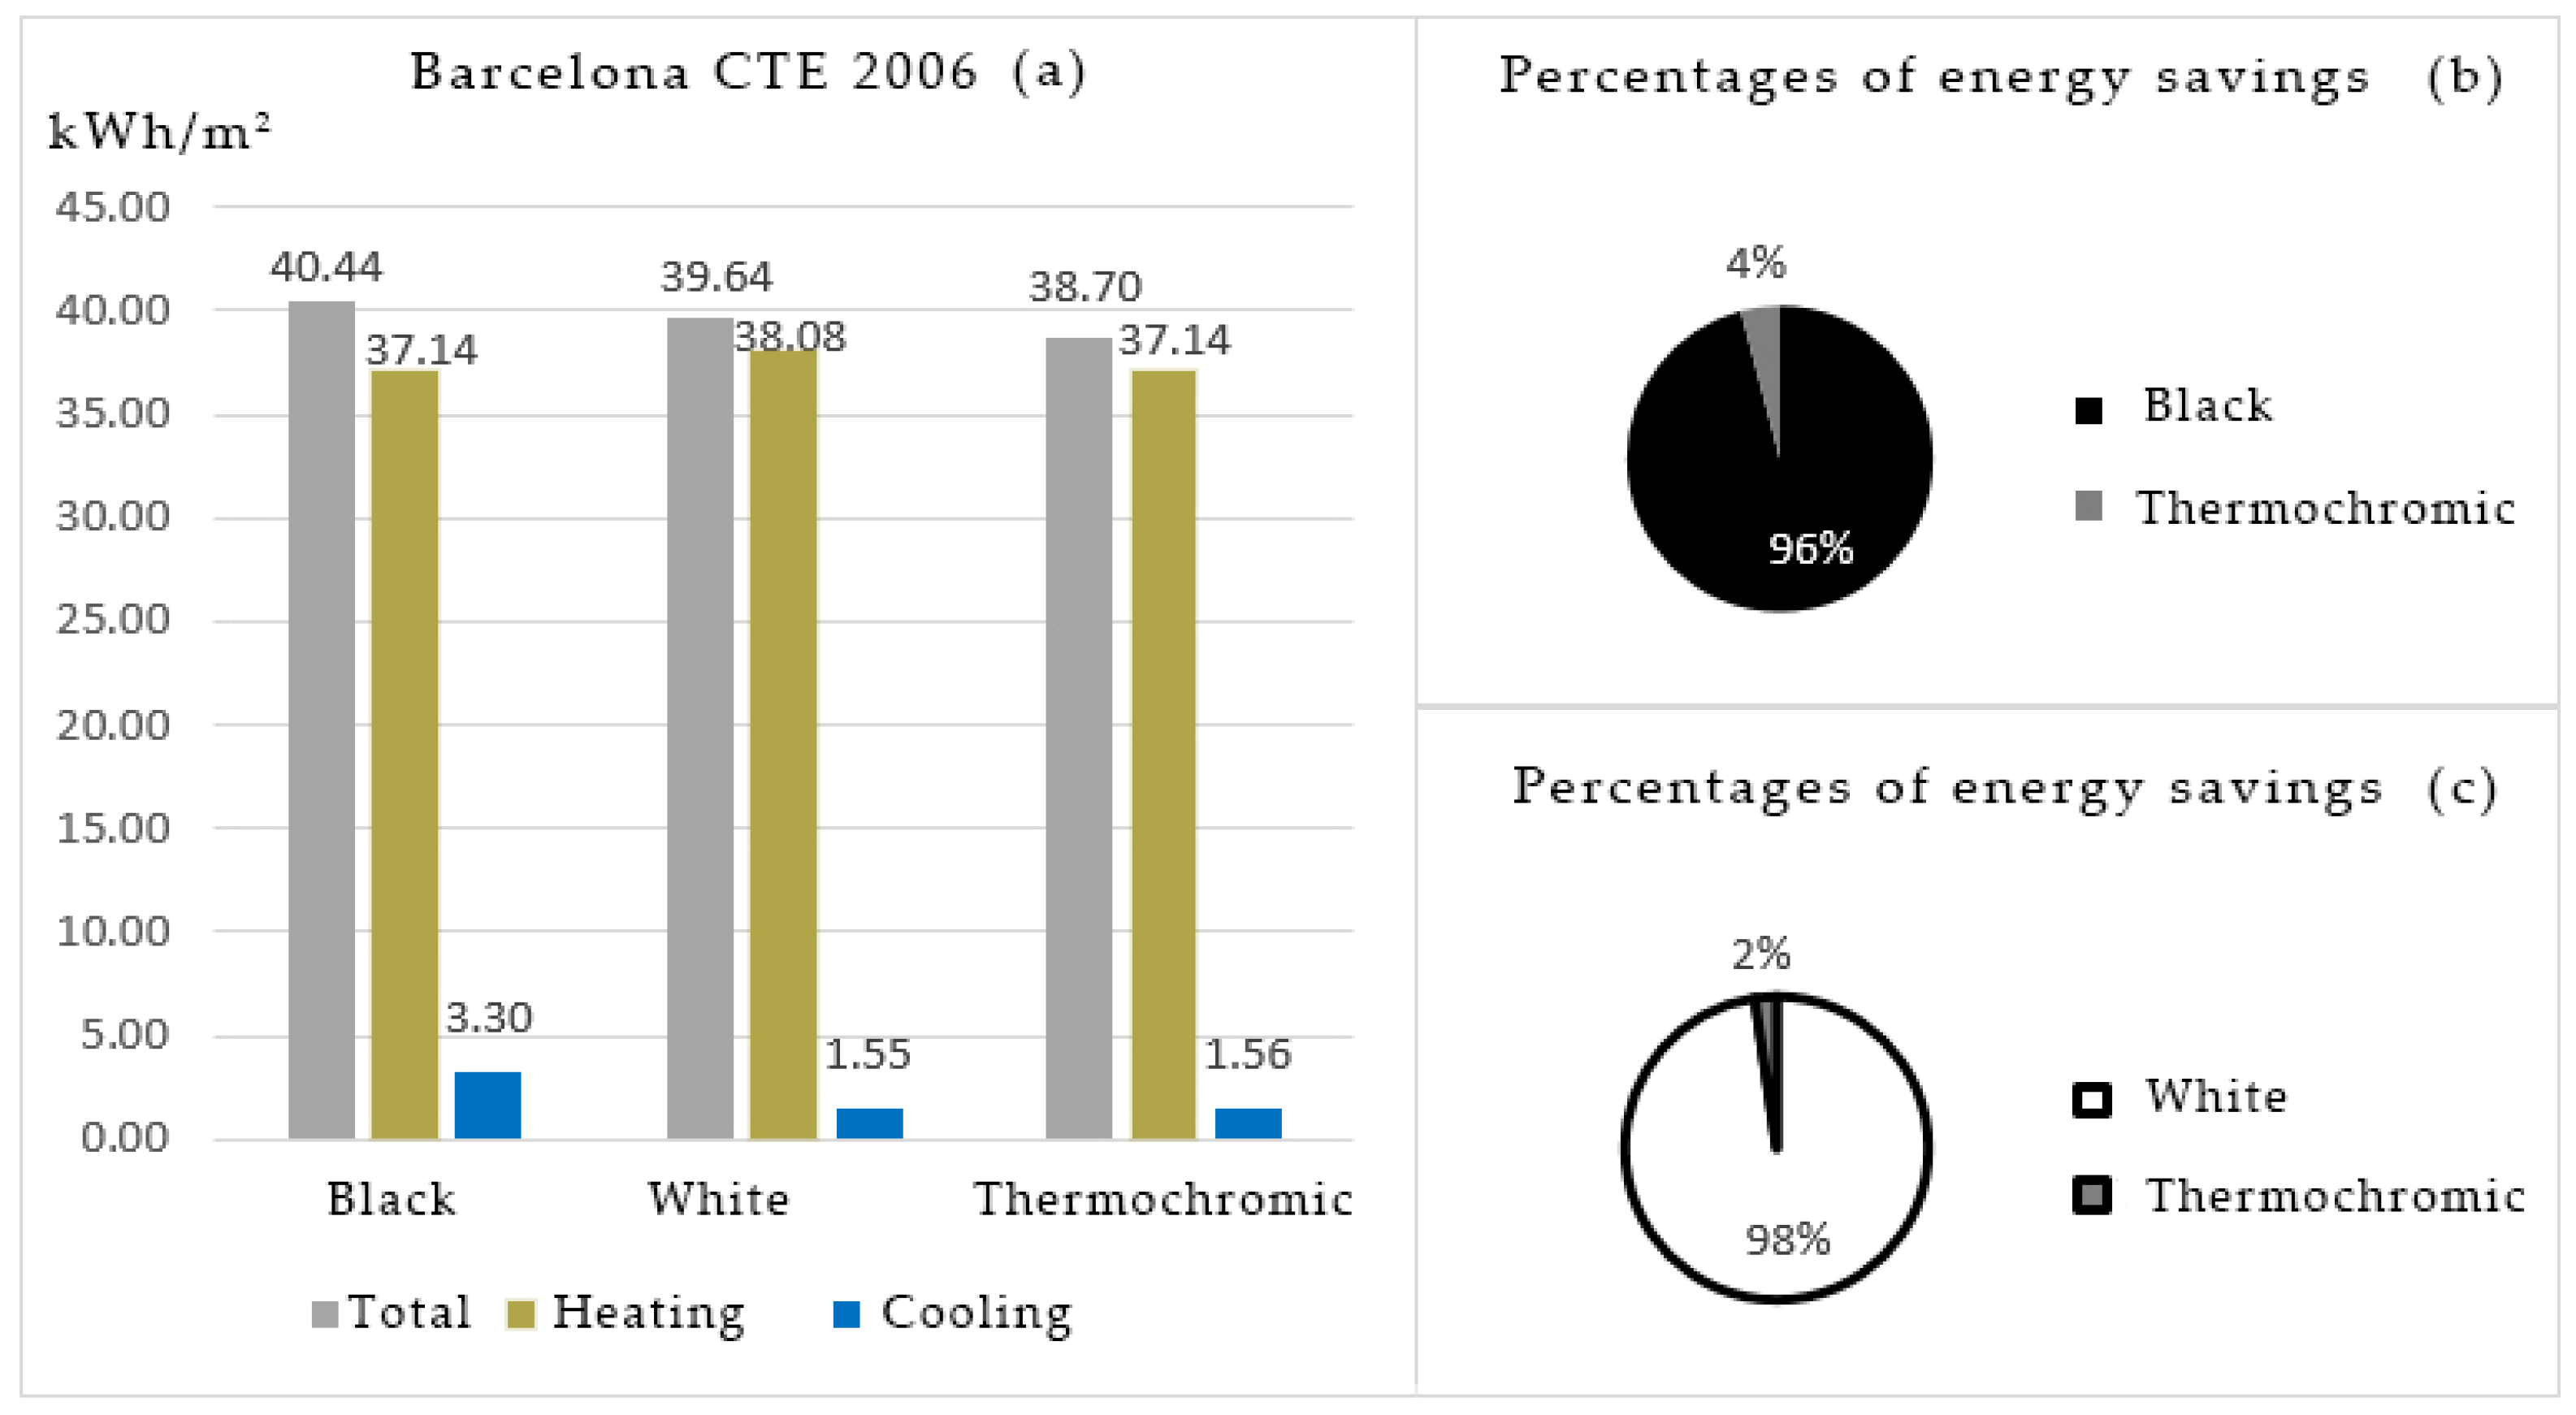
The energy savings for a thermal transmittance of 0.53 W/m
2 K (CTE-2006) increase in both cases, i.e., the energy-saving of the thermochromic material with respect to a black surface finish was 4%, and with respect to a white surface finish was 2% (
Figure 11).
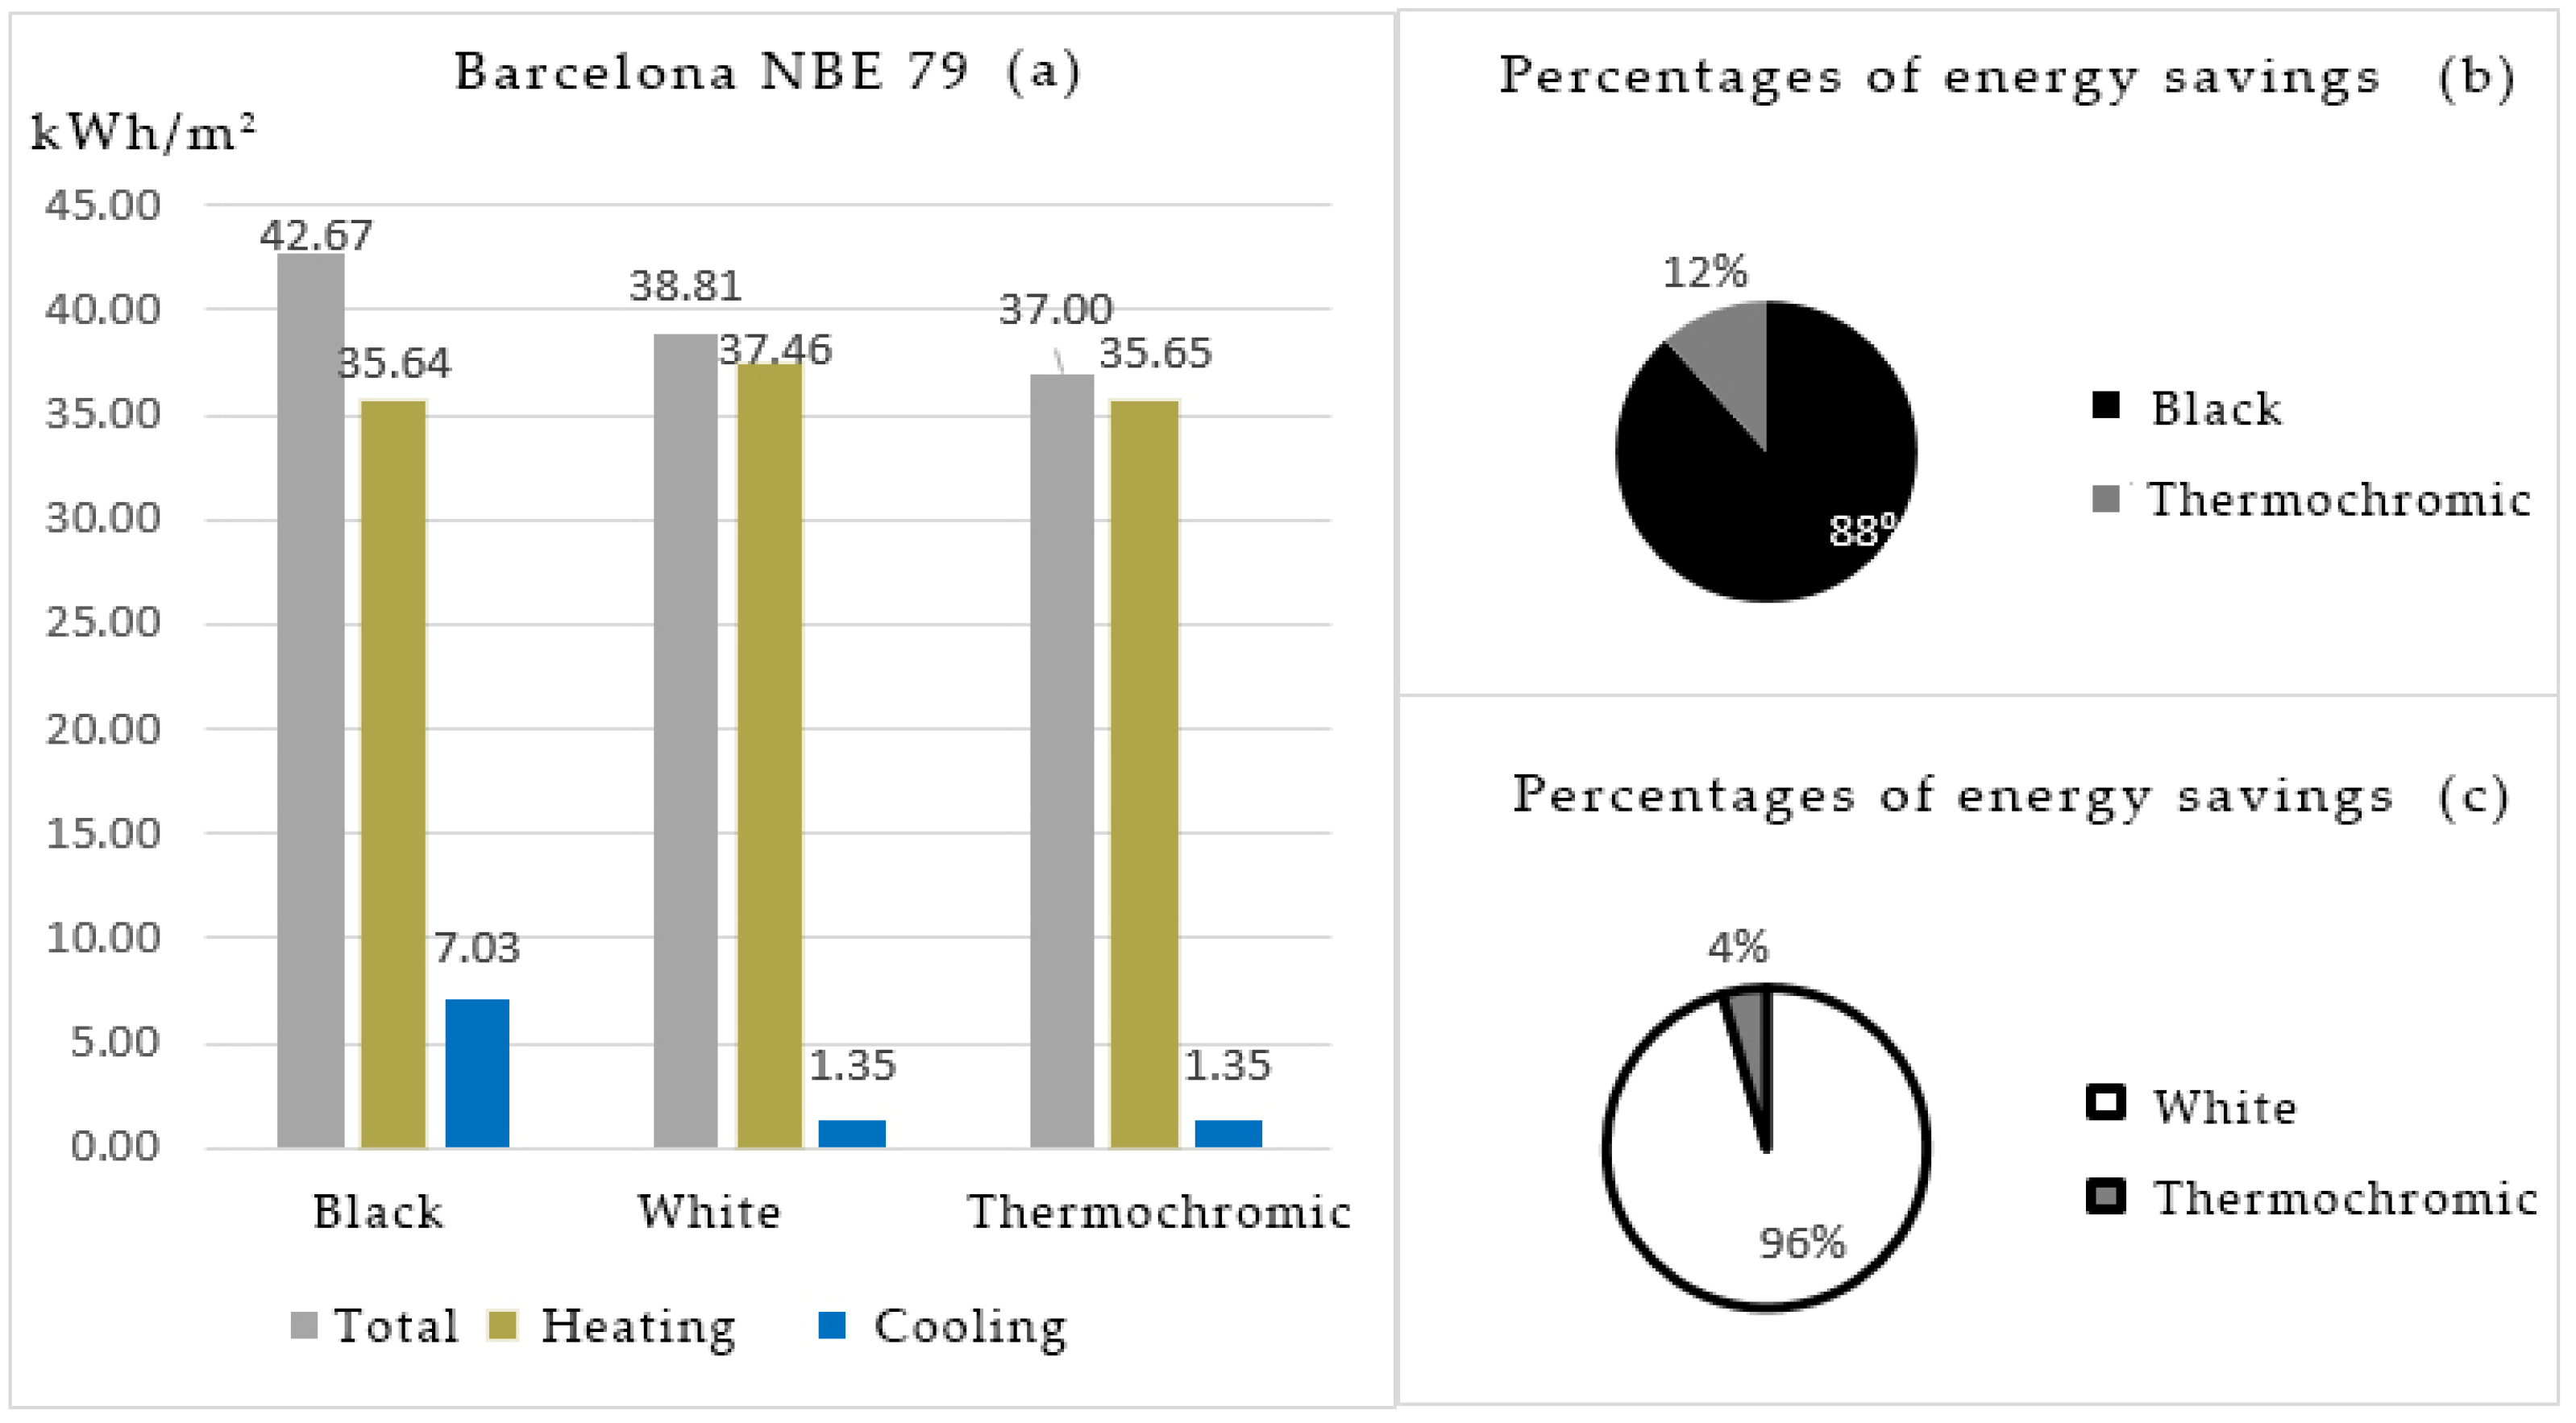
Finally, in the case of a higher transmittance of 1.2 W/m
2 K (NBE-79), there were more energy savings (which is an important fact to consider for the existing building stock): 12% for a black to thermochromic finish and 5% for a white to thermochromic finish (
Figure 12).
Therefore, the scope of thermochromic materials can be intuited as having some competitiveness in energy rehabilitation for buildings with transmittance values similar to those in NBE-79.
3.3.2. Evaluation of the Annual Demand in Madrid Climate Zone
In the CZ of Madrid, the demands with respect to Barcelona were higher, almost double. The application of a thermochromic surface finish meant a saving of 1% compared to the white cover and 2% compared to the black one for transmittance of 0.22 W/m
2 K (CTE 2017). The 1% of saving was equivalent to 2220.91 kWh, which is 821.7 kg of CO
2 equivalent to the annual CO
2 absorption of 41 trees (
Figure 13).
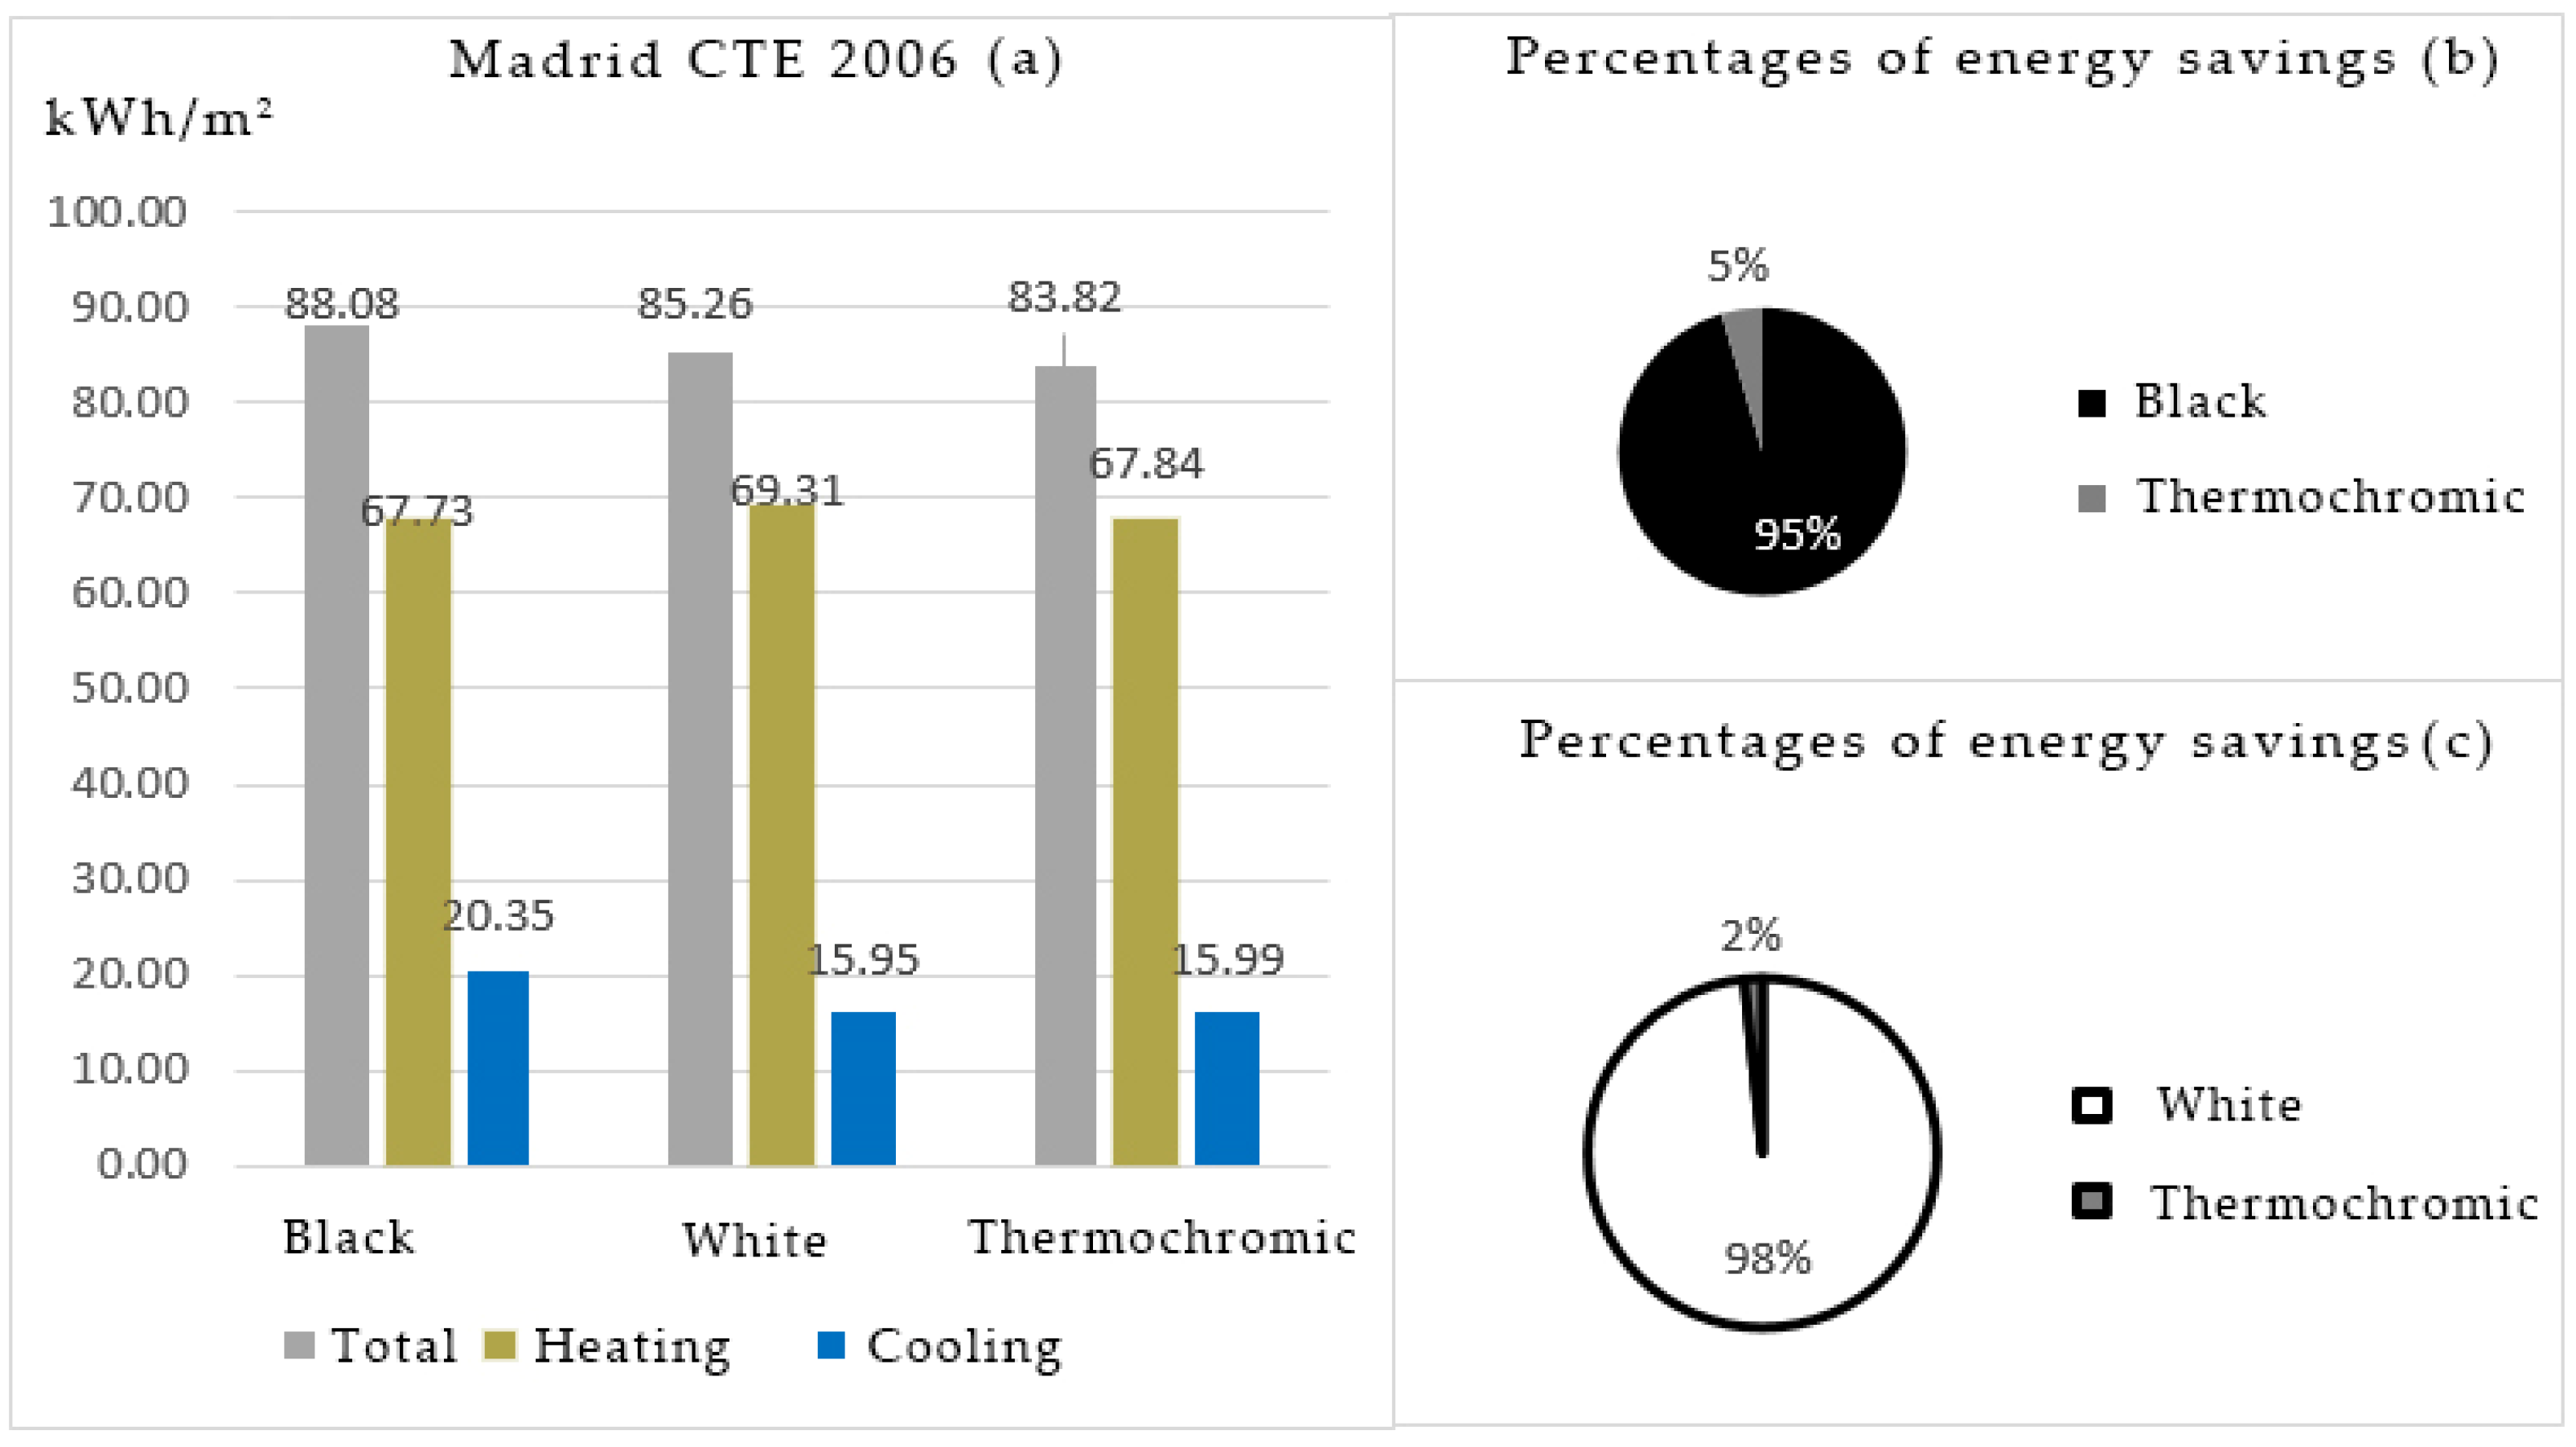
For the case of transmittance, 0.49 W/m
2 K (CTE-2006) increases the savings in both cases. The energy savings of the thermochromic material with respect to a black surface finish was 5%, and 2% with respect to a white surface finish (
Figure 14).
In the case of transmittance, 0.77 W/m
2 K (NBE 79) the energy savings of 8% was achieved using a thermochromic finish with respect to a black one, and 4% with respect to a white one (
Figure 15).
Although it seems a priori that the case of Madrid had a lower percentage of energy savings than Barcelona, its savings in absolute value were greater than those of Barcelona. In
Table 7, absolute values of the annual energy savings can be observed for each case of the study. For example, in the case of Barcelona NBE-79, energy savings values between 18,245.16 kWh and 5823.50 kWh were achieved, while in Madrid NBE-79 the highest energy saving value was 24,689.35 kWh.
Each year the price of energy increases in Spain. For this reason, the economic savings of the thermochromic application was considered. According to data from “Red Eléctrica de España’’ (Spanish Electrical Network), the price of energy for non-domestic consumers is 0.1137 €/kWh (price accessed on 18 July 2019). In the most favorable case (Madrid NBE-79) the values of the economic savings would amount to 2807.20 €/year.
Changing color according to the temperature suggests the possibility that within the same day further optimization of the energy performance could be achieved. This means that the material would not only change from one color to another from winter to summer but in intermediate seasons would be adapted. The advantage of thermochromics is that they change color with external input, without additional effort. That is why it is important to determine and specify the transition temperature so that economic investment is even more justified.
3.4. Daily Simulations for Black and White Surface Finish
In this chapter, in which range of temperatures the color should change from white to black and vice versa will be discussed. The aim was to detect the transition temperature in each CZ and detect at which hour the color change would make the technology more efficient and reduce the energy demand.
In this type of material, the color-change temperature is very important, i.e., the temperature at which the material will change from one color to another. For this reason, it was necessary to analyze the behavior of the material by day.
The study case of Barcelona and Madrid for the NBE 79 regulations was considered, as they were the ones with the highest energy savings performance. At the same time, the hourly demands from 10:00 to 22:00 were considered, as they are the hours with the highest activity in the studied Building.
It should be mentioned that the studied days were the ones with the highest solar radiation for summer and winter. Therefore, the final energy performance values are not representative and daily values may change.
Needless to mention, the study cases were on Saturday, which was the day with the highest occupancy according to the studied Building.
3.4.1. Saturday, 9 January 2002, Assessment for NBE-79 in Barcelona Climate Zone
As mentioned above, to achieve more favorable energy performance for buildings in winter, the cover should be black; despite this, simulations by days were made to see the hourly influence of the thermochromic application.
It is observed in
Figure 16 that the energy savings for 9 January 2002 were achieved for a black surface finish. Therefore, energy savings of 2% were achieved for a black surface finish versus a white. However, if the figure is zoomed in, in the early hours of the morning, from 10:00 to 12:00 the demand was higher in the case of black surface finish. Although from 18:00, there was no solar incidence, there was still a benefit from the black color compared to white due to thermal inertia.
The surface temperature also changes according to the surface finish. As shown in the figure for black roofs temperatures between 12 and 25 °C were reached, while for the white roofs, between 11 and 17 °C.
3.4.2. Saturday, 3 August 2002, Assessment for NBE-79 in Barcelona Climate Zone
To achieve more favorable energy performance for buildings in summer the cover should be white. It is observed in
Figure 17, that the energy savings for 3 August 2002, were achieved for a white surface finish. Therefore, energy savings of 66% were achieved for a white surface finish versus a black. For this case, in summer, a black cover was not favorable at any hour.
It has been mentioned in a previous section that the monthly energy saving in August when changing from white to black was 72.26% (
Figure 7). For this case, 3 August 2002, the total savings when changing from a white to black finish were 66%, which means that on other days of the month the energy performance will be more optimal.
The temperature range between colors in summer changes compared to winter. As shown in
Figure 17 for black roofs, temperatures between 22 and 50 °C were achieved, while for the white roofs, between 22 and 34 °C.
Therefore, it is intuited that for the case of NBE-79 in Barcelona the transition temperature of the surface will be around 25 °C to achieve optimal energy performance in both summer and winter.
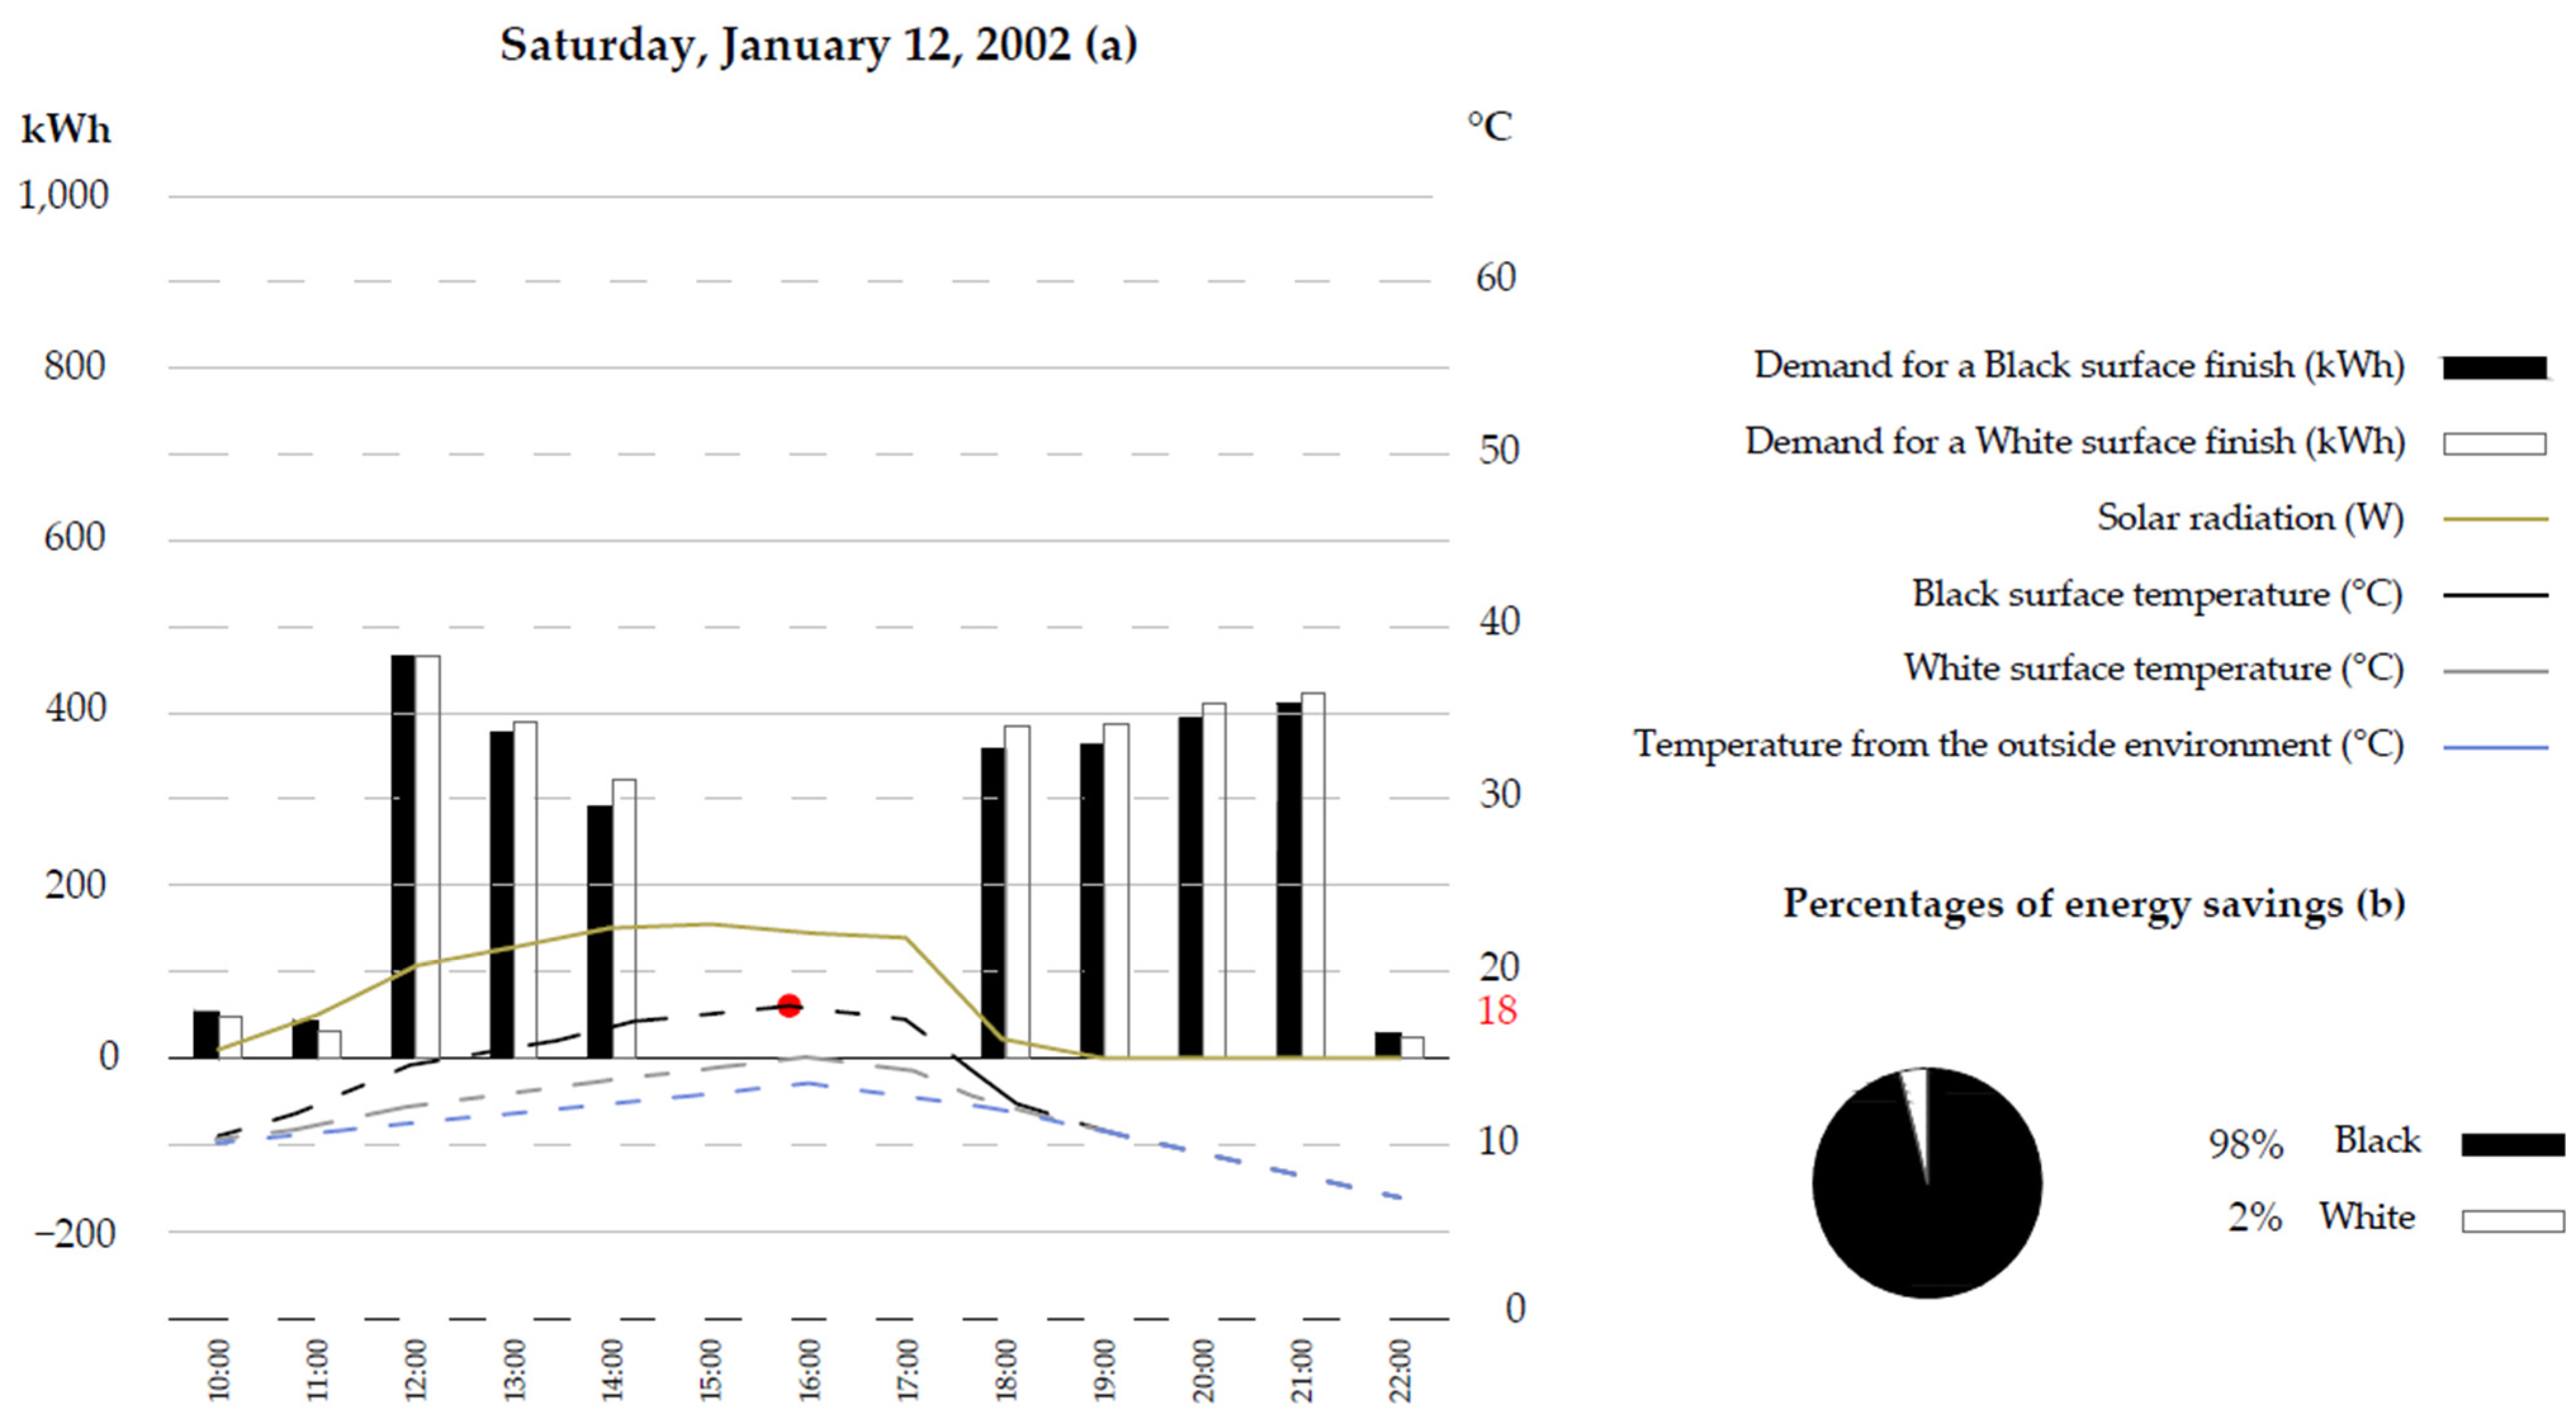
3.4.3. Saturday, 12 January 2002, Assessment for NBE-79 in Madrid Climate Zone
It is observed in
Figure 18, that the energy savings for 12 January 2002, were achieved for a black surface finish. Therefore, energy savings of 2% were achieved for a black surface finish versus a white. However, in the early hours of the morning, from 10:00 to 11:00 the demand was higher in the case of black surface finish. Although from 19:00 there was no solar incidence, there was still a benefit of black color compared to white due to thermal inertia.
As shown in the figure for black roofs temperatures between 10 and 18 °C were reached, while for the white roofs, between 10 and 15 °C.
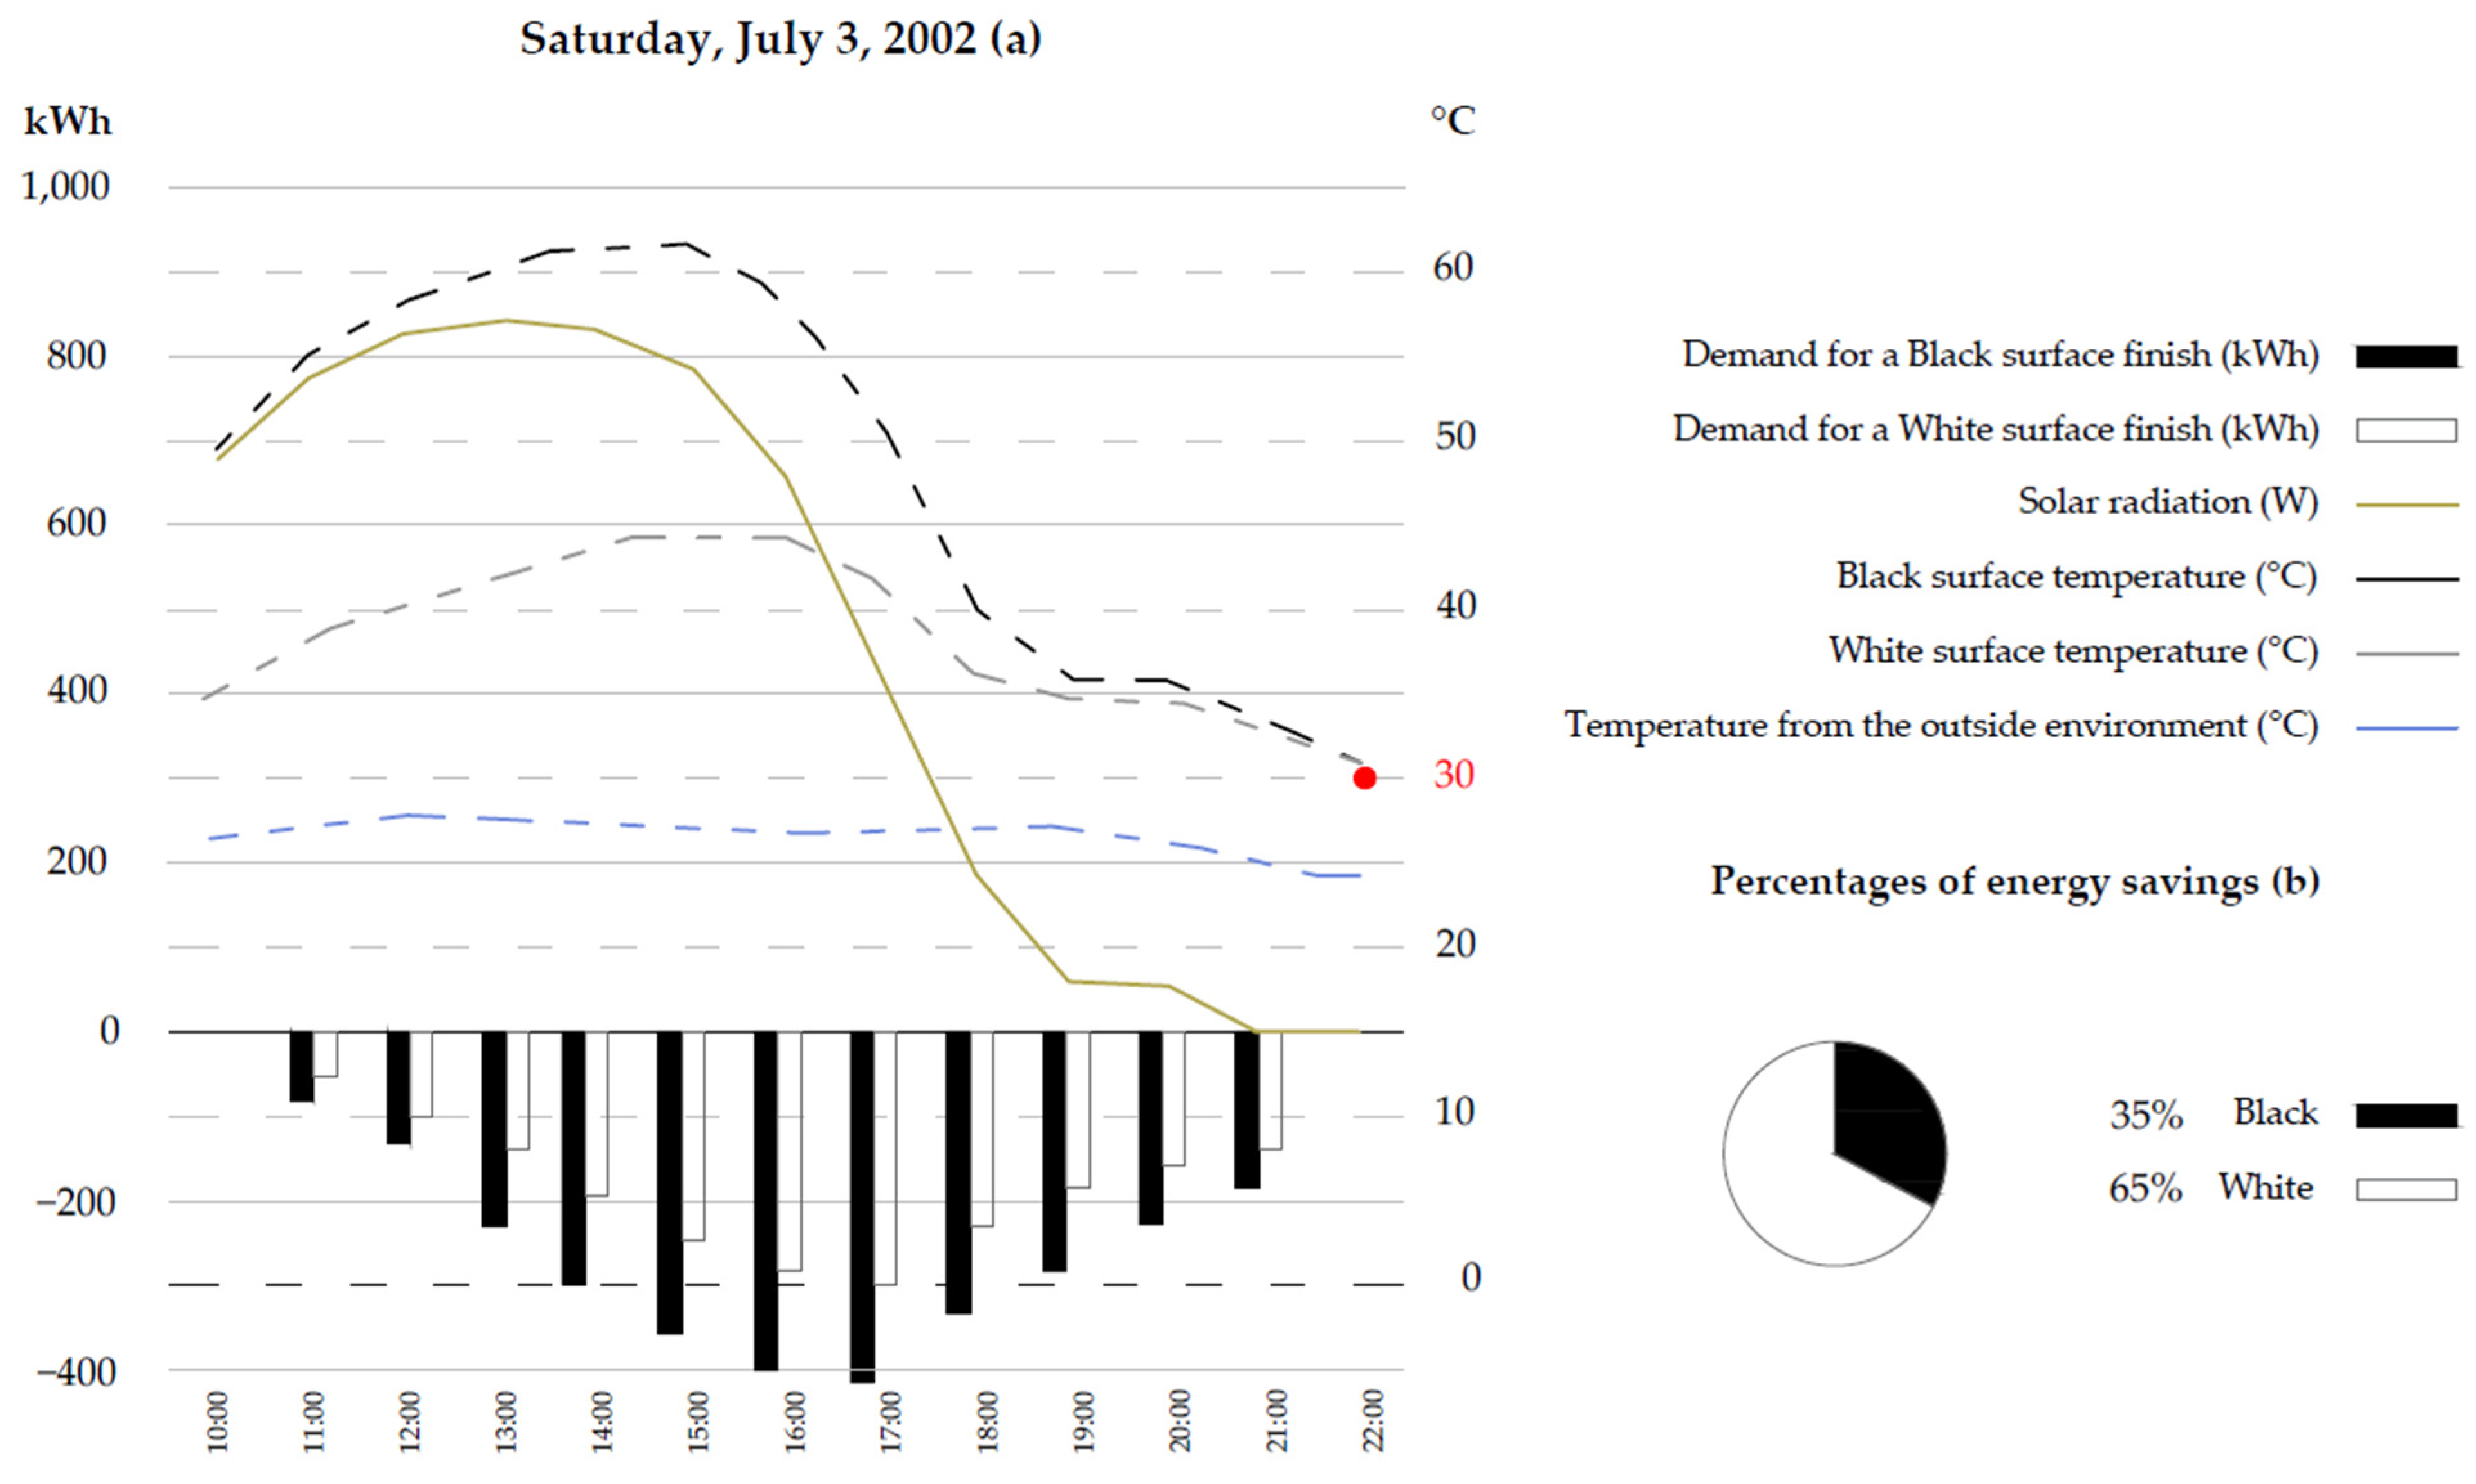
3.4.4. Saturday, 27 July 2002, Assessment for NBE-79 in Madrid Climate Zone
As mentioned above, to achieve more favorable energy performance for buildings in summer, the cover should be white. It is observed in
Figure 19, that the energy savings for 27 July 2002, were achieved for a white surface finish.
It has been mentioned in a previous section that the monthly energy saving in July when changing from white to black was 28.05% (
Figure 9). For this case, 3 August 2002, the total savings when changing from a white to black finish were 35%, which means that on other days of the month the energy performance will be less optimal. For this case, as in Barcelona, a black cover is not favorable at any hour in summer.
The temperature range between colors in summer changes compared to winter. As shown in
Figure 19 for black roofs, temperatures between 30 and 62 °C were achieved, while for the white roofs, between 30 and 35 °C.
Therefore, it is intuited that for the case of NBE-79 in Madrid the transition temperature will be around 18 °C in winter and 30 °C in summer. As can be seen, the transition temperature range is very wide for Madrid. For this reason, a day of an intermediate season will be analyzed.
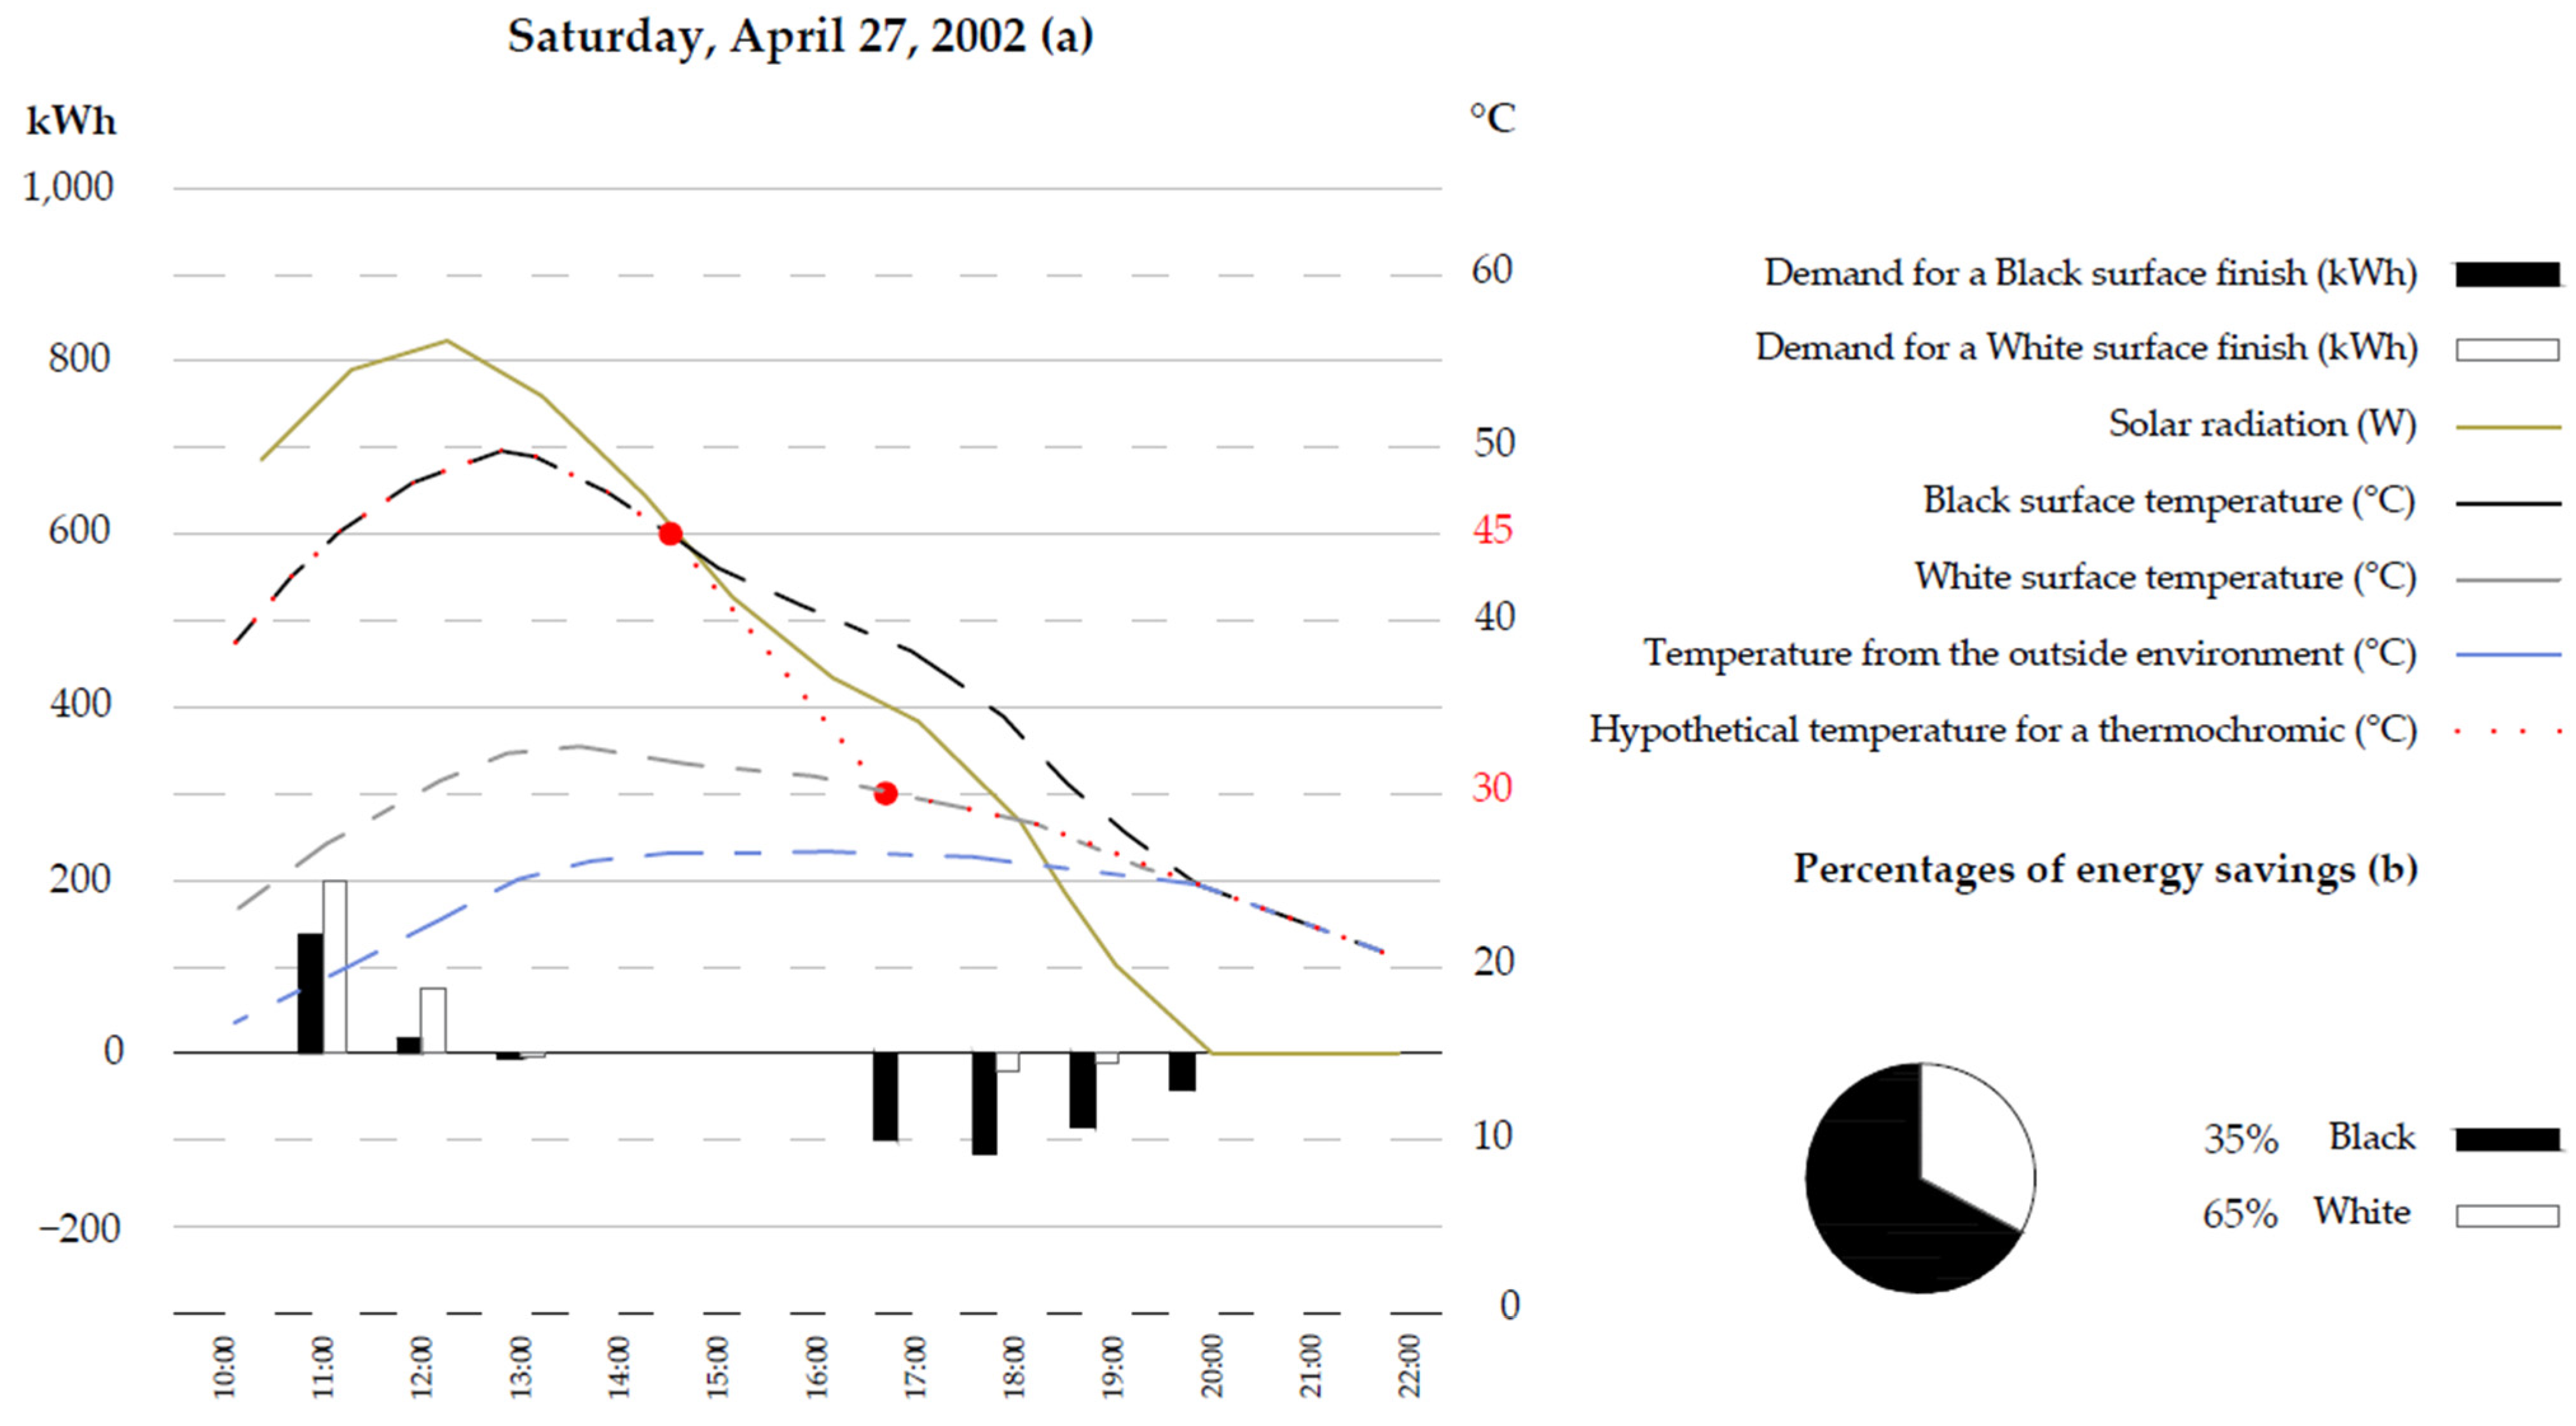
3.4.5. Saturday, 27 April 2002, Assessment for NBE-79 in Madrid Climate Zone
The days of an intermediate season are interesting, because during the same day, heating and cooling loads are needed. As shown in
Figure 20, in the early hours of the morning, from 10:00 to 12:00 the demand was lower in the case of black surface finish, while in the evening hours, from 17:00 to 20:00 the demand was lower in the case of the white surface because of the sun radiation.
Thus, in order to achieve optimal behavior during the morning hours, the surface should be black (temperatures around 40 to 50 °C), while in the afternoons the surface should be white (temperatures around 25 to 30 °C).
However, as already mentioned above, in the month of January (more restrictive for heating demand), the transition temperature from black to white is around 18 °C, so a black surface will never reach a surface temperature of 44 °C in April. As can be shown with a red line in
Figure 20, the hypothetical temperature for a black and white thermochromic will never happen. Therefore, on 27 April 2002, the surface finish would be white the whole day for optimal energy performance.
However, for this article, the application of a black and white surface finishes by day was analyzed. It would be interesting to do daily simulations with different colors and different days, which would further increase the effectiveness of the application of thermochromic materials in minimizing energy demands.
In this paper, thermochromics have always been considered with one transition temperature. However, for the case of 27 April 2002, it is intuited that to optimize energy performance, there should be two transition temperatures. The first one for winter and summer seasons, changing from black to white when the surface temperature achieves 30 °C, and the other for intermediate seasons, changing from white to black when temperature surface achieves temperatures higher than 45 °C.
It should be mentioned that analysis per day should be more extensive in order to obtain a final value. For future studies, it would be interesting to analyze more intermediate season days, as it offers a new challenge to achieve a thermochromic with two transition temperatures.
3.5. Optimal Cost
In order to calculate the optimal cost [
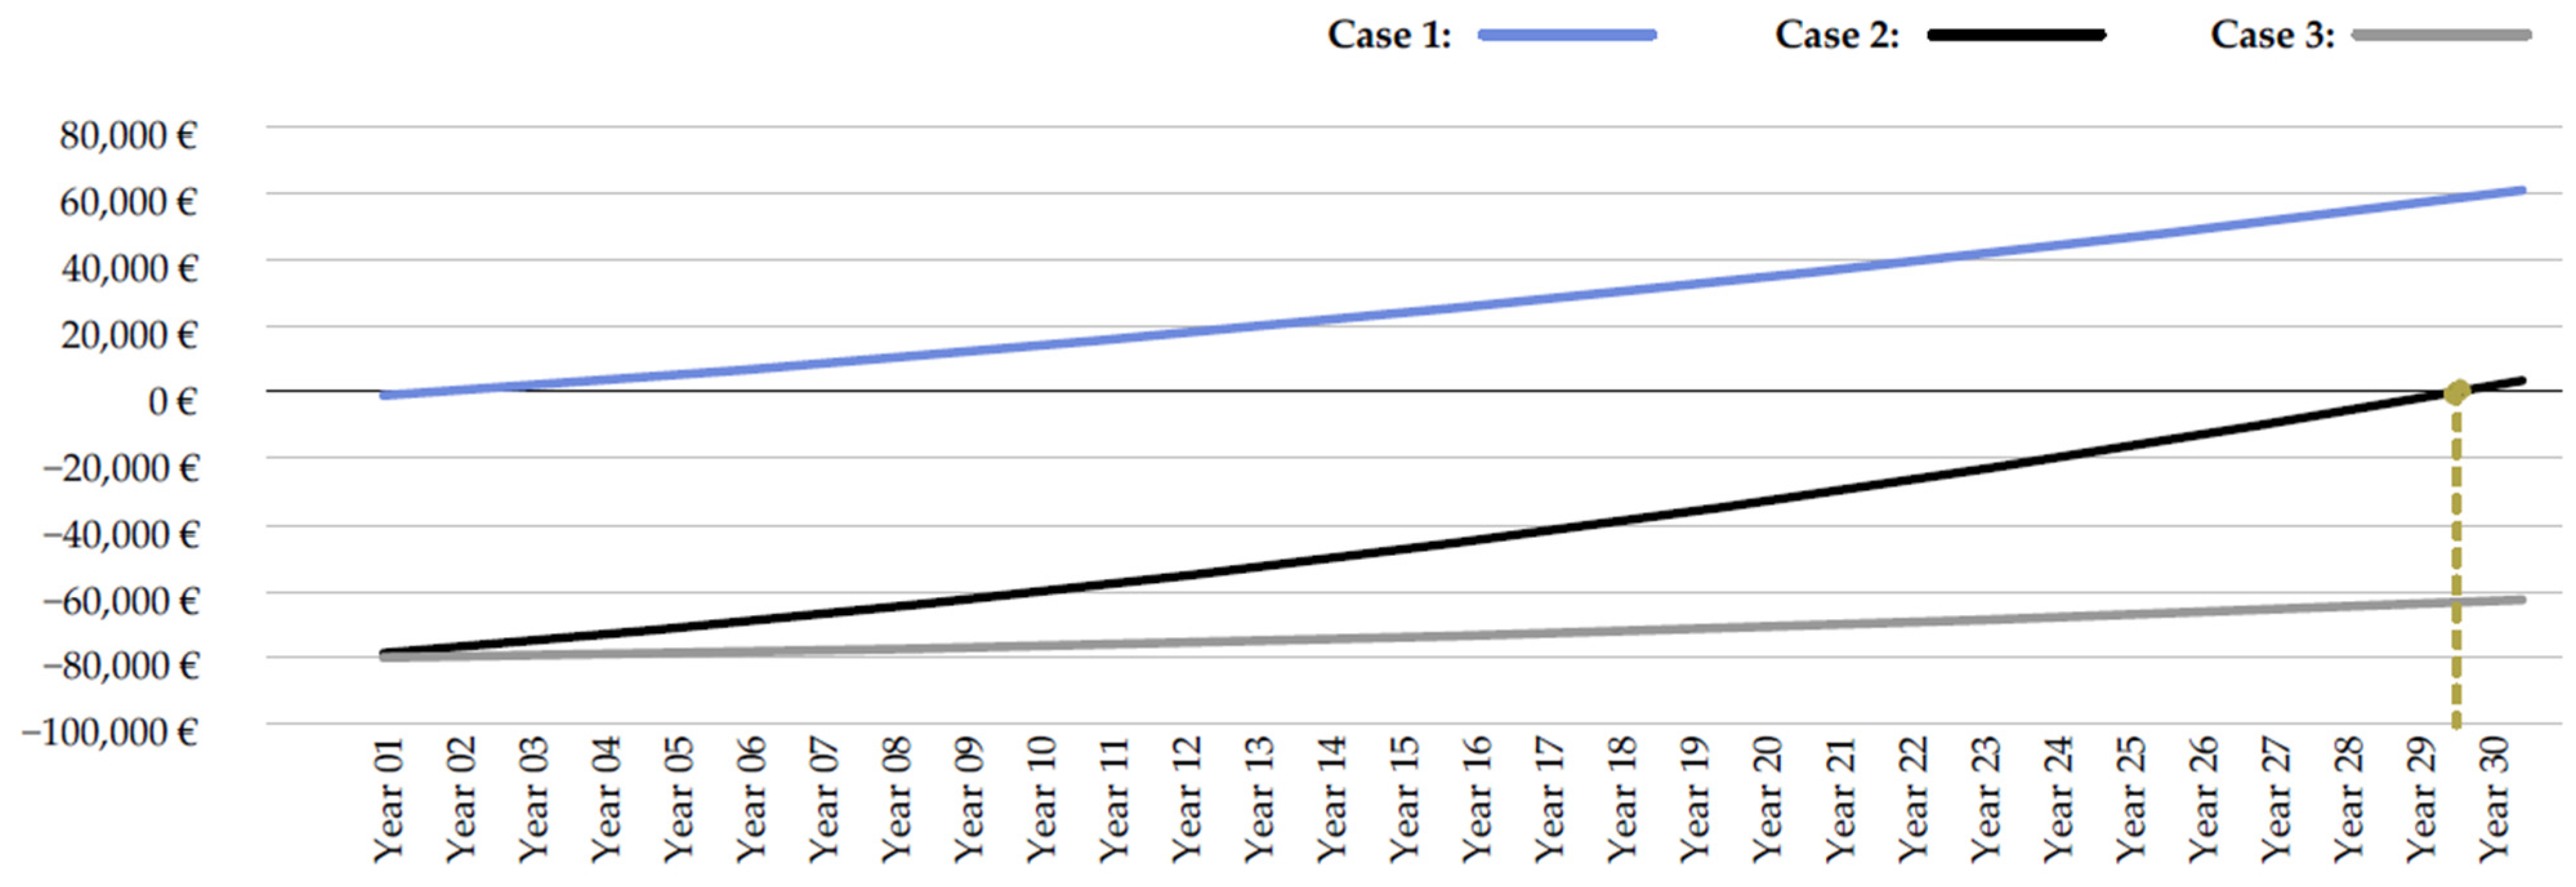
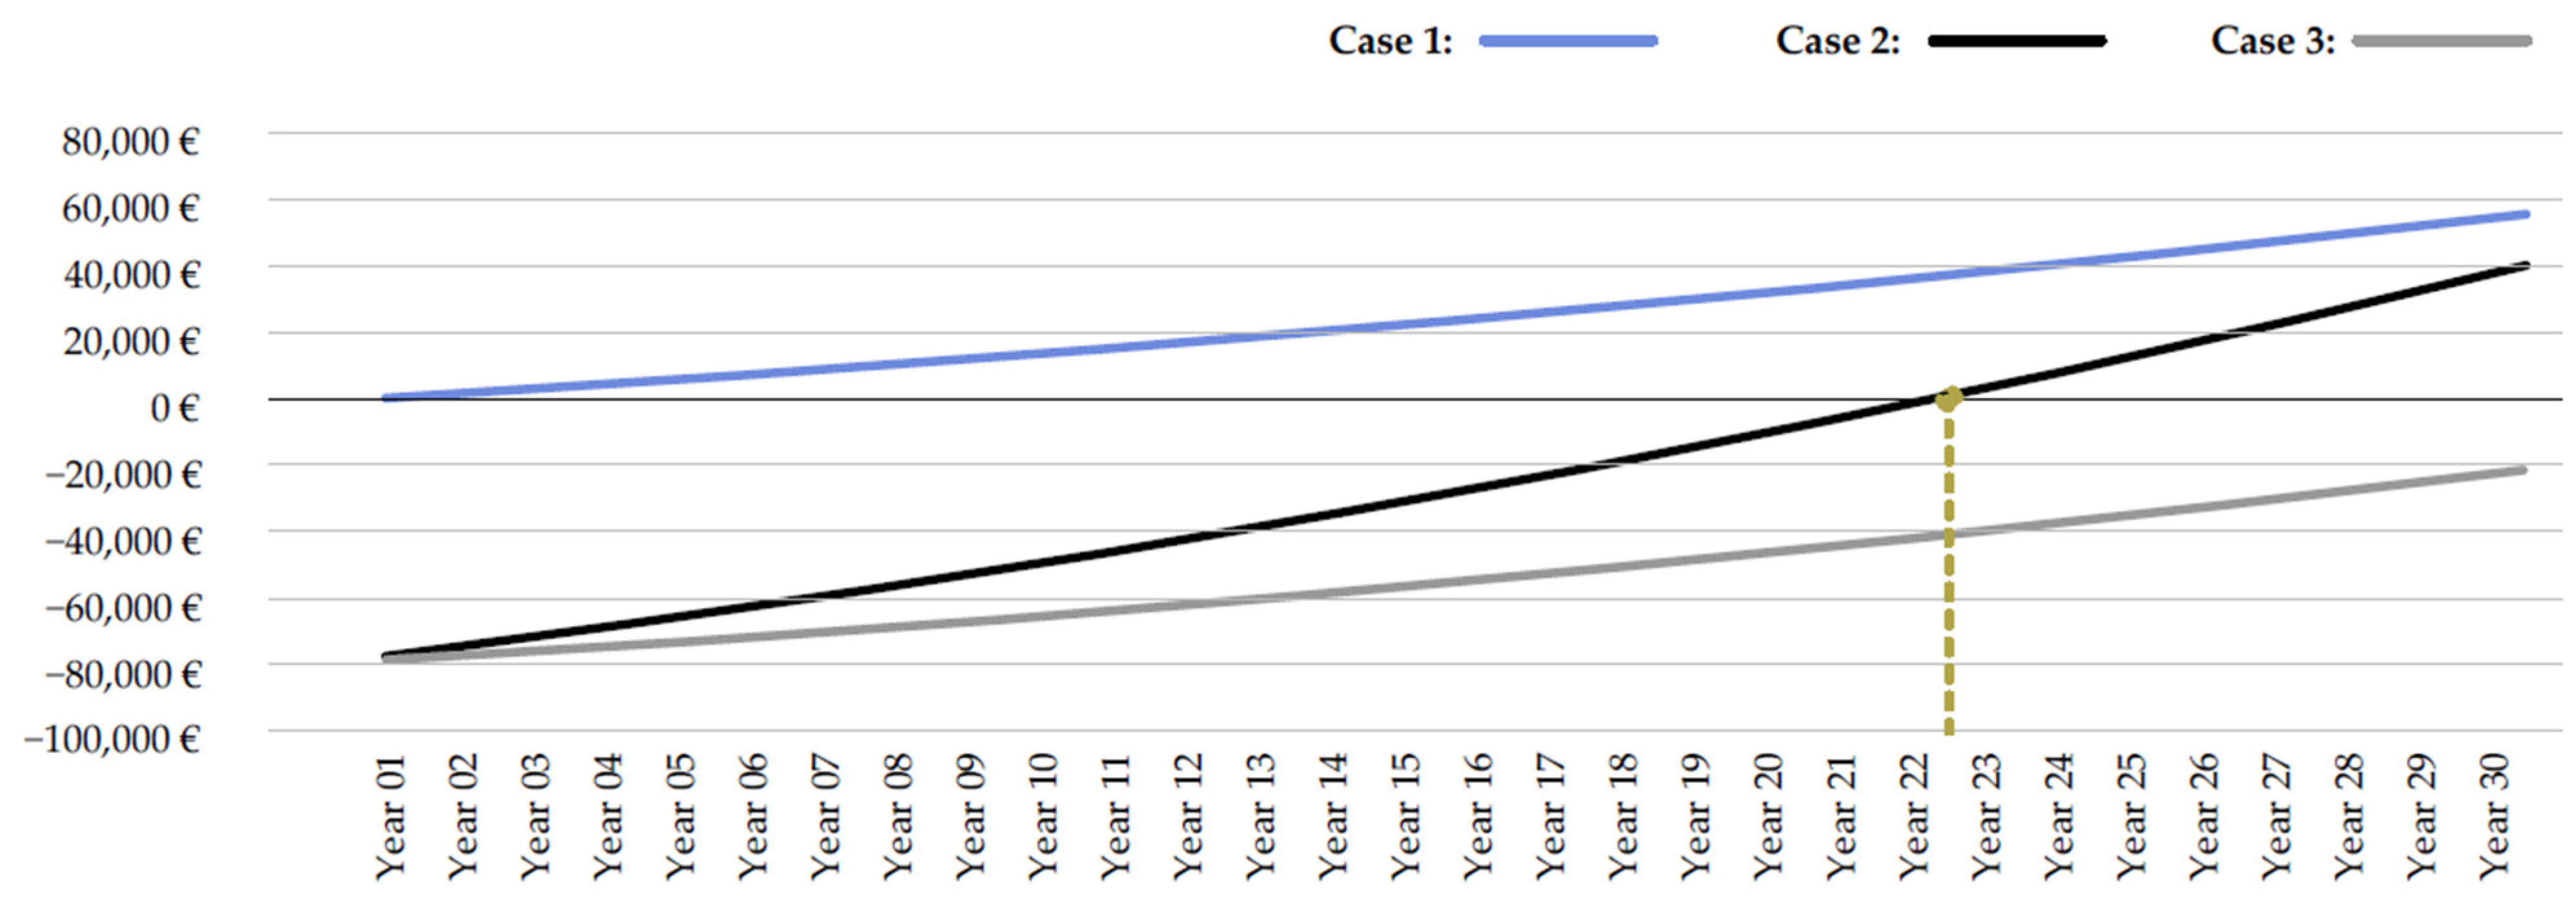
40], the application of paint was considered because it is the most commercialized thermochromic application nowadays. Therefore, it is more accessible and has a more competitive cost. In the calculation of the optimal cost, the application was evaluated for three different situations:
Case 1: White paint applied to an existing black cover which subsequently becomes a cool roof.
Case 2: Thermochromic paint applied to an existing black cover.
Case 3: Thermochromic paint applied to an existing white cover.
A 1.20 W/m2·K transmittance value was applied on a lightweight construction solution for the Barcelona case study, while a 0.77 W/m2·K transmittance value was applied for Madrid (NBE-79) due to its higher savings in energy demand.
In order to calculate the optimal cost of applying a surface finish of thermochromic paint, a time interval of 30 years was considered. As the 30-year market price for energy cannot be predicted, the conclusion drawn from Eurostat [
48] was considered as a 3% annual increase in the price of electricity.
By applying this time interval, the cover would need some maintenance during the 30-year period, which was considered as an annual increase of 0.5% of the total price.
It can be seen that the thermochromic paint on the market currently has two factors against it compared to white paint. The first one is the price because it is not very commercialized yet. The second is the coating power since thermochromic paint has half the coating power with respect to normal paint (
Table 8).
For the calculation of the optimal cost, the workforce was considered according to the database of ITeC BEDEC (Institute of Construction Technology of Catalunya, 2019) and the cost of a surface finish with thermochromic paint was considered double since it requires the application of a double layer (because of the coating power).
3.5.1. Barcelona Climate Zone
In the case of thermochromic paints (cases 2 and 3), their current market price cannot compete against conventional paint, so the initial investment reaches € 80,000. As shown in
Figure 21, for case 2, it is not until year 29 that the initial investment begins to be amortized. That is why, nowadays, for the case of Barcelona, painting an existing black cover to white (case 1) generates economic returns from the first year. For case 3, in 30 years, there would be no economic return, so it is better to leave the existing white cover than to paint it with thermochromic paint.
If the demand for thermochromic materials were to be globalized, the market price would be drastically reduced, and competitive economic returns would occur. If market prices were equal to conventional paint, returns would occur from the first year of application.
However, despite the percentage of maintenance having been considered for the calculation, the manufacturer does not specify the durability of the material, or whether its function remains unchanged over time. That is why, in the 30-year time interval, the cover may have to be repainted, and thus, an economic return would not be generated.
3.5.2. Madrid Climate Zone
The case of Madrid was similar to that of Barcelona. As shown in
Figure 22, case 1 was still the most cost-effective, and for case 2, economic returns began after year 22. Comparing both cases, the percentage of energy savings in Barcelona was higher than in Madrid; however, in Madrid, economic returns were reached before that in Barcelona because the demands were much higher.
Although it is appreciated that the economic returns were not amortized until a rather long period of time, it is interesting to understand the affectation of the behavior of energy performance and CO
2 emissions associated with the useful life of buildings. Therefore, an annual comparison of kilograms of CO
2 savings was made (
Table 9 and
Table 10).
As a priori, these kilograms of CO
2 values were not significant, and they were compared to kilograms of CO
2 that a tree can absorb per year. In
Table 5, we can see that for case 2, which had the highest energy savings, the application of thermochromic paint on a black cover would compensate 9135.13 kg of CO
2 per year.
This is equivalent to the amount that 457 trees would absorb in a year, which would correspond to 3 hectares of Spanish forest. As an illustration of this according to data from Spain’s National Institute of Statistics in 2017, the national forest inventory was 7500 million with an average of 14,880 trees per square kilometer, i.e., 148.8 trees per hectare. Nonetheless, tree density is difficult to calculate, since it depends on the type of tree and the location, so it helps to have metric dimensions of national energy savings.
4. Discussion
As has already been mentioned in previous articles, the implication in the energy-saving involved in the application of a thermochromic surface or variable reflectivity coating (VRC) is clear [
19,
21,
30]. In a previous study [
23], it was concluded that for a commercial building in Chicago, a 7% energy saving is reached if a VRC finish was applied to the roof. This reinforces the conclusions of this article, even though the CZ is in different places. Despite this, the article mentions that the payback of its application was amortized in less than a year if the installation costs of the VRC were 0.25
$/m
2. The installation price of the finish mentioned is lower than the current price of the application of conventional paint in Spain (0.55 €/m
2), which is the cheapest way to apply a surface finish. That is why the current market price of the application of a thermochromic surface finish was evaluated.
The study showed two critical values, the current market price, and the lack of information about the aging of the product. The industry must obtain a product that allows economic returns and optimal maintenance, in order to obtain a useful technology at an environmental and economic level.
For future research, it would be interesting to determine the most optimal transition temperature for the thermochromic materials in an attempt to make the systems as efficient as possible.
5. Conclusions
The energy performance of a building with variable reflectivity coatings and thermal transmittances was evaluated when applied to roof surfaces in commercial buildings located in two distinct climates in Spain (C2 and D3). Finally, an optimal cost study was undertaken to determine the effectiveness of its application. The main findings from the analysis include:
(1) Based on the evaluated case studies, the results obtained in this study showed that there is always a reduction in energy demand when applying a thermochromic surface finish, which becomes more significant for construction solutions with higher thermal transmittance values (NBE-79).
(2) Likewise, in the application of a thermochromic surface finish to roofs, the greatest percentage of energy savings would take place during seasons with demand for cooling, i.e., the summer. The heating demand decreases through solar radiation in buildings with a high thermal transmittance value. Conversely, the reflection of solar radiation for buildings with low thermal transmittance values generates a lower cooling demand. Therefore, it is indicated that for the Barcelona CZ, energy savings of 1–4% are achieved for a thermochromic finish versus a white surface finish, and of 2–12% for a thermochromic surface finish versus a black surface finish. Meanwhile, this study suggested that for the Madrid CZ, energy savings of 1–4% are achieved for a thermochromic surface finish versus a white surface finish, and of 2–8% for a thermochromic surface finish versus a black surface finish. Although the percentage of reduction in annual energy demand was higher in Barcelona, the savings in the absolute value of kilowatts were higher in Madrid, given that the demand for heating was almost doubled.
(3) The range of months in which a highly reflective (i.e., white) or highly absorbent (i.e., black) cover is suitable for energy savings according to the CZ and for buildings with high transmittance values (i.e., NBE-79) are the following results. For the Barcelona CZ, between the months of June to August, the surface finish should be white, while it should be black from September to May. Meanwhile, for the Madrid CZ, between the months of May to September, the surface finish should be white, while it should be black from October to April. Therefore, it is concluded that in Barcelona, it is convenient for the roof to be black for more months than white with respect to Madrid.
(4) The transition temperature for Barcelona CZ has been detected for buildings with high transmittance values (i.e., NBE-79) and results showed that the transition temperature for a thermochromic should be around 25 °C from black to white, to achieve optimal energy performance in both summer and winter. On the other side, for the Madrid CZ, the transition temperature for a thermochromic should be around 18 °C and 30 °C from black to white, to achieve optimal energy performance in both summer and winter. For intermediate seasons in Madrid, it was observed that to optimize energy performance there should be two transition temperatures. The first one, changing from black to white when the surface temperature achieves 30 °C, and the other, changing from white to black when the surface temperature achieves temperatures higher than 45 °C. However, at present, no thermochromic material is known to allow this. Otherwise, the technology would not be optimized in days with loads of heating and cooling.
(5) The results of the economic investment study indicated that for the case of high thermal transmittance values (NBE-79), in both CZ, the most optimal solution would be to paint the roof in white (cool roofs). Currently, the cost of applying thermochromic paint cannot compete with conventional.
In summary, it was concluded that an interesting area for the application of thermochromic materials could be for energy deep renovation, due to energy savings in buildings with higher thermal transmittance and for its fast and easy application. Although currently, the economic returns would not be amortized until after a long when thermochromic was applied, it is considered that this technology should be invested in to reduce the economic costs of production, since it is a good method to reduce the energy demand of buildings and, therefore, to contribute to the mitigation of climate change.


