Article

Study on Heat Transfer Process and Fresh Water Output Performance of Phase Change Heat Storage Dehumidifier

School of Power and Energy, Northwestern Polytechnical University, Xi’an 710072, China
*
Author to whom correspondence should be addressed.
Energies 2022, 15(4), 1504; https://doi.org/10.3390/en15041504
Submission received: 27 December 2021 / Revised: 10 February 2022 / Accepted: 11 February 2022 / Published: 17 February 2022
(This article belongs to the Topic Energy Storage and Conversion Systems)

Abstract

:
In the humidification-dehumidification solar desalination process, using phase change materials to recover water vapor condensation latent heat in the dehumidification can improve heat utilization and water production performances. When sodium thiosulfate pentahydrate and paraffin were used as phase change materials respectively in the phase change heat storage dehumidifier, by means of numerical simulation and experiment, the heat transfer process, entropy generation, and water production performances of heat pipes and copper wire meshes coupled phase change materials in the dehumidifier were studied. The results showed that sodium thiosulfate pentahydrate has stronger heat transfer ability, higher thermal entropy generation, and heat storage capacity than paraffin; adding copper wire meshes into the phase change material can accelerate heat transfer and shorten the time required for monitoring points to reach phase change temperature; increasing the wet air temperature at inlet of phase change heat storage dehumidifier, using copper wire meshes in the phase change material, increasing the diameter of copper wire mesh, and using a passive basin desalinator for secondary water production can improve water production performances. In brief, the use of sodium thiosulfate pentahydrate and copper wire meshes in the phase change heat storage dehumidifier leads to better heat storage and heat transfer effects.

1. Introduction

Using solar energy to desalinate seawater can solve the problem of fresh water shortage and save mineral energy. In small and medium-sized solar desalination units, the commonly used methods include solar distillation and humidification-dehumidification (HDH) solar desalination, etc. In recent years, many scholars [1,2] have carried out research on the improvement of the traditional solar distillation and made progress in increasing water output and reducing water production cost (WPC). The HDH solar desalination process has high thermal efficiency in many solar desalination methods [3,4].
Recovery of the condensation latent heat of water vapor in the dehumidification process is the key to improve the fresh water output of HDH solar desalination. The dehumidification process with phase change heat storage is one of the effective methods to solve this problem. Therefore, it is the development direction of HDH solar desalination.
In the solar desalination process, there are two ways to recover heat energy by using phase change materials (PCMs). One is to recover excess solar heat; the other is to recover the latent heat of condensation of water vapor. At present, there are many studies on the former. Asbik et al. [5] placed PCM at the bottom of a basin-type solar seawater desalinator and theoretically analyzed the influence of PCM thickness, ambient wind speed, and water depth on the exergy efficiency of the system. The results showed that the instantaneous exergy efficiency of the device was less than 5% in the daytime. Mousa and Gujarathi [6] carried out an experimental study on the basin-type solar seawater desalinator with a PCM placed at the bottom of the distiller, and obtained the hourly and daily water output as well as the temperature changes of seawater and glass cover. The research showed that the temperature difference between the seawater tank and the glass cover plate can be increased by adding a PCM heat storage device, and the water output can reach 9.36 L/d. Rufuss et al. [7] analyzed the distillation efficiency of a basin-type solar desalination plant with a PCM thermal storage device at the bottom by using the comprehensive fuzzy analytic hierarchy process and data envelopment analysis. The results showed that although this kind of solar still has a higher water output, its manufacturing, operation, and maintenance costs are high. Kabeel et al. [8] placed a PCM at the bottom of a distiller to absorb excess heat in the unit with a two-channel solar collector coupled with a solar distiller. The results showed that the water output of the improved solar distiller was 108% higher than that of the previous one. Al-harahsheh et al. [9] conducted an experimental study on a solar desalination unit with a PCM heat reservoir connected to the solar collector installed at the bottom of it. The results showed that the water output of the unit reached 4300 mL/d and 40% of the water output was generated after sunset due to heat release from the PCM heat reservoir. Abu-Arabi et al. [10] also studied an experiment device in which sodium thiosulfate pentahydrate was placed in tubes at the bottom of seawater desalination device. The simulation results showed that the fresh water output of the equipment increased by 37%. Sarhaddi et al. [11] transformed the basin solar desalination tank into a weir-type cascade solar still; the seawater flowed along the steps to accelerate the evaporation rate, and the PCM was filled into the lower part of the steps to absorb excess solar energy. Experiments and analyses showed that the maximum energy efficiency and exergy efficiency of solar still with PCM heat storage were 74.35% and 8.59% respectively. This structure is the preferred choice in semi-overcast weather conditions. Based on the experimental and theoretical research, using PCM heat storage devices to absorb excess solar energy can prolong the working time of desalination units after sunset and increase the water output.
Assari et al. [12] studied the desalination system using a solar parabolic concentrator, and effects were sought for using the preheater tube, nano-fluid, PCM, and different depths of the distillation basin. The results showed that using nano-fluid and the preheater tube together was the most beneficial for fresh water production. Manoj et al. [13] investigated the performances of a conventional single-slope passive solar still under the influence of a paraffin-based PCM and a nano-PCM in terms of the fresh water production per day. The results evidenced that the incorporation of PCM and n-PCM improved the fresh water production by 51.22% and 67.07%, respectively. Suraparaju et al. [14] designed a novel bottom-finned absorber basin to enhance the heat transfer between absorber and PCM, which further improved the fresh water productivity of the solar distiller.
In addition, some researchers have studied the use of PCM to absorb the latent heat of water vapor condensation. Amarloo et al. [15] installed a condensing latent heat recovery device above the distiller to recover the latent heat of water vapor condensing in the daytime and re-channel the heat stored by the PCM into the still at night, thus extending the working time of the device. The results showed that using the recovered latent heat of water vapor condensation and the water output of the distiller increased by about 7%. Faegh et al. [16] studied a new method for storing the latent heat of water vapor condensation by using PCM. The new method transfers the latent heat of water vapor condensation recovered during the day back to seawater through heat pipes so that the unit can continue to work at night, and the water output can be increased by 86% compared with that without PCM.
In order to improve the thermal conductivity of PCMs, some researchers added high thermal conductivity materials to different types of PCMs to make composite PCMs. Sahan et al. [17] made a composite paraffin PCM with higher thermal conductivity and heat storage capacity than pure paraffin wax by dispersion technology using multi-walled carbon nano pipes and activated carbon. Zhang et al. [18] made PCM samples with four different mass fractions of carbon nano pipes by the vacuum impregnation method. The study of Tian et al. [19] showed that heat transfer rate can be further increased by using foam metal with low porosity and high pore density. Ling and others [20] studied the influence factors of thermal conductivity of organic phase change composite RT44HC/EG. Amin et al. [21] used differential scanning calorimetry to measure the melting temperature, heat capacity, and latent heat of beeswax PCMs with high thermal capacity, and studied the thermal conductivity with a thermal conductivity meter. Li et al. [22] discovered that adding aluminum powder can improve the thermal conductivity of PCMs. Baby et al. [23] studied the thermal performance influencing the factors of PCM filled with a copper porous matrix through experiments. Ye et al. [24] made a CaCl2·6H2O/expanded graphite composite PCM. Fukai et al. [25] used carbon fibers with higher thermal conductivity to improve the thermal conductivity of PCMs.
In order to improve the heat transfer rate of PCMs in the process of heat storage and heat release, some researchers studied the effects of using heat pipes and fins on heat transfer in PCMs. Motahar et al. [26] studied the effect of heat pipes on the melting and solidification behavior of PCMs in a vertical cylindrical experiment chamber. The results showed that the heat pipe had good isothermal heat transfer characteristics.
Lohrasbi et al. [27] used CFD simulation and the multi-objective response surface method to optimize the design of a novel finned heat pipe. Ji et al. [28] numerically investigated the influence of different fin inclination angles on the melting of lauric acid. By means of numerical simulation, Bhagat et al. [29] investigated the influence of fin number, fin thickness, and fin height on the temperature of the outlet heat flow in a finned multi-tube latent heat thermal energy storage system. Aly et al. [30] numerically investigated the application of longitudinal corrugated fins in increasing the solidification rate of the formic acid located in the annular area between two concentric tubes. The results showed that the effectiveness of the corrugated fins was lower than that of straight fins. Joshi et al. [31] investigated the best fin size and fin position to accelerate the melting of lauric acid. Masoumpour [32] numerically investigated the melting process of PCMs in storage by inserting innovative fins, which comprise a combination of rectangular and triangular fins. The impacts of various efficient parameters on melting process were evaluated, which are the schematic of internal fins, height of triangular fins, hot wall temperature, and different types of PCMs.
To sum up, in the field of solar desalination, the research on the application of PCMs to recover the latent heat of water vapor condensation in dehumidification has been very scarce. Based on the phase change heat storage HDH solar desalination process, by means of numerical simulation and experimental methods, in this paper, in the dehumidifier, the heat transfer process, entropy generation, and water production performances of heat pipes and copper wire meshes coupling PCMs were studied respectively. The PCMs used were sodium bisulfate pentahydrate and paraffin.

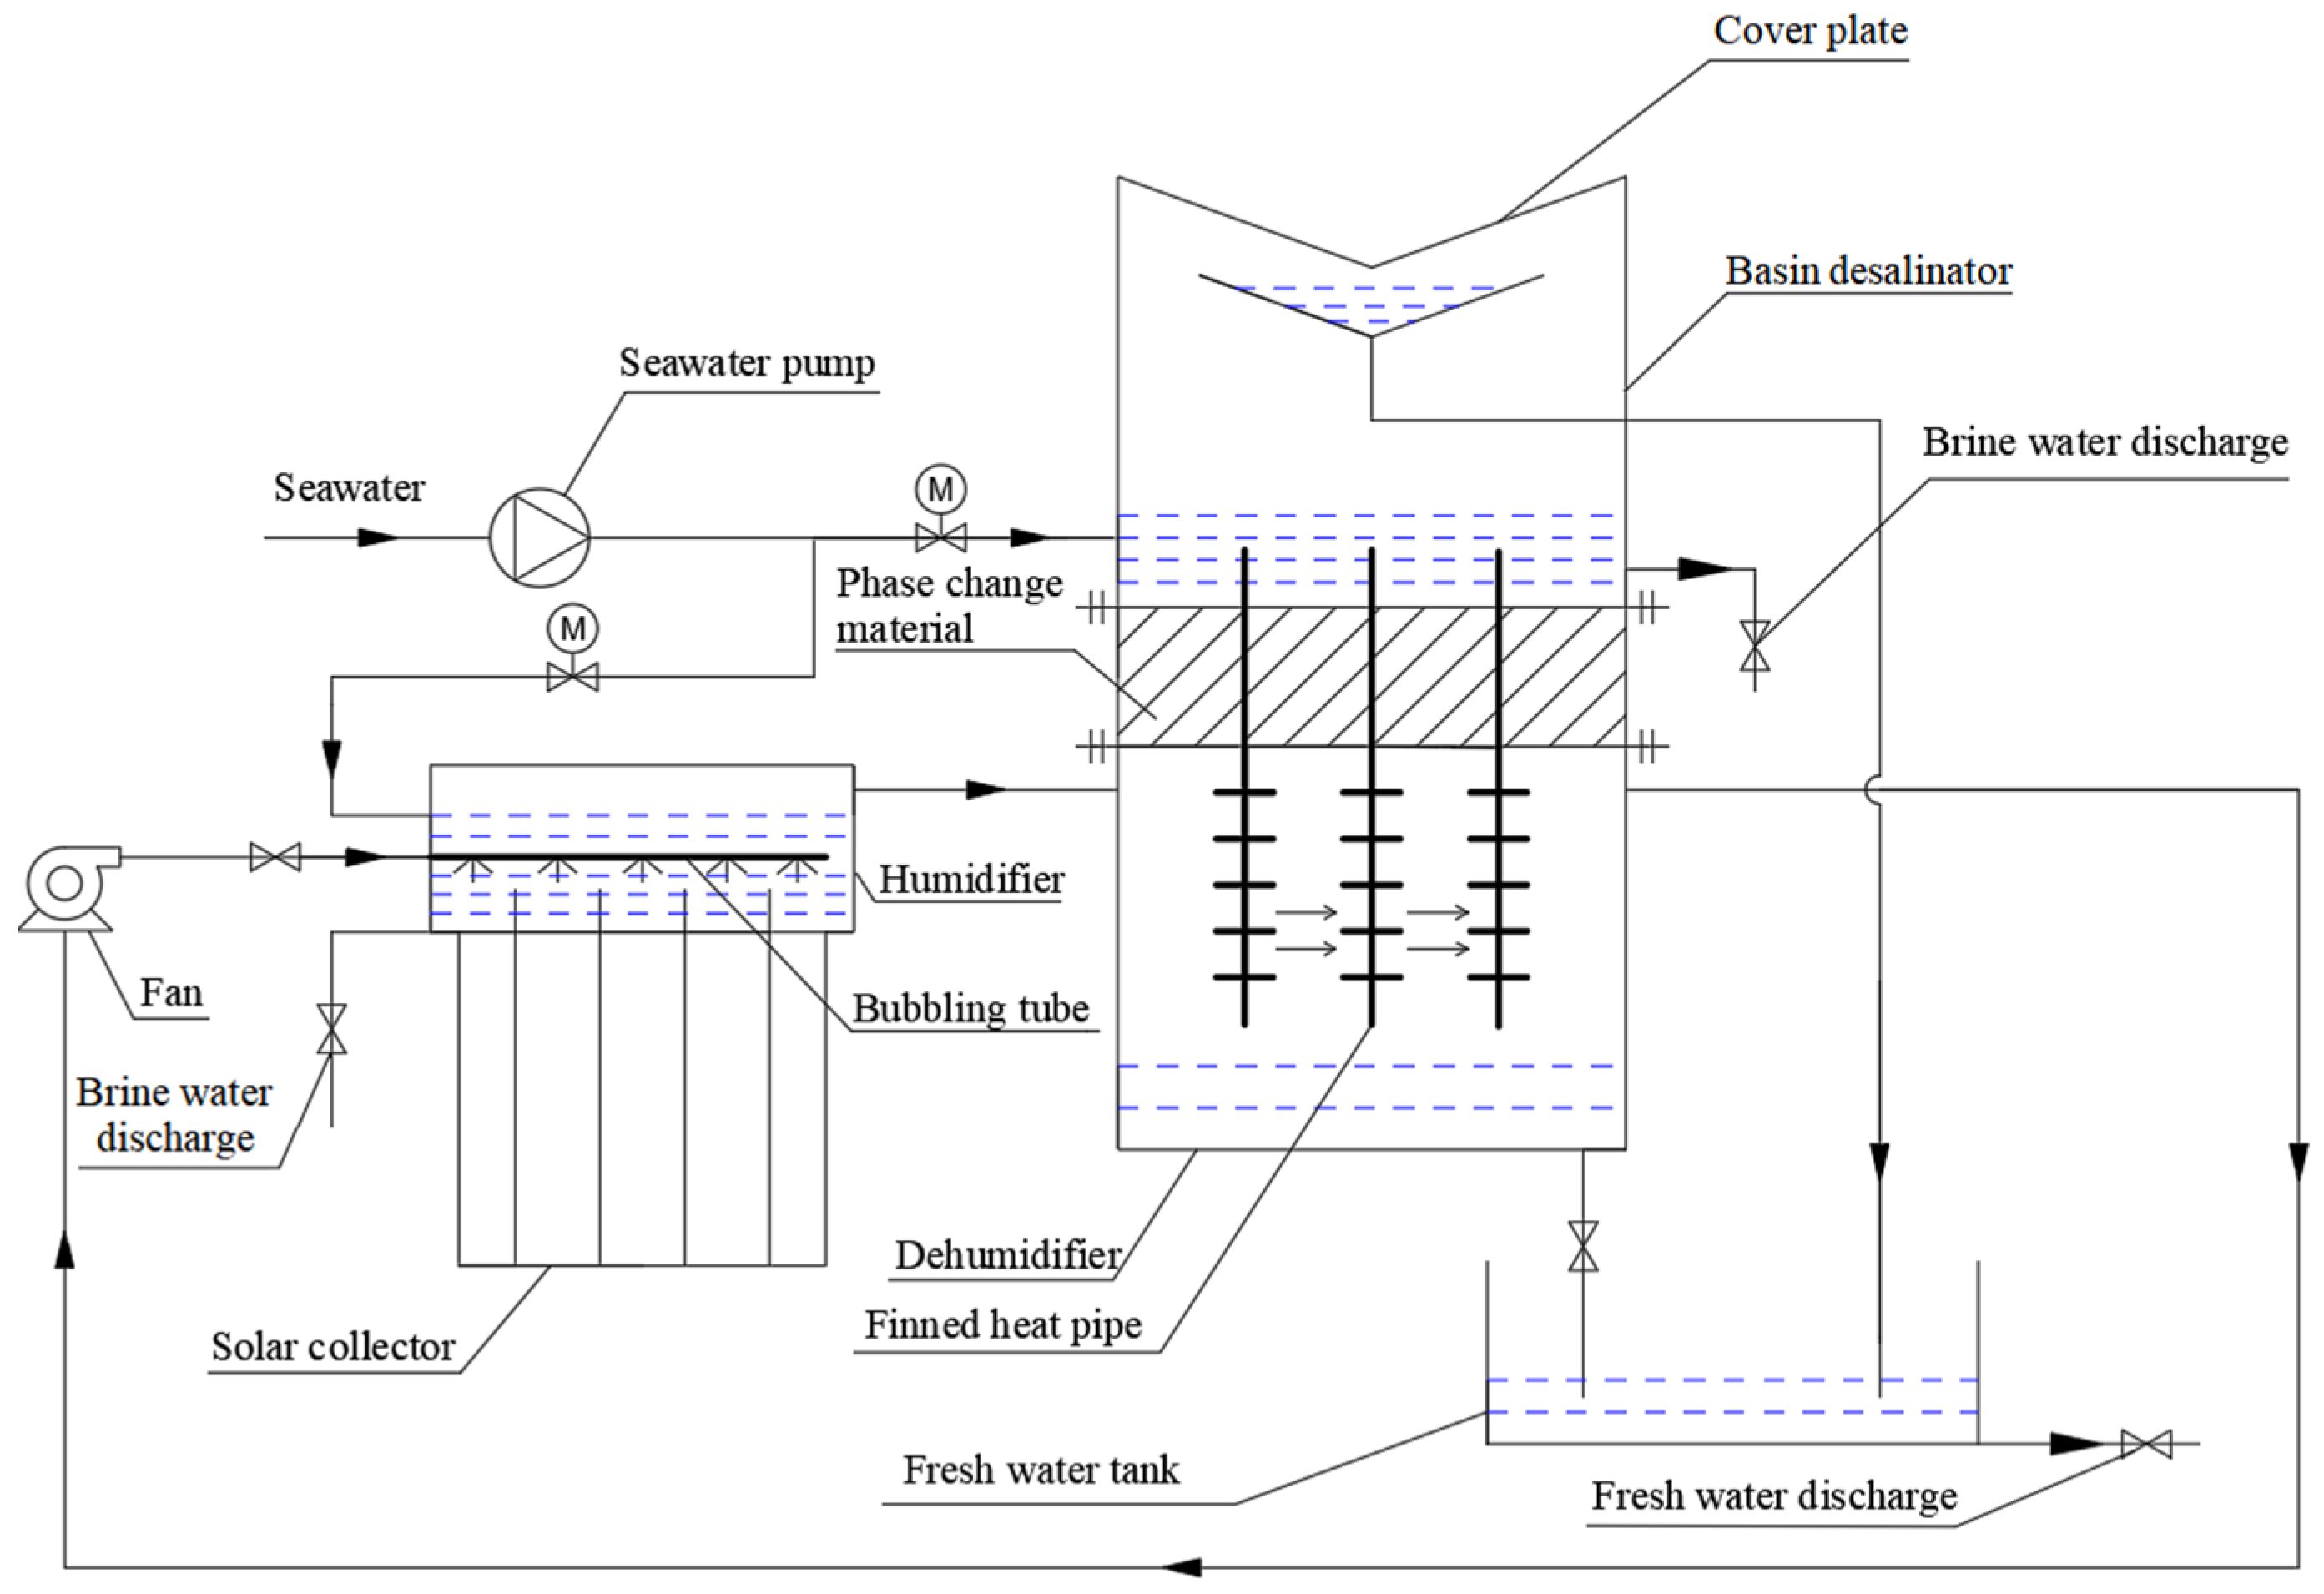
2. Technological Process

Figure 1 shows an integration HDH solar desalination process, which was a closed air open water (CAOW) system proposed by the author. In the process, the active HDH process and the passive basin desalinator jointly produce fresh water. In the active HDH process, the air is transported to the bubbling pipes in the humidifier by fan. The air is heated and humidified by seawater in the humidifier, and the seawater is heated by the solar collector. The hot and wet air from the humidifier enters the dehumidifier, where the air exchanges heat with the finned heat pipes, condenses fresh water, and releases vapor condensation latent heat. The heat released by air is transferred to the PCM and seawater in the basin desalinator by heat pipes. When the active HDH process stops work, such as after sunset, the PCM releases its stored heat into the seawater in the passive basin desalinator above it. In the basin desalinator, the seawater heats and humidifies the air above it, and the wet air condenses on the cover plate above the basin desalinator to produce fresh water for the second time. The seawater is intermittently replenished into the humidifier and passive basin desalinator by pump, and the brine water in them is discharged regularly.

3. Research Methods

3.1. Experimental Methods

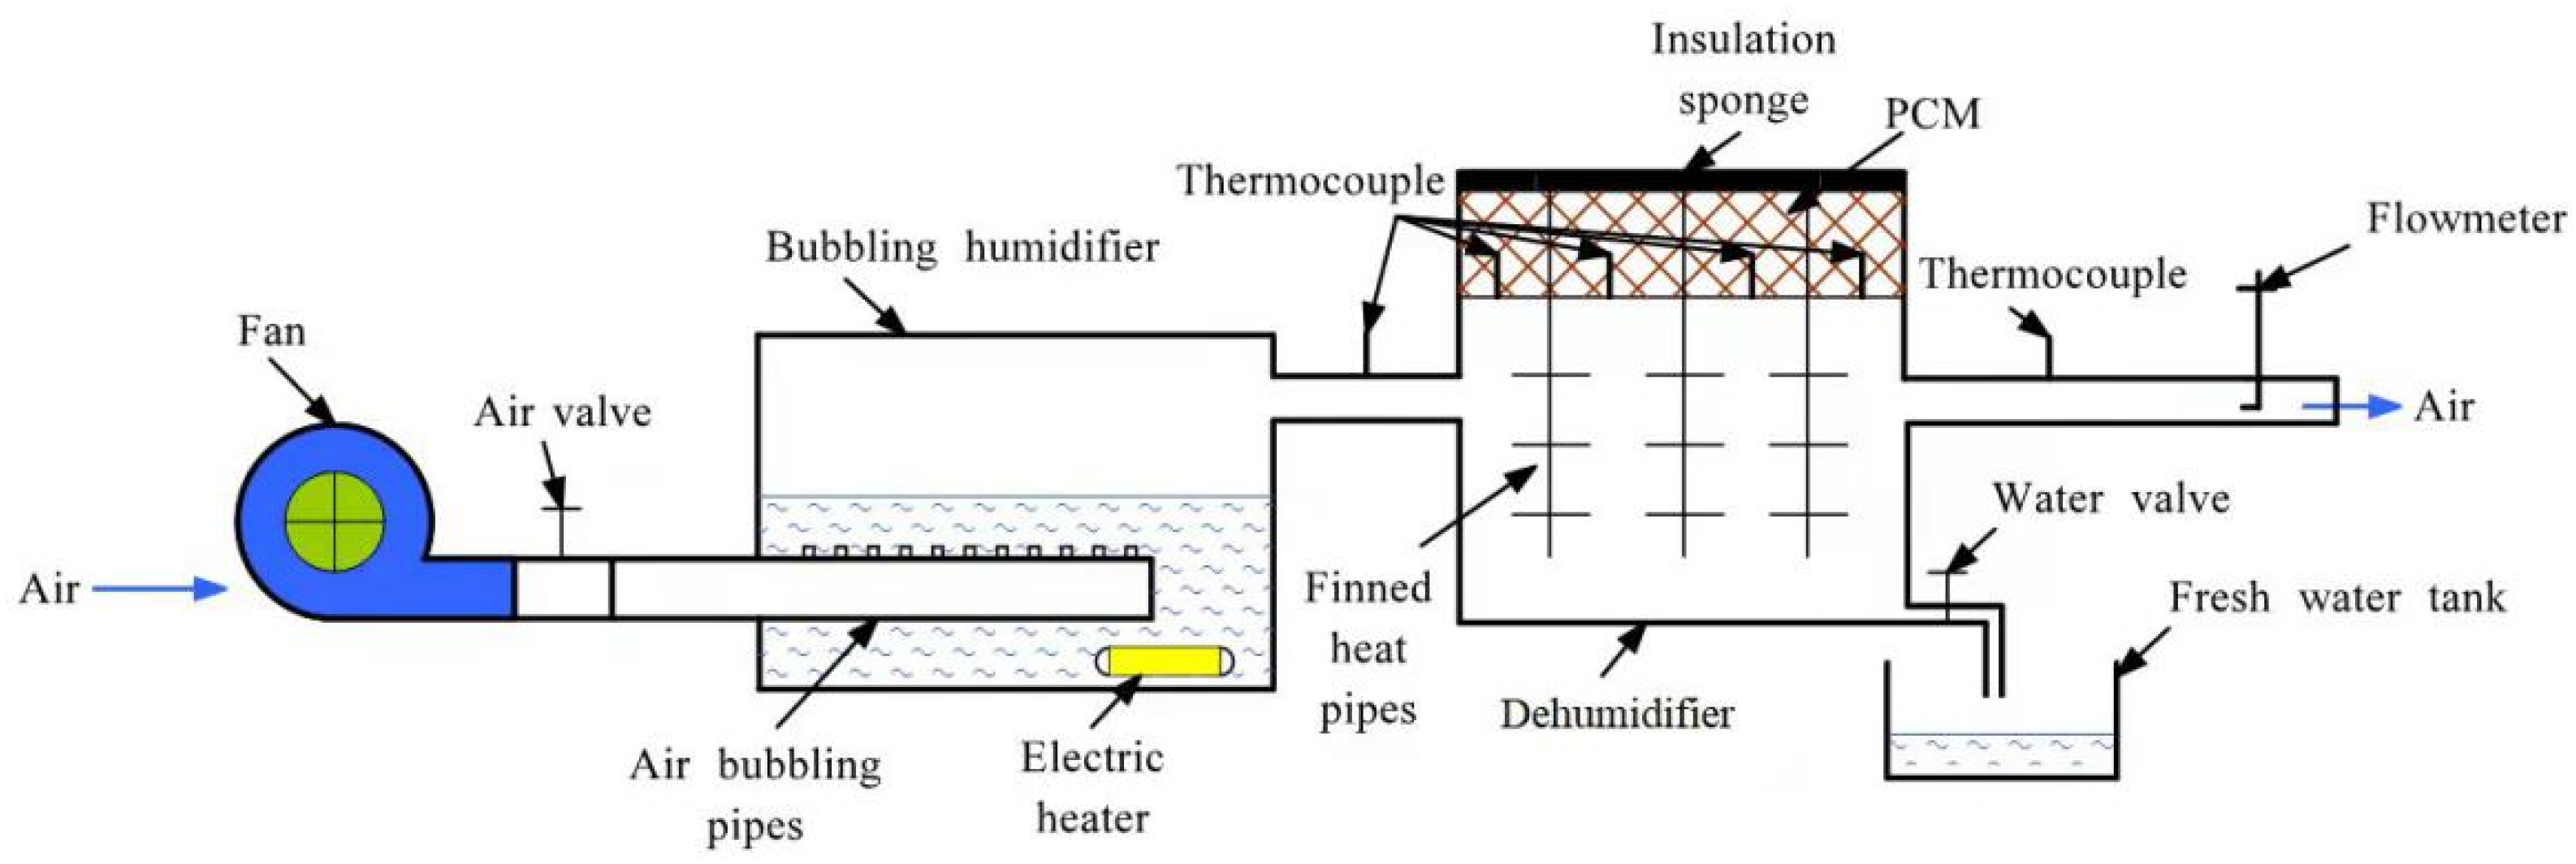
3.1.1. Experimental System

Due to the high efficiency of bubbling humidification, it causes more water to evaporate and more heat to be absorbed from the seawater. This is because the evaporation latent heat of water is high, and the heat provided by a certain area of solar collector to seawater is limited. The experiments show that the temperatures of seawater and air can hardly be higher than 70 °C in the actual humidification process [33]. Therefore, in this study, the temperature of hot and wet air entering the dehumidifier was taken as 60 °C, 65 °C, and 70 °C respectively. The air fan was used for driving air, the fresh water was used to replace the seawater, the electric heater was used instead of the solar collector to provide heat, and the air flow was regulated and measured by the valve and flow meter. Limited by the working range of the experimental device, the maximum air flow rate was 5 m3/h.
The experimental system of the phase change heat storage dehumidifier is shown in Figure 2, and its heat exchange diagram is shown in Figure 3. Min and Mout are the air mass flow at the inlet and outlet of the dehumidifier separately, kg/s; Hin and Hout are the total enthalpy of air at the inlet and outlet of the dehumidifier, J; Q1, Q2, and Q3 represent the heat exchange capacity by different heat pipes respectively, J. The performance indexes of instruments and equipment used in the experimental system are listed in Table 1. The phase change heat storage dehumidifier consisted of a PCM heat storage and a dehumidifier. The PCM heat storage was filled with PCM and is located on the upper part of the dehumidifier. The heat pipes were placed vertically between the PCM heat storage and the dehumidifier. As shown in Figure 3, the hot and wet air flowed through the dehumidifier from left to right and exchanged heat with the lower part of finned heat pipes in the dehumidifier, and the air was cooled to release heat and condense fresh water in the process. The heat released by the air was transferred upward to the PCM through the heat pipes and stored therein. In the actual HDH solar desalination process with the phase change heat storage dehumidifier, a basin desalinator was set above the PCM heat storage, and the upper end of the heat pipe extended into the seawater of basin desalinator. When the seawater temperature in the basin desalinator was lower than the phase change temperature of the PCM, the PCM released the previously stored heat to seawater so that the passive air humidification-dehumidification desalination process occurred in the basin desalinator, which can produce additional fresh water for the second time to further improve the fresh water output and the gained output ratio (GOR) of the whole unit. In order to simplify this experimental study, there was no basin desalinator above the phase change heat storage dehumidifier in the experimental system.
In the experiments, the commonly used low-temperature phase change materials, sodium thiosulfate pentahydrate (PCM-1) and paraffin (PCM-2), were used and compared. Both PCMs have high phase change latent heat and are suitable for recovering the latent heat of water vapor condensation in the range of 45 °C to 60 ℃. Their physical property parameters are shown in Table 2.
Ten copper heat pipes were used in the phase change heat storage dehumidifier. The working fluid in the heat pipe was water, and the outer diameter and the length of heat pipe were 25 mm and 210 mm. The size of the phase change heat storage was 318 mm × 106 mm × 50 mm, and the filling height of the PCM was 40 mm.
Two horizontal copper wire meshes were installed in the phase change heat storage to enhance heat transfer. The picture of the copper wire mesh is shown in Figure 4. The size of the copper wire mesh was 318 × 108 mm, and the mesh number was 20. The installation height of two copper wire meshes from the bottom of the container was 10 mm and 30 mm respectively. The outer wall of the dehumidifier was covered with a sponge insulation layer with a thickness of 20 mm and a thermal conductivity of 0.035 W/ (m·K).
The copper wire meshes can enhance the transverse heat transfer between the heat pipes and PCM and avoid the particle agglomeration in PCM due to the addition of high thermal conductivity granular material.
When PCM-2 was used as the heat storage material, three different wire diameters of copper wire mesh were used for the experiments.
Four thermocouples were arranged in the PCM to monitor temperature changes. The locations of the measuring points are shown in Figure 5 and their coordinates are shown in Table 3.

3.1.2. Measurement Errors

During the experiment, the measuring instruments themselves had errors, which could be reduced by selecting high-precision instruments and appropriate measuring range, but could not be eliminated.
  • K-type thermocouple
The temperature measurement range of thermocouples used in the experiment is −200 °C~220 °C, and the accuracy is less than 0.1%. The minimum temperature measured in the experiment is 25 °C, then the maximum relative error is:
| Δ T T m | | Δ T T min | = 420 × 0.1 % ( 25 + 273.15 ) = 0.14 %
where: ΔT—accuracy within the measuring range of K-type thermocouple, K; Tm—temperature measured by K-type thermocouple, K; Tmin—minimum temperature in test, K.
2.
Multi-channel temperature inspection instrument
The model of the multi-channel temperature inspection instrument used in the experiment is JK-64AU. It has 64 measurement channels and the measurement accuracy is 0.2%.
3.
Pressure digital display gauge
The pressure digital display gauge has a range of 0–50 kPa and an accuracy of 0.5% FS. The minimum pressure can reach 3.1 kPa in the experiment, i.e., the maximum relative error is:
| Δ P P m | | Δ P P min | = 50 × 0.5 % 3.1 = 8.1 %
where: ΔP—accuracy within the measuring range of pressure digital display gauge, Pa; Pm—measured value of pressure digital display gauge, Pa; Pmin—minimum pressure in test, Pa.
4.
Temperature measurement error
The temperature error transfer is related to the accuracy of the thermocouple and the accuracy of the multi-channel temperature inspection instrument. The measurement accuracy of the thermocouple is 0.14% and that of the multi-channel temperature inspection instrument is 0.2%. Finally, the relative error of temperature measurement is:
ε t = 0.14 % 2 + 0.2 % 2 = 0.24 %
where: εt—temperature measurement error.

3.2. Mathematical Methods

The equations used to represent the melting process of the PCM include the continuity equation, momentum conservation equation, and energy conservation equation, which are as follows:
ρ t + d i v ( ρ U ) = 0
U t + ( U g r a d ) U = d i v ( v g r a d U ) 1 ρ g r a d P + S m
t ( ρ H ) + ( ρ v H ) = ( k T ) + S e
where: U—velocity vector of phase change material, m/s; v—kinematic viscosity, m2/s; P—pressure, Pa; ρ —density, kg/m3.
The source term of the momentum equation is
S m = ( 1 f ) 2 ( f 3 + ε ) A mush v + ρ 0 g f ( h h 0 ) c p
The source term of the energy equation is
S e = ρ c p ( Δ H ) t
The heat released by the hot air and wet air during cooling is
Q = M 0 ( h 2 h 1 )
where: h1, h2—the enthalpy of hot and wet air in state 1 and state 2, kJ/kg (dry air); M0—the mass flow rate of hot and wet air, kg/s.
The main indexes used to evaluate the dehumidification system are GOR and WPC. GOR is the product of fresh water output M (kg/h) and water evaporation latent heat γ (kJ/kg) over a period, as a ratio to the total power consumption E (kW) consumption in the same period. In this definition, solar energy consumption is not considered.
GOR = M γ 3600 E = M γ 3600 ( N p + N f )
Here, Np—power consumption by pump, kW; Nf—power consumption by fan, kW.
WPC is the water production cost, that is, the energy cost of producing fresh water per unit of quality. According to the price of commodity electricity of 0.08 USD/(kW·h), the calculation formula of WPC is:
WPC = 0.08 t ( N p + N f ) M × 1000
where, t—running time of dehumidifier, h.
If the heat stored in the phase change heat storage is supplied to a simple passive basin desalinator through the heat pipes to produce fresh water, the total fresh water output and GOR of the phase change heat storage dehumidifier will increase and the WPC will be further reduced. According to previous experience, the heat utilization rate in the basin desalinator is less than 30% [34].

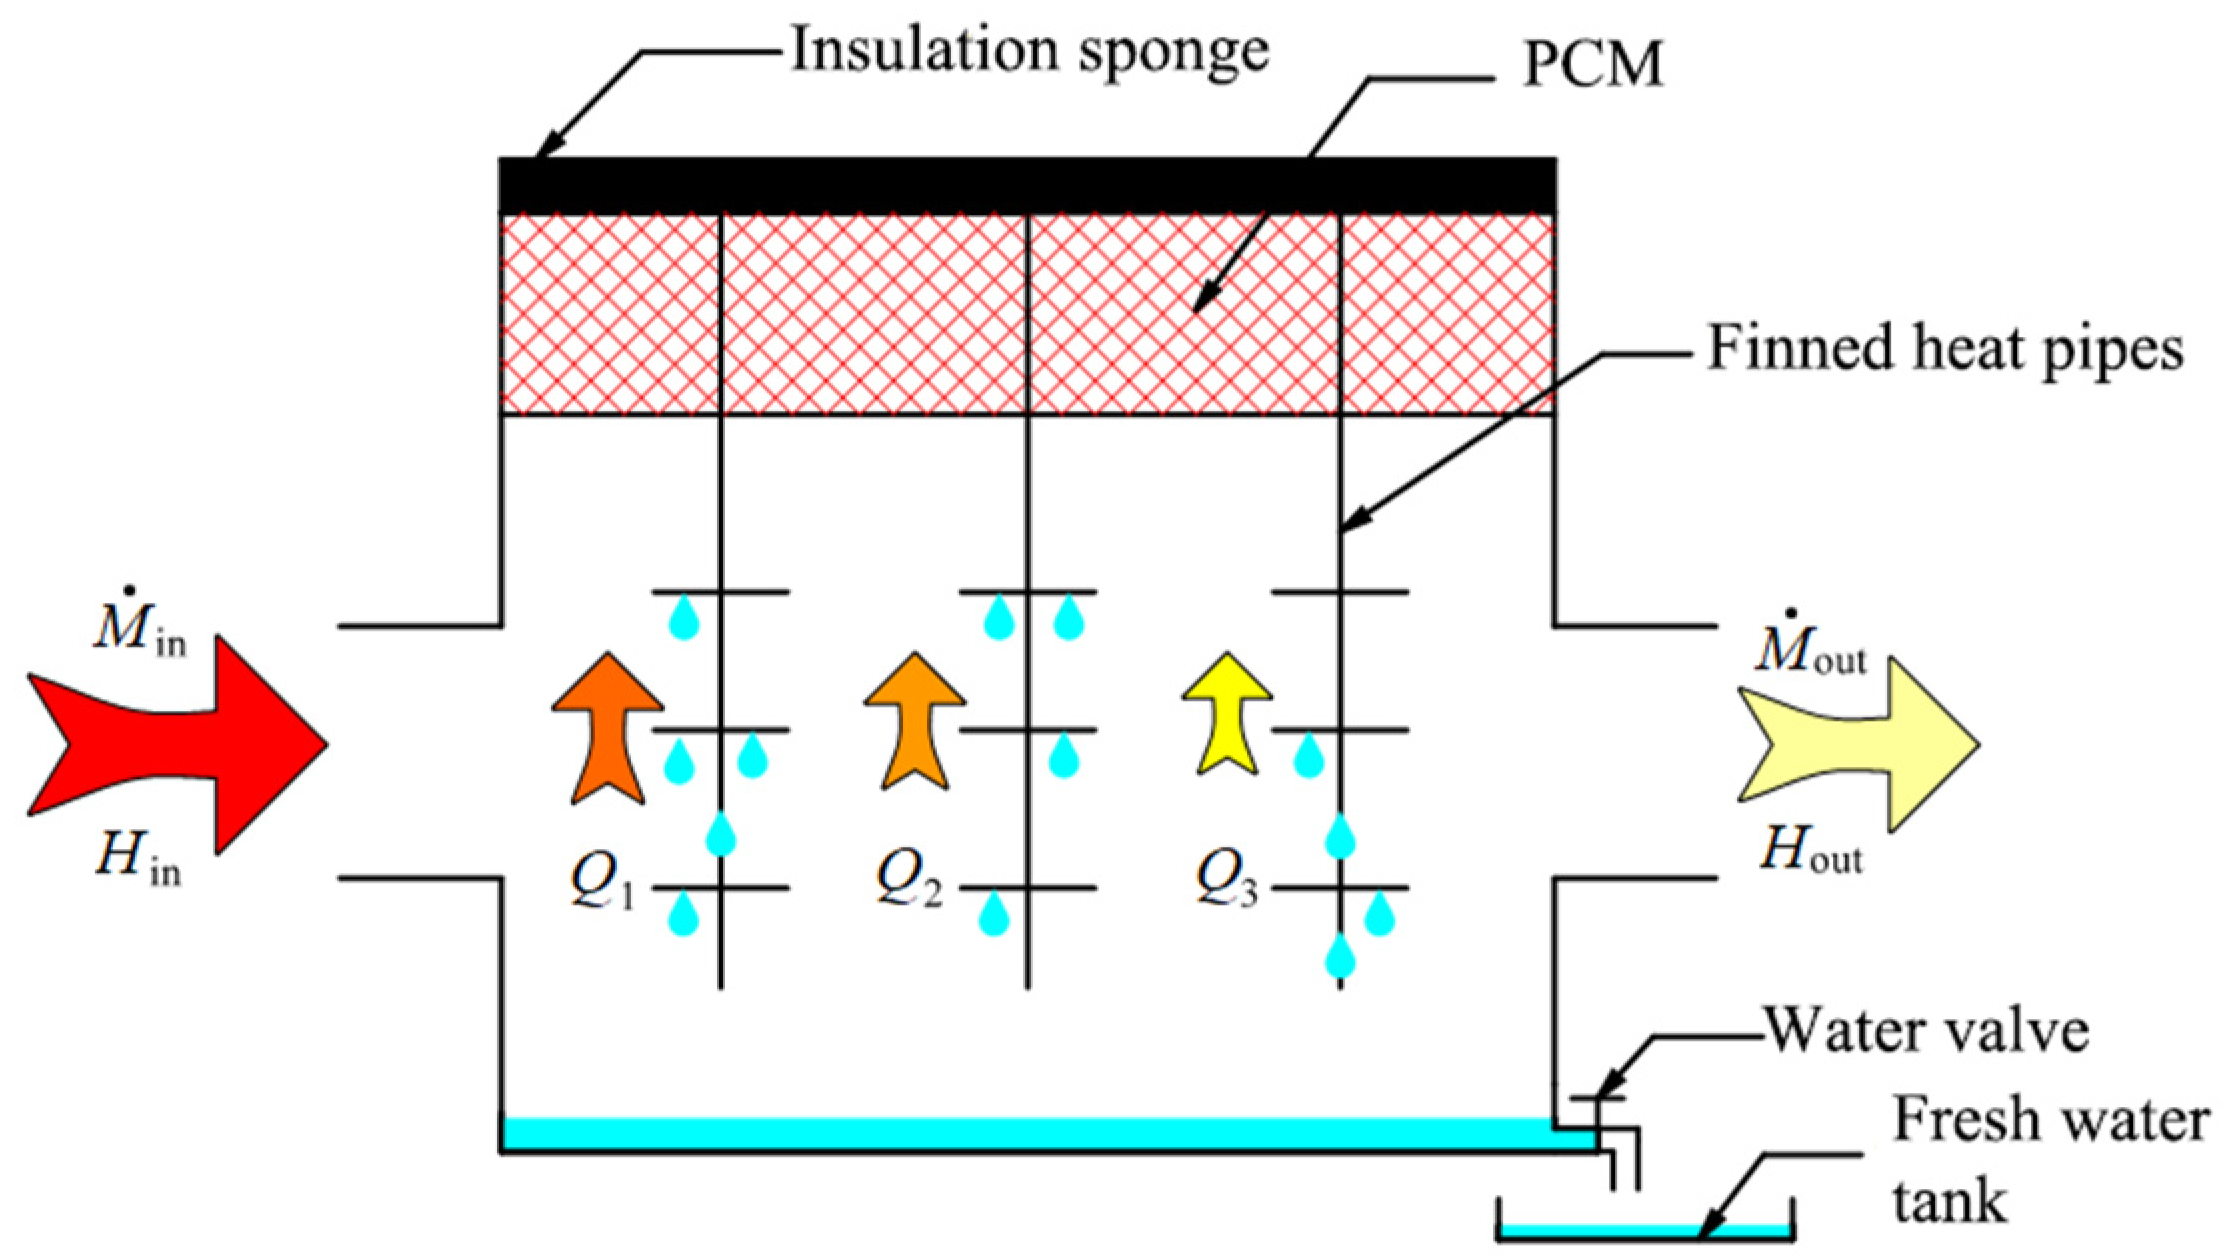
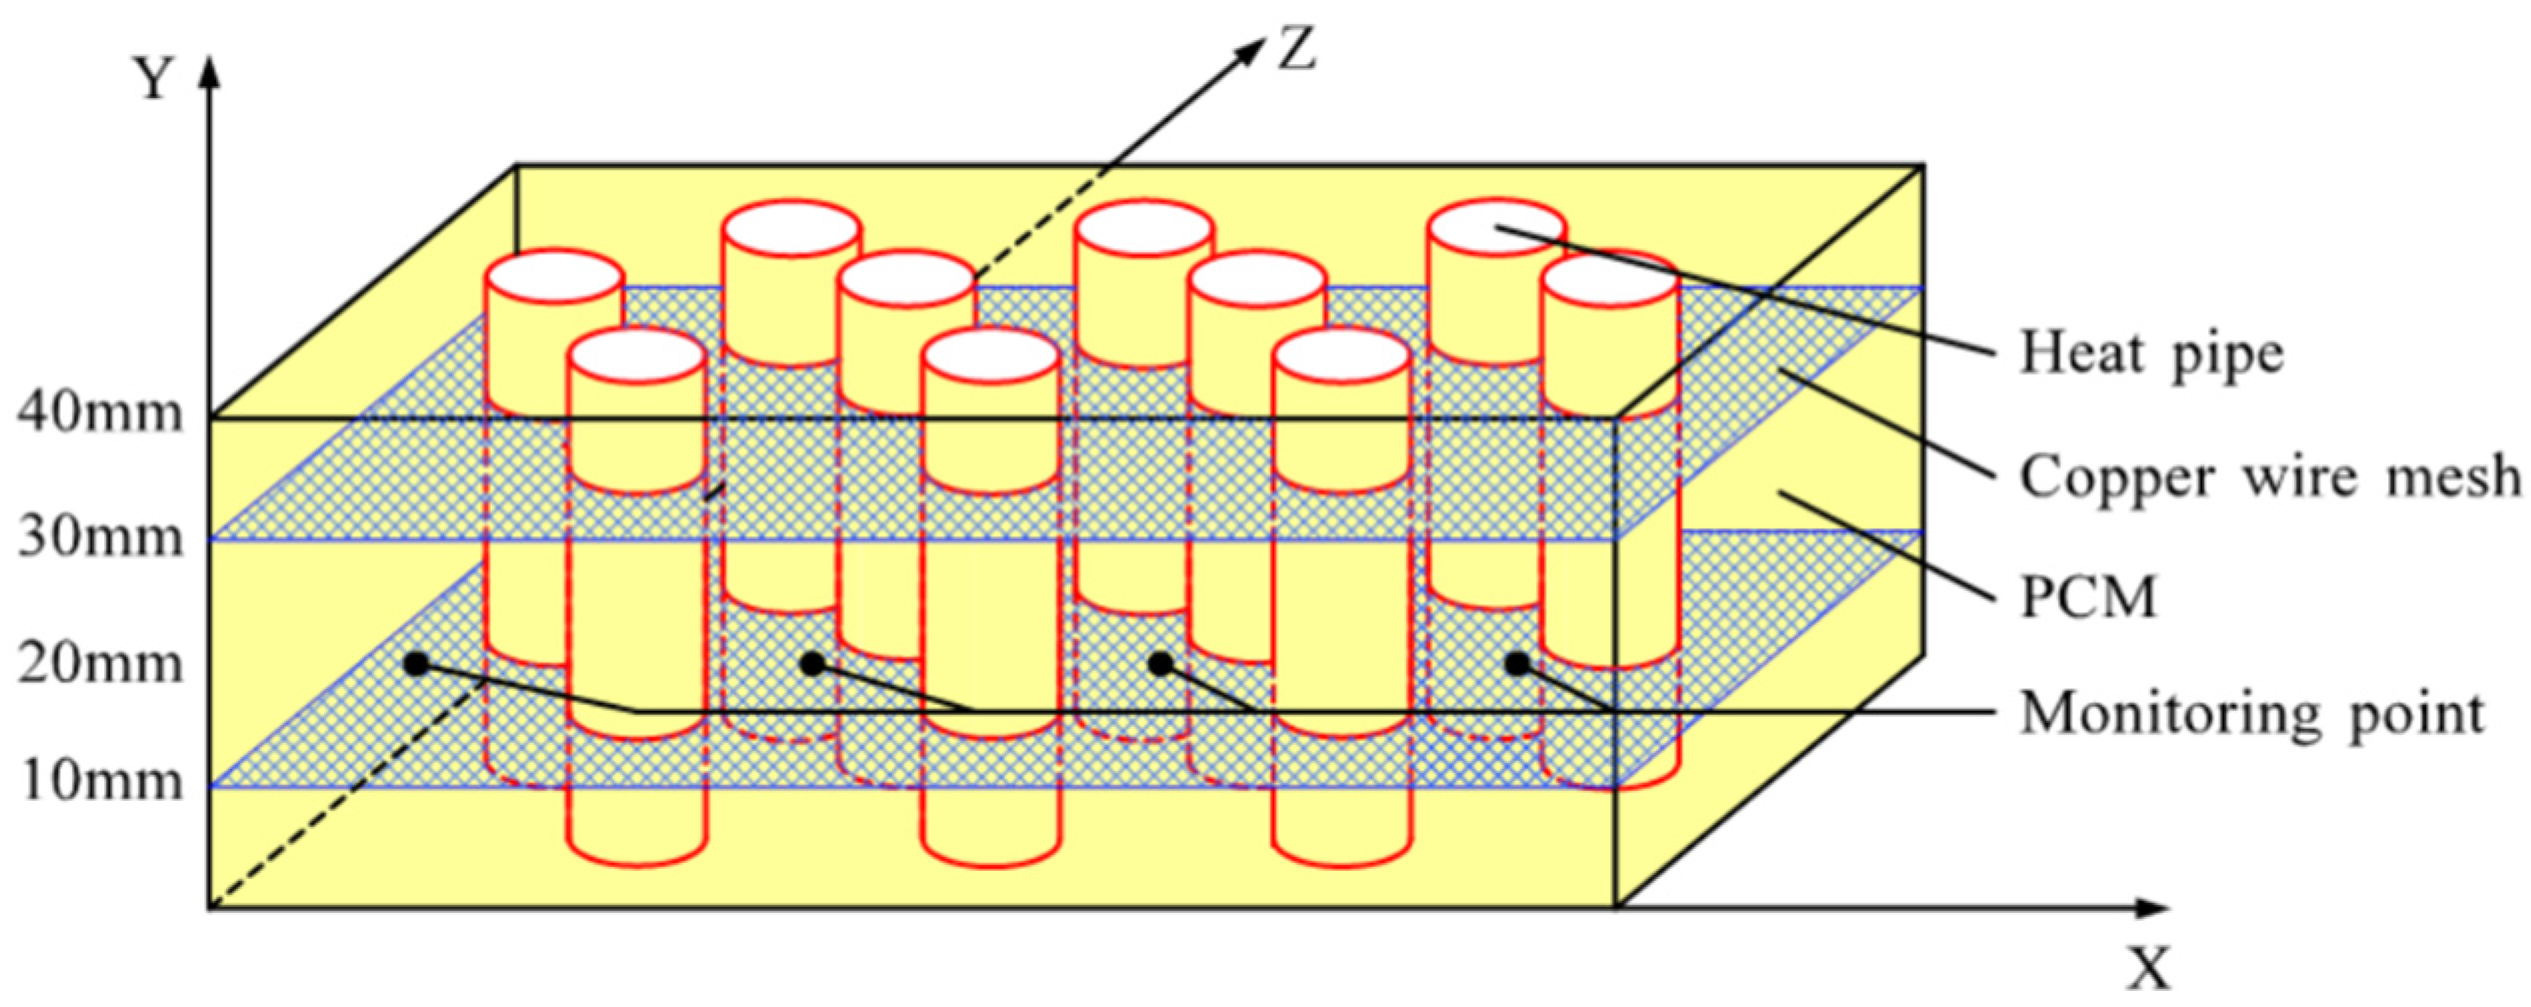
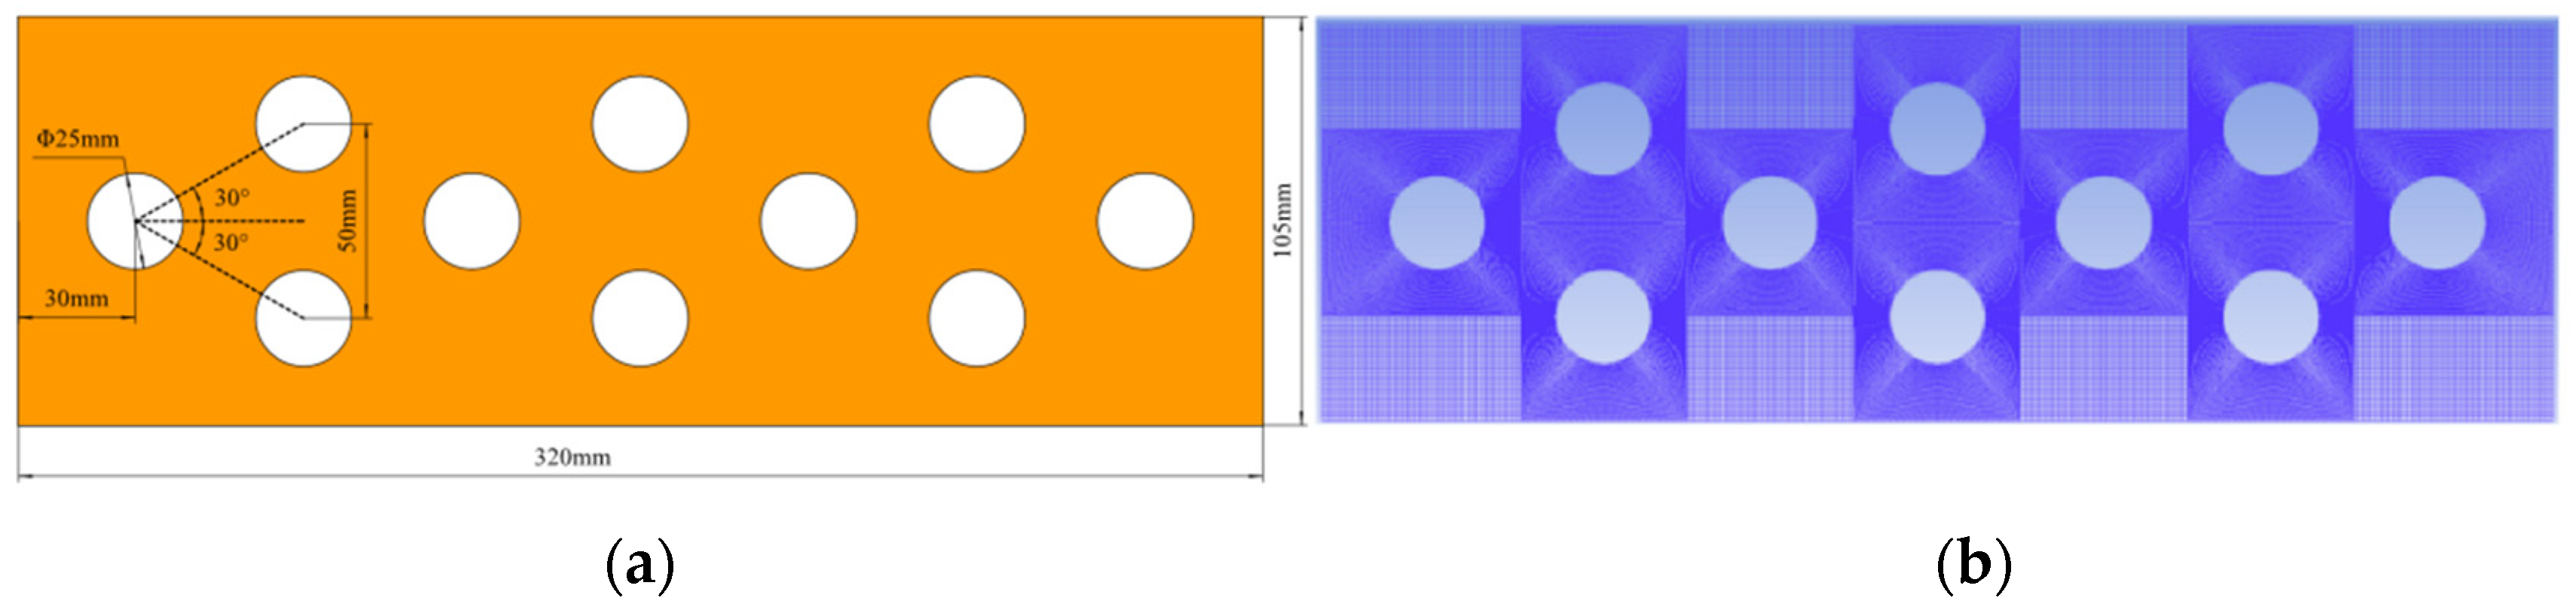
3.3. Numerical Simulation Calculation Model

The temperature variation of PCM can indirectly reflect the phase change heat transfer process. The temperature field of the internal section of PCM is not easily measured by experiment, but the temperature field of the upper surface of PCM can be taken by thermography, while the temperature fields of the inner surface and upper surface can be obtained through the numerical simulation of Fluent software.
The two-dimensional numerical calculation model for the heat transfer of the PCM and heat pipes is consistent with the experimental device, and the model and its structured grids are shown in Figure 6. The following assumptions were made for this model: (1) The density term satisfies the Boussinesq hypothesis, only the density change caused by temperature change is considered; (2) The wall thickness is 0; (3) The dynamic viscosity and thermal expansion coefficient of the phase change material are constant; (4) The heat transfer on the inner wall is under a constant wall temperature condition; (5) The phase change media is isotropic.
When the number of grids was 90436, compared with the number of grids 72507 and 103576 respectively, the relative errors of their average surface temperature were 0.043% and 0.012%, and the relative errors of their average liquid phase rate were 0.68% and 0.41%. The grid quality was above 0.93. Therefore, the number of grids used in subsequent calculations was 90436.
In the simulation calculation, setting the time step size as 0.3 s, the number of time steps is 24,000, that is, 120 min, and the max iterations/time step is 100. The numerical simulation task of this work was completed by 12 CPU cores, and their average CPU time for calculating 15 s is 86.05 s. Figure 7 shows the residual errors of the energy equation, which were less than 1 × 10⁻⁴, thus meeting the calculation accuracy requirements.

4. Results

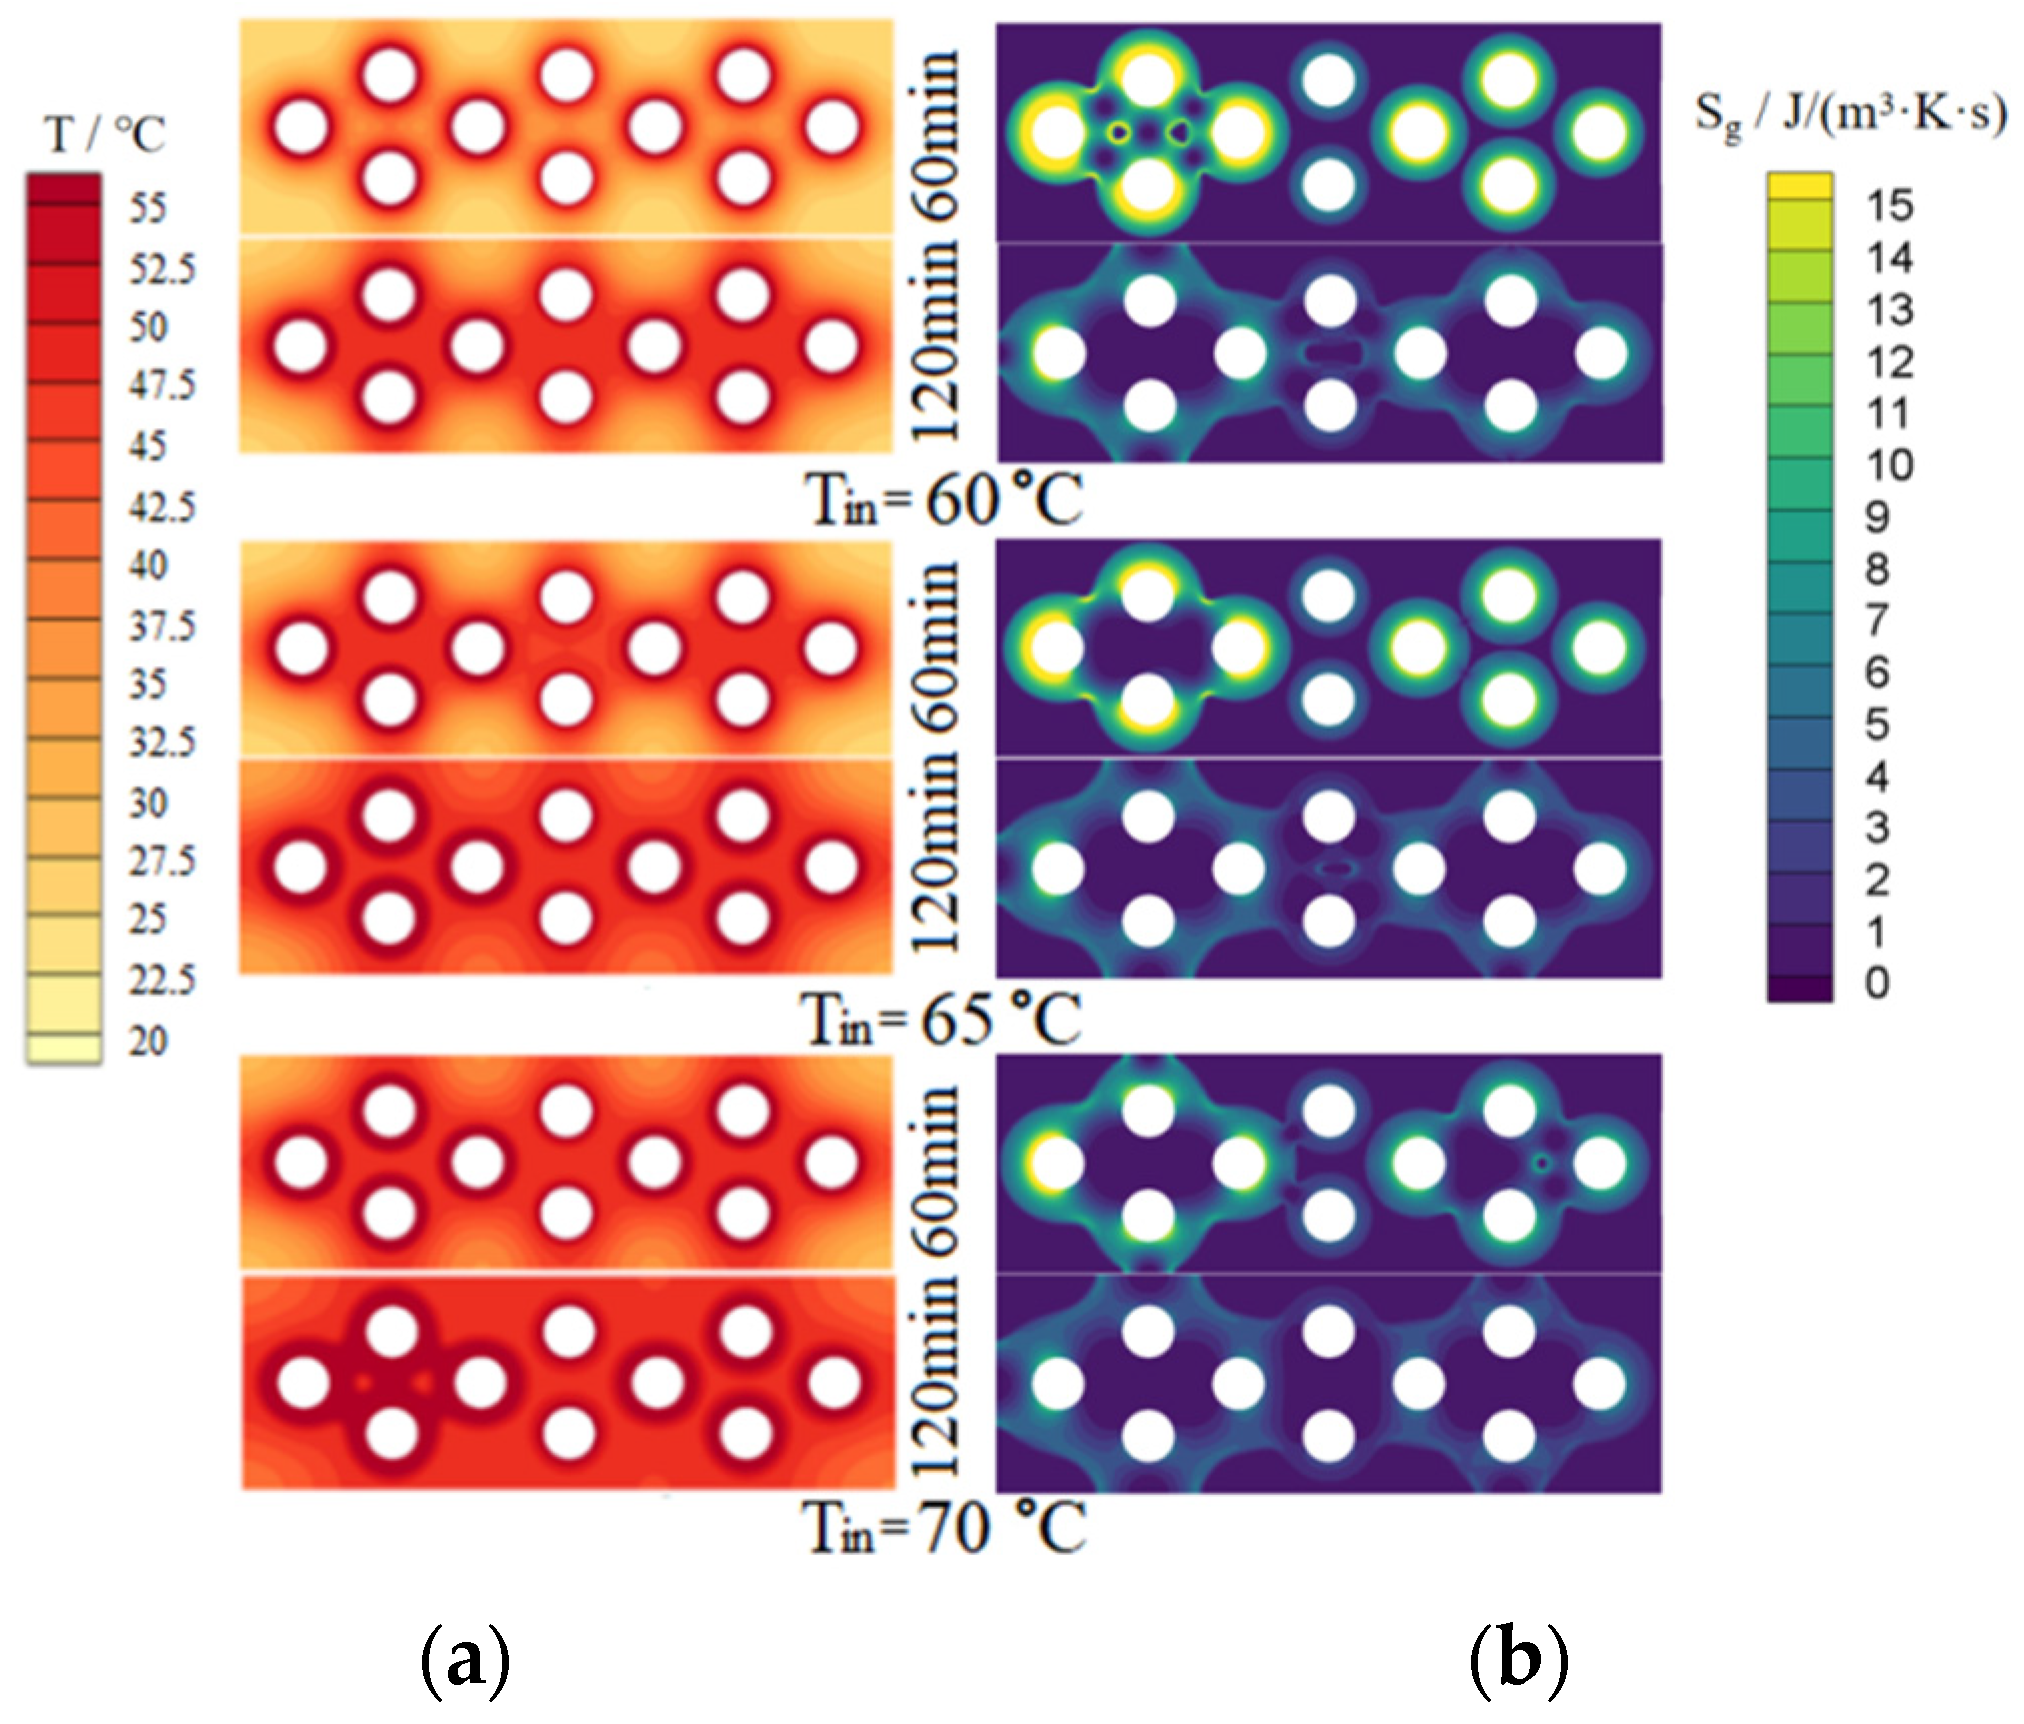
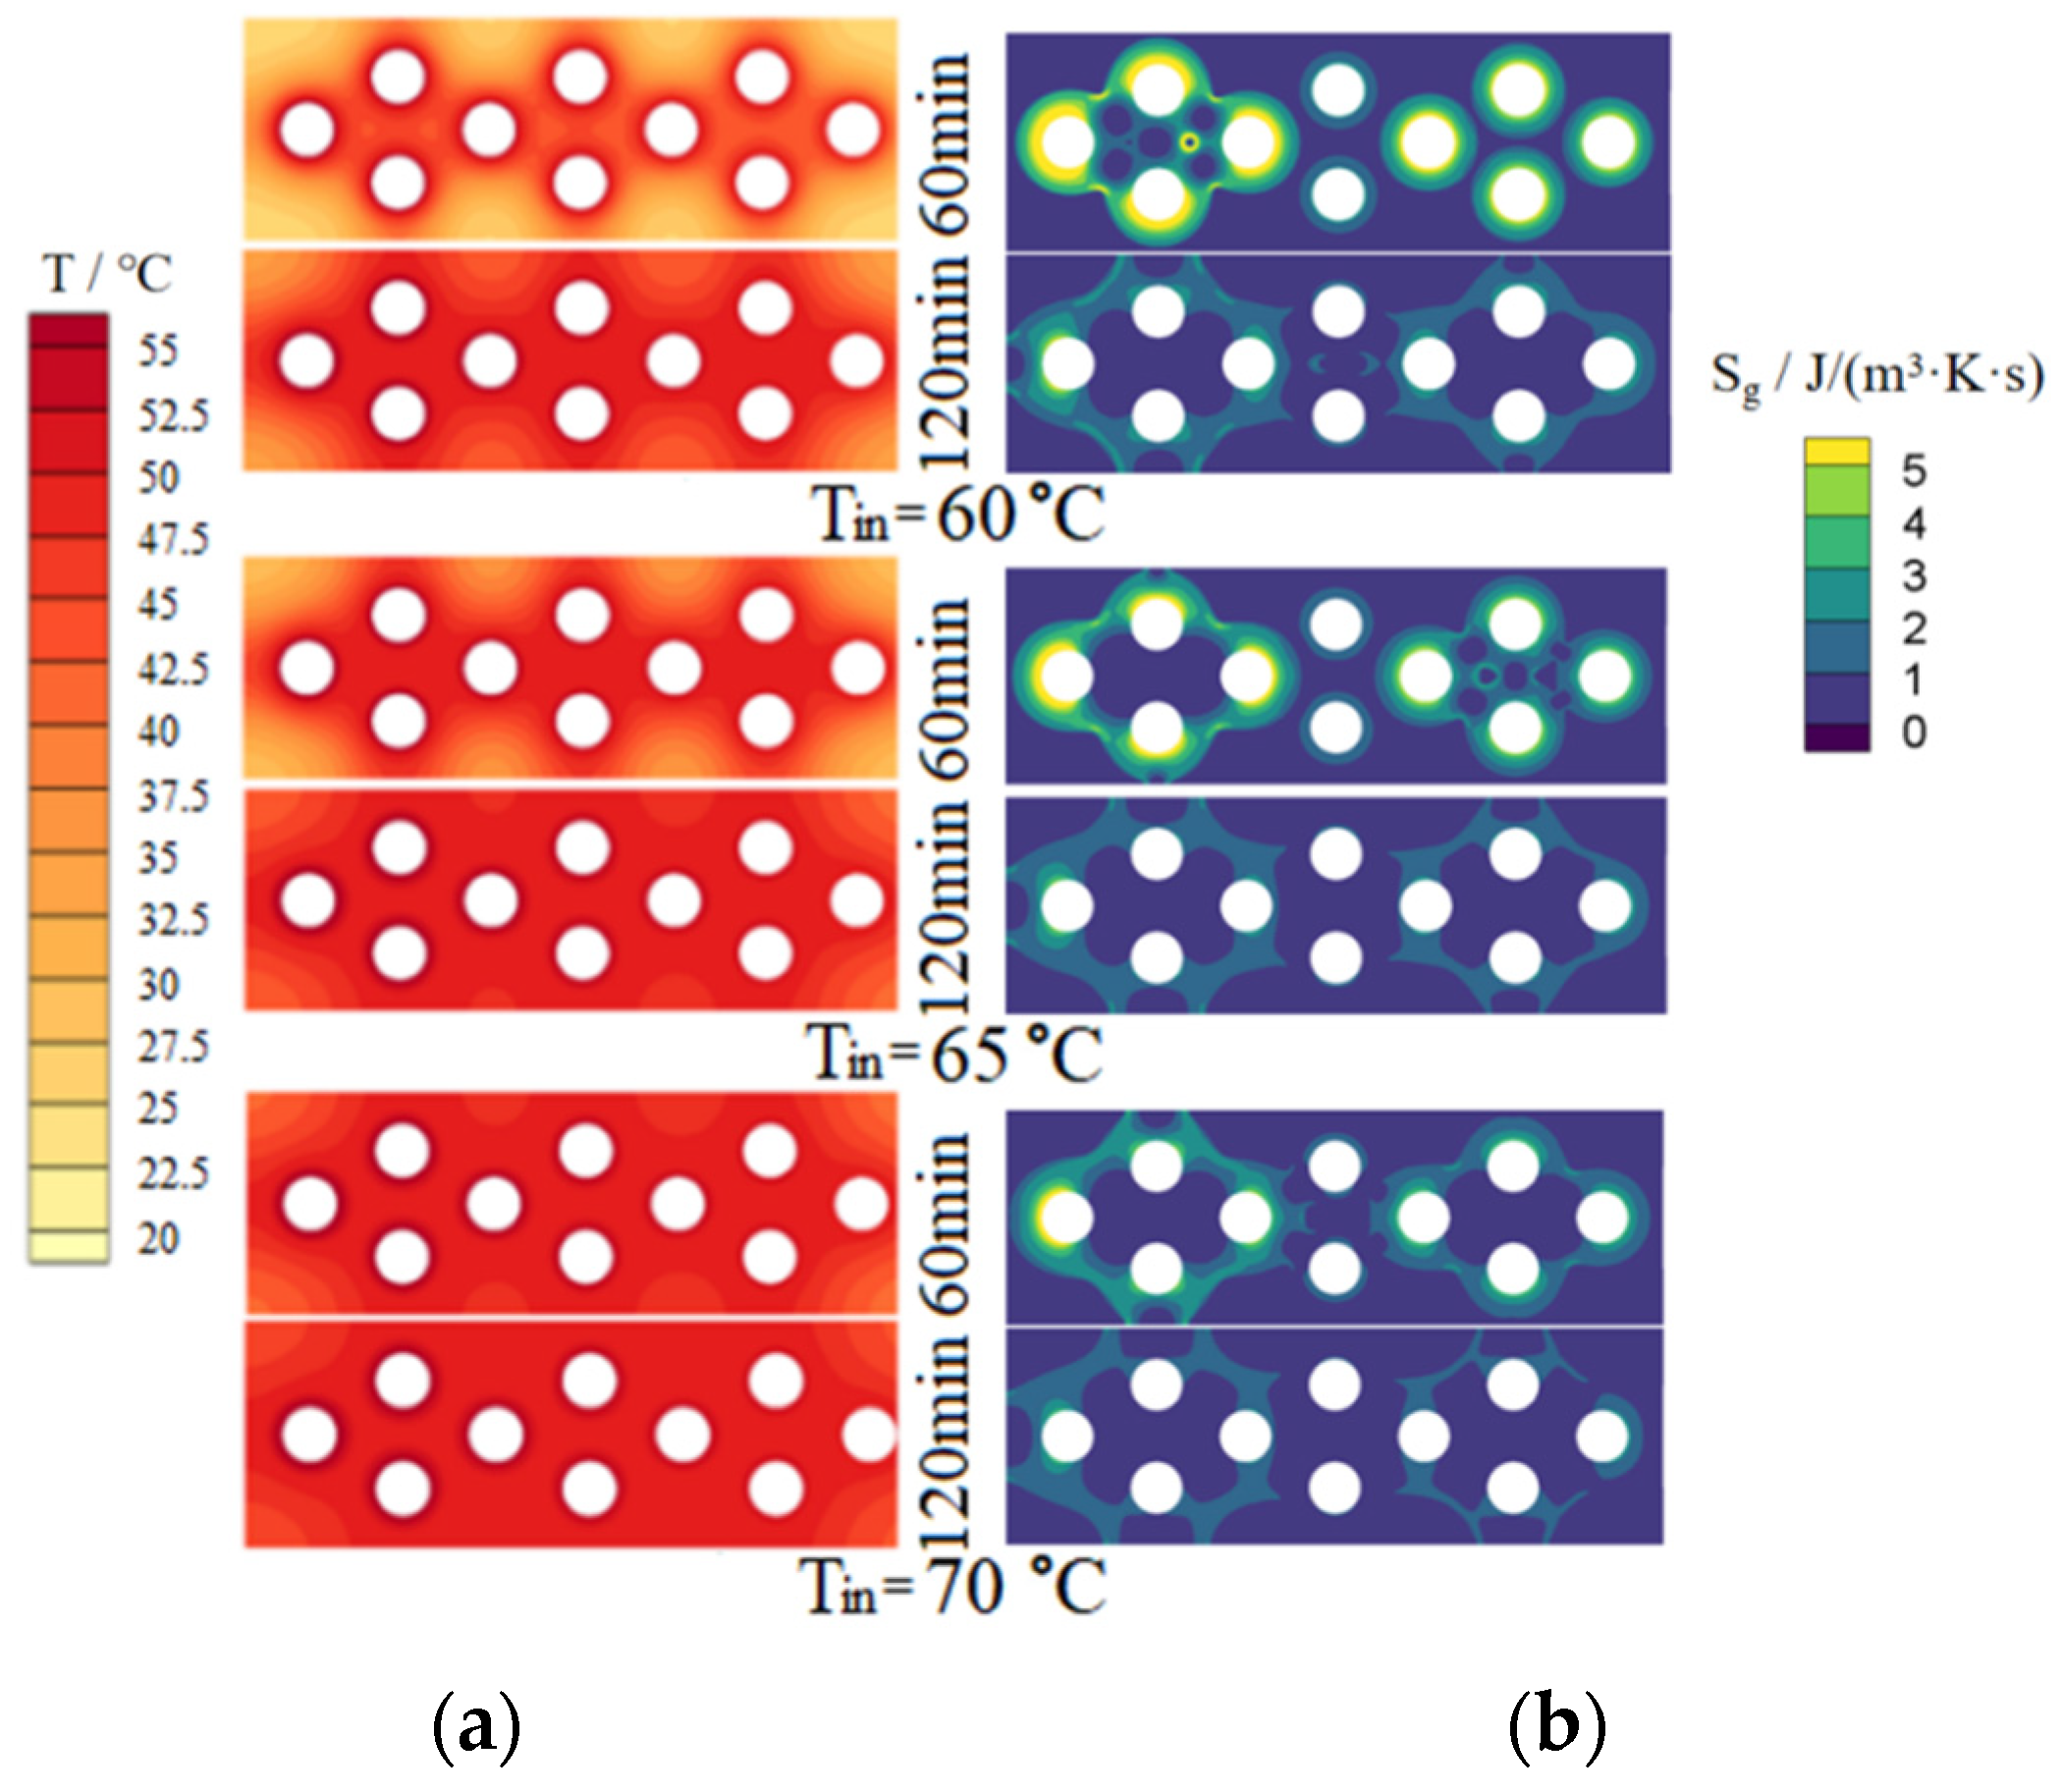
4.1. Simulation of Temperature Fields and Entropy Generation Rate Fields on PCMs Upper Surface

In the numerical simulation for the temperature fields on PCMs’ upper surface, referring to the data measured in the experiments, along the air flow direction from left to right, the wall temperatures of heat pipes between adjacent rows were set to decrease in turn. When only heat pipes and PCM were coupled for heat transfer, the minimum and maximum temperature differences between the simulation calculation results and the experimental results were 1.28% and 2.56%, that is, the simulation calculation results were basically consistent with the experimental results.
Figure 8 and Figure 9 show the simulated temperature fields and entropy generation fields on the upper surface of the dehumidifier for PCM-1 and PCM-2 respectively. In the two figures, the left column is the temperature fields and the right column is the entropy generation rate fields.

4.1.1. Simulation of Temperature Fields

For PCM-1 and PCM-2, it can be seen from Figure 8 and Figure 9 that, with the increase of heating time, the phase-changed region on the upper surface of the PCMs increased gradually; with the increase of hot and wet air temperature at the inlet of the dehumidifier, the temperature and phase-changed area on the upper surface of the PCMs increased significantly under the same heating time. Under the same conditions, the temperature distribution on the upper surface of PCM-1 was more uniform than that of PCM-2. This is because the thermal conductivity of PCM-1 was higher than that of PCM-2, so the heat transfer of PCM-1 to the surrounding area was faster, and the heat accumulated near the heat pipes was less than that of PCM-2, resulting in the melting amount of PCM-1 around the heat pipes being less than that of PCM-2; since the density and the phase change latent heat of PCM-1 were larger than that of PCM-2, it means that PCM-1 has a larger mass and more thermal storage capacity under the same volume.

4.1.2. Simulation of Entropy Generation Fields

Generally, in the process of flow and heat transfer, the global entropy generation includes thermal and friction entropy generation. The global entropy generation rate in per unit volume can be expressed as follows [35]:
S g = λ T 2 ( T ) 2 + μ Φ T
where, Sg—entropy generation rate per unit volume, J/(m3·K·s); λ—thermal conductivity, W/(m·K); T—temperature, K; μ—dynamic viscosity, kg/(m·s); Φ —viscous dissipation function, J/(m2·kg).
In Equation (12), the irreversible energy loss caused by heat transfer with finite temperature difference depends on the thermal conductivity and temperature field of the fluid, while the irreversible energy loss caused by friction depends on the viscosity and velocity field of the fluid.
In 1982, Bejan defined a parameter called irreversibility distribution ratio ϕ as follows [36]:
ϕ = S g , f S g ,   h
where, ϕ —irreversibility distribution ratio; Sg, h—thermal entropy generation rate due to heat transfer, J/(K·s); Sg, f—friction entropy generation rate due to fluid flow, J/(K·s).
Natalini and Sciubba [37] introduced Bejan number as Be instead of irreversibility distribution ratio ϕ , as follows:
B e = S g , h S g , h + S g , f = 1 1 + ϕ
In this study, since there was almost no fluid flow in the melting process on the upper surface of PCMs, the friction entropy generation could be ignored, and the dominant entropy generation was thermal entropy generation. Therefore, from Equations (13) and (14), we conclude ϕ = 0 and Be = 1.
For PCM-1 and PCM-2, using Equation (12), the thermal entropy generation rates of each point on the upper surface of PCMs were calculated and the contours of entropy generation were drawn and are shown in the right column of Figure 8 and Figure 9 respectively.
As shown in the right column of Figure 8 and Figure 9, the ranges of entropy generation rate of PCM-1 and PCM-2 were 0~14.32 J/(m3·K·s) and 0~4.89 J/(m3·K·s). Under the same conditions, the thermal entropy generation of PCM-1 was greater than that of PCM-2 because the thermal conductivity of PCM-1 was greater than that of PCM-2 and their temperature fields were different. With the increase of heating time, the thermal entropy generation decreased; with the increase of the hot and wet air temperature at the inlet of the dehumidifier, the thermal entropy production decreased. The maximum temperature gradient was on the left side of the cloud image, so the maximum thermal entropy generation was also in there. The temperature gradient in the middle region of the cloud image was relatively small, and therefore the thermal entropy generation in there was also relatively small. The minimum thermal entropy generation appeared at the corner of the cloud image, where the heat transfer caused by the temperature difference was low.

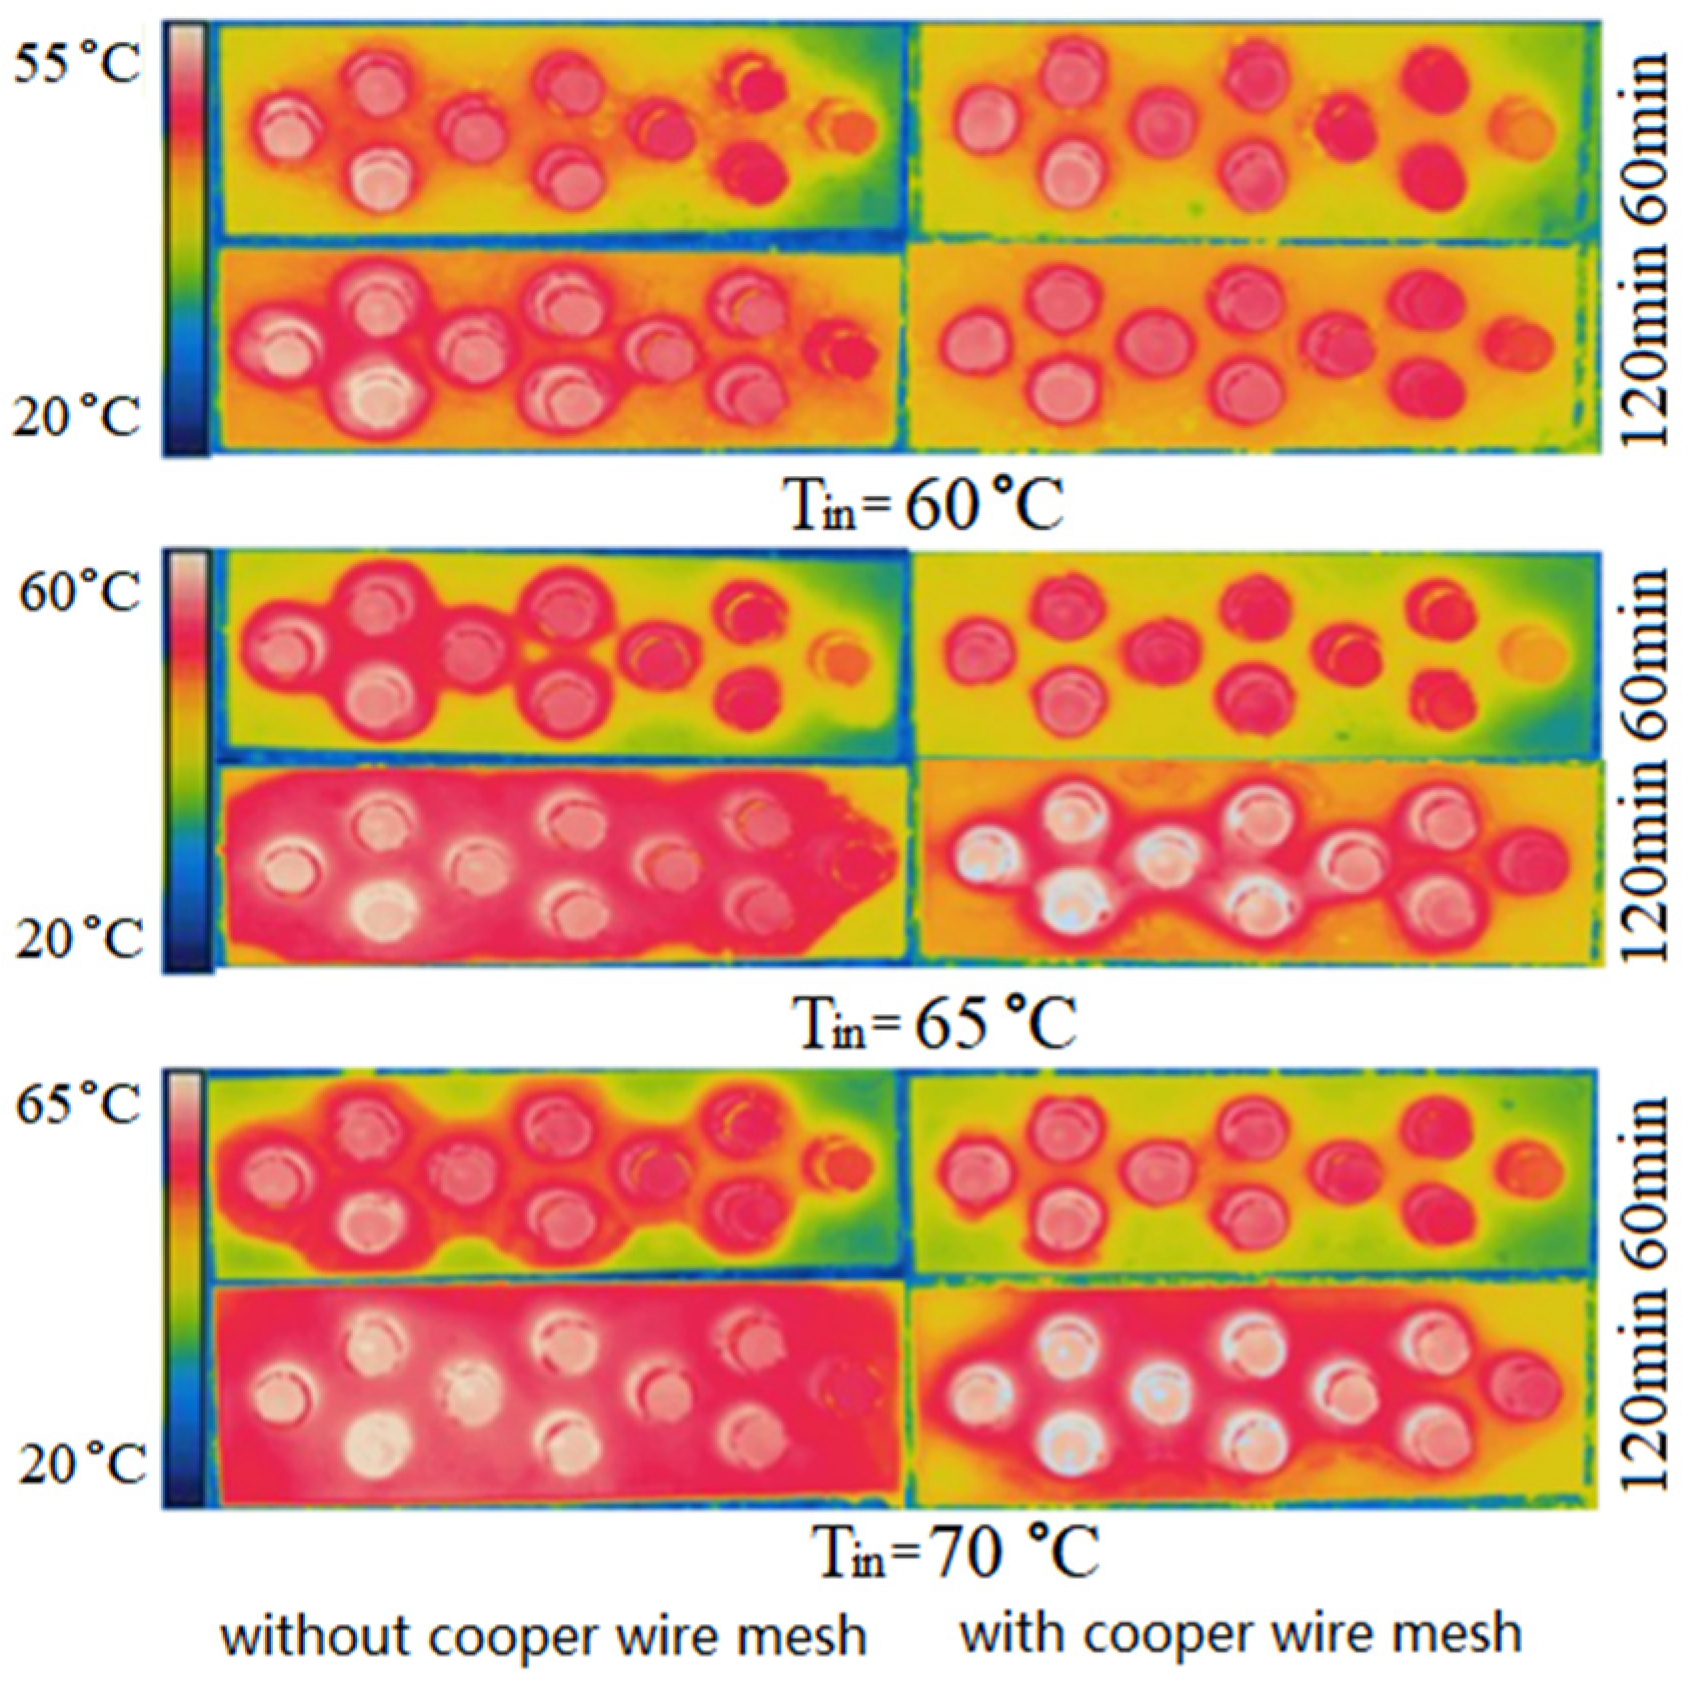
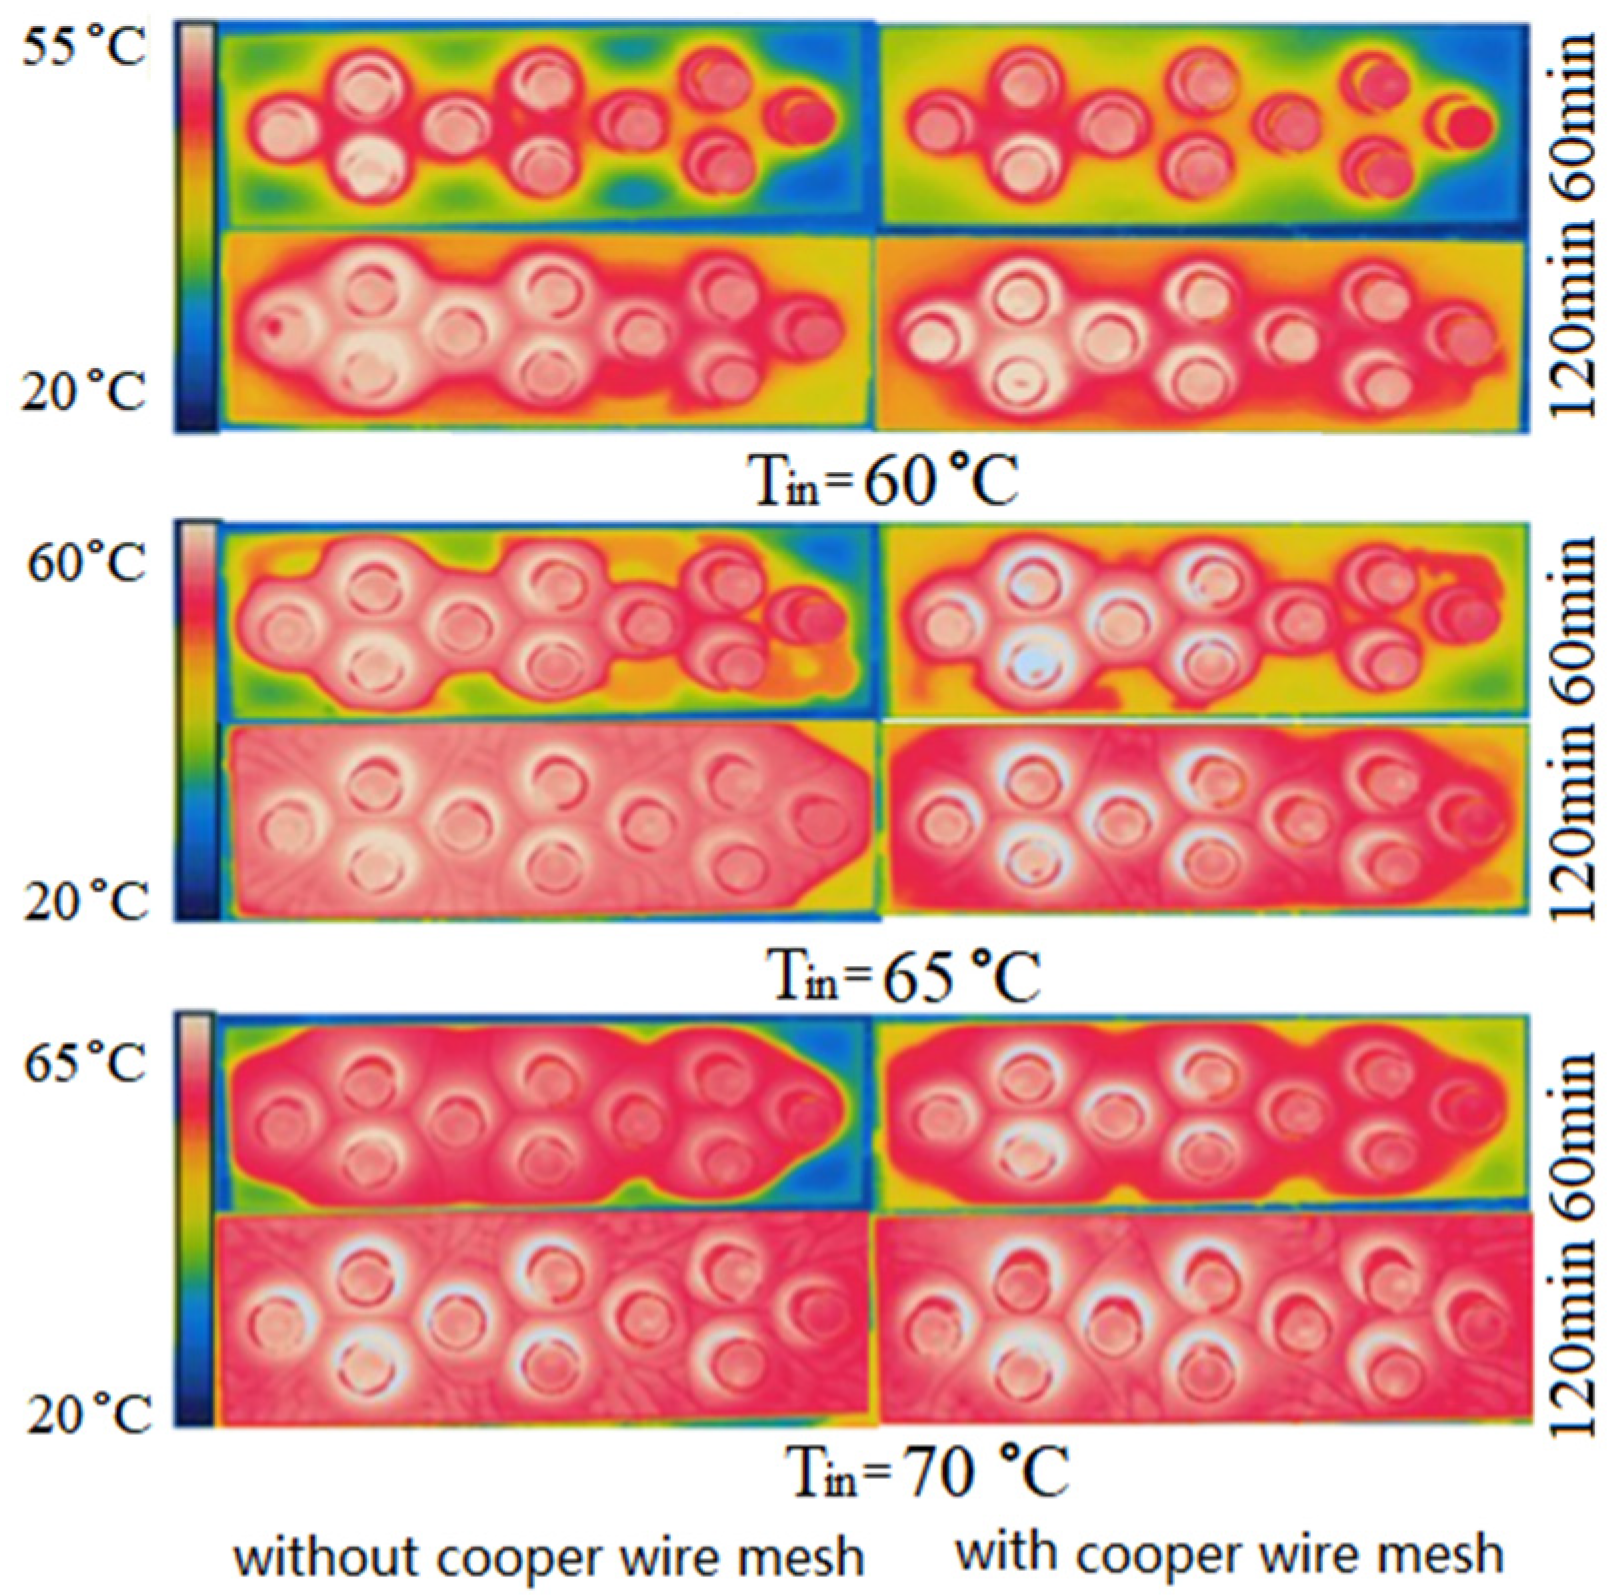
4.2. Experimental Temperature Fields on PCMs Upper Surface

Figure 10 and Figure 11 show the experimental temperature fields on the upper surfaces of PCM-1 and PCM-2, in which the left and right columns are the temperature fields without and with copper wire meshes respectively. In the left column, the variation law of temperature field with parameters is consistent with the simulation results in Section 4.1.1.
Comparing Figure 10 and Figure 11, the uniformity change of the temperature field on the upper surface of PCM-2 before and after the addition of copper wire meshes were more significant than that of PCM-1. This is because the thermal conductivity of PCM-2 was lower than that of PCM-1, and its own heat transfer capacity was relatively low. Therefore, the heat transfer enhancement effect of PCM-2 after the addition of copper wire meshes was more significant.
To sum up, under the same volume, selecting and using PCM-1 can increase the heat storage, while adding copper wire meshes to the PCM can accelerate the heat transfer rate.

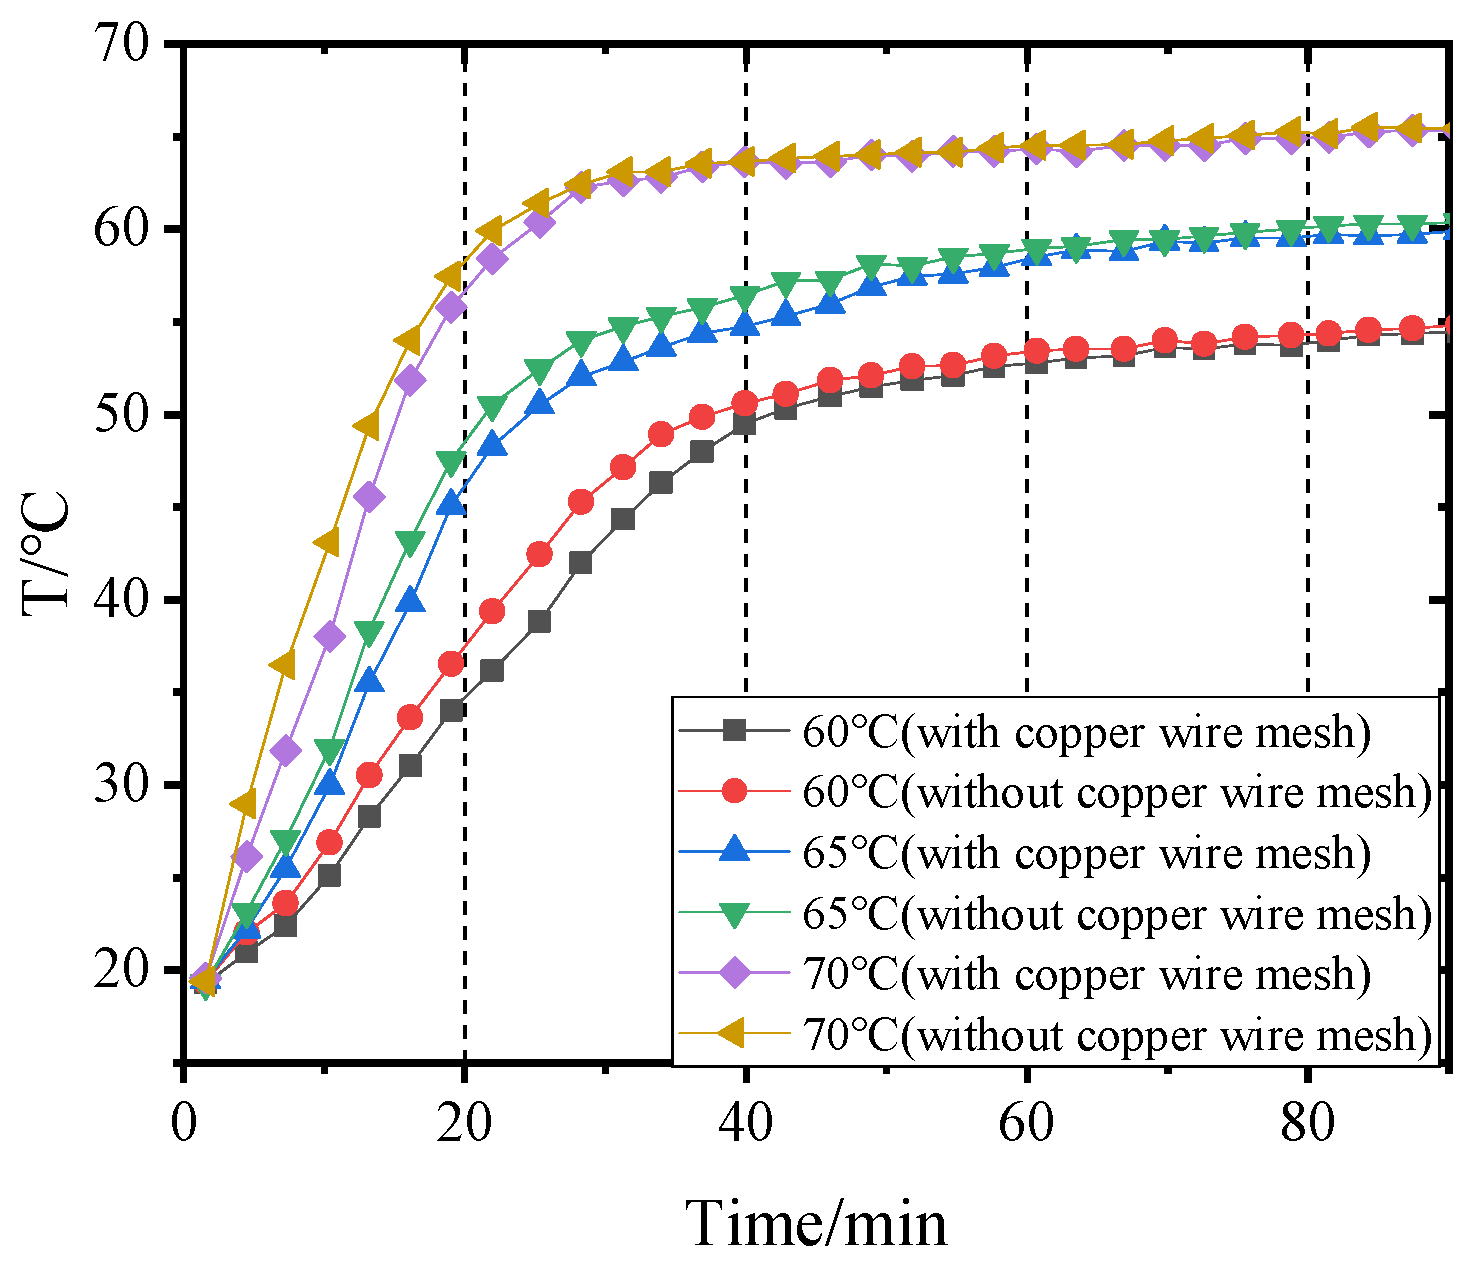
4.3. Influence of Inlet Air Temperatures of Dehumidifier on Outlet Air Temperatures before and after Adding Copper Wire Meshes

The air temperature at the outlet of the dehumidifier can reflect the heat transfer degree between the hot and wet air and the heat pipes indirectly. When the temperature of hot and wet air entering the dehumidifier is constant, the lower the temperature of the air leaving the dehumidifier, and the more sufficient the heat exchange between the air and the heat pipes. Figure 12 and Figure 13 show the air temperatures change at the outlet of the dehumidifier before and after adding copper wire meshes to PCM-1 and PCM-2 when the hot and wet air enters the dehumidifier at different temperatures. The higher the temperature of the wet air entering the dehumidifier, the faster the temperature rise rate of air leaving the dehumidifier. When the temperature of hot and wet air at the inlet of the dehumidifier was 60 °C, 65 °C, and 70 °C respectively, if PCM-1 was used for heat storage, the time required for the air temperature at the outlet of the dehumidifier to reach stability was 63 min, 48 min, and 36 min, respectively; if using PCM-2, the time required for the air temperature at the outlet of the dehumidifier to reach stability was 54 min, 45 min, and 30 min. That is, when the volume of the PCM was constant, compared with PCM2, if PCM-1 was used for heat storage, the air temperature at the outlet of the dehumidifier took longer to stabilize, and the temperature difference between the inlet and outlet of the dehumidifier was larger, which indirectly indicates that PCM-1 has a better heat storage effect than PCM-2.
After adding copper wire meshes into the PCM, the air temperature rise rate at the outlet of the dehumidifier was less than without copper wire meshes. This is because the copper wire meshes can quickly transfer heat from the heat pipes to the PCM along the transverse direction, which accelerates the heat exchange between the lower end of the heat pipes and the air, resulting in the reduction of the air temperature at the outlet of the dehumidifier.

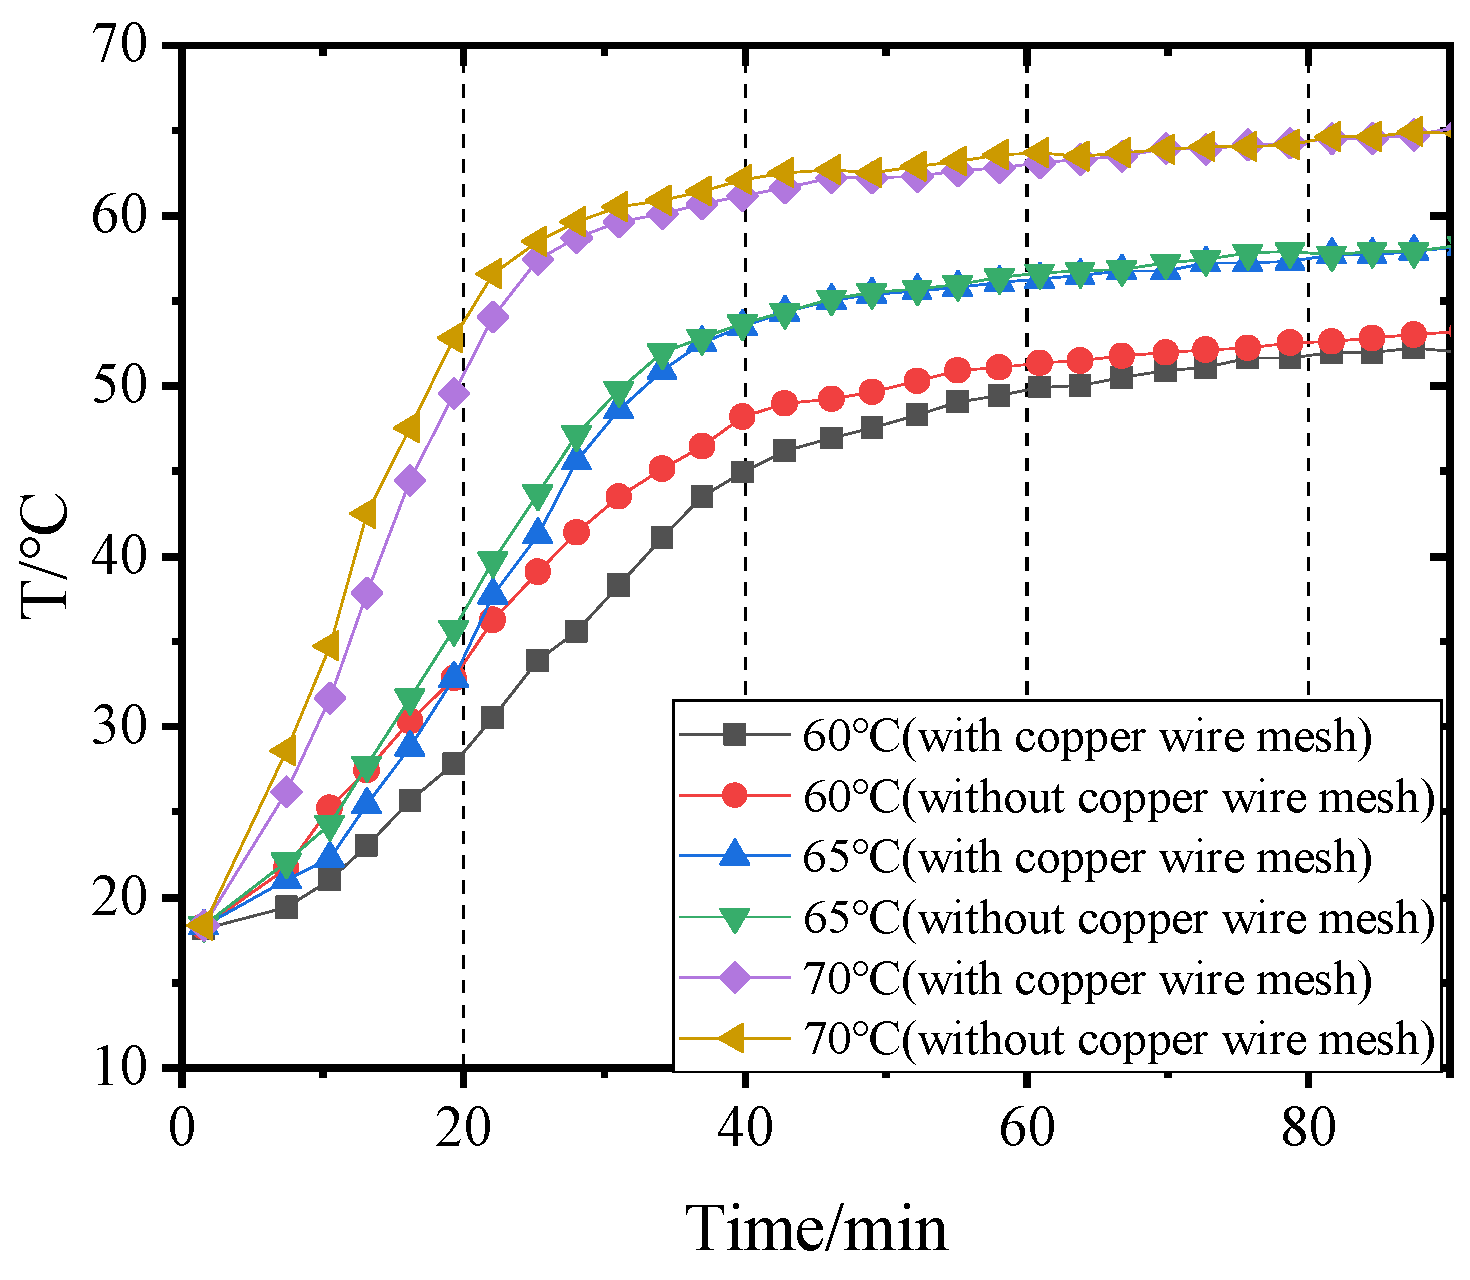
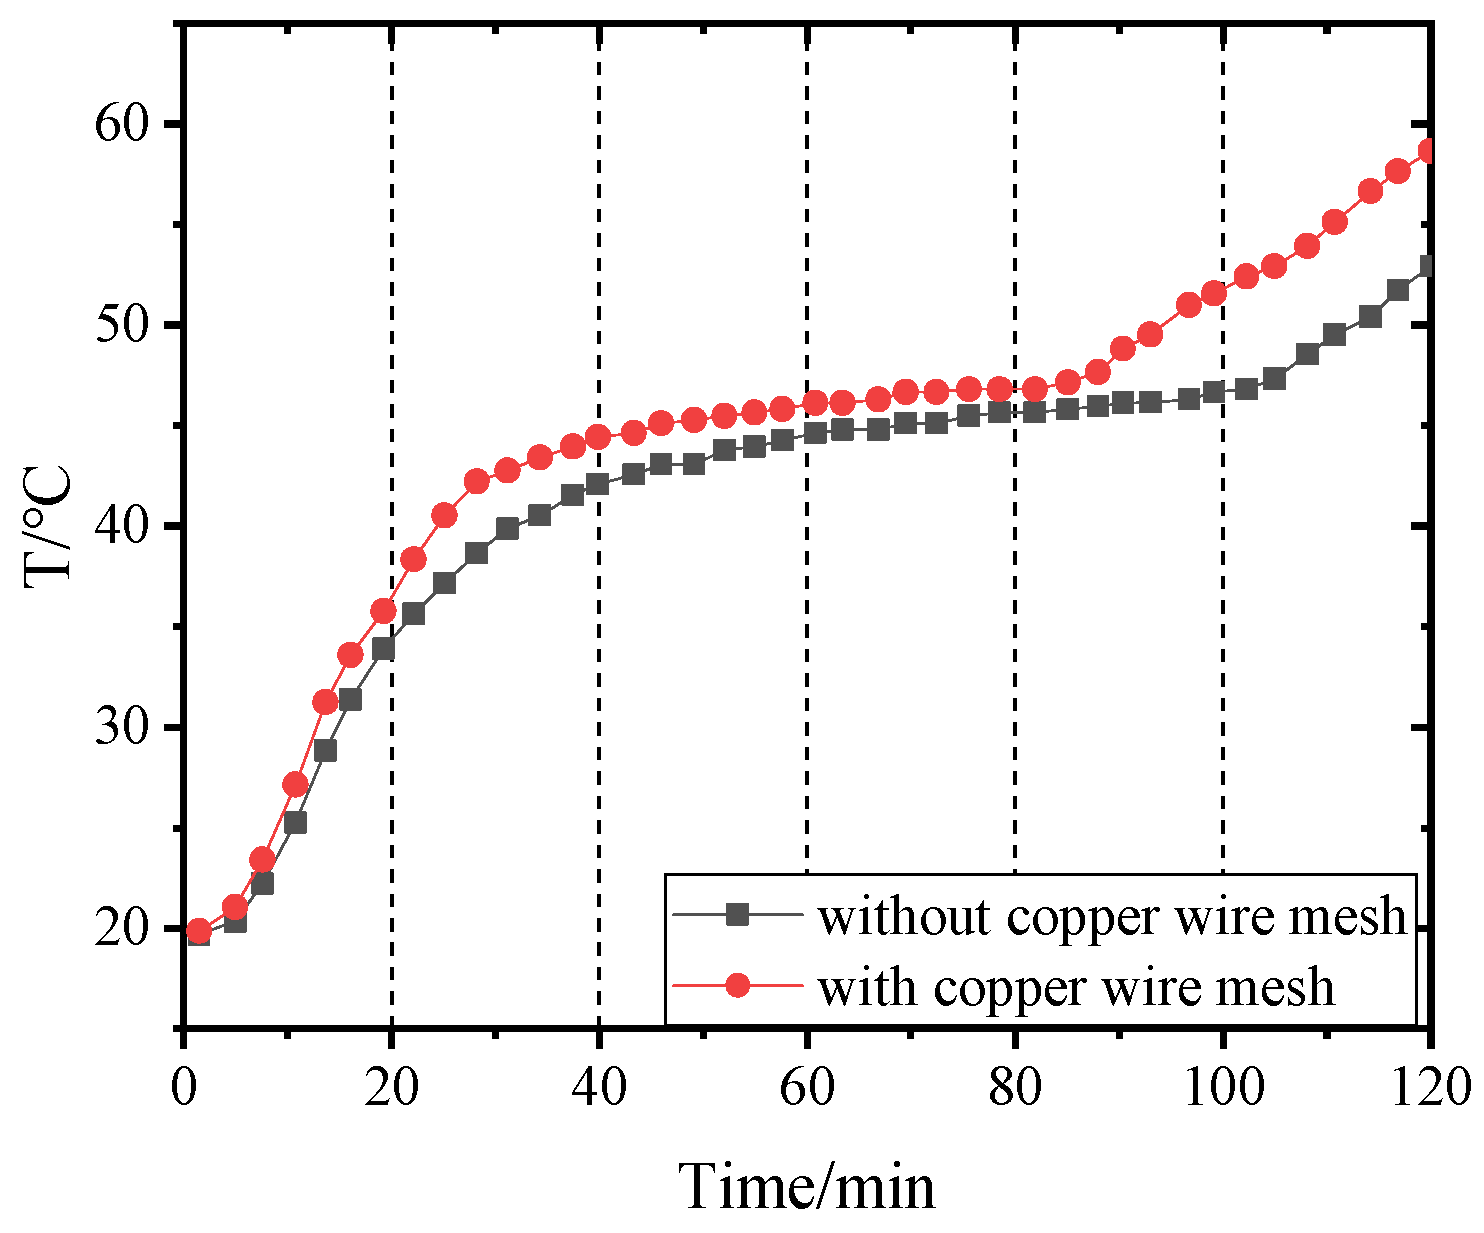
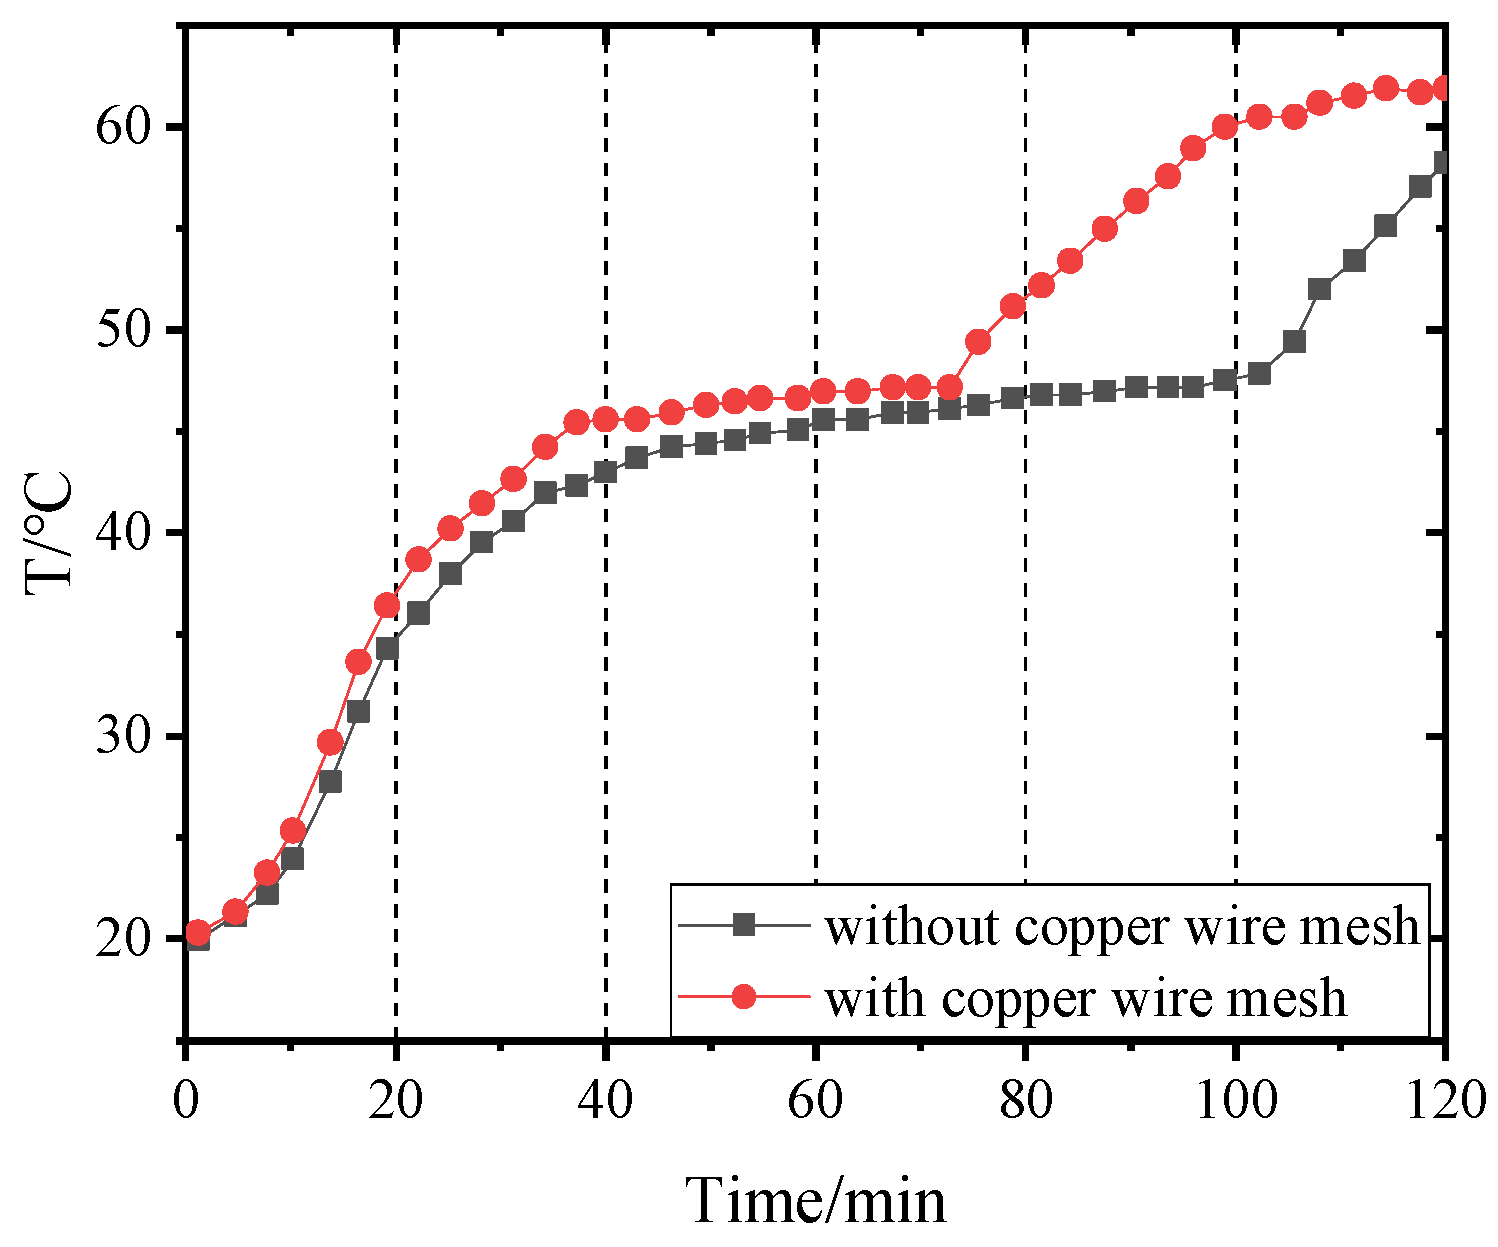
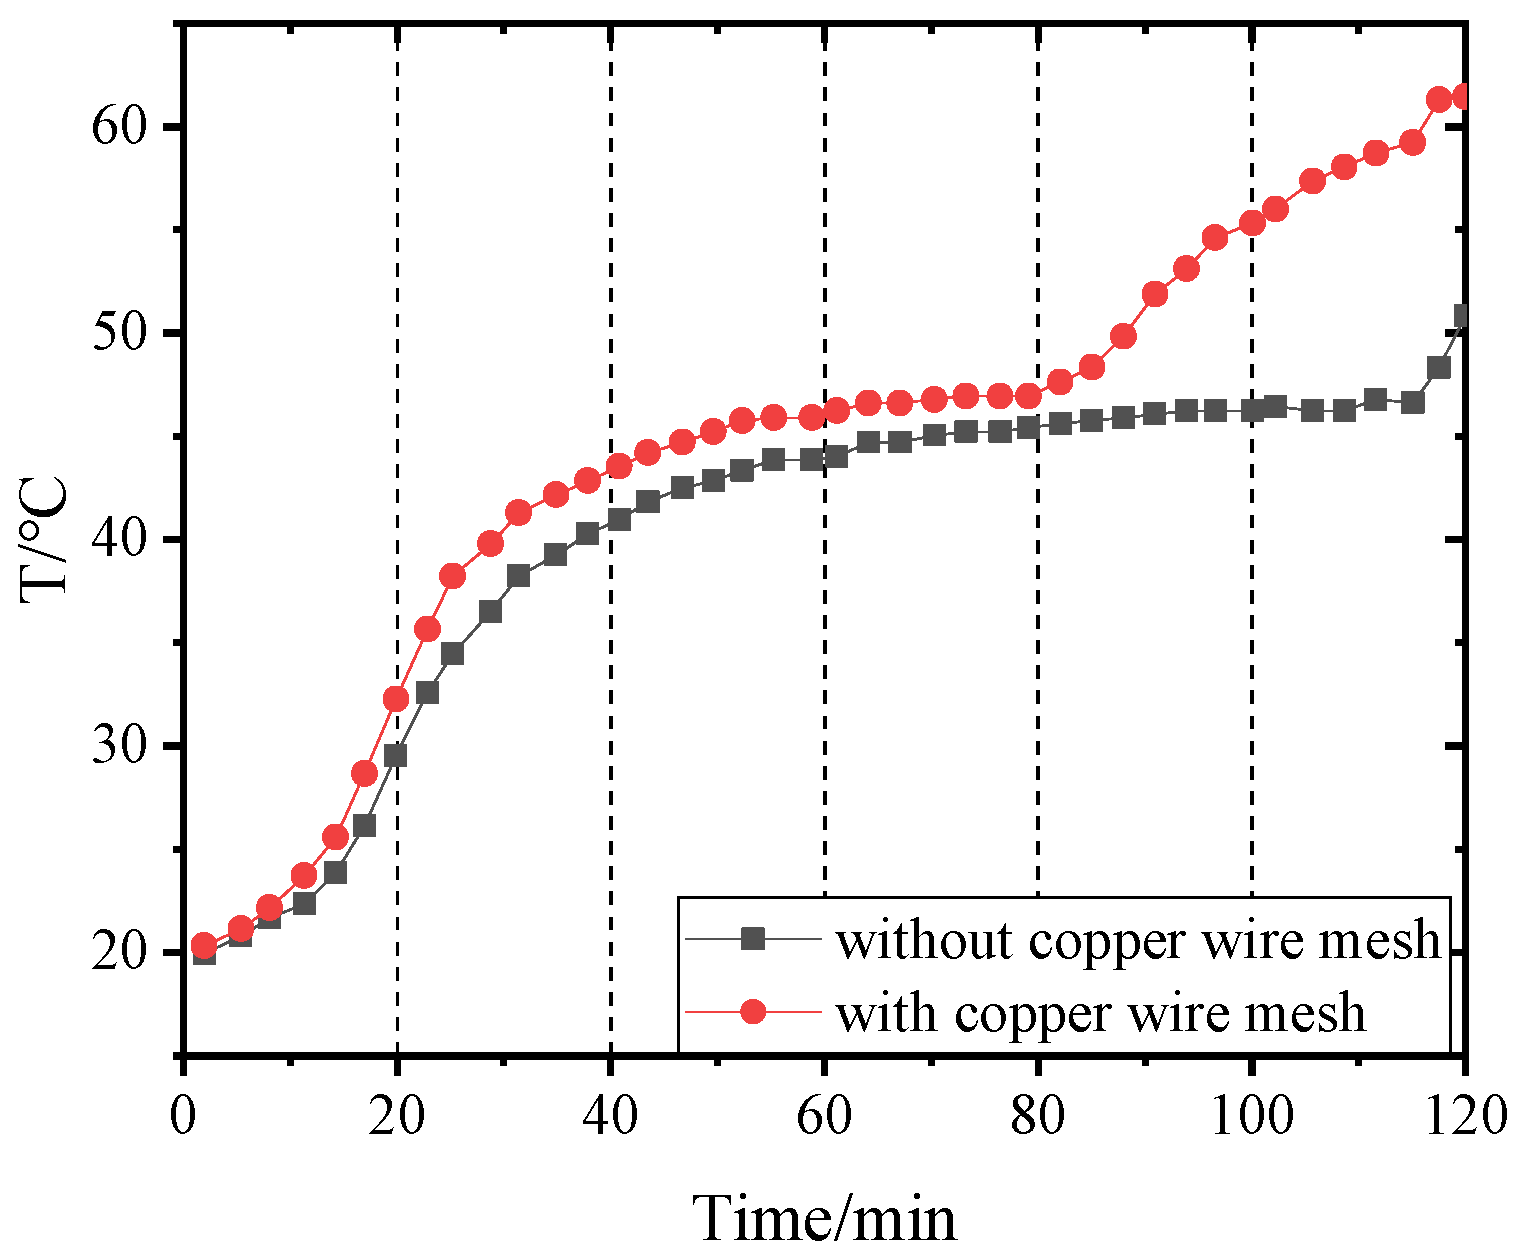
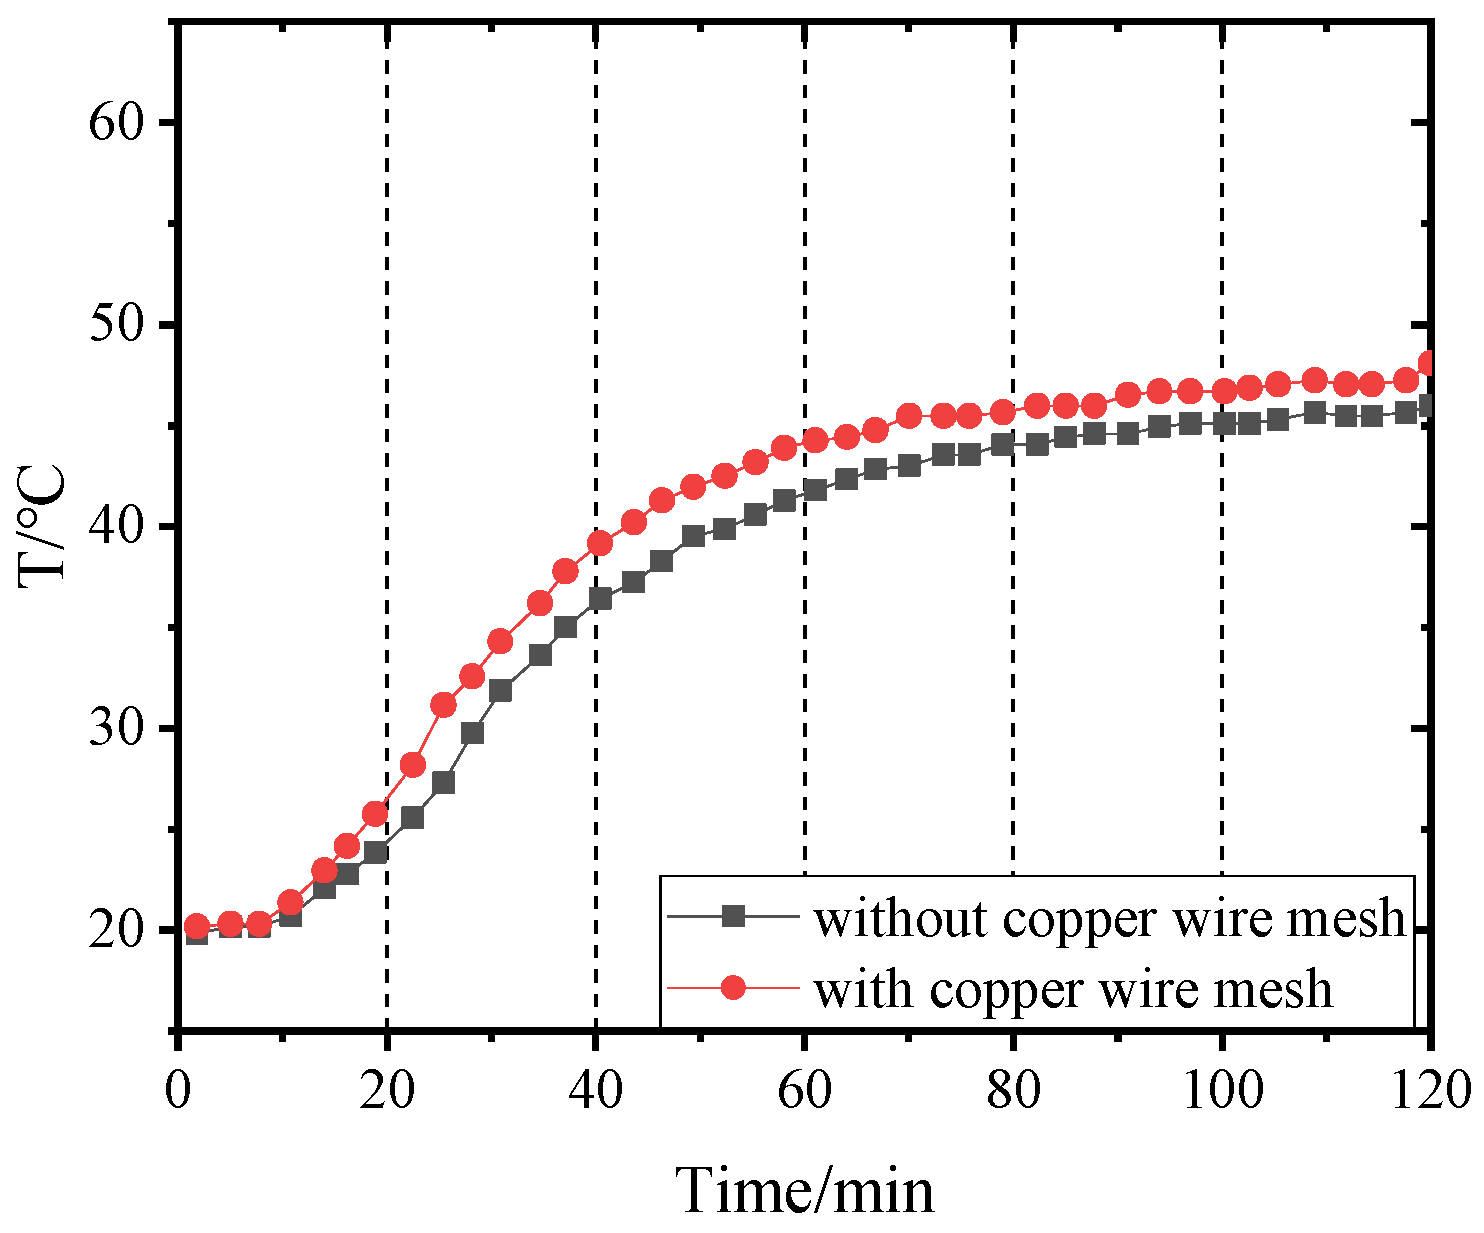
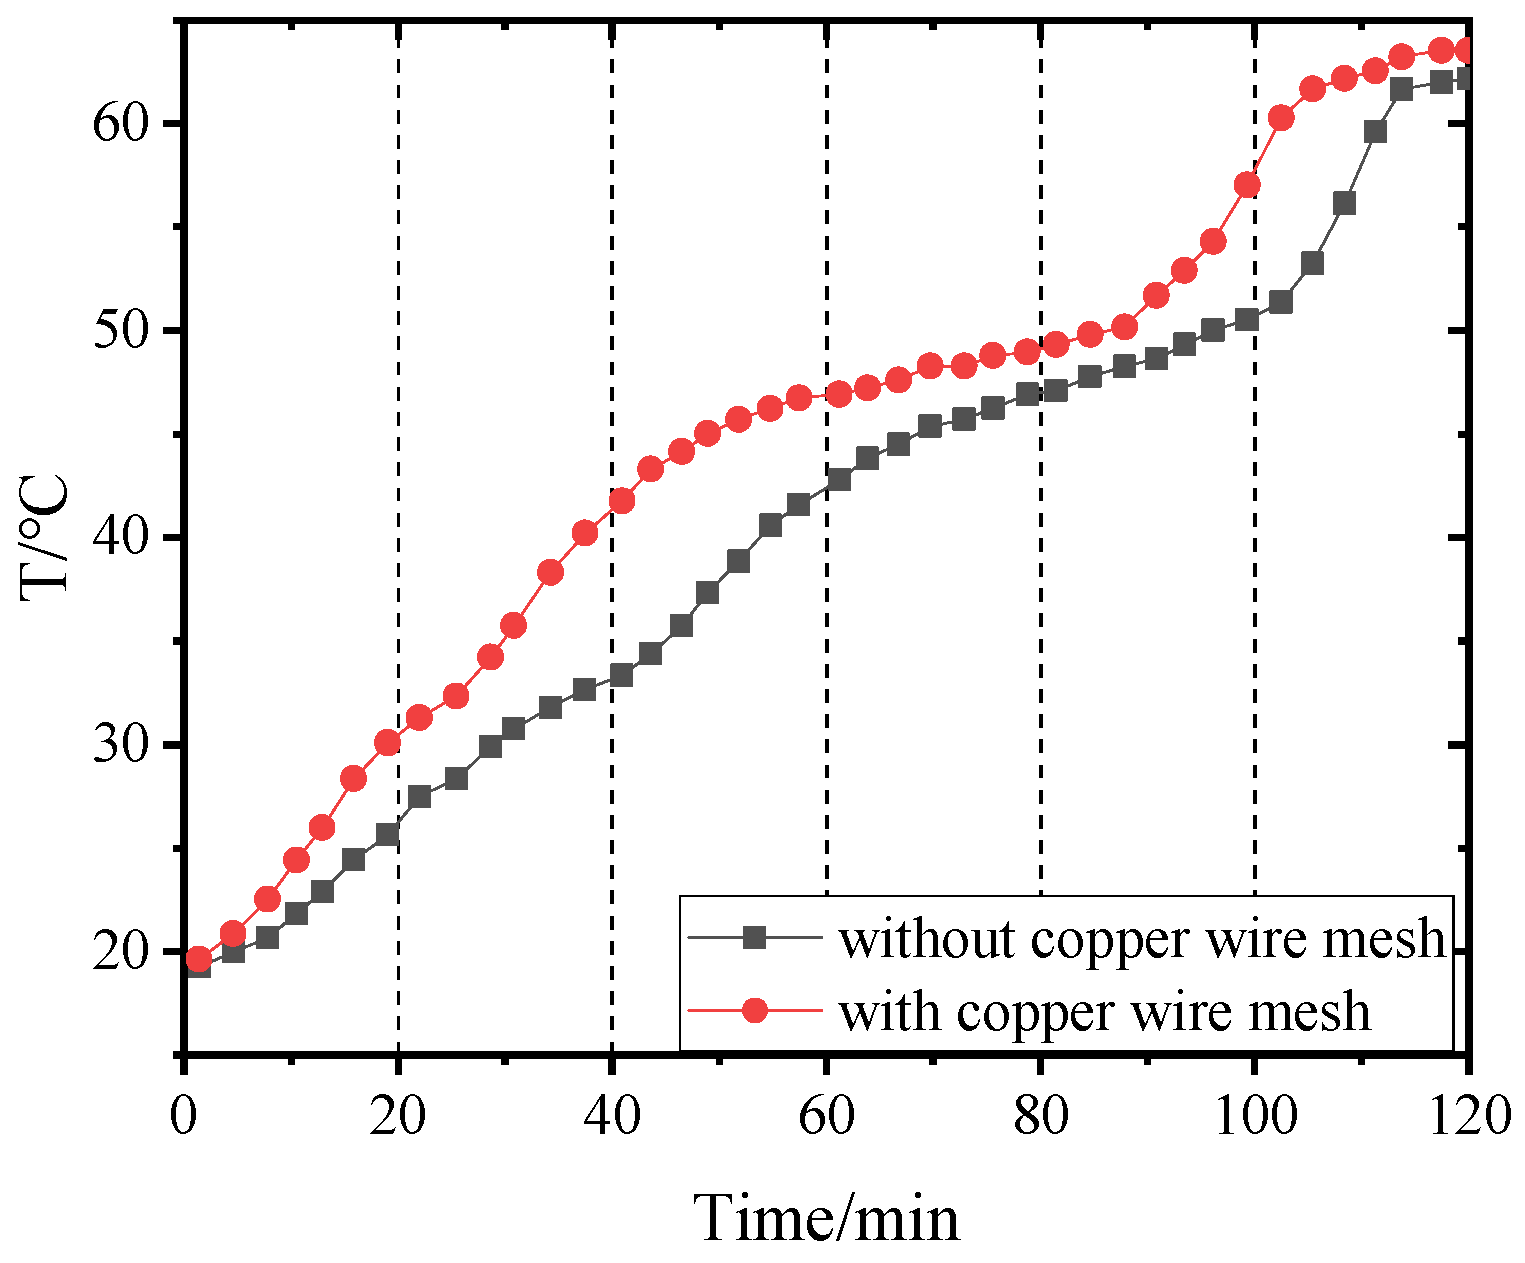
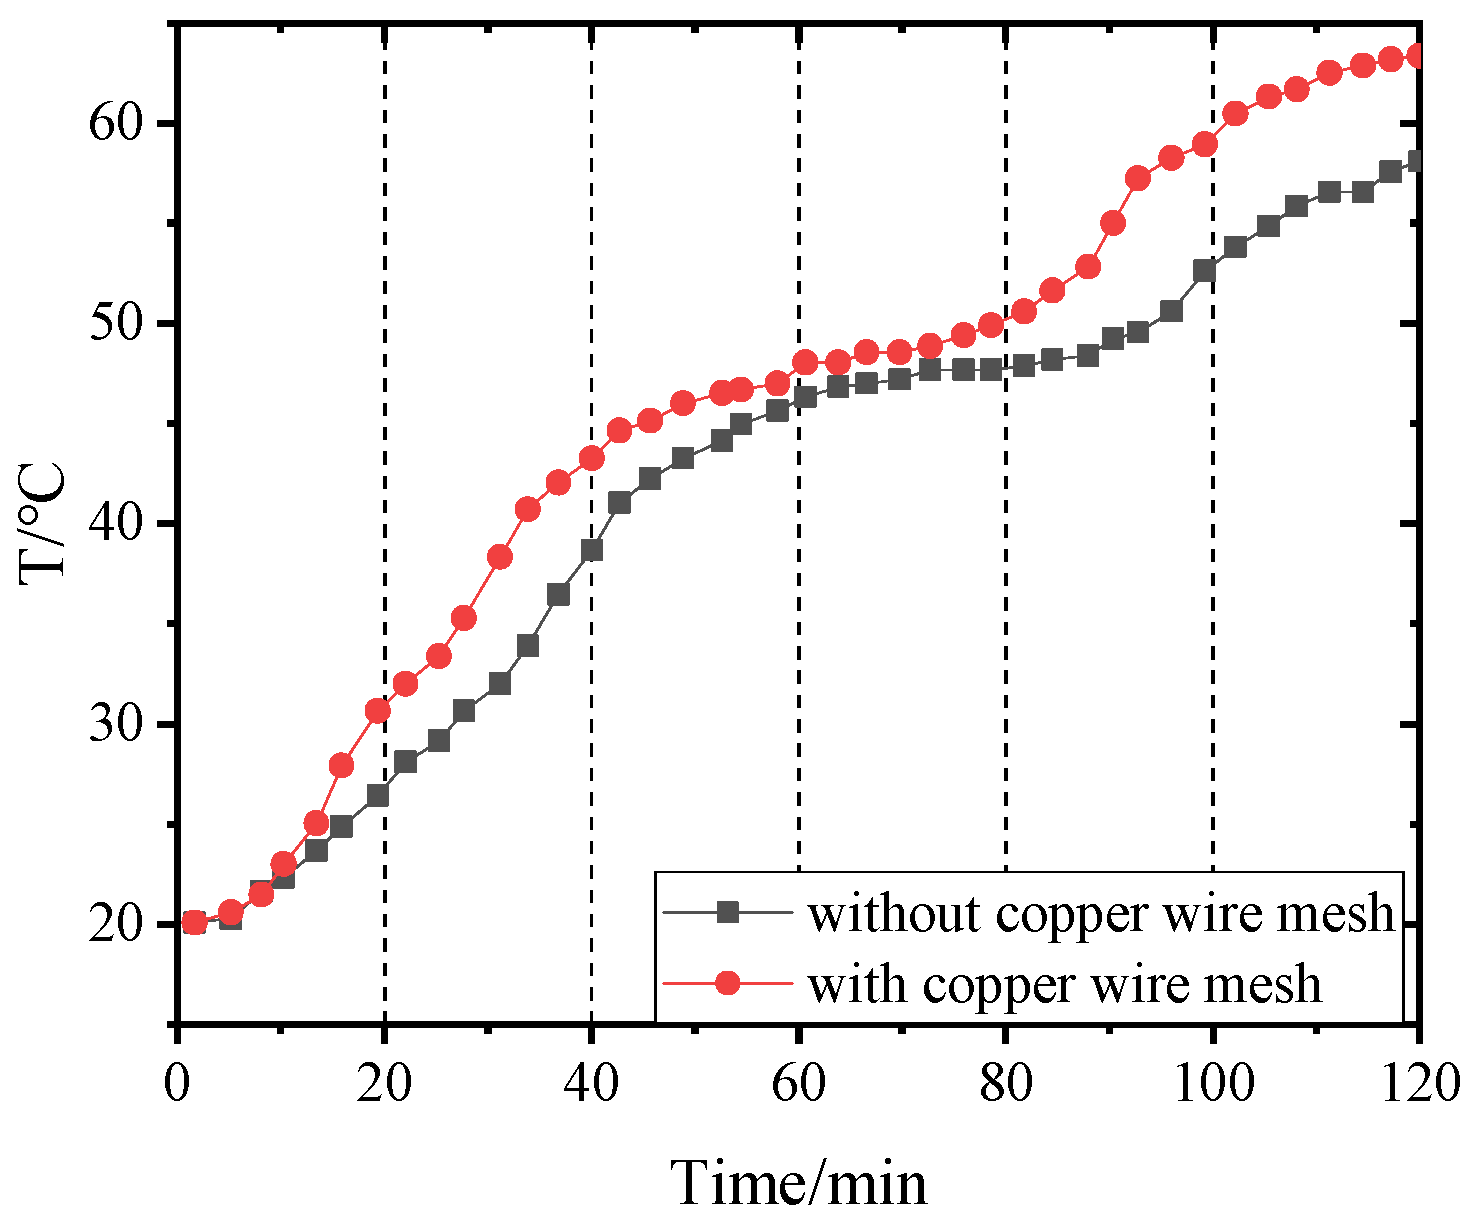
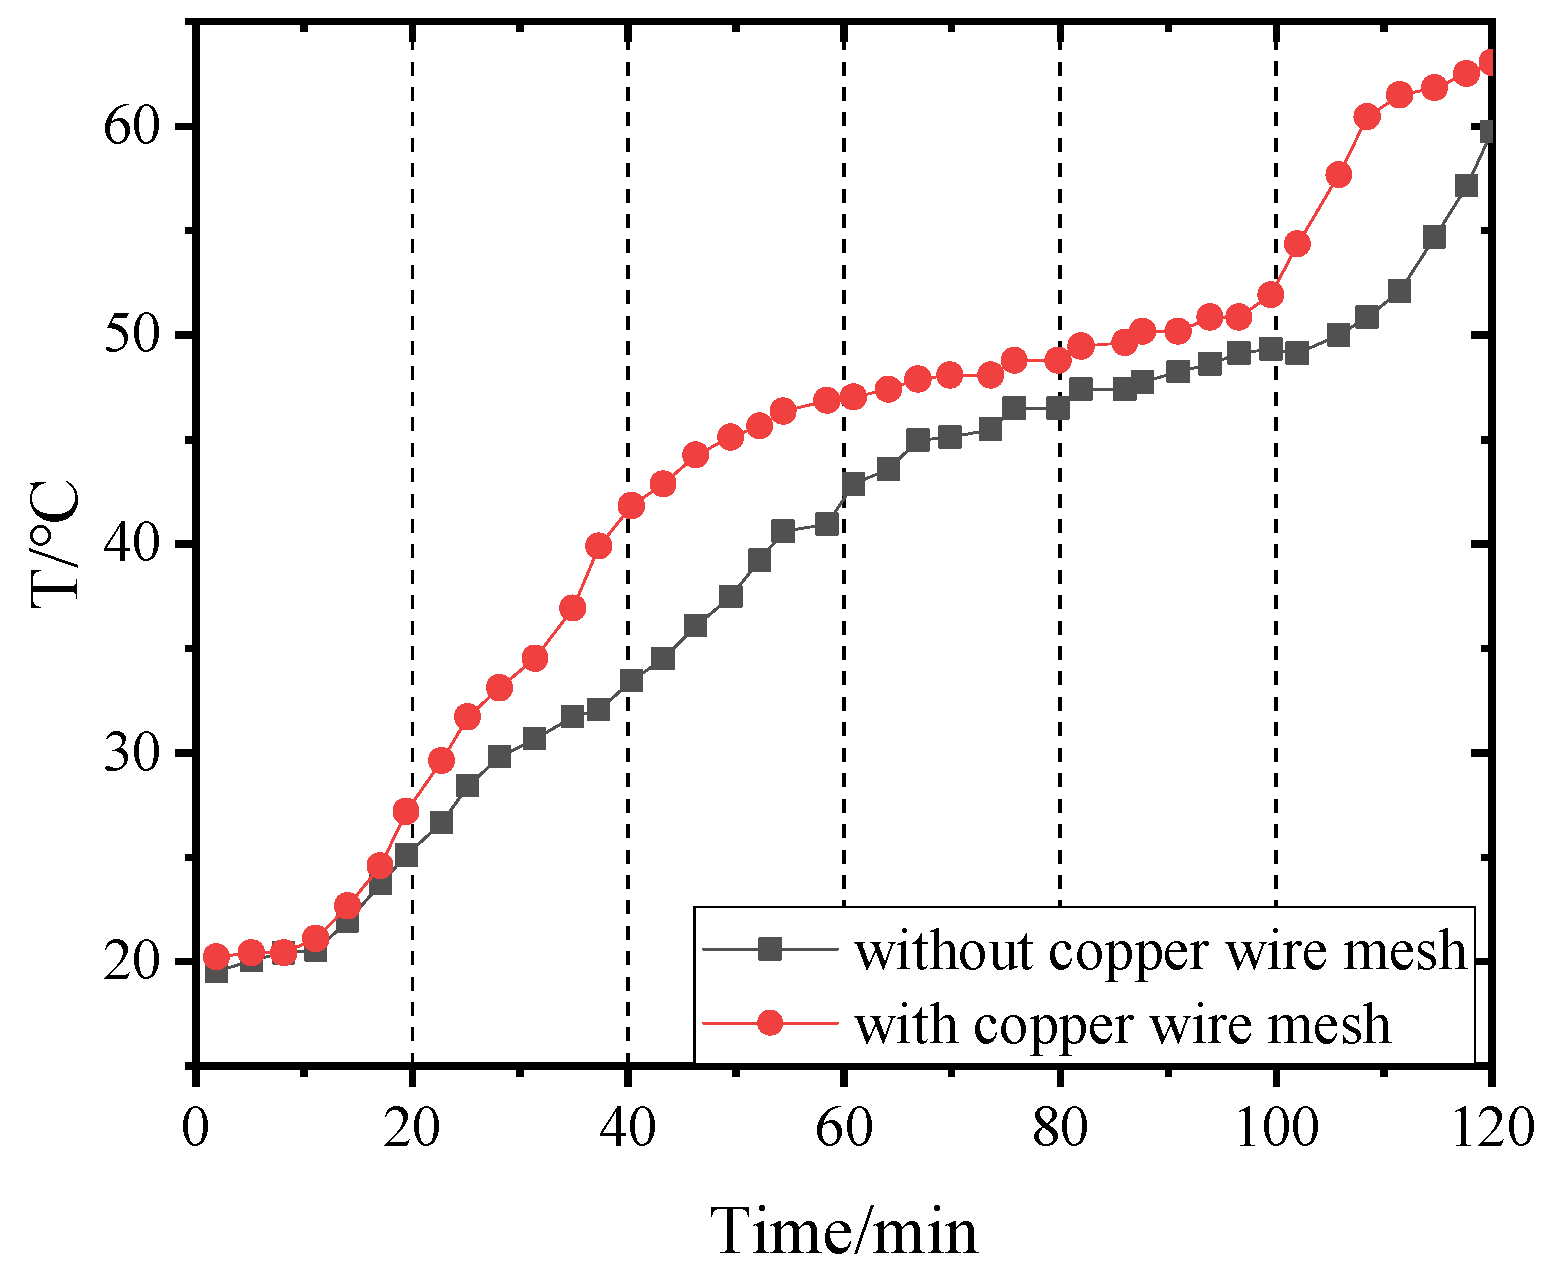
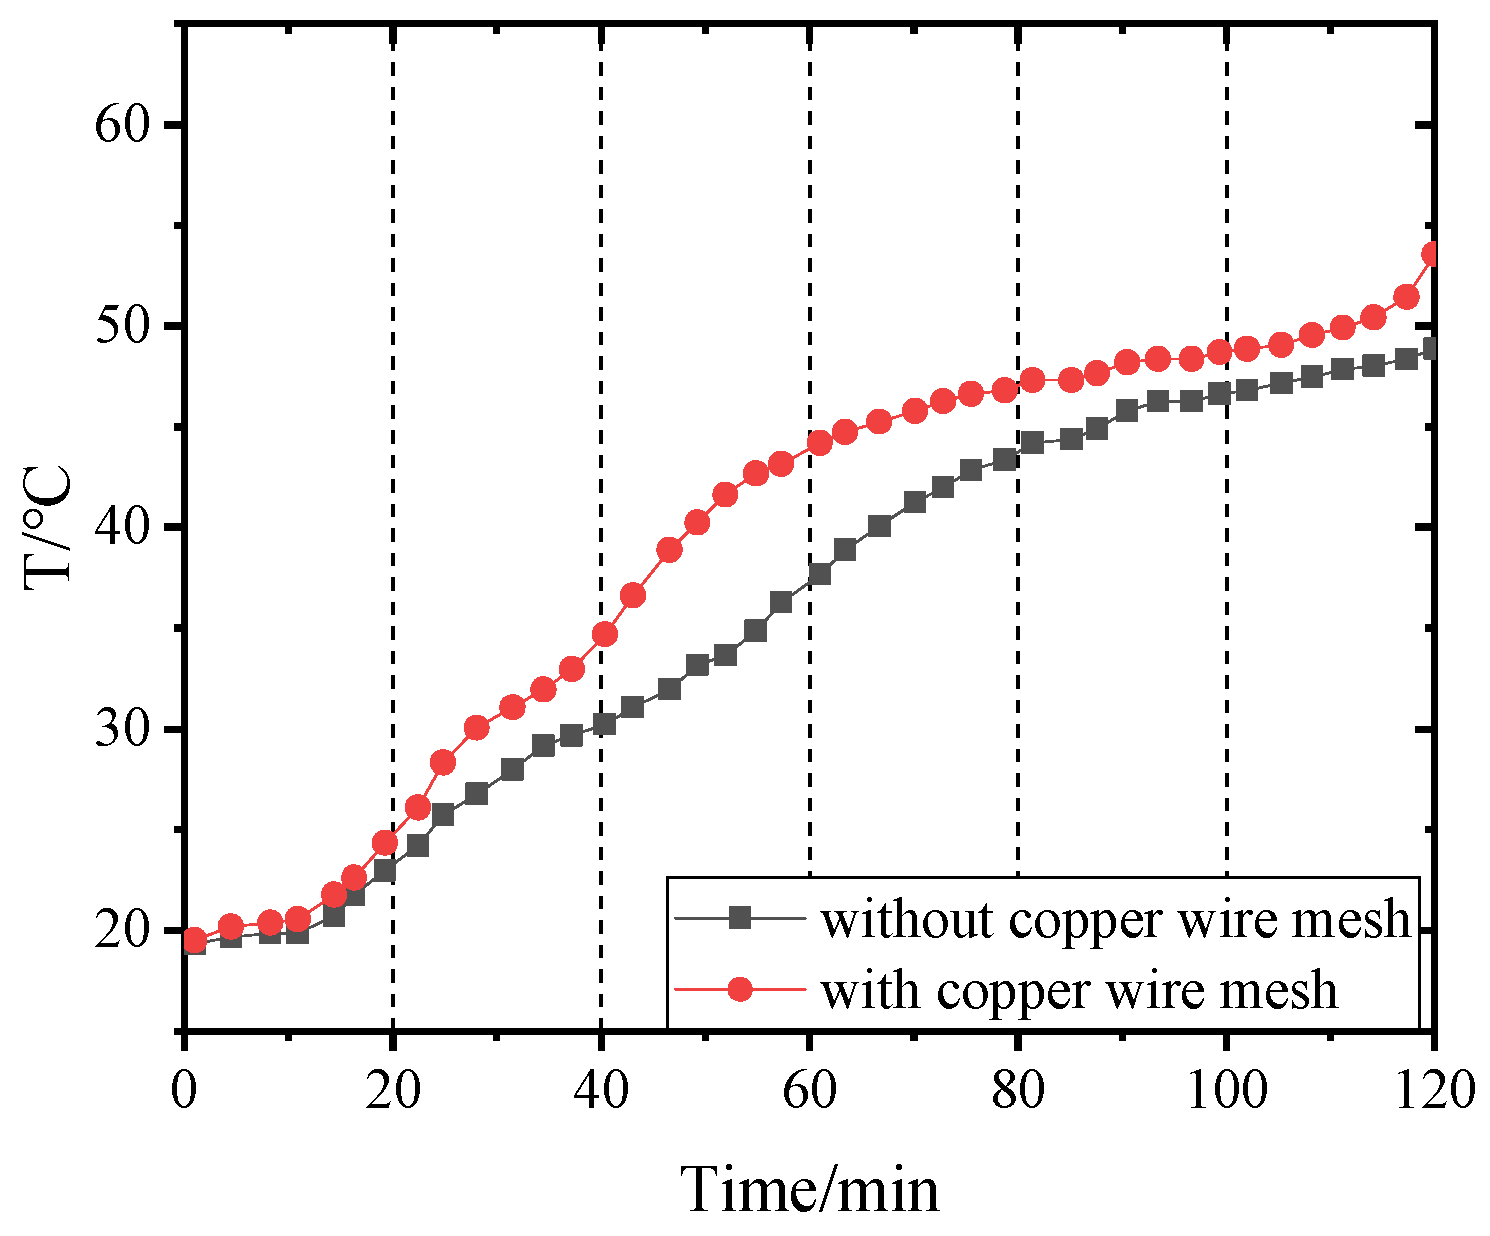
4.4. Effects of Adding Copper Wire Meshes on PCM Temperature Change

Figure 14, Figure 15, Figure 16 and Figure 17 and Figure 18, Figure 19, Figure 20 and Figure 21 separately show that the temperatures changed over time at internal monitoring points 1–4 of PCM-1 and PCM-2 when the hot and wet air temperature at the dehumidifier inlet was 70 °C. As can be seen from Figure 16, the fourth monitoring point did not reach the phase transition temperature before adding copper wire meshes, so it is no longer compared. After adding copper wire meshes to the other three monitoring points, the time required to reach the phase transition temperature was shortened by 24 min, 27 min, and 33 min respectively compared with that without copper wire meshes, i.e., the relative shortened time was 17.1%, 27.3%, and 28.9%. The maximum temperature difference of the three monitoring points before and after adding copper wire meshes was 6.8 °C, 12.9 °C, and 13.3 °C respectively.
When copper wire meshes were added to PCM-1, the temperatures of the four monitoring points increased significantly because the copper wire meshes transferred heat from the heat pipes to PCM-1 around meshes rapidly, which strengthened the heat transfer in PCM-1 and accelerated the temperature rise at the monitoring points. When the experiment lasted for about 60 min, the temperature at the monitoring point reached the phase transition temperature and remained unchanged at the phase transition stage. After the phase transition process, it entered the liquid superheat stage; at this time, the specific heat capacity of the liquid phase was far less than the latent heat of phase transformation, so the temperature of the monitoring point rose rapidly.
When PCM-2 was used for testing, the time required to reach phase transition temperature with copper wire meshes at the four monitoring points was 21 min, 18 min, 21 min, and 27 min respectively, which was 25.0%, 24.0%, 24.1%, and 24.3% shorter than that without copper wire meshes. Compared with before and after adding copper wire meshes, the maximum temperature differences of the four monitoring points during the experiment were 8.9 °C, 7.9 °C, 9.7 °C, and 7.9 °C respectively.
After adding copper wire meshes in PCM-2, the temperature change law of each monitoring point was like that of PCM-1. Different from PCM-1, PCM-2 experienced a short time near the phase transition temperature. This is because the thermal conductivity of PCM-2 was lower than that of PCM-1; therefore, it was more difficult for PCM-2 to transfer heat to the peripheral area of the monitoring point than PCM-1. In addition, the density of PCM-2 was lower; in the same volume, the mass of the filled PCM-2 was less than that of PCM-1, resulting in the maximum allowable heat storage of PCM-2 being smaller than that of PCM-1. Therefore, the temperatures near the monitoring points quickly reached and exceeded the phase transition temperature.

4.5. Effects of Adding Copper Wire Meshes on Water Production

Table 4 shows the effect of changing the diameter of copper wire meshes on the water output of the dehumidifier when adopting PCM-2 and setting the temperature of hot and wet air at the inlet of the dehumidifier to 65 °C. This table shows the water output of the dehumidifier within 40 min of operation. Here, the air temperature at the outlet of the dehumidifier was stable. Increasing the diameter of the copper wire mesh can improve the water output and accelerate the heat storage of the PCM in unit time. However, with the further increase of the diameter of the copper wire mesh, the percentage of water output improvement decreased. Therefore, the diameter of copper wire mesh should be selected in combination with an actual desalination unit to achieve the best effect.
In Table 5, ON and OY are respectively the water output of the phase change heat storage dehumidifier with and without adding copper wire meshes when different PCMs were used. For PCM-2, when the temperature of wet air at the inlet of the dehumidifier was 60~65 °C, the effect of adding copper wire mesh in the PCM on improving its water output was more significant than that of PCM-1.
If the heat stored in the phase change heat storage is supplied to a passive basin desalinator to produce fresh water for the second time, according to experience, the heat utilization rate of the basin desalinator is generally less than 30% [34]. Assuming that its actual heat utilization rate is 25%, then the total fresh water output will increase by 25%. According to the Formulas (10) and (11), it can be calculated that after the basin desalinator is adopted, the GOR and WPC of the dehumidifier will increase by 25% and decrease by 20% respectively. The increased total gained output ratio and reduced total water production cost are expressed by GORT and WPCT respectively.
Figure 22 shows the WPC and GOR with error bars when PCM-1 was used in the phase change heat storage dehumidifier, changing the inlet wet air temperature of the dehumidifier, with and without adding two layers of copper wire mesh with a mesh diameter of 0.4 mm in PCM-1, and using and not using the basin desalinator with a heat utilization rate of 25%. In conclusion, in order to improve the heat storage rate of the dehumidifier and strengthen the heat exchange between PCM and heat pipes, it is recommended to use sodium thiosulfate pentahydrate as a common low-temperature phase change material. The copper wire meshes with a diameter of 0.4 mm can be set in the dehumidifier, and the inlet wet air temperature is preferably 70 °C.

5. Conclusions

Taking the phase change heat storage dehumidifier in the process of HDH solar desalination as the research object, through numerical simulation and experiments, the heat transfer, entropy generation, and water production performances of sodium thiosulfate pentahydrate (PCM-1) and paraffin (PCM-2) coupled heat pipes and copper wire meshes were studied respectively. The following conclusions were obtained:
  • Using sodium thiosulfate pentahydrate (PCM-1) and paraffin (PCM-2) in the phase change heat storage dehumidifier, under the same conditions, the temperature distribution on the upper surface of PCM-1 was more uniform than that of PCM-2, and the thermal entropy generation of PCM-1 was greater than that of PCM-2. Adding copper wire meshes to PCMs can accelerate heat transfer and make the temperature field on the upper surface of PCMs more uniform, while the uniformity change of the upper surface temperature field of PCM-2 was more significant than that of PCM-1; this means that the heat transfer enhancement effect of adding copper wire mesh on PCM-2 was better than that of PCM-1.
  • After adding copper wire meshes to the PCMs, the temperatures of each monitoring point increased significantly. The times required for each monitoring point in PCM-1 and PCM-2 to reach the phase change temperature were 17.1–28.9% and 24.0–25.0% shorter than without copper wire mesh respectively. The residence times of each monitoring point near the phase transition temperature of PCM-2 were shorter than those in PCM-1.
  • The water output of the phase change heat storage dehumidifier was improved after adding copper wire meshes to PCM. When PCM-1 and PCM-2 were used, the water output increased by 4.6–17.1% and 4.0–25.0% respectively.
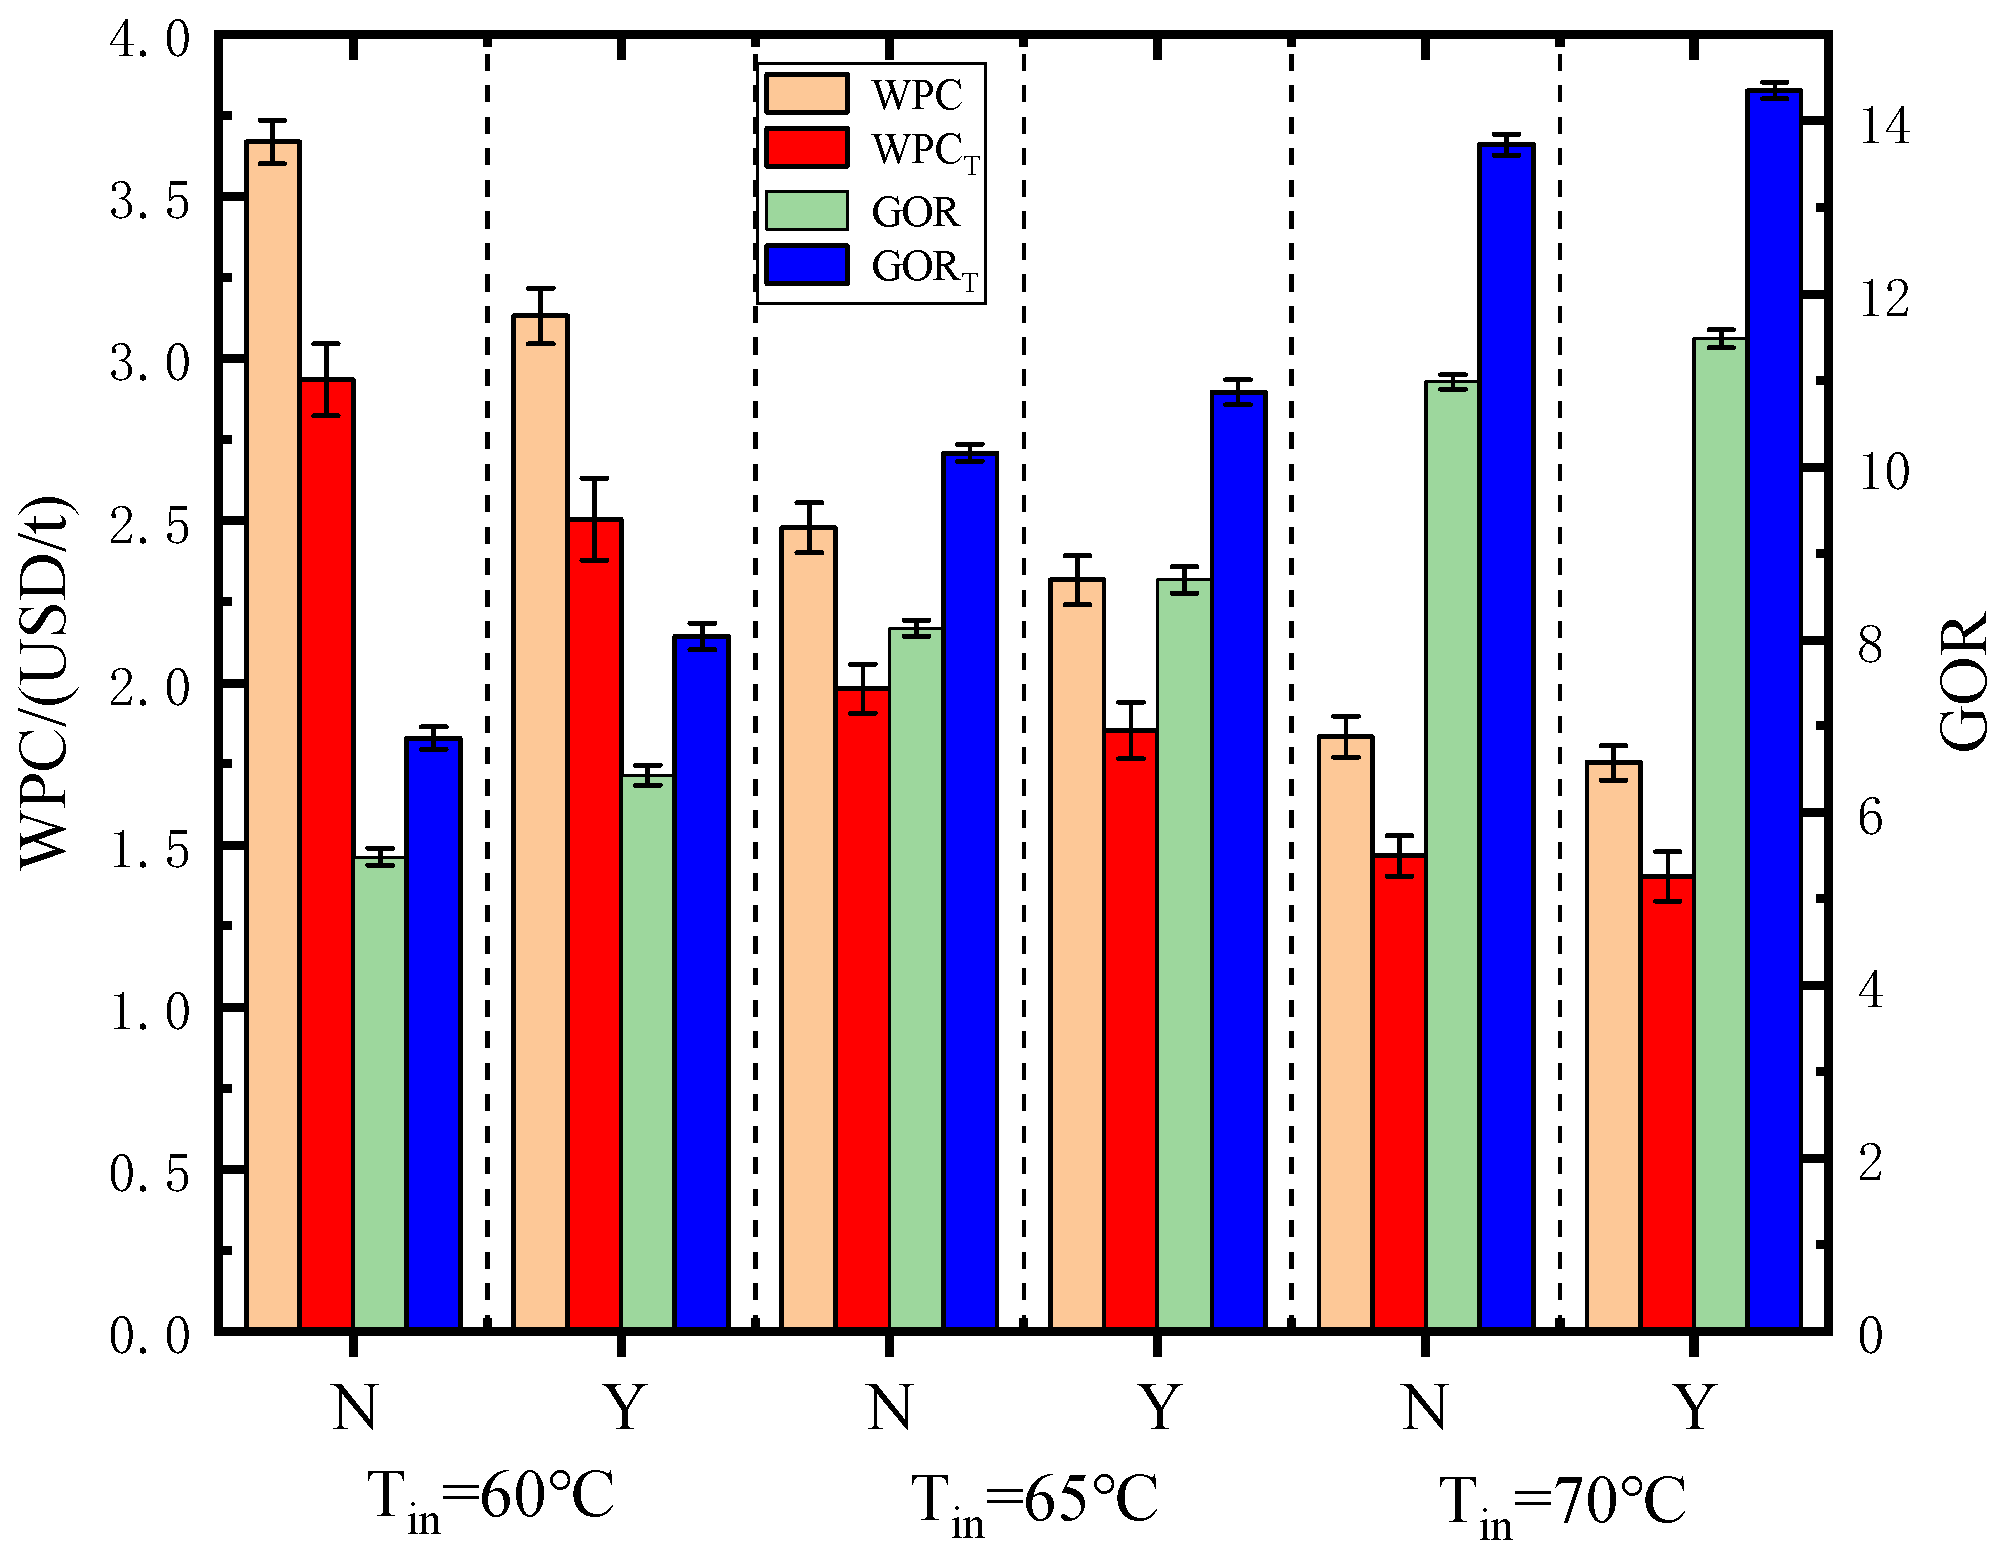
  • Increasing the wet air temperature at the inlet of the phase change heat storage dehumidifier, using copper wire meshes in the PCMs and using a passive basin desalinator for secondary water production can improve the water output and gained output ratio, and reduce the water production cost. When the wet air temperature at the inlet of the dehumidifier is 70 °C, using two layers of copper wire mesh with a diameter of 0.4 mm and a passive basin desalinator with a heat utilization rate of 25%, the minimum total WPC is 1.40 USD/t and the maximum total GOR is 14.35.

Author Contributions

Conceptualization, L.Z.; methodology, L.Z.; software, Z.X. and K.F.; validation, L.Z. and K.F.; formal analysis, L.Z., K.W. and Z.X.; investigation, Z.X., L.Z. and K.F.; data curation, K.F.; writing—original draft preparation, L.Z., Z.X. and K.F.; writing—review and editing, L.Z. and K.W.; visualization, K.F.; supervision, L.Z. All authors have read and agreed to the published version of the manuscript.

Funding

This research received no external funding.

Institutional Review Board Statement

Not applicable.

Informed Consent Statement

Not applicable.

Data Availability Statement

Not applicable.

Conflicts of Interest

The authors declare no conflict of interest.

Nomenclature

CAOWclosed air open waterQ2heat exchange capacity by the second heat pipe, J
Etotal power consumption, kWQ3heat exchange capacity by the third heat pipe, J
GORgained output ratioSgentropy generation rate per unit volume, J/(m3·K·s)
HDHhumidification-dehumidificationSg,hthermal entropy generation rate due to heat transfer, J/(K·s)
Hintotal enthalpy of air at inlet of dehumidifier, JSg,ffriction entropy generation rate due to fluid flow, J/(K·s)
Houttotal enthalpy of air at outlet of dehumidifier, JTtemperature, K
h1enthalpy of hot and wet air in state 1, kJ / kgTmtemperature measured by K-type thermocouple, K
h2enthalpy of hot and wet air in state 2, kJ / kgTminminimum temperature in test, K.
Mfresh water output, kg/htrunning time of dehumidifier, h
Minair mass flow at inlet of dehumidifier, kg/sUvelocity vector of phase change material, m/s
Moutair mass flow at outlet of dehumidifier, kg/svkinematic viscosity, m/s2
M0mass flow rate of hot and wet air, kg/sWPCwater production cost, USD/t
Nfpower consumption by fan, kW γ water evaporation latent heat, kJ/kg
Nppower consumption by pump, kWΔPaccuracy within the measuring range of pressure digital display gauge, Pa
Ppressure, PaΔTaccuracy within the measuring range of K-type thermocouple, K
PCMphase change materialεttemperature measurement error
PCM-1sodium thiosulfate pentahydrateλthermal conductivity, W/(m·K)
PCM-2paraffinμdynamic viscosity, kg/(m·s)
Pmmeasured value of pressure digital display gauge, Pa ρ density, kg/m3
Pminminimum pressure in test, Pa. Φ viscous dissipation function, J/(m2·kg)
Q1heat exchange capacity by the first heat pipe, J ϕ irreversibility distribution ratio

References

  1. Mirmanto; Sayoga, I.M.A.; Wijayanta, A.T.; Sasmito, A.P.; Aziz, M. Enhancement of Continuous-Feed Low-Cost Solar Distiller: Effects of Various Fin Designs. Energies 2021, 14, 4844. [Google Scholar] [CrossRef]
  2. Kaviti, A.K.; Naike, V.R.; Ram, A.S.; Kumari, A.A. Energy and exergy analysis of double slope solar still with aluminium truncated conic fins. Mater. Today Proc. 2021, 45, 5387–5394. [Google Scholar] [CrossRef]
  3. Sharon, H.; Reddy, K.S. A review of solar energy driven desalination technologies. Renew. Sust. Energy Rev. 2015, 41, 1080–1118. [Google Scholar] [CrossRef]
  4. Parekh, S.; Farid, M.M.; Selman, J.R.; Al-Hallaj, S. Solar desalination with a humidification-dehumidification techniquea comprehensive technical review. Desalination 2004, 160, 167–168. [Google Scholar] [CrossRef]
  5. Asbik, M.; Ansari, O.; Bah, A.; Zari, N.; Mimet, A.; El-Ghetany, H. Exergy analysis of solar desalination still combined with heat storage system using phase change material (PCM). Desalination 2016, 381, 26–37. [Google Scholar] [CrossRef]
  6. Mousa, H.; Gujarathi, A.M. Modeling and analysis the productivity of solar desalination units with phase change materials. Renew. Energy 2016, 95, 225–232. [Google Scholar] [CrossRef]
  7. Rufuss, D.D.W.; Kumar, V.R.; Suganthi, L.; Iniyan, S.; Davies, P.A. Techno-economic analysis of solar stills using integrated fuzzy analytical hierarchy process and data envelopment analysis. Sol. Energy 2018, 159, 820–833. [Google Scholar] [CrossRef] [Green Version]
  8. Kabeel, A.E.; Abdelgaied, M. The performance of a modified solar still using hot air injection and PCM. Desalination 2016, 379, 102–107. [Google Scholar] [CrossRef]
  9. Al-harahsheh, M.; Abu-Arabi, M.; Mousa, H.; Alzghoul, Z. Solar desalination using solar still enhanced by external solar collector and PCM. Appl. Therm. Eng. 2018, 128, 1030–1040. [Google Scholar] [CrossRef]
  10. Abu-Arabi, M.; Al-Harahsheh, M.; Mousa, H.; Alzghou, Z. Theoretical investigation of solar desalination with solar still having phase change material and connected to a solar collector. Desalination 2018, 448, 60–68. [Google Scholar] [CrossRef]
  11. Sarhaddi, F.; Tabrizi, F.F.; Zoori, H.A. Comparative study of two weir type cascade solar stills with and without PCM storage using energy and exergy analysis. Energy Convers. Manag. 2017, 133, 97–109. [Google Scholar] [CrossRef]
  12. Assari, M.R.; Basirat Tabrizi, H.; Shafiee, M.; Cheshmeh Khavar, Y. Experimental Performance of Desalination System Using Solar Concentrator, Nano-fluid, and Preheater Tube Accompanying Phase Change Material. Iran. J. Sci. Technol. Trans. Mech. Eng. 2021, 45, 1033–1044. [Google Scholar] [CrossRef]
  13. Manoj Kumar, P.; Sudarvizhi, D.; Prakash, K.B.; Anupradeepa, A.M.; Boomiha Raj, S.; Shanmathi, S.; Sumithra, K.; Surya, S. Investigating a single slope solar still with a nano-phase change material. Mater. Today Proc. 2021, 45, 7922–7925. [Google Scholar] [CrossRef]
  14. Suraparaju, S.K.; Natarajan, S.K. Productivity enhancement of single-slope solar still with novel bottom finned absorber basin inserted in phase change material (PCM): Techno-economic and enviro-economic analysis. Environ. Sci. Pollut. Res. 2021, 28, 45985. [Google Scholar] [CrossRef]
  15. Amarloo, A.; Shafii, M.B. Enhanced solar still condensation by using a radiative cooling system and phase change material. Desalination 2019, 467, 43–50. [Google Scholar] [CrossRef]
  16. Faegh, M.; Shafii, M.B. Experimental investigation of a solar still equipped with an external heat storage system using phase change materials and heat pipes. Desalination 2017, 409, 128–135. [Google Scholar] [CrossRef] [Green Version]
  17. Sahan, N.; Fois, M.; Paksoy, H. The effects of various carbon derivative additives on the thermal properties of paraffin as a phase change material. Int. J. Energy Res. 2016, 40, 198–206. [Google Scholar] [CrossRef]
  18. Zhang, X.G.; Wen, R.L.; Huang, Z.H. Enhancement of thermal conductivity by the introduction of carbon nanopipes as a filler in paraffin/expanded perlite form-stable phase-change materials. Energy Build. 2017, 149, 463–470. [Google Scholar] [CrossRef]
  19. Tian, Y.; Zhao, C.Y. A numerical investigation of heat transfer in phase change materials (PCMs) embedded in porous metals. Energy 2011, 36, 5539–5546. [Google Scholar] [CrossRef] [Green Version]
  20. Ling, Z.Y.; Chen, J.J.; Xu, T.; Fang, X.M.; Gao, X.N.; Zhang, Z.G. Thermal conductivity of an organic phase change material/expanded graphite composite across the phase change temperature range and a novel thermal conductivity model. Energy Convers. Manag. 2015, 102, 202–208. [Google Scholar] [CrossRef] [Green Version]
  21. Amin, M.; Putra, N.; Kosasih, E.A.; Prawiro, E.; Luanto, R.A.; Mahlia, T.M.I. Thermal properties of beeswax/graphene phase change material as energy storage for building applications. Appl. Therm. Eng. 2017, 112, 273–280. [Google Scholar] [CrossRef]
  22. Li, W.; Wang, Y.H.; Kong, C.C. Experimental study on melting/solidification and thermal conductivity enhancement of phase change material inside a sphere. Int. Commun. Heat Mass Transf. 2015, 68, 276–282. [Google Scholar] [CrossRef]
  23. Baby, R.; Balaji, C. Experimental investigations on thermal performance enhancement and effect of orientation on porous matrix filled PCM based heat sink. Int. Commun. Heat Mass Transf. 2013, 46, 27–30. [Google Scholar] [CrossRef]
  24. Ye, R.D.; Lin, W.Z.; Yuan, K.J.; Fang, X.M.; Zhang, Z.G. Experimental and numerical investigations on the thermal performance of building plane containing CaCl2·6H2O/expanded graphite composite phase change material. Appl. Energy 2017, 193, 325–335. [Google Scholar] [CrossRef]
  25. Fukai, J.; Kanou, M.; Kodama, Y.; Miyatake, O. Thermal conductivity enhancement of energy storage media using carbon fibers. Energy Convers. Manag. 2000, 41, 1543–1556. [Google Scholar] [CrossRef]
  26. Motahar, S.; Khodabandeh, R. Experimental study on the melting and solidification of a phase change material enhanced by heat pipe. Int. Commun. Heat Mass Transf. 2016, 73, 1–6. [Google Scholar] [CrossRef]
  27. Lohrasbi, S.; Miry, S.Z.; Gorji-Bandpy, M.; Ganji, D.D. Performance enhancement of finned heat pipe assisted latent heat thermal energy storage system in the presence of nano-enhanced H2O as phase change material. Int. J. Hydrogen Energy 2017, 42, 6526–6546. [Google Scholar] [CrossRef]
  28. Ji, C.Z.; Qin, Z.; Low, Z.H.; Dubey, S.; Choo, F.H.; Duan, F. Non-uniform heat transfer suppression to enhance PCM melting by angled fins. Appl. Therm. Eng. 2018, 129, 269–279. [Google Scholar] [CrossRef]
  29. Bhagat, K.; Prabhakar, M.; Saha, S.K. Estimation of thermal performance and design optimization of finned multitube latent heat thermal energy storage. J. Energy Storage 2018, 19, 135–144. [Google Scholar] [CrossRef]
  30. Aly, K.A.; El-Lathy, K.R.; Fouad, M.A. Enhancement of solidification rate of latent heat thermal energy storage using corrugated fins. J. Energy Storage 2019, 24, 100785. [Google Scholar] [CrossRef]
  31. Joshi, V.; Rathod, M.K. Constructal enhancement of thermal transport in latent heat storage systems assisted with fins. Int. J. Therm. Sci. 2019, 145, 105984. [Google Scholar] [CrossRef]
  32. Masoumpour-Samakoush, M.; Miansari, M.; Ajarostaghi, S.S.M.; Arıcı, M. Impact of innovative fin combination of triangular and rectangular fins on melting process of phase change material in a cavity. J. Energy Storage 2022, 45, 103545. [Google Scholar] [CrossRef]
  33. Zhang, L.X.; Cheng, G.P.; Gao, S.Y. Experimental Study on Air Bubbling Humidification. Desalin. Water Treat. 2011, 29, 258–263. [Google Scholar] [CrossRef]
  34. Zhang, H.F. Principle of Solar Thermal Utilization and Computer Simulation, 2nd ed.; Northwestern Polytechnical University Press: Xi’an, China, 2012; pp. 222–223. [Google Scholar]
  35. Bejan, A. A study of entropy generation in fundamental convective heat transfer. J. Heat Transf. 1979, 101, 718–725. [Google Scholar] [CrossRef]
  36. Bejan, A. Entropy Generation through Heat and Fluid Flow, 1st ed.; Wiley: New York, NY, USA, 1982; pp. 48–105. [Google Scholar]
  37. Natalini, G.; Sciubba, E. Minimization of the local rates of entropy production in the design of air-cooled gas turbine blades. J. Eng. Gas Turbines Power 1999, 121, 466–475. [Google Scholar] [CrossRef]
Figure 1. Process diagram of integration HDH solar desalination.
Energies 15 01504 g001
Figure 2. Schematic diagram of the phase change heat storage dehumidifier experimental system.
Energies 15 01504 g002
Figure 3. Schematic diagram of heat exchange for the phase change heat storage dehumidifier.
Energies 15 01504 g003
Figure 4. Copper wire mesh.
Energies 15 01504 g004
Figure 5. Locations of monitoring points in the PCM container.
Energies 15 01504 g005
Figure 6. Two-dimensional calculation model of PCM upper surface. (a) Geometric parameters of the model. (b) Meshing of the model.
Energies 15 01504 g006
Figure 7. Residual errors of the energy equation.
Energies 15 01504 g007
Figure 8. Simulated temperature and entropy generation rate fields of PCM-1 upper surface. (a) Temperature fields; (b) Entropy generation rate fields.
Energies 15 01504 g008
Figure 9. Simulated temperature and entropy generation rate fields of PCM-2 upper surface. (a) Temperature fields; (b) Entropy generation rate fields.
Energies 15 01504 g009
Figure 10. Experimental photos of temperature fields on PCM-1 upper surface.
Energies 15 01504 g010
Figure 11. Experimental photos of temperature fields on PCM-2 upper surface.
Energies 15 01504 g011
Figure 12. Variation of air temperature at the dehumidifier outlet with time when using PCM-1.
Energies 15 01504 g012
Figure 13. Variation of air temperature at the dehumidifier outlet with time when using PCM-2.
Energies 15 01504 g013
Figure 14. Temperature of point 1 in PCM-1 changing with time.
Energies 15 01504 g014
Figure 15. Temperature of point 2 in PCM-1 changing with time.
Energies 15 01504 g015
Figure 16. Temperature of point 3 in PCM-1 changing with time.
Energies 15 01504 g016
Figure 17. Temperature of point 4 in PCM-1 changing with time.
Energies 15 01504 g017
Figure 18. Temperature of point 1 in PCM-2 changing with time.
Energies 15 01504 g018
Figure 19. Temperature of point 2 in PCM-2 changing with time.
Energies 15 01504 g019
Figure 20. Temperature of point 3 in PCM-2 changing with time.
Energies 15 01504 g020
Figure 21. Temperature of point 4 in PCM-2 changing with time.
Energies 15 01504 g021
Figure 22. Water production cost and gained output ratio under different conditions with error bars. N—without copper meshes; Y—with copper meshes.
Energies 15 01504 g022
Table 1. Performance indexes of instruments and equipment.
Instruments/
Equipment
ModelMeasuring RangeAccuracyPowerFlow
FanCZR20 W5 m3/h
Electric heater AJF-15001500 W
ThermocoupleK−200–220 °C±0.1 °C
Flow meterMF57000–200 L/min±(2.0 + 0.5 FS)
ThermostatPY-SM(LCD)−40–120 °C±0.1 °C
Table 2. Physical parameters of PCM-1 and PCM-2.
PCMPhase State Phase   Transition   Temperature   T p t / K Density
kg/m3
Thermal Conductivity W/(m·K)Specific Heat
kJ/(kg·K)
Phase Change
Latent Heat
kJ/kg
PCM-1solid 32116660.7601.46210
liquid32116000.3802.39
PCM-2solid 3219120.2952.40189
liquid3237690.1181.89
Table 3. Coordinates of temperature monitoring points in the PCM container.
Monitoring Point NumberX (mm)Y (mm)Z (mm)
1292820
21122820
31952820
42782820
Table 4. Effect of the copper wire mesh diameter on water output.
Wire Mesh Diameter
/mm
Water Output without Copper Wire Meshes
/mL
Water Output with Copper Wire Meshes
/mL
Increase Percentage
/%
0.21291354.7
0.412914310.9
0.612914814.7
Table 5. Water output before and after adding copper wire meshes.
PCMTin/°CON/mLOY/mLIncrease Percentage/%
PCM-16017520517.1%
PCM-1652592776.9%
PCM-1703503664.6%
PCM-2609211525.0%
PCM-26512914310.9%
PCM-2702022104.0%
Publisher’s Note: MDPI stays neutral with regard to jurisdictional claims in published maps and institutional affiliations.

