Review

The Evolution of Knowledge and Trends within the Building Energy Efficiency Field of Knowledge

by
Talita Mariane Cristino
1,
Antonio Faria Neto
1,*,
Frédéric Wurtz
2 and
Benoit Delinchant
2
1
School of Engineering, São Paulo State University (UNESP), Guaratinguetá 12516-410, Brazil
2
University Grenoble Alpes, CNRS, Grenoble INP, G2Elab, F-38000 Grenoble, France
*
Author to whom correspondence should be addressed.
Energies 2022, 15(3), 691; https://doi.org/10.3390/en15030691
Submission received: 5 November 2021 / Revised: 10 December 2021 / Accepted: 1 January 2022 / Published: 18 January 2022
(This article belongs to the Topic Multi-Energy Systems)

Abstract

:
The building sector is responsible for 50% of worldwide energy consumption and 40% of CO2 emissions. Consequently, a lot of research on Building Energy Efficiency has been carried out over recent years, covering the most varied topics. While many of these themes are no longer of interest to the scientific community, others flourish. Thus, reading trends within a field of knowledge is wise since it allows resources to be directed towards the most promising topics. However, there is a paucity of research on trend analysis in this field. Therefore, this article aims to analyse the evolution of the Building Energy Efficiency field of knowledge, identifying the recurrent themes and pointing out their trends, supported by statistical methods. Such an analysis relied on more than 9000 authors’ keywords collected from 2000 articles from the Scopus database and classified into 30 topics/themes. A frequency distribution of these themes enabled us to distinguish those most published as well as those whose academic interest has cooled down. This field of knowledge has evolved over three distinct phases, throughout which, eight themes presented an upward trend. These findings can assist researchers in optimising time and resources, investigating the topics with growing interest, and possibilities for new contributions.

Graphical Abstract

1. Introduction

Energy consumption has increased over the last decades [1]. Such an increase brings several concerns, such as the necessity to develop alternative energy sources and reduce environmental impacts due to greenhouse gas emissions [2,3]. The building sector has overtaken the industrial sector and has played an important role in such a scenario, being responsible for more than 50% of the total energy consumption and 40% of the total CO2 emissions [4]. In Europe, according to the European Commission [5], only residential buildings are responsible for approximately 40% of energy consumption and 36% of CO2 emissions. Therefore, it was necessary to find a way to decrease such energy consumption without affecting economic development, as well as the comfort of the building’s occupants [6,7]. The way that researchers found to achieve such a goal was to increase the efficiency of processes and products [8,9]. This put the building sector on the target of important public policies.
Hence, a lot of research on Building Energy Efficiency (BEE) has been carried out. From 2000 to 2018, more than 14,000 papers were published dealing with several themes concerned with BEE. From this total, a little more than 100 papers reviewed specific themes: building energy modelling [10,11,12,13,14,15,16,17,18,19,20,21,22,23,24,25,26,27,28,29,30,31,32,33,34]; building envelope [21,22,23,24,25]; building energy performance [35,36,37,38,39,40,41,42]; sustainability [43,44,45,46,47,48,49,50,51,52,53]; building information modelling [54,55,56,57,58,59,60,61,62,63,64,65,66,67,68,69]; thermal comfort [70,71,72,73,74,75,76,77]; thermal storage [78,79]; zero energy buildings [49,80,81,82,83,84,85,86,87]; building integrated photovoltaics [88,89,90]; green buildings [91,92,93]; occupancy behaviour [94,95,96,97,98]; smart buildings [99,100,101]; lighting [102,103]; and regulations [104].
Unfortunately, only a few of these reviews dealt with trend analysis and yet, in a restricted way, only considered technical aspects within the respective themes, missing the big picture: building energy modelling [15]; building energy performance [38]; building information modelling [65,66,68]; building integrated photovoltaics [89]; and smart buildings [101].
Therefore, this article aims to fill this gap by answering important questions. Has the BEE field of knowledge reached maturity? What are the recurrent themes within this field of knowledge? What is the trend of each of them? How has the relationship between such themes changed over time?
Identifying the currently relevant topics, regardless of the field of knowledge, is wise because resources are becoming increasingly scarce, and this means they can be directed towards the most promising themes. This also allows researchers to be able to optimise resources, investigate the topics with growing interest, and increase the possibility for new contributions.
This article is organised as follows: Section 2 provides an extensive description of the methodological approach used to answer the research questions. Section 3 shows the results of the research. The article concludes with Section 4, discussing the main findings.

2. Materials and Methods

The deductive method was the methodological approach chosen to carry out this research. This was well-explained by Davidavičienė [105]. The deductive method starts with a set of theory-driven research questions, which guide the data collection and their analysis. Such questions were precisely posed in the previous section.
The analyses carried out in this research were based on the authors’ keywords of a significant sample of relevant articles addressing Building Energy Efficiency (BEE). Therefore, this section will describe the procedures used to collect and manipulate such keywords. Figure 1 illustrates the methodological flow of this research.

2.1. Research Problem Formulation

This is the stage in which the general orientation of the research was established. In this step, the research theme was formally defined and well delimited. Furthermore, the gaps in the field of knowledge under investigation were stated and the questions that had to be answered in order to fill such a gap were posed [106].
Energy Efficiency is a huge field of knowledge with several intertwined branches. Building Energy Efficiency (BEE) is one of these branches, which constitutes several themes.
Since the building sector is a great energy consumer, overlapping the industrial sector, much has been written about Building Energy Efficiency. However, no article has studied, in a methodological manner, the evolution of this field of knowledge, the themes within it, or how they relate to each other. Thus, in order to fill this gap, it was necessary to answer the research questions as posed in Section 1.

2.2. Document Retrieval

The main goal of this step relied on retrieving a significant sample of publications addressing relevant issues in the Building Energy Efficiency field of knowledge. In order to accomplish such a goal, it was necessary to define the database from which the documents would be gathered and, most importantly, design the proper query to get the job done.
The publications were retrieved from the SCOPUS database since it has a wide coverage of high-impact journals, and “it is the largest database of abstracts and citation literature peer review” [107]. Only journal articles from 2000 to 2018 were considered because, before then, only a few articles presented the authors’ keywords, which provided the background of the method employed.
The construction of a query is a process of association of several terms concerned with a core theme. Such terms could be the keywords of the first sample of articles related to the field of knowledge under analysis. A very simple query can be used to capture the articles in which keywords will be used, to formulate the ultimate query.
In this case, the term “Building Energy Efficiency” was used to formulate the very first query, retrieving 893 publications and resulting in more than 3000 keywords, illustrated as a word cloud in Figure 2.
Figure 2 is a graphical representation of the word frequency that greater prominence to the key terms that appeared more frequently in the 893 publications previously gathered. The larger the word in the visual, the more common the word was among the keywords. Thus, words like building, energy, efficiency were prevalent, whilst others like pattern, technical, measuring were incidental. Therefore, not all 3000 keywords fit with the current research. Thus, after examining these keywords, only 682 of them were considered suitable to the scope of this research and were used in the construction of the ultimate query, as shown in Figure 3.
Figure 3 illustrates just a fragment of the query used to collect the articles scrutinised by this research. As can be seen at the beginning of the fragment, were selected articles containing one or more of the key terms in its title and/or abstract. At the bottom of the Figure 3 the type of source selected (only articles) and the year of publication can be seen.
The search using this query returned more than 14,000 articles, indexed on the Scopus database. However, most of them have never been cited and, as the number of citations is recognised as a quality standard [106,108], only the documents cited five or more times were considered eligible for further analysis. Thus, the number of selected articles dropped to nearly 2000.

2.3. The Evolution of the Building Energy Efficiency Field of Knowledge

According to Price’s Law [109], every field of knowledge is a dynamic structure that evolves over time, with a few publications covering distinct themes within it, until maturity when it is consolidated and there are only a few left to explore. Thus, it is important to investigate which stage of development this field has reached.
Price [109] stated that the number of publications related to a field of knowledge can be used to characterise its evolution. Indeed, scientific publications meet the scientific community’s demand for new finds. Thus, it is fair to say that scientific productivity is directly associated with scientific community interest in themes within this field. Based on that, Price [109] established a law, which states that the several stages of evolution of a field of knowledge can be characterised by the growth of the number of publications over the years.
Based on that, the evolution of the Building Energy Efficiency field of knowledge was assessed by means of Price’s fundamental law.

2.4. Authors’ Keyword Collection, Classification, and Manipulation

This step shows the data structure used to store 9326 keywords, collected from the 2000 articles that sourced this research; the classification procedure of these keywords into themes; and the data manipulations necessary to feed the following step.
Initially, the keywords and the respective articles were stored in a matrix, as illustrated in Table 1.
Each row of Table 1 represents one of the 2000 articles ( a 1 , a i , a 2000 ) ). Each row stores the metadata for the articles (article title, authorship, publication date, and keywords). Special attention was given to the keywords, which number varies from article to article. For data processing purposes, each keyword is represented as k w i j meaning the jth keyword from the ith article.
The keywords from Table 1 were screened, looking for those relevant to Building Energy Efficiency, as well as for insights about their classification into groups. As a result, 7598 keywords were discarded and the remaining 1728 were grouped into 30 distinct themes, as illustrated in Table 2.
Table 2 classifies the keywords, stores in Table 1, into thirty categories, or themes (the number of categories was defined a priori). Each column of Table 2 is assigned to a theme, and each theme has a different number of keywords assigned to it.
The task of accounting for the number of times a given theme appears in the literature was made easy by combining Table 1 and Table 2, which resulted in Table 3.
Table 3 is very similar to Table 1, except for the fact that in Table 1 each article is associated which its own keywords, whilst in Table 3 each article is associated with one, or more, the themes previously defined. Thus, Table 3 can be read in two ways: by row or by column. When read by row, it is possible to see the themes addressed by each article. When read by column, it is possible to see which theme is present in which article. Thus, the presence of a theme in the literature in a given year can be assessed by counting the number of articles addressing such a theme that year. Therefore, in order to build a distribution of themes over a given period, it was enough to restrict Table 3 to articles published over such a period.

2.5. Evolution and Trend of the Themes

The participation of a theme within a given period can be assessed by the percentage of the articles published within this period that address such a theme, as shown in (1).
T h e m e i % = # a r t i c l e s   a d r e s s i n g   t h e m e i t o t a l   a r t i c l e s   p u b l i s h e d   i n   t h e   y e a r .
Thus, the higher T h e m e i % , the more important is the theme. Based on this, it was possible to study the evolution of the themes over time.
The evolution of a theme was defined as the participation of such a theme in the literature over the years covered by the analysis. Thus, if the participation of a theme increases over time, it can be said that the theme shows an upward trend. Conversely, if the participation decreases, the theme shows a downward trend. There are also occasions in which the trend is stable over the years.
In order to avoid subjectivity, the trend analysis was supported by a nonparametric statistical procedure, called the Mann-Kendall test for trend [110].
Table 4 shows a fragment of a table used to show the evolution and trend of the themes.
Table 4 presents the evolution of each theme over the period under analysis, both in figures and graphically, as well as their trends according to the Mann-Kendall test with 5% of significance. The rows represent each of the thirty themes and, the columns store the participation of each of them in the literature calculated according to Equation (1). A bar graph illustrates the calculations, whilst ↑ means an upward trend, ↓ means a downward trend and means no-trend.

2.6. Stages of the Evolution of this Field of Knowledge

Table 4 can also be read from the point of view of the columns, i.e., from the point of view of the years. By doing that, it was possible to establish the profile of the years based on the themes addressed by the articles published during these years. This opened up the possibility of comparing the years and identifying certain patterns that allowed them to be grouped into clusters, demarcating evolutionary stages of this field of knowledge.

2.7. Interrelationships between Themes

According to Sun and Latora [111], the development of a field of knowledge is marked by the flow of knowledge between several themes or subareas of this field. That is why it is important to study the relationship between the themes.
Yet according to Sun and Latora [111], the knowledge flows with more intensity between synergetic themes, and the most influential themes are those most interconnected, around which the field develops itself. The relationship between the themes can be represented by means of an abstract two-dimensional plot resulting from a multidimensional scaling [112].

3. Results

The following section presents the outcomes of the complete analysis carried out to answer the research questions.

3.1. The Evolution of the Building Energy Efficiency Field of Knowledge

According to Price’s Law [109], the scientific production concerned with a field of knowledge grows exponentially until it reaches a point of inflection and, afterwards, a threshold value around which it stabilises, meaning that this field has reached its maturity. The aspect of the curve that represents the evolution of publications goes from exponential to logistics, signalling that the scientific community’s interest in this field has cooled down.
According to Dabi et al. [113]: “The main hypothesis of Price’s law is that the development of science follows an exponential growth. The growth of a scientific domain goes through four phases”. The first phase is the precursors’ phase. According to Dabi et al. [113] “during this phase only a small number of researchers begin publishing”. The second phase is the proper exponential growth. “During this phase, the expansion of the field attracts many researchers as many aspects of the subject still have to be explored” [113]. In the third phase, the body of knowledge is consolidated and the growth of scientific production becomes linear [113]. The next phase, according to Dabi et al. [
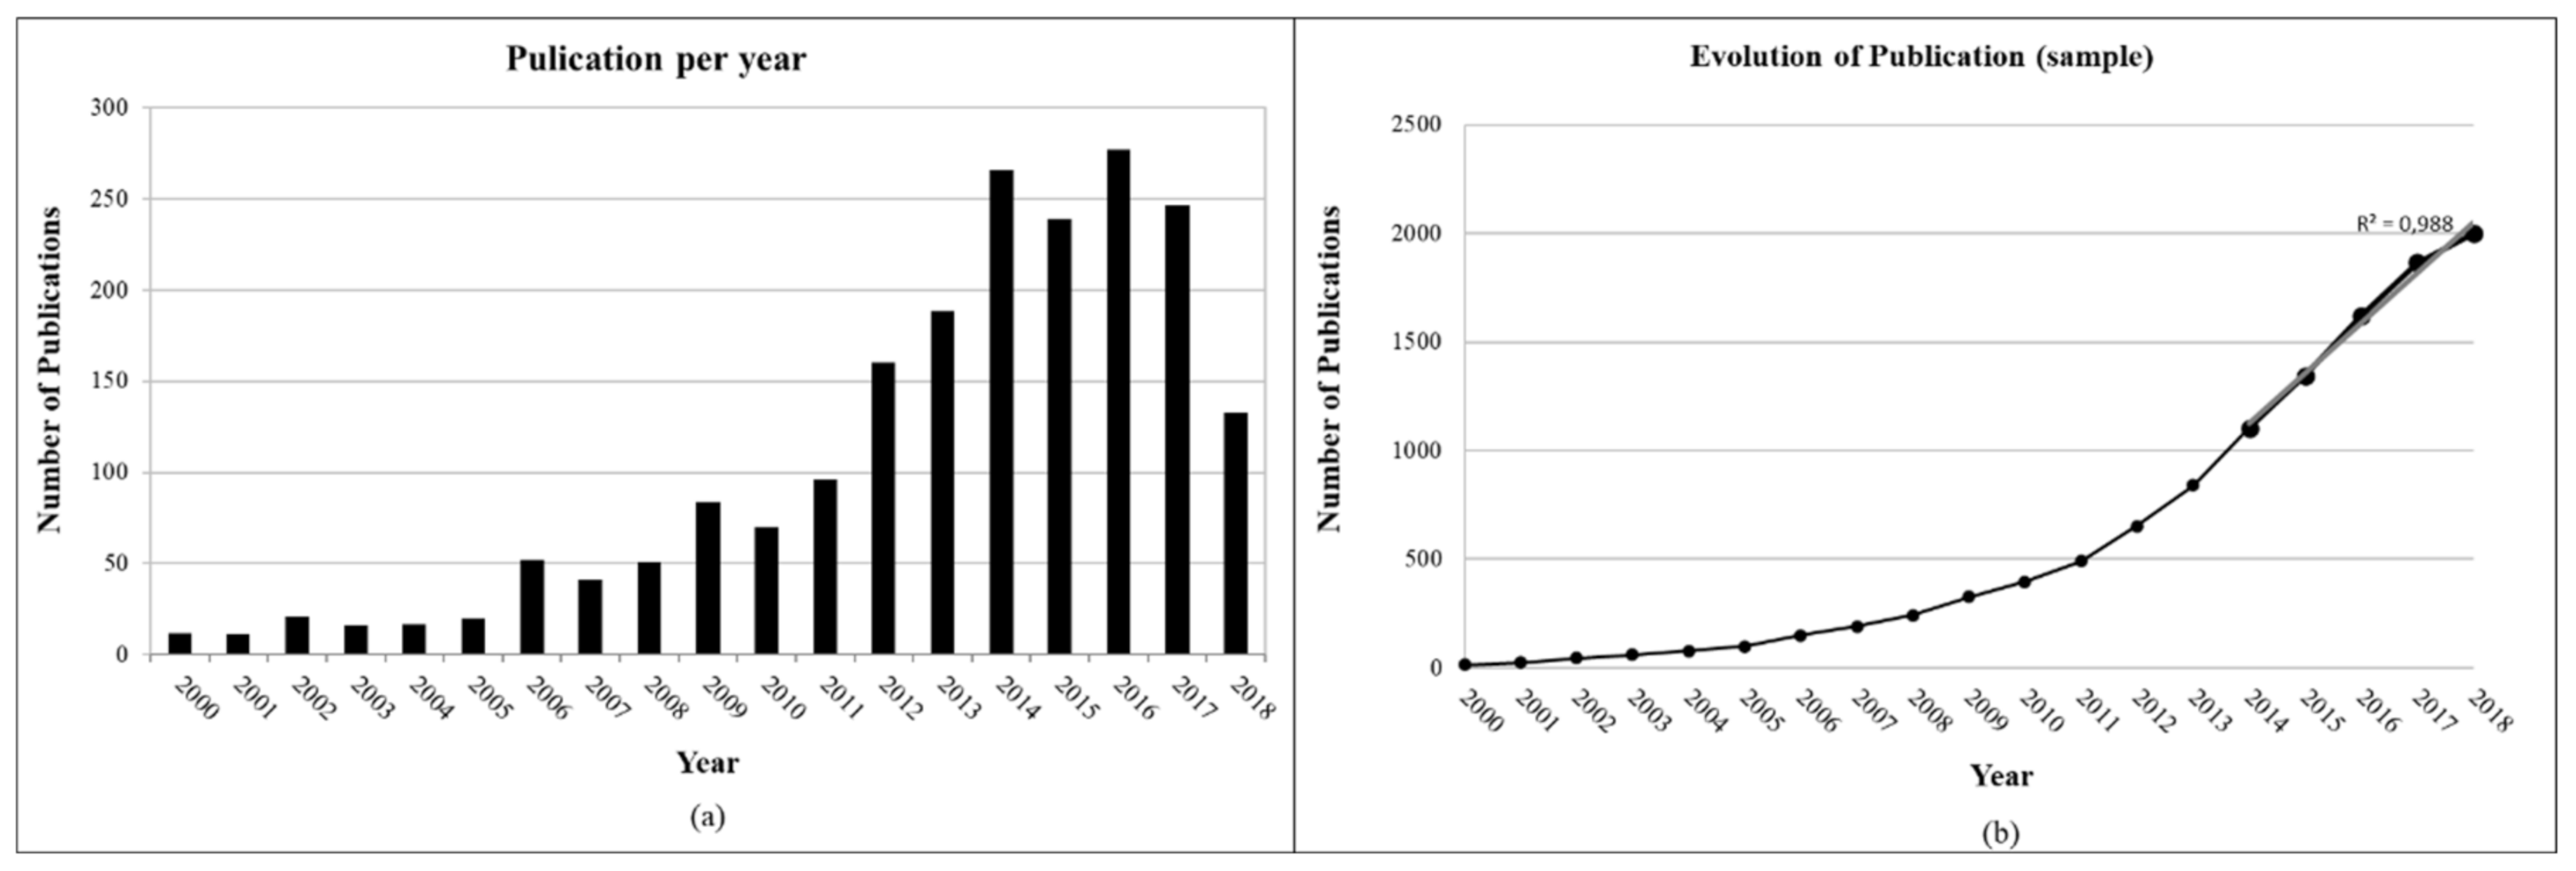
113], “corresponds to the collapse of the domain and is marked by a decrease in the number of the publications”. The aspect of the curve transforms from exponential to logistical, reaching a ceiling value after passing through an inflection point. Therefore, in order to perform the Price’s Law analysis, the frequency distribution of the publications addressing BEE is presented in Figure 4.
Figure 4a shows the number of publications on a yearly basis, whilst Figure 4b shows the cumulative version, on which compliance with Price’s Law is investigated.
The first phase roughly extends to 2005. The second phase is from 2005 to 2014. The number of publications fits well with an exponential function since the statistic R2 is very close to 1.00. The third phase extends from 2014 to 2018. The growth of scientific production becomes linear (R2 = 0.988). There is no statistical evidence that an inflection point has been reached yet. It is worth mentioning that only articles with 5 or more citations were considered and it is well known that the older the article, the more cited it is. Thus, it is likely that the number of articles during the later years will increase, reinforcing the linear trend of the plot for the final years even more. Therefore, the maturity of this field of knowledge has not yet been reached, leaving several aspects to be explored.

3.2. Authors’ Keyword Collection, Classification, and Manipulation

From the 9326 keywords collected, only 1728 were useful for the purposes of this study. They were, naturally, classified into 30 categories (or themes): building automation and control (BAC), building energy modelling (BEM), building envelope (BEV), building information modelling (BIM), building integrated photovoltaics (BIP), building management systems (BMS), building retrofitting (BRF), data analysis techniques (DAT), decision making (DMK), energy management systems (EMS), environmental (ENV), energy performance software (EPS), energy storage (EST), green building (GRB), heat pumping systems (HPS), heating-ventilation-air-conditioning (HVAC), life cycle assessment (LCA), lighting (LIG), occupancy behaviour (OCB), regulations (REG), renewable energy sources (RNE), smart buildings (SMB), smart grids (SMG), sustainability (SUS), thermal comfort (THC), thermal storage (THS), types of building (TOB), windows (WIN), water heating (WTH), and near zero/zero energy building (ZEB). Figure 5 shows a schematic representation of such a classification.
Figure 5 is a pictorial representation of the thirty categories along with the number of keywords classified into each of them.
In the majority of cases, the classification of a keyword into a given category was straightforward, like ‘green building’ (classified under the Green Building theme or group) for instance. However, there were cases in which a keyword could be coded into more than one theme. In such cases, the classification demanded some extra work. It was necessary to read the title and abstract and, in some cases, the introduction of the articles from which the keyword was collected, to decide which theme it fitted best.
A keyword was classified into a unique theme but a theme could cluster several keywords with similar meanings, in such a way that each theme represents a homogenous group. It is worth mentioning that an article can have keywords classified into different themes.

3.3. Associating the Articles with the Themes

Once the keywords were classified into themes, the next step was to associate the 2000 articles captured for this research, with the themes. Some articles addressed only one theme, while others addressed more than one. The presence of a theme in a given period was used as a measure of its relevance and it was estimated by counting the number of articles in which the theme appeared during a period.

3.4. Evolution and Trend of the Themes

Before studying the evolution and trend of the themes it is worth discussing their relevance over the period under investigation.
The relevance of a theme can be derived from the number of articles that address it over the period considered [111]. Thus, Table 5 presents the themes ranked according to their relevance.
Table 5 shows the absolute number and percentage of articles addressing each of the thirty themes. Therefore, it can be seen that the three largest themes are BEM, DAT, and BIM, which are present in more than 54% of the articles captured for this research. Eleven themes are addressed by less than 4% of the articles, meaning that the interest in them is small, so that they will be neglected for further analysis (grey background). However, it is worth mentioning that some of them are indirectly of interest for the ZEB and BRF themes. The themes BMS, BEV, EPS, EST, LIG, RNE, THS, and WIN could be still focused on the recent research under the umbrella of other themes with increasing.
Table 5 also shows the interdisciplinary character of the research carried out in the BEE field of knowledge. For instance, from the 2000 articles collected for this study, 505 (25.3%) address the theme BEM and the other 29 themes. According to Sun and Latora [111], such interaction can reflect the exchange of knowledge across themes. It is possible to infer that the strength of such an interaction depends on the number of publications sharing the themes.
Table 5 provides a static view of the BEE field of knowledge. It shows the most relevant themes within the field but it does not show the evolution and trend of each theme. Thus, Table 6 presents the trend of each theme, allowing investigation as to whether a given theme has a perennial presence or is just incidental in the literature. A theme can be analysed as to when it emerged, if it is still active or vanished, and when its apogee was.
Table 6 presents the annual participation of each theme in the literature, summarising their trend in the last column.
Eight themes are in an upward trend: BAC, EMS, DAT, BEM, BIM, OCB, BRF and ZEB. It can be seen that the themes BAC, EMS and DAT reached a maximum in the early 2000s, while the others peaked in the late 2010s. The development of the internet and image processing software packages explain the remarkable growth of the theme BIM [112,114]. Once the stock of old buildings far surpasses the stock of new buildings everywhere in the world, the only way to achieve the current energy-saving standards is by retrofitting them, which explains the growing interest of the scientific community in the BRF theme. The raising of the theme OCB can be explained because the scientific community has realised that the success of energy-efficient projects are significantly influenced by human factors [115,116].
Since there are many consecrated statistical methods, which have been waiting for the development of informatics to become popular, it is expected that DAT will keep growing for a while, even within other fields of knowledge. According to Cristino et al. [108] the data analysis techniques mentioned by the papers within this field of knowledge can be roughly clustered into the following categories: regression analysis, descriptive statistics, multivariate analysis, computational intelligence, inferential statistics, and design of experiments.
There is no statistical evidence of a particular trend for SMB, TOB, GRB, HVAC, LCA, THC, BIP, REG, ENV and SMG.
The theme SUS shows a downward trend. The themes concerned with environmental issues (ENV, SUS and LCA) reached their maximum in the second half of the 2000s and have decreased since then, showing that interest in these subjects cooled down.
The volume of publications addressing each theme, as well as the interaction between them, defines the evolution of a field of knowledge. As these variables change over time, it is possible to infer that such an evolution is marked by distinct phases. Thus, the next step in this study is to identify such stages.

3.5. Stages of the Evolution of this Field of Knowledge

The evolution of a field of knowledge is marked by a sequence of periods with a similar profile of publications. Thus, reading Table 6 from the columns’ point of view, it is possible to see the profile of the years according to the themes published and look for a pattern.
One of the ways to identify similarities between multivariate observations is to apply clustering techniques [112,117]. Thus, the space of the columns in 
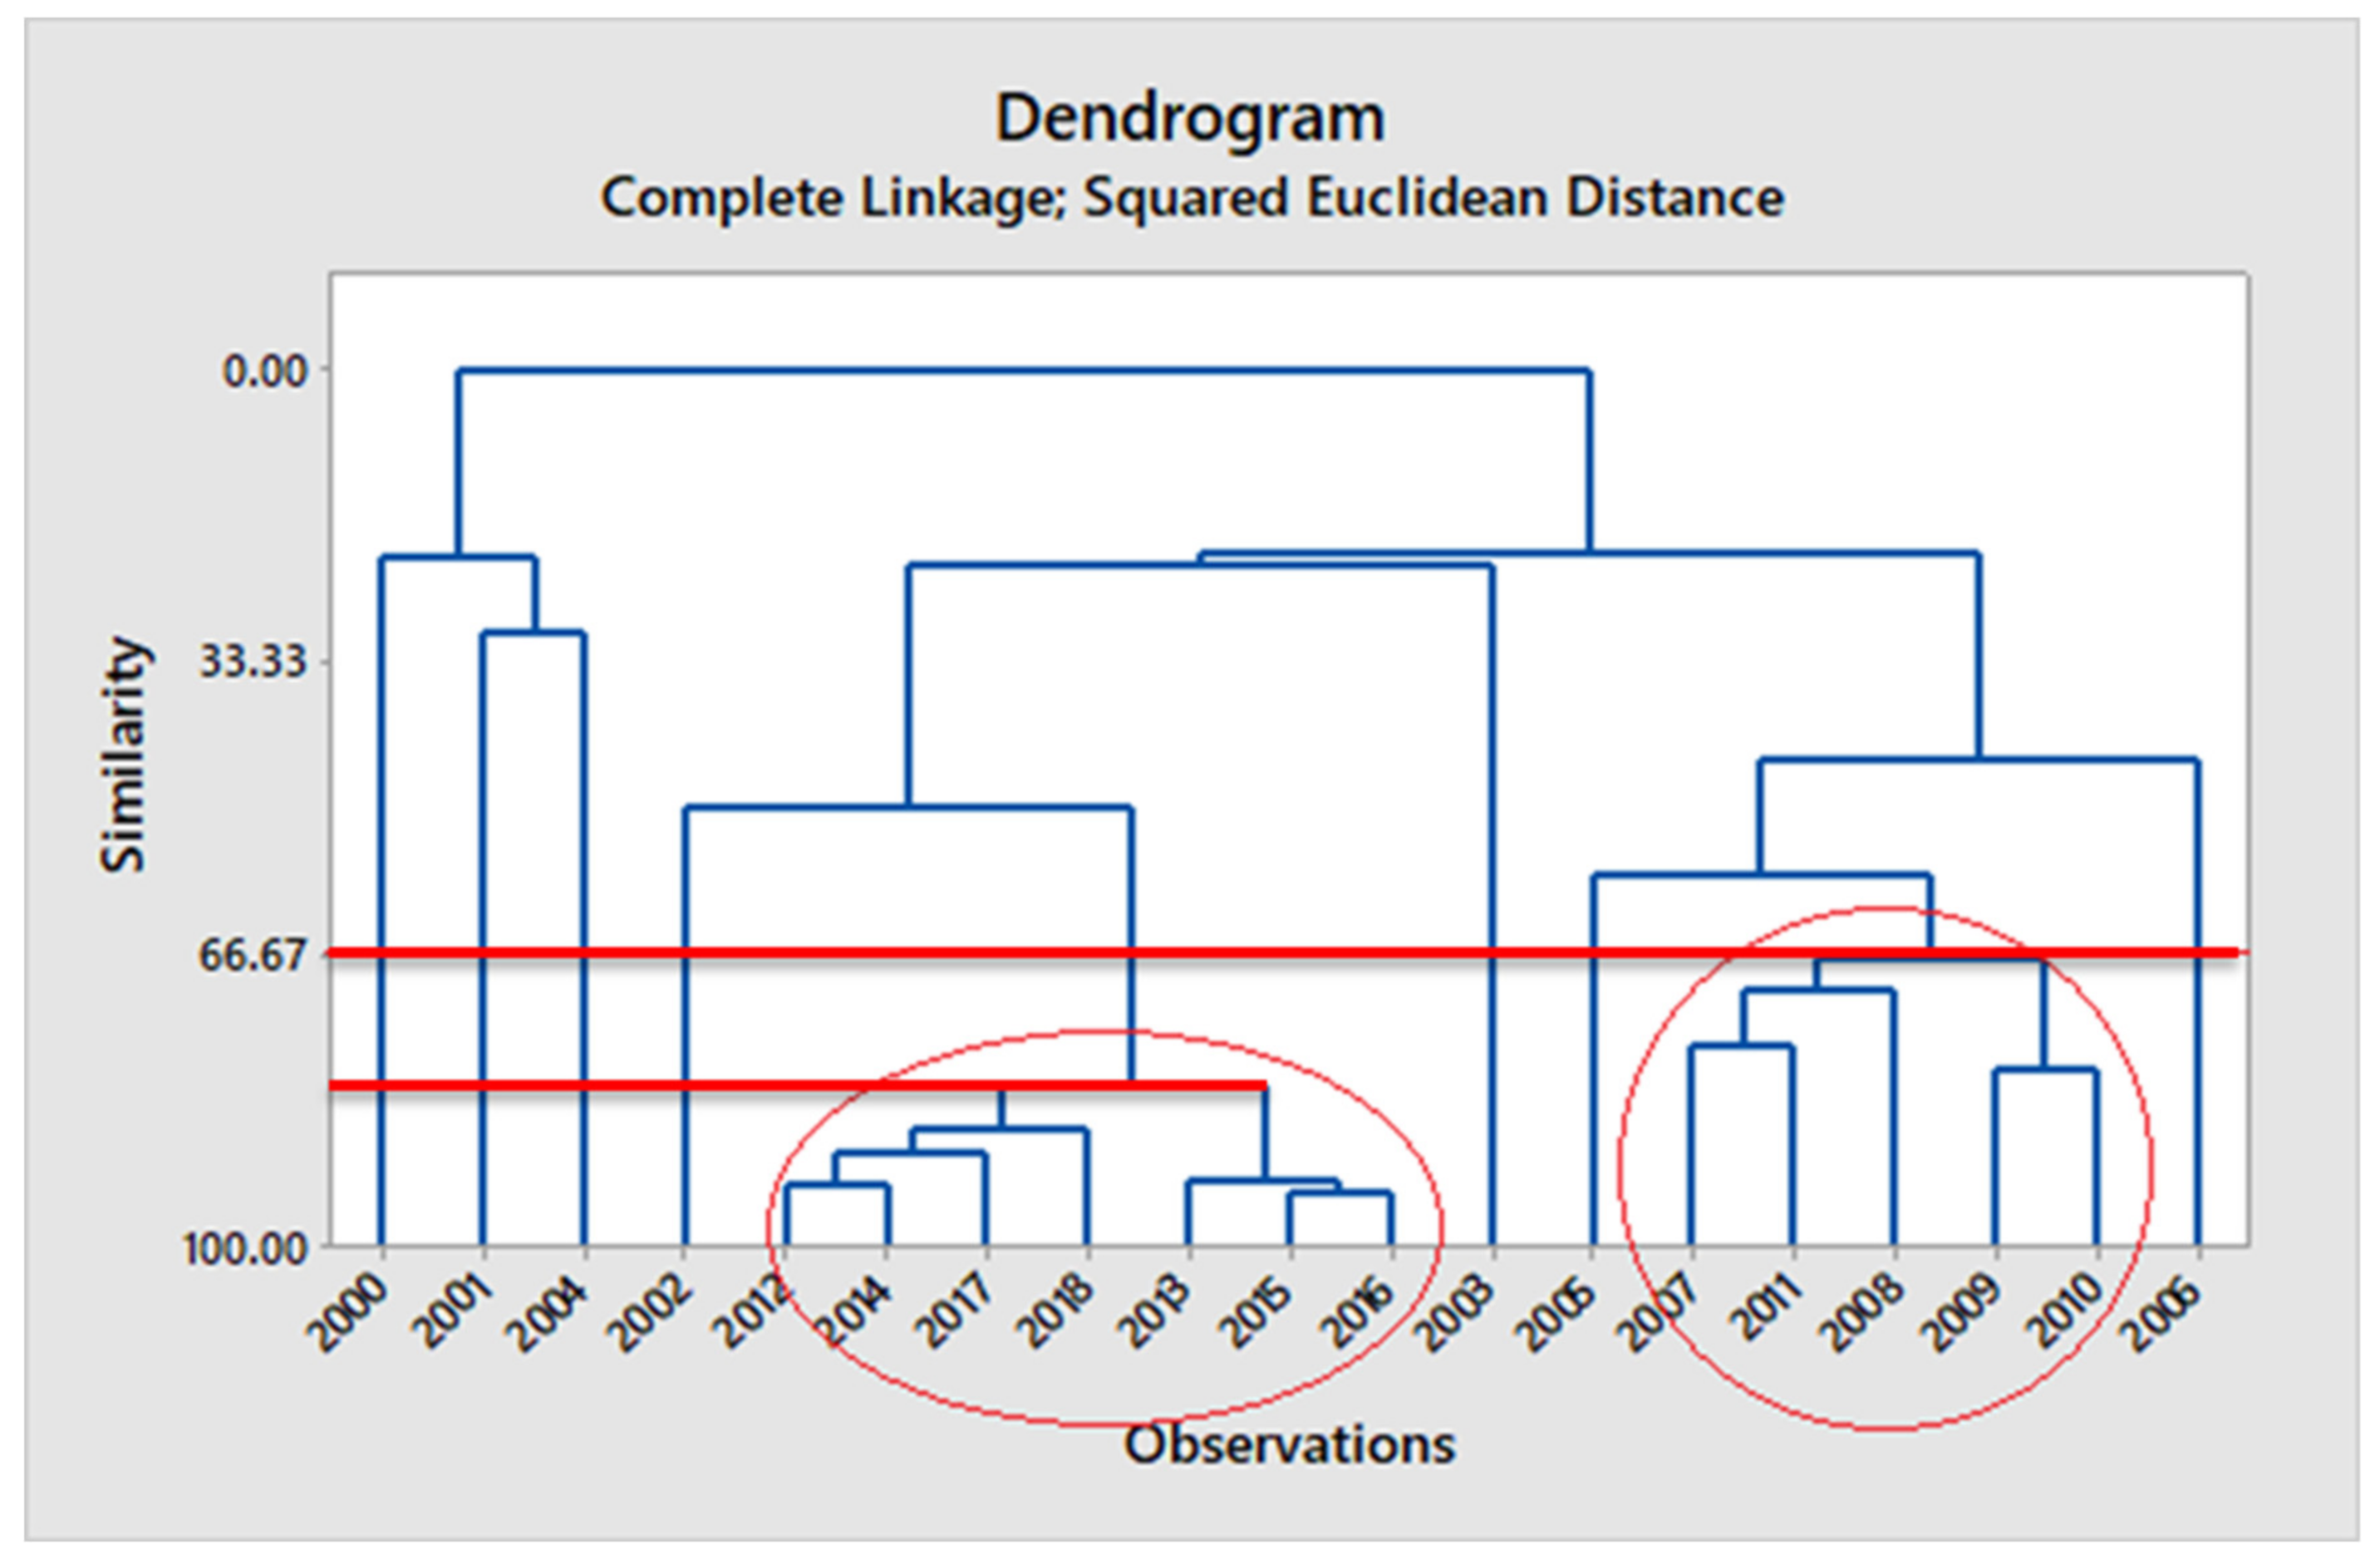
Table 6 was submitted to a hierarchical clustering algorithm, leading to the dendrogram presented in Figure 6.
It is worth mentioning that a dendrogram is a tree diagram that shows hierarchical relationships between similar objects [118], which, in this case, are the years.
Therefore, the dendrogram shows in Figure 6 two well-defined clusters. One of these clusters groups the years 2007–2011, at a similarity level of 66.7, and the other, the years 2012–2018, at a similarity level larger than 80. The years ranging from 2000 to 2006 are very heterogeneous. This suggests that the period covered by this research could be divided into three phases. 
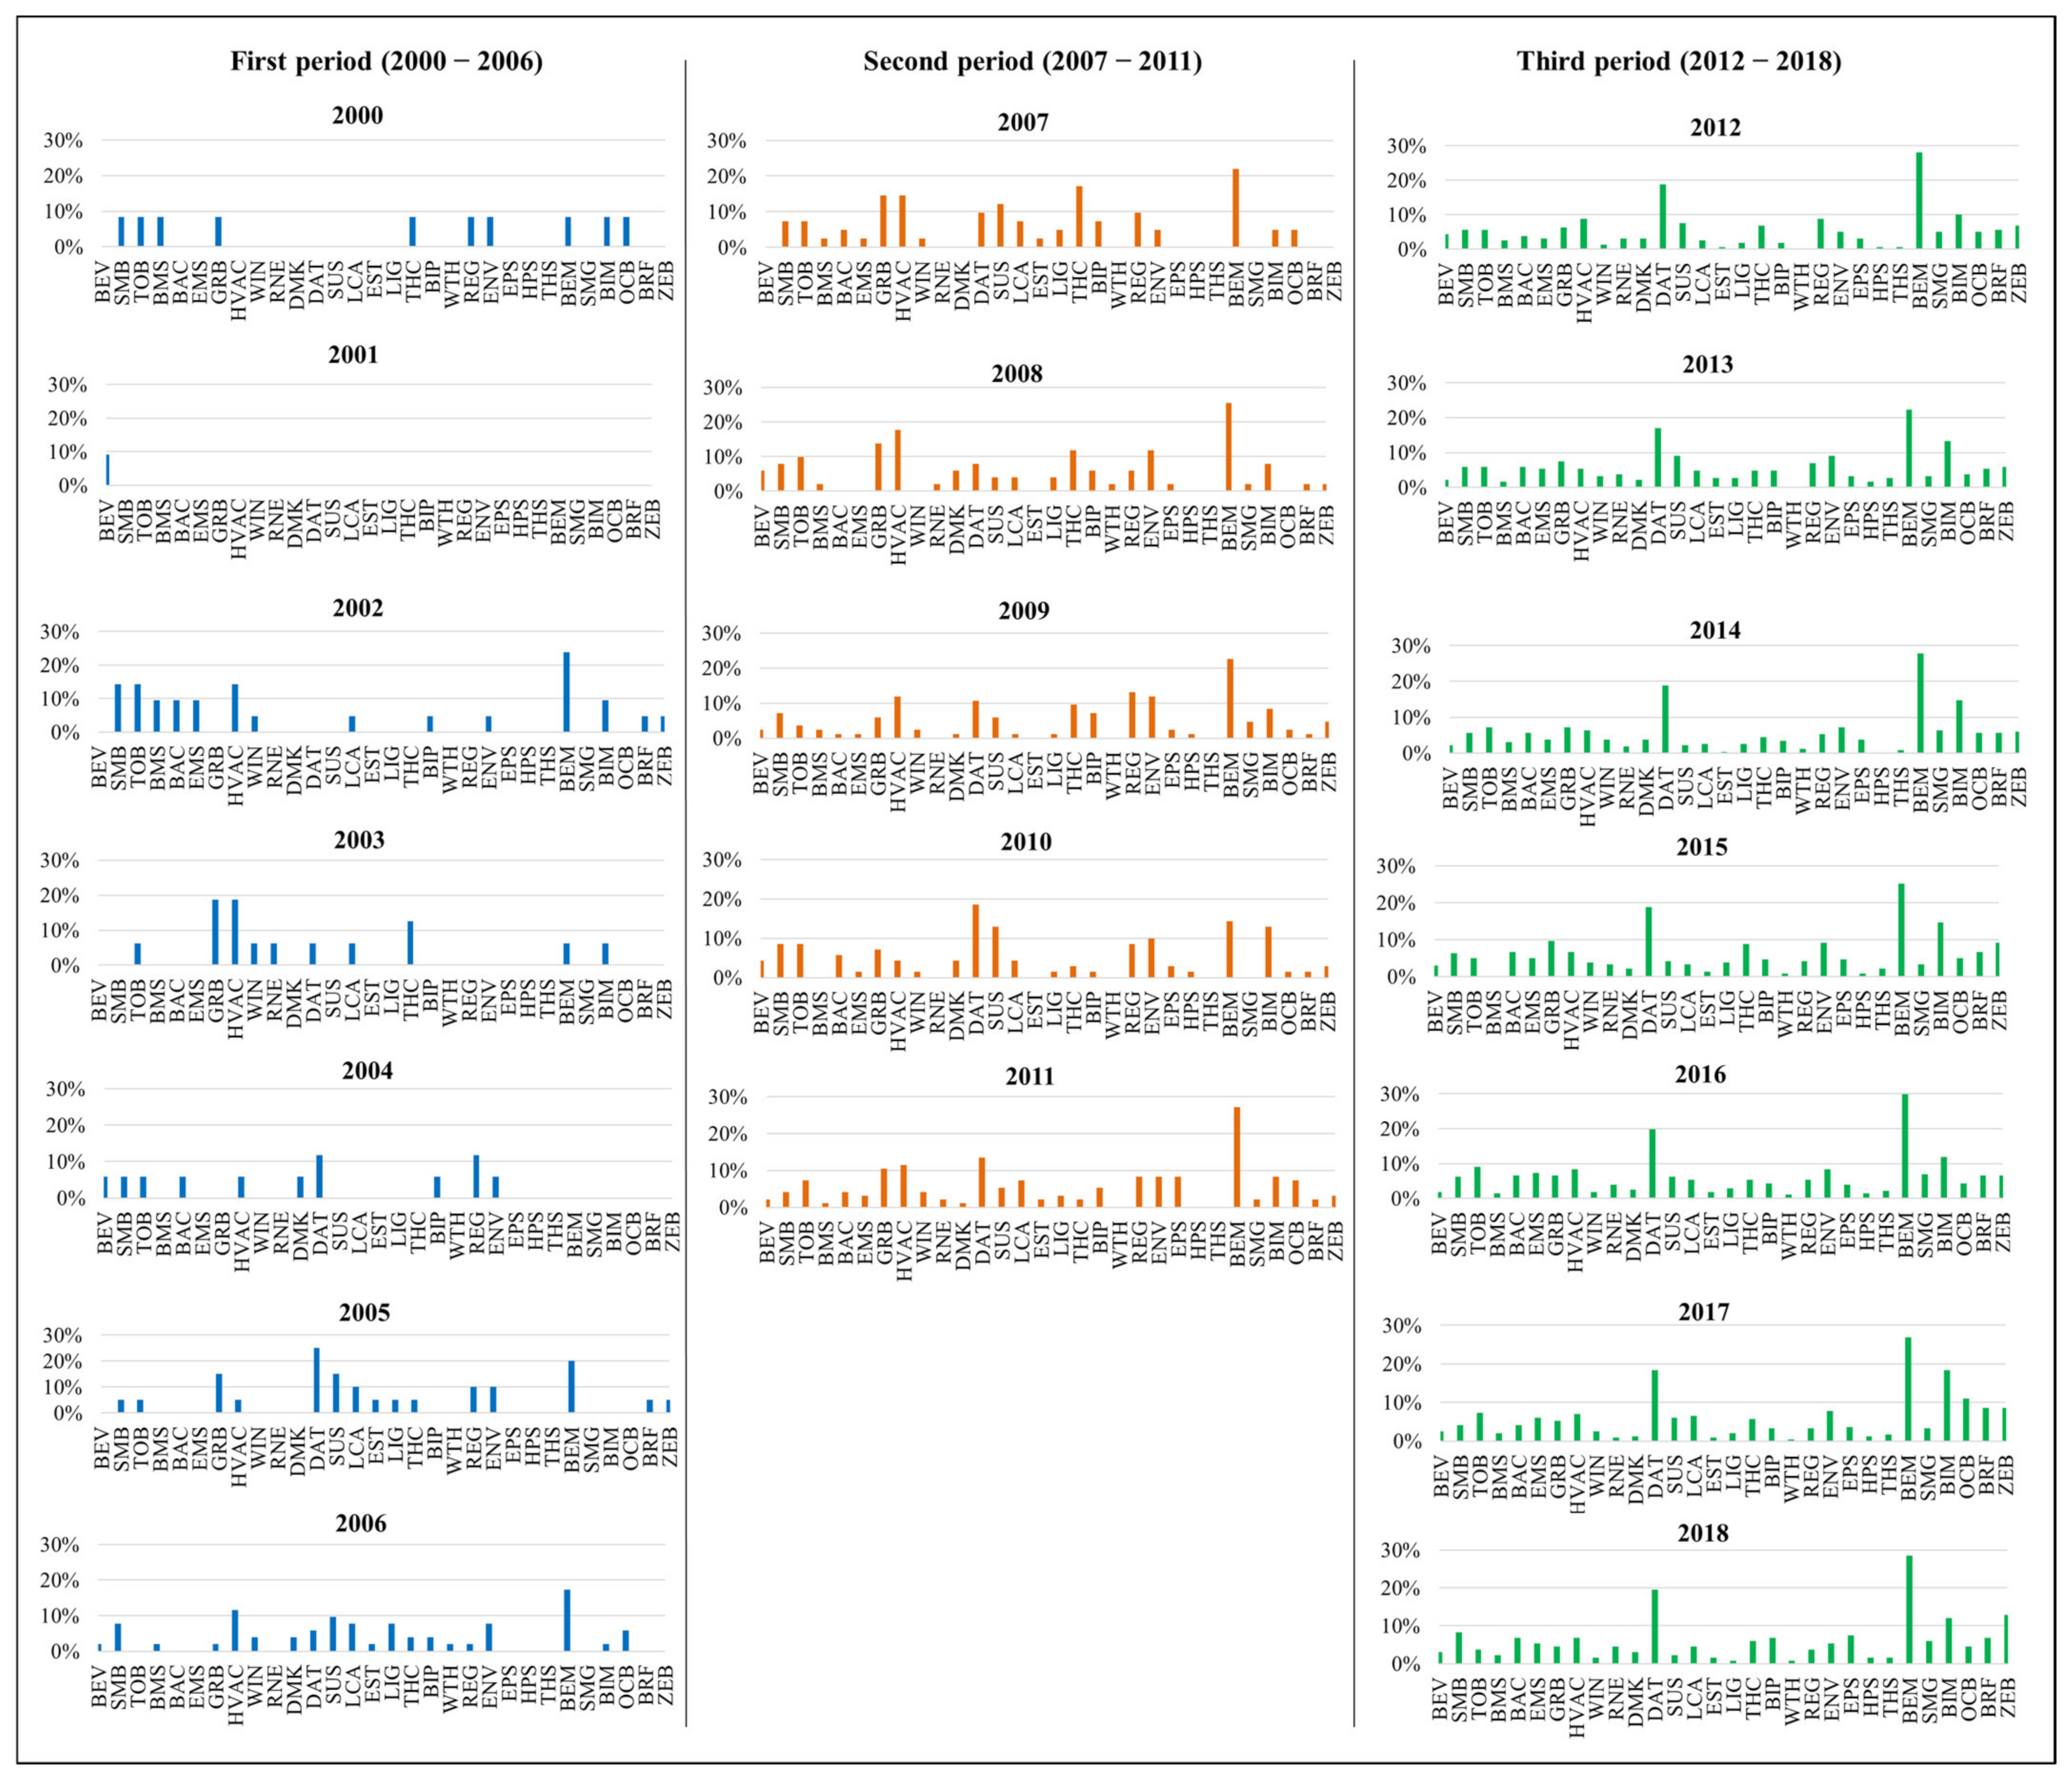
Figure 7 shows the profile of each of these phases.
Figure 7 presents the annual participation of the themes in the literature for the three evolutionary periods determined by the cluster analysis.
During the first period (2000–2006), the scientific community’s gaze was scattered over 26 themes, differently distributed over the whole period. In 2000, ten themes were presented in the literature; in 2001, only one theme (BEV); in 2002, this number increased to 14; in 2003 and 2004 decreased to 10; in 2005, increased to 15; and in 2006, the number of different themes presented in the literature reached its maximum, 20.
The participation of the themes in the literature varied over the years. In 2000, ten themes shared the same participation in the literature (10%); in 2002, the theme BEM stood out (24%); in 2003 two themes were highlighted, GRB and HVAC with 19%; in 2004, other two themes stood out, but this time, with 12% of participation (DAT, REG); in 2005, the theme DAT increased its participation to 25%, and, in 2006 the theme BEM stood out with 17% of participation in the literature.
The low number of themes in 2001 is due to the fact that only the articles that reached five or more citations were considered, which leads to the conclusion that the production of articles addressing the Building Envelope was the most consistent in 2001.
Therefore, it can be seen that the evolution of this field of knowledge over this period did not exhibit any pattern.
The second period (2007–2011) is the shortest of the three periods (five years). It presented more themes consolidated than the previous one. Twenty-nine themes had been explored over this period, and 15 of them were present in all five years of this period. In 2007, 20 different themes were present in the literature; in 2008, 23 themes; in 2009, 26; in 2010, 24; and in 2011, 27. Thus, it is fair to conclude that the scientific community’s interest in this field of knowledge became more consistent.
It was in this period that the themes BIP, ENV, REG and THC reached their greatest participation in the literature. However, the theme BEM was by far the one most present in the literature, closely followed by DAT. The participation of the themes BAC, BRF, EMS, OCB, SMG and ZEB had a neglectable participation in the literature over this period, while the participation of the themes BEV, BMS, GRB, HVAC, SMB, SUS and TOB shrank.
In the third period (2012–2018), all the thirty themes had been explored, 29 themes in 2012, 2013 and 2015; 28 themes in 2014; 30 themes in 2016, 2017 and 2018. Thus, it can be said that the scientific interest in this field of knowledge increased even more over this period.
The participation of the themes BEM, BIM, BRF, DAT, OCB and ZEB had increased and, according to statistical analysis, they are in an upward trend. participation of other themes like BAC, EMS and SMG had increased as well, but not enough signalise an upward trend. The interest for the themes ENV, GRB, HVAC, REG and SUS had decreased. The other themes remained stable.

3.6. Interrelationships between Themes

According to Sun and Latora [111], the interaction between themes within a field of knowledge reflects the flow of knowledge between the sub-areas of this field. Thus, in order to understand the evolution of this field, it is fundamentally important to define and study the interaction between the themes.
Many articles address multiple themes at once. What indicates an interaction between themes? The interaction between the themes i and j can be assessed by means of Equation (2).
λ i j = 100 · N i j N p
where N i j is the number of articles that concurrently address the themes i and j, and N p is the number of articles for the considered period (N1 = 149, N2 = 342 and N3 = 1509).Thus, λ i j is the percentage of the articles produced during the period under investigation that addresses the themes i and j. Figure 8 presents a graphical representation of the model used to account for the interactions between themes.
Based on Figure 8, it can be seen that λ i j 
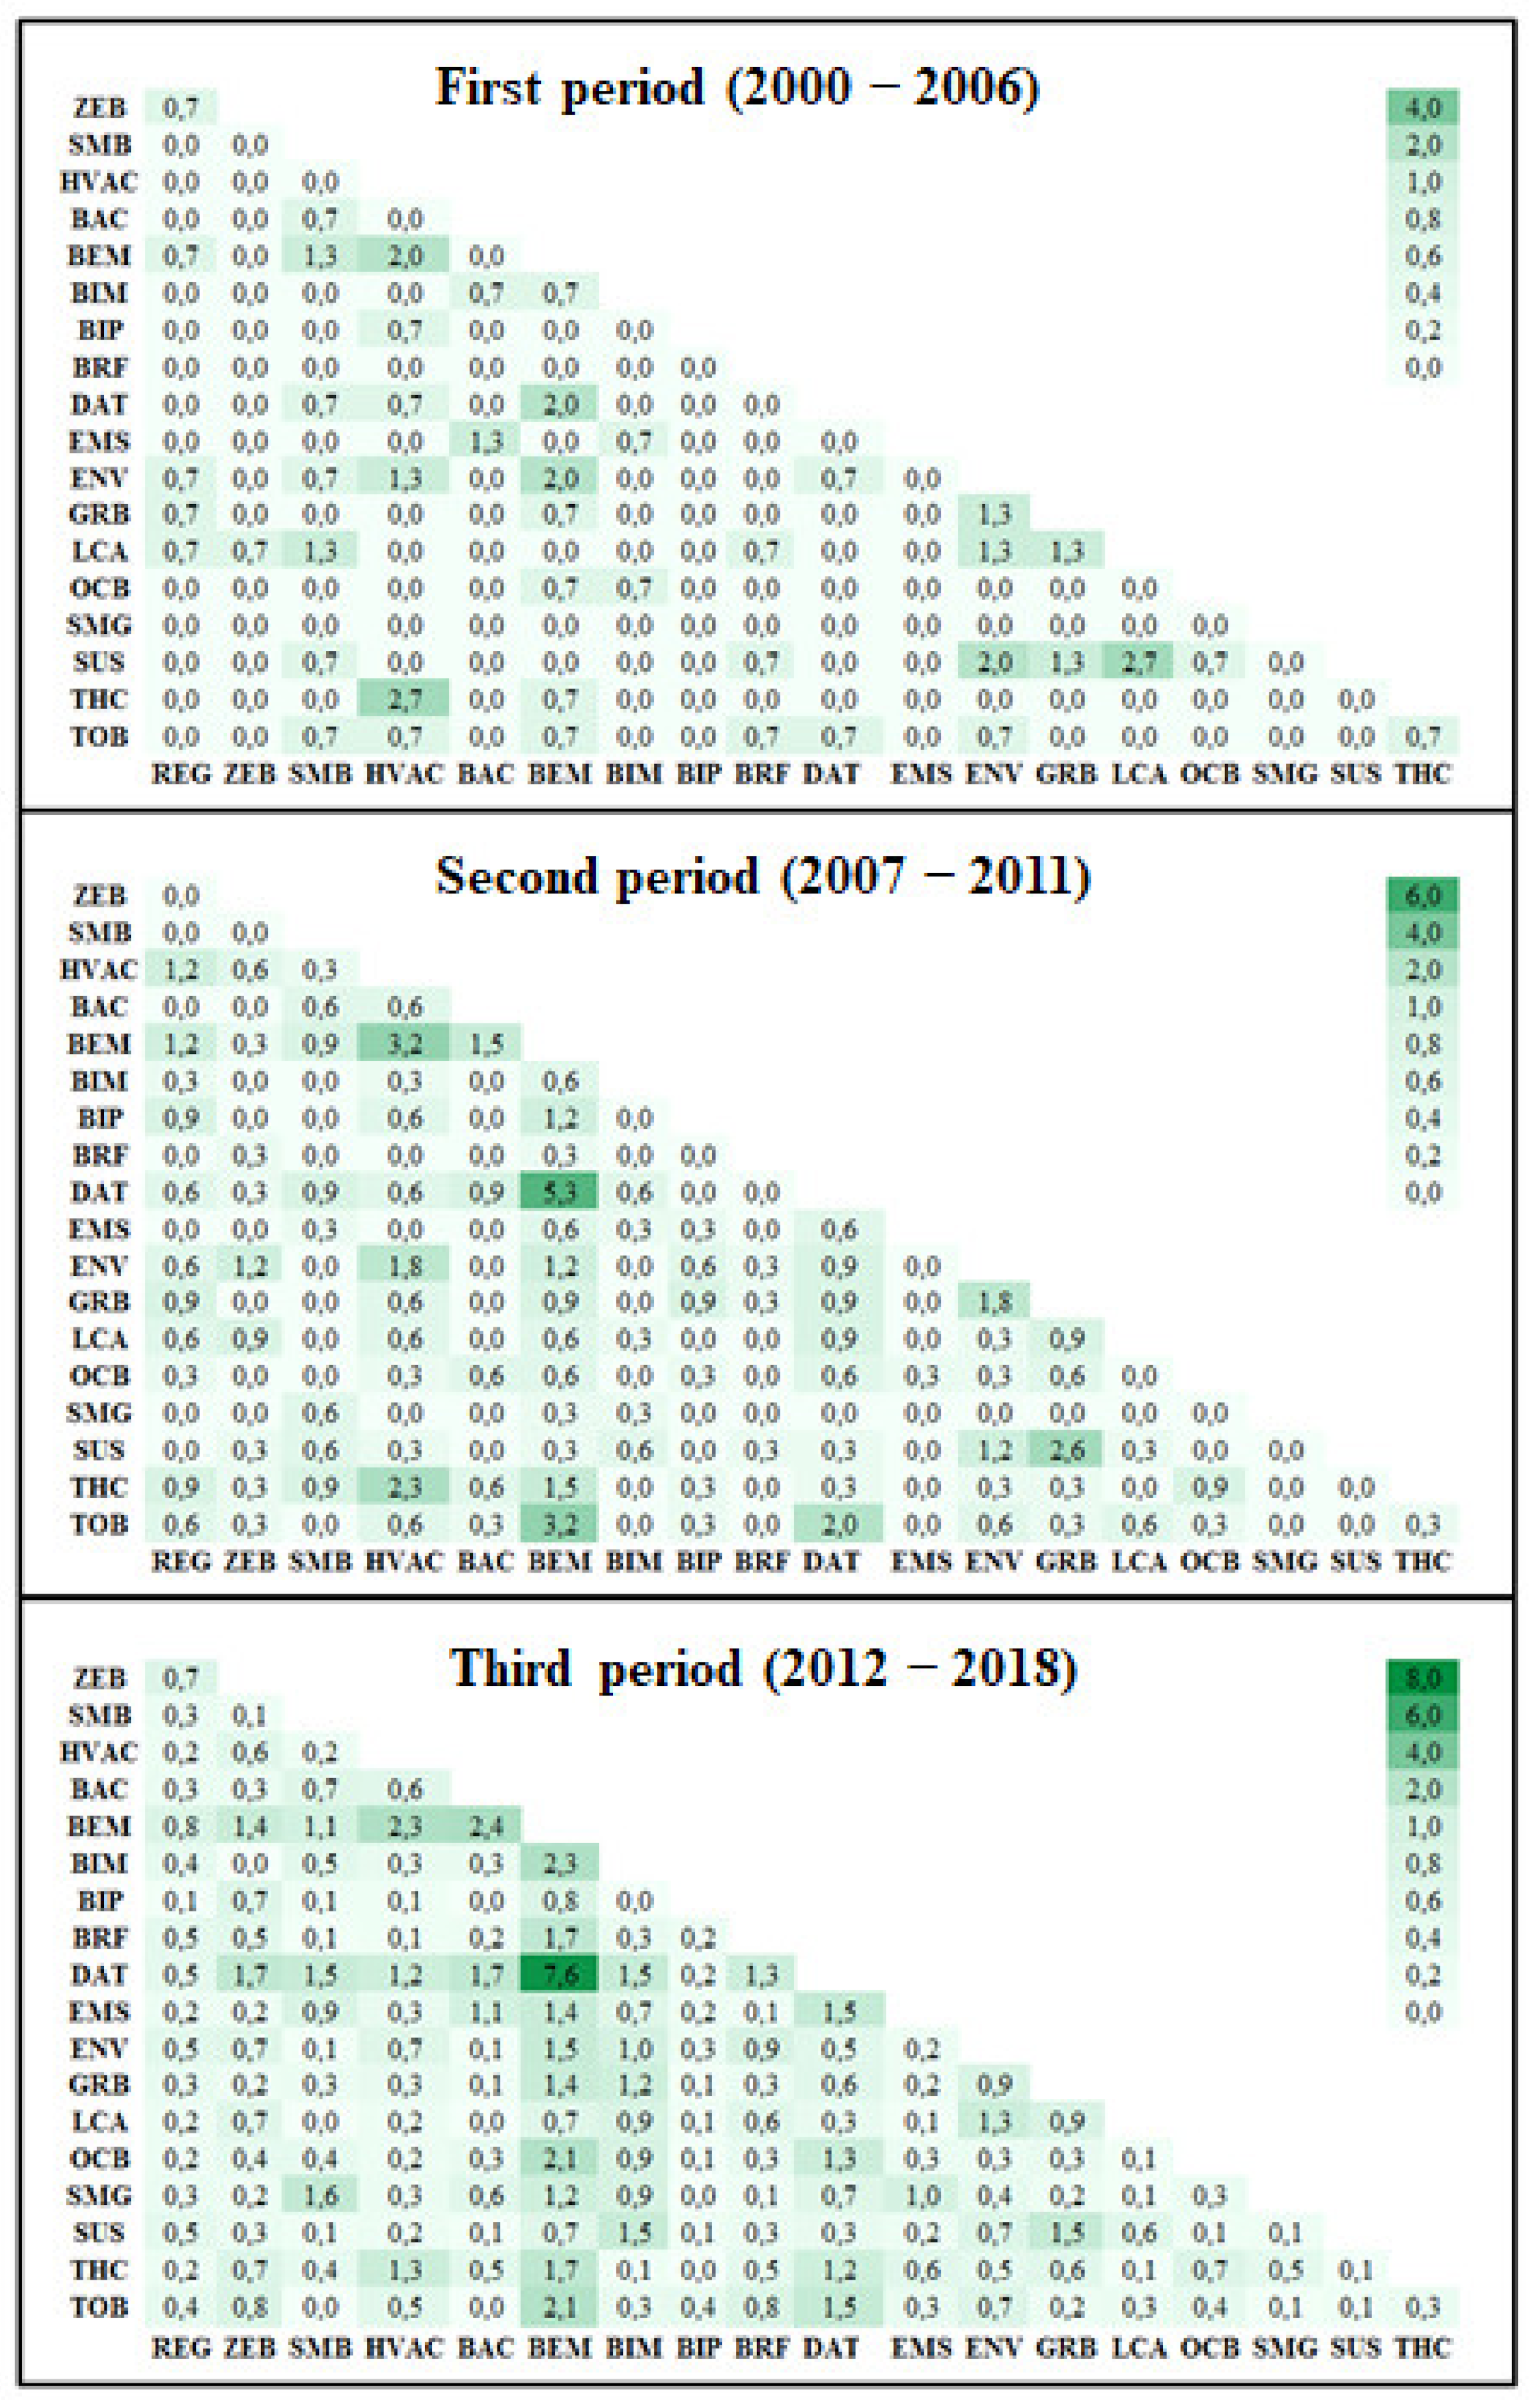
can be stored in a symmetric matrix, called interaction or interrelationship matrix. According to Equation (2), such a matrix varies depending on the evolutionary period. Figure 9 shows the interrelationship matrix for each period.
The darker the fill colour, the greater the interaction between themes i and j.
Observing the matrix for the first period, it can be said that, during this period, this field of knowledge was driven in large part by themes concerned with sustainable development and thermal comfort. Also, it can be noticed that the greatest interaction occurred between HVAC-THC and LCA-SUS. It is possible to observe the emergence of the relationship between the themes BEM-DAT, which would increase until the end of the third period.
During the second period, the interest of the scientific community revolved more around the interaction between BEM-DAT; BEM-HVAC; GRB-SUS; HVAC-TOB and HVAC-THC.
The interaction between BEM-DAT is remarkable; it is by far the largest one, not only over the third period, but over the whole period covered by this research. Therefore, these two themes have been the great engine for developing the research on Building Energy Efficiency.
Since it is difficult to analyse and understand the interaction between the themes only by examining the interrelationship matrices in Figure 9, a visual representation of such matrices is valuable. Such a representation can be obtained by means of a data analysis technique known as multidimensional scaling [119], which allows the representation of the interrelationship of the themes in an abstract, two-dimensional Cartesian plot, as illustrated in Figure 10. Although such a representation is not absolutely perfect, it gives some insight into the interaction between themes. For instance, the greater the interaction between themes, the closer they are in the plot, forming clusters of synergetic themes. In other words: the closer the themes, the greater the flow of knowledge between them.
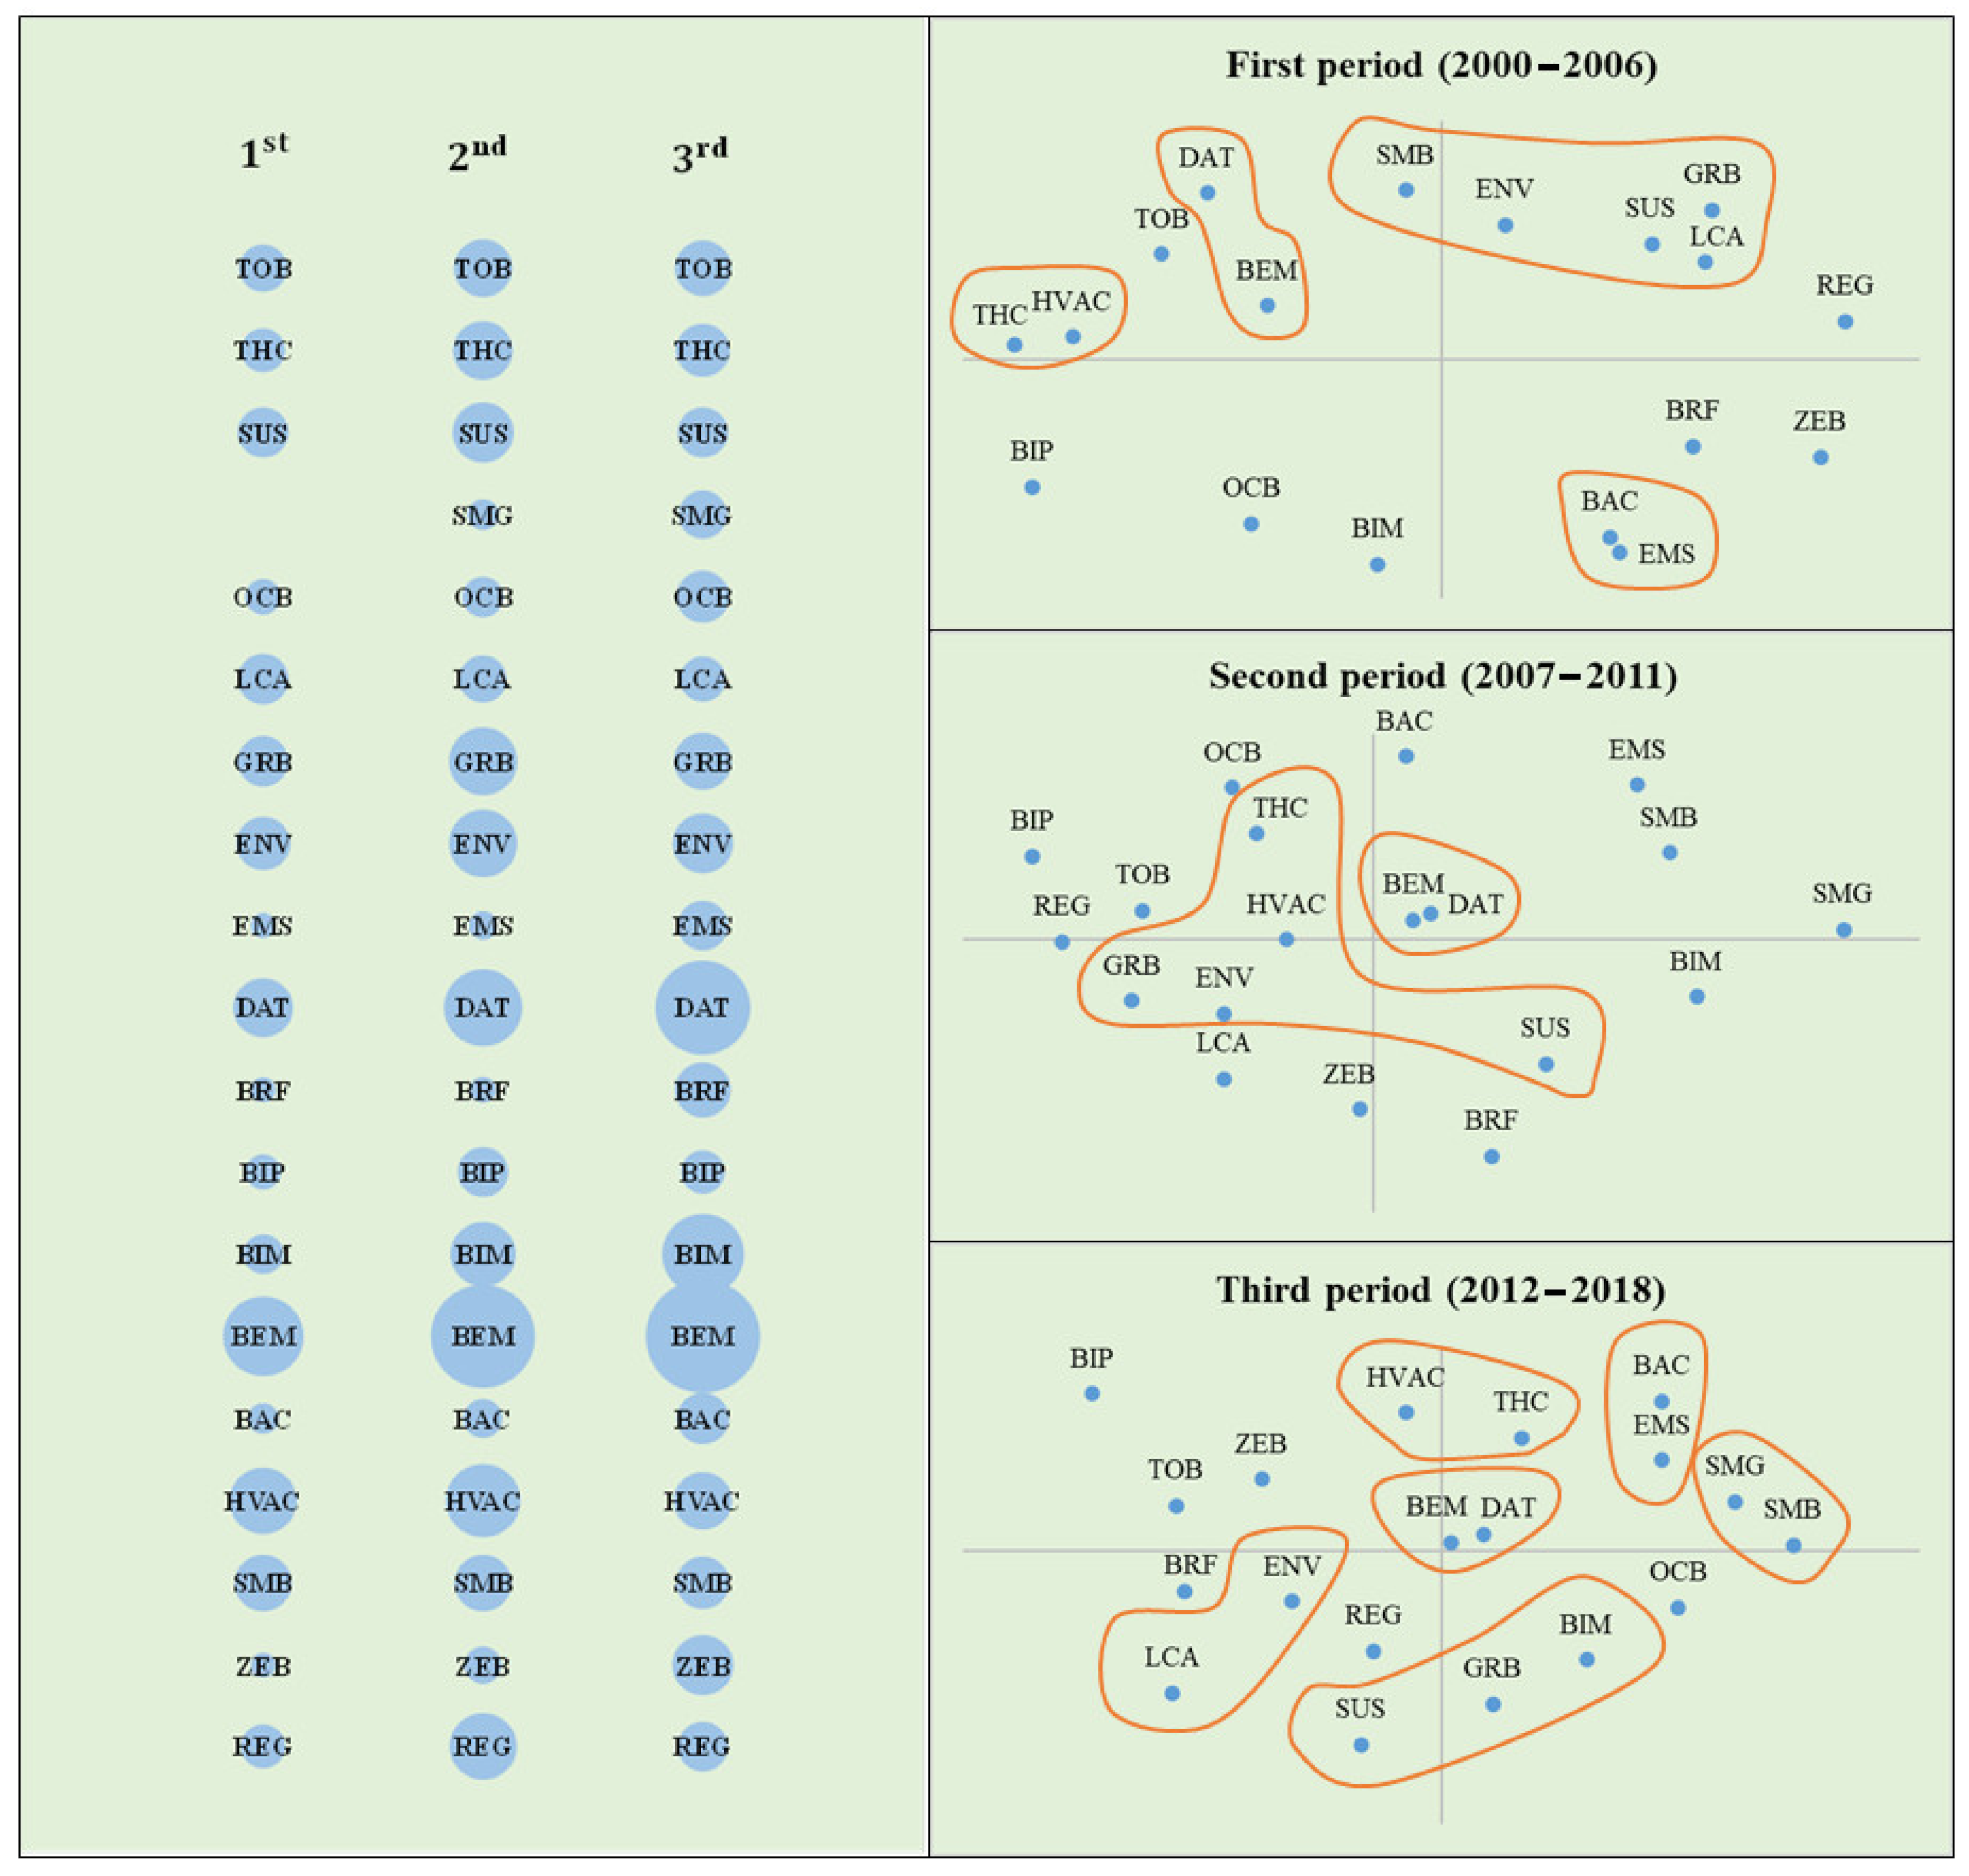
The left side of Figure 10 shows the participation of the themes over the three evolutionary stages. On the right side, three plots represent the interrelationship matrix between the themes for each of the three evolutionary stages.
The clusters shown in Figure 10 only include the themes for which the λ i j >1.0. The distance between clusters and elements was assessed according to the nearest neighbour strategy [118].
Observing the plots for the three evolutionary periods, it should be noted that the themes have clustered around the origin of the plot as this field evolved. In general, although it can distort the representation of the themes in the plot, the more central a theme, the greater the interaction with the others.
In the first evolutionary period of this field of knowledge, significant interaction between themes related to thermal comfort (THC-HVAC), themes concerned with environmental/sustainability issues (SUS-ENV-LCA-GRB-SMB), and themes addressing modelling and data analysis techniques (BEM-DAT) can be seen.
A number of clusters dropped from the first to the second evolutionary period. The cluster BEM-DAT remained and came closer to the centre of the plot. They are cross themes. Some articles are devoted to revisiting a given theme and have an interest in comparing the results emerging from different data analysis techniques, in such a way that the modelling and data analysis become the kernel of the paper instead of being tools by means of which better results can be achieved. Such articles give little attention to the aspects concerned with Building Energy Efficiency, which are only the background and data source, while their main purpose is data analysis.
Still, within the second period, the themes LCA and SMB leave the environment/sustainability cluster because of the lack of interaction with the other themes. The interaction of the remaining themes with the thermal comfort cluster increased, resulting in the formation of a new cluster.
The cluster BAC-EMS was extinct by this stage. Since the participation of both themes in the literature increased over this period, it is fair to assume that both themes developed in isolation, without sharing knowledge.
The number of isolated themes in this period was the largest amongst the evolutionary stages. Thus, it can be said that, during this period, the exchange of knowledge was the smallest.
The third stage is the one with the largest number of clusters and the smallest number of isolated themes. It can be considered the period with the greatest flow of knowledge between sub-areas within this field of knowledge.
The clusters THC-HVAC and BAC-EMS, from the first evolutionary stage, have been re-established, meaning that the themes within each cluster restarted, triggering knowledge production in each other.
The cluster BEM-DAT is even closer to the centre of the plot in this stage. According to the interaction matrix for the third period, in Figure 9, this cluster interacts with all the themes ( λ i j > 1.0) except the themes BIP and REG.
The cluster concerned with environment/sustainability in the first period was broken into three small clusters (LCA-ENV, SMB-SMG, and SUS-GRB-BIM), suggesting the exchange of more specialised knowledge. The flow of knowledge between themes related to sustainability and information modelling is noteworthy. As the latter theme shows an upward trend, it is quite possible that its development increases the knowledge production of themes related to green buildings and sustainability.
The themes BIP, TOB, REG, ZEB, BRF, and OCB developed in isolation over all three evolutionary stages. The latter three are in an upward trend, according to the trend analysis previously presented. Thus, a clear relation between trend and evolutionary development of a theme within the Building Energy Efficiency field of knowledge could not be seen.

4. Conclusions

After analysing 2000 articles concerned with Building Energy Efficiency, this paper shows that this field of knowledge has not yet reached maturity. Thus, much remains to be studied, meaning that investment in research is still needed.
This research identified thirty recurrent themes within this field of knowledge. However, only nineteen of these themes are statistically significant. According to the Mann-Kendall trend test, eight out of these themes show a clear upward trend, one a downward trend, and ten do not show any clear evidence for a particular trend.
This study shows that the evolution of this field of knowledge passed through three stages, whose dynamics were clearly explained, as well as the changes in the patterns of cross-fertilisation.
This research shows that energy modelling, along with data analysis techniques, have been influencing this field of knowledge since its beginning and they have been instigating production in other areas within this field. Therefore, themes like Building Energy Modelling and Data Analysis Techniques are in an upward trend and still very far from maturity, constituting good research opportunities.
The scientific community’s gaze is on other themes with low connections, like Occupancy Behaviour, Building Information Modelling, Zero Energy Buildings, and Building Retrofitting. All of these themes have increased in importance and seem to be new frontiers of this field of knowledge.
Considering the Occupancy Behaviour, topics like eco-feedback, gamification, behaviour, and advanced building automation systems have not been adequately addressed.
Building Information Modelling is a very recent research front, therefore there is a great interest among the scientific community in this field, which signalise that there is a great potential for research on integrating BIM with technologies like monitoring systems, thermography, geographic information systems.
The concept of Zero Energy Building has drawn the attention of the scientific community. However, there are few studies focusing on the feasibility of Zero Energy Building in a diversity of climates and the integration with information technology.
Building Energy Retrofitting provides substantial opportunities to reduce the energy consumption of the building sector. There are a lot of research opportunities such as identifying and designing optimal cost-effective energy retrofitting strategies, combining retrofitting with Building Energy Modelling, Retrofitting, and Occupancy Behaviour.
Furthermore, it is worth mentioning that some of the themes are indirectly of interest for the Zero Energy Building and Building Energy Retrofitting themes. The themes Building Management Systems, Building Envelope, Energy Performance Software, Energy Storage, Lighting, Renewable Energy Sources, Thermal Storage, and Windows could be still focused on the recent research under the umbrella of themes with increasing trends.
These findings allow the researchers to optimise time and resources by investigating the themes with growing interest and possibilities for new contributions, as the scientific community directs its efforts towards cutting edge themes and topics. Furthermore, they improve the understanding of the laws governing the development of a field of knowledge, impacting the formulation of research strategies.
This research identified the interaction between themes but does not propose a mechanism to objectively identify the direction of the flow of knowledge. Such information can improve the understanding of the development of the field of knowledge. Therefore, it is suggested that future research addresses this unanswered aspect of the current research.

Author Contributions

Conceptualisation, T.M.C. and A.F.N.; methodology, T.M.C. and A.F.N.; software, T.M.C.; validation, T.M.C.; formal analysis, T.M.C.; investigation, T.M.C. and A.F.N.; resources, A.F.N.; data curation, A.F.N.; writing—original draft, T.M.C.; writing—review & editing, A.F.N., F.W. and B.D.; visualisation, T.M.C.; supervision, A.F.N. and B.D.; project administration, T.M.C. and F.W.; funding acquisition, T.M.C., A.F.N., F.W. and B.D. All authors have read and agreed to the published version of the manuscript.

Funding

This research has been partially supported by the CDP Eco-SESA, receiving funds from the French National Research Agency in the framework of the “Investissements d’avenir” programme [ANR-15-IDEX-02]; by the Coordination for the Improvement of Higher Education Personnel—Brazil (CAPES) [Finance Code 001]; and by the São Paulo Research Foundation (FAPESP) [grant numbers 2021/01423-9 and 2019/17937-1].

Institutional Review Board Statement

Not applicable.

Informed Consent Statement

Not applicable.

Data Availability Statement

Not applicable.

Conflicts of Interest

The authors declare no conflict of interest.

Abbreviations

The following abbreviations are used in this research:
BACBuilding Automation and Control
BEEBuilding Energy Efficiency
BEMBuilding Energy Modelling
BEVBuilding Envelope
BIMBuilding Information Modelling
BIPBuilding Integrated Photovoltaics
BMSBuilding Management Systems
BRFBuilding Retrofitting
DATData Analysis Techniques
DMKDecision Making
EMSEnergy Management Systems
ENVEnvironmental
EPSEnergy Performance Software
ESTEnergy Storage
GRBGreen Building
HPSHeat Pumping Systems
HVACHeating-Ventilation-Air-Conditioning
LCALife Cycle Assessment
LIGLighting
OCBOccupancy Behaviour
REGRegulations
RNERenewable Energy Sources
SMBSmart Buildings
SMGSmart Grids
SUSSustainability
THCThermal Comfort
THSThermal Storage
TOBTypes Of Building
WINWindows
WTHWater Heating
ZEBNear Zero/Zero Energy Building

References

  1. Zhang, Y.; Wang, Y. Barriers’ and policies’ analysis of China’s building energy efficiency. Energy Policy 2013, 62, 768–773. [Google Scholar] [CrossRef]
  2. De Oliveira, K.B.; dos Santos, E.F.; Neto, A.F.; Santos, V.H.D.M.; de Oliveira, O.J. Guidelines for efficient and sustainable energy management in hospital buildings. J. Clean. Prod. 2021, 329, 129644. [Google Scholar] [CrossRef]
  3. Curtius, H.C. The adoption of building-integrated photovoltaics: Barriers and facilitators. Renew. Energy 2018, 126, 783–790. [Google Scholar] [CrossRef]
  4. International Energy Agency (IEA). Energy Efficiency: Buildings—The Global Exchange for Energy Efficiency Policies, Data and Analysis. 2019. Available online: https://www.iea.org/topics/energyefficiency/buildings (accessed on 27 May 2019).
  5. Buildings—European Commission, (n.d.). Available online: https://ec.europa.eu/energy/en/topics/energy-efficiency/buildings (accessed on 20 September 2019).
  6. Bond, S. Barriers and drivers to green buildings in Australia and New Zealand. J. Prop. Invest. Finance 2011, 29, 494–509. [Google Scholar] [CrossRef]
  7. Greenough, R.; Tosoratti, P. Low carbon buildings: A solution to landlord-tenant problems? J. Prop. Invest. Finance 2014, 32, 415–423. [Google Scholar] [CrossRef]
  8. Zhou, L.; Li, J.; Chiang, Y.H. Promoting energy efficient building in China through clean development mechanism. Energy Policy 2013, 57, 338–346. [Google Scholar] [CrossRef]
  9. Persson, J.; Grönkvist, S. Drivers for and barriers to low-energy buildings in Sweden. J. Clean. Prod. 2015, 109, 296–304. [Google Scholar] [CrossRef]
  10. Zhao, H.-X.; Magoulès, F. A review on the prediction of building energy consumption. Renew. Sustain. Energy Rev. 2012, 16, 3586–3592. [Google Scholar] [CrossRef]
  11. Bourdic, L.; Salat, S. Building energy models and assessment systems at the district and city scales: A review. Build. Res. Inf. 2012, 40, 518–526. [Google Scholar] [CrossRef]
  12. Tian, W. A review of sensitivity analysis methods in building energy analysis. Renew. Sustain. Energy Rev. 2013, 20, 411–419. [Google Scholar] [CrossRef]
  13. Coakley, D.; Raftery, P.; Keane, M. A review of methods to match building energy simulation models to measured data. Renew. Sustain. Energy Rev. 2014, 37, 123–141. [Google Scholar] [CrossRef] [Green Version]
  14. Li, X.; Wen, J. Review of building energy modeling for control and operation. Renew. Sustain. Energy Rev. 2014, 37, 517–537. [Google Scholar] [CrossRef]
  15. Reinhart, C.F.; Davila, C.C. Urban building energy modeling—A review of a nascent field. Build. Environ. 2016, 97, 196–202. [Google Scholar] [CrossRef] [Green Version]
  16. Harish, V.S.K.V.; Kumar, A. A review on modeling and simulation of building energy systems. Renew. Sustain. Energy Rev. 2016, 56, 1272–1292. [Google Scholar] [CrossRef]
  17. Whiffen, T.; Naylor, S.; Hill, J.; Smith, L.; Callan, P.; Gillott, M.; Wood, C.; Riffat, S. A concept review of power line communication in building energy management systems for the small to medium sized non-domestic built environment. Renew. Sustain. Energy Rev. 2016, 64, 618–633. [Google Scholar] [CrossRef]
  18. Molina-Solana, M.; Ros, M.; Ruiz, M.D.; Gómez-Romero, J.; Martin-Bautista, M. Data science for building energy management: A review. Renew. Sustain. Energy Rev. 2017, 70, 598–609. [Google Scholar] [CrossRef] [Green Version]
  19. Li, W.; Zhou, Y.; Cetin, K.; Eom, J.; Wang, Y.; Chen, G.; Zhang, X. Modeling urban building energy use: A review of modeling approaches and procedures. Energy 2017, 141, 2445–2457. [Google Scholar] [CrossRef]
  20. Tian, Z.; Zhang, X.; Jin, X.; Zhou, X.; Si, B.; Shi, X. Towards adoption of building energy simulation and optimization for passive building design: A survey and a review. Energy Build. 2018, 158, 1306–1316. [Google Scholar] [CrossRef]
  21. Sadineni, S.B.; Madala, S.; Boehm, R.F. Passive building energy savings: A review of building envelope components. Renew. Sustain. Energy Rev. 2011, 15, 3617–3631. [Google Scholar] [CrossRef]
  22. Friess, W.A.; Rakhshanbabanari, K. A review of passive envelope measures for improved building energy efficiency in the UAE. Renew. Sustain. Energy Rev. 2017, 72, 485–496. [Google Scholar] [CrossRef]
  23. Rao, V.V.; Parameshwaran, R.; Ram, V.V. PCM-mortar based construction materials for energy efficient buildings: A review on research trends. Energy Build. 2018, 158, 95–122. [Google Scholar] [CrossRef]
  24. Kheiri, F. A review on optimization methods applied in energy-efficient building geometry and envelope design. Renew. Sustain. Energy Rev. 2018, 92, 897–920. [Google Scholar] [CrossRef]
  25. Rashidi, S.; Esfahani, J.A.; Karimi, N. Porous materials in building energy technologies—A review of the applications, modelling and experiments. Renew. Sustain. Energy Rev. 2018, 91, 229–247. [Google Scholar] [CrossRef]
  26. Kazmi, A.H.; O’Grady, M.; Delaney, D.; Ruzzelli, A.G.; O’Hare, G.M.P. A Review of Wireless-Sensor-Network-Enabled Building Energy Management Systems. ACM Trans. Sens. Networks 2014, 10, 1–43. [Google Scholar] [CrossRef]
  27. Pérez-Lombard, L.; Ortiz, J.; Pout, C. A review on buildings energy consumption information. Energy Build. 2008, 40, 394–398. [Google Scholar] [CrossRef]
  28. Fumo, N. A review on the basics of building energy estimation. Renew. Sustain. Energy Rev. 2014, 31, 53–60. [Google Scholar] [CrossRef]
  29. Deb, C.; Zhang, F.; Yang, J.; Lee, S.E.; Shah, K.W. A review on time series forecasting techniques for building energy consumption. Renew. Sustain. Energy Rev. 2017, 74, 902–924. [Google Scholar] [CrossRef]
  30. Wang, Z.; Srinivasan, R. A review of artificial intelligence based building energy use prediction: Contrasting the capabilities of single and ensemble prediction models. Renew. Sustain. Energy Rev. 2017, 75, 796–808. [Google Scholar] [CrossRef]
  31. Amasyali, K.; El-Gohary, N.M. A review of data-driven building energy consumption prediction studies. Renew. Sustain. Energy Rev. 2018, 81, 1192–1205. [Google Scholar] [CrossRef]
  32. Wei, Y.; Zhang, X.; Shi, Y.; Xia, L.; Pan, S.; Wu, J.; Han, M.; Zhao, X. A review of data-driven approaches for prediction and classification of building energy consumption. Renew. Sustain. Energy Rev. 2018, 82, 1027–1047. [Google Scholar] [CrossRef]
  33. Ahmad, T.; Chen, H.; Guo, Y.; Wang, J. A comprehensive overview on the data driven and large scale based approaches for forecasting of building energy demand: A review. Energy Build. 2018, 165, 301–320. [Google Scholar] [CrossRef]
  34. Shi, X.; Tian, Z.; Chen, W.; Si, B.; Jin, X. A review on building energy efficient design optimization from the perspective of architects. Renew. Sustain. Energy Rev. 2016, 65, 872–884. [Google Scholar] [CrossRef]
  35. Tian, W.; Heo, Y.; de Wilde, P.; Li, Z.; Yan, D.; Park, C.S.; Feng, X.; Augenbroe, G. A review of uncertainty analysis in building energy assessment. Renew. Sustain. Energy Rev. 2018, 93, 285–301. [Google Scholar] [CrossRef] [Green Version]
  36. Zhu, N.; Ma, Z.; Wang, S. Dynamic characteristics and energy performance of buildings using phase change materials: A review. Energy Convers. Manag. 2009, 50, 3169–3181. [Google Scholar] [CrossRef]
  37. Chung, W. Review of building energy-use performance benchmarking methodologies. Appl. Energy 2011, 88, 1470–1479. [Google Scholar] [CrossRef]
  38. Hauge, Å.L.; Thomsen, J.; Berker, T. User evaluations of energy efficient buildings: Literature review and further research. Adv. Build. Energy Res. 2011, 5, 109–127. [Google Scholar] [CrossRef]
  39. Luck, K. Energy efficient building services for tempering performance-oriented interior spaces—A literature review. J. Clean. Prod. 2012, 22, 1–10. [Google Scholar] [CrossRef]
  40. Abu Bakar, N.N.; Hassan, M.Y.; Abdullah, H.; Rahman, H.A.; Abdullah, P.; Hussin, F.; Bandi, M. Energy efficiency index as an indicator for measuring building energy performance: A review. Renew. Sustain. Energy Rev. 2015, 44, 1–11. [Google Scholar] [CrossRef]
  41. Loonen, R.C.G.M.; Favoino, F.; Hensen, J.L.M.; Overend, M. Review of current status, Requirements and opportunities for building performance simulation of adaptive facades. J. Build. Perform. Simul. 2017, 10, 205–223. [Google Scholar] [CrossRef] [Green Version]
  42. Song, M.; Niu, F.; Mao, N.; Hu, Y.; Deng, S.S. Review on building energy performance improvement using phase change materials. Energy Build. 2018, 158, 776–793. [Google Scholar] [CrossRef]
  43. Fuentes, E.; Arce, L.; Salom, J. A review of domestic hot water consumption profiles for application in systems and buildings energy performance analysis. Renew. Sustain. Energy Rev. 2018, 81, 1530–1547. [Google Scholar] [CrossRef]
  44. Shaikh, P.H.; Nor, N.B.M.; Sahito, A.A.; Nallagownden, P.; Elamvazuthi, I.; Shaikh, M. A review on optimized control systems for building energy and comfort management of smart sustainable buildings. Renew. Sustain. Energy Rev. 2014, 34, 409–429. [Google Scholar] [CrossRef]
  45. Evins, R. A review of computational optimisation methods applied to sustainable building design. Renew. Sustain. Energy Rev. 2013, 22, 230–245. [Google Scholar] [CrossRef]
  46. John, G.; Clements-Croome, D.; Jeronimidis, G. Sustainable building solutions: A review of lessons from the natural world. Build. Environ. 2005, 40, 319–328. [Google Scholar] [CrossRef]
  47. Lemougna, P.N.; Melo, U.F.C.; Kamseu, E.; Tchamba, A.B. Laterite Based Stabilized Products for Sustainable Building Applications in Tropical Countries: Review and Prospects for the Case of Cameroon. Sustainability 2011, 3, 293–305. [Google Scholar] [CrossRef] [Green Version]
  48. Cabeza, L.F.; Barreneche, C.; Miró, L.; Martínez, M.; Fernandez, A.I.; Urge-Vorsatz, D. Affordable construction towards sustainable buildings: Review on embodied energy in building materials. Curr. Opin. Environ. Sustain. 2013, 5, 229–236. [Google Scholar] [CrossRef]
  49. Huedo, P.; López-Mesa, B.; Mesa, M.B.L. Review of tools to assist in the selection of sustainable building assemblies. Inf. Constr. 2013, 65, 77–88. [Google Scholar] [CrossRef] [Green Version]
  50. Alotaibi, S.S.; Riffat, S. Vacuum insulated panels for sustainable buildings: A review of research and applications. Int. J. Energy Res. 2013, 38, 1–19. [Google Scholar] [CrossRef]
  51. Asdrubali, F.; D’Alessandro, F.; Schiavoni, S. A review of unconventional sustainable building insulation materials. Sustain. Mater. Technol. 2015, 4, 1–17. [Google Scholar] [CrossRef]
  52. Nielsen, A.N.; Jensen, R.L.; Larsen, T.S.; Nissen, S.B. Early stage decision support for sustainable building renovation—A review. Build. Environ. 2016, 103, 165–181. [Google Scholar] [CrossRef]
  53. Ju, C.; Ning, Y.; Pan, W. A review of interdependence of sustainable building. Environ. Impact Assess. Rev. 2016, 56, 120–127. [Google Scholar] [CrossRef]
  54. Shaikh, P.H.; Nor, N.B.M.; Sahito, A.A.; Nallagownden, P.; Elamvazuthi, I.; Shaikh, M. Building energy for sustainable development in Malaysia: A review. Renew. Sustain. Energy Rev. 2017, 75, 1392–1403. [Google Scholar] [CrossRef]
  55. Merschbrock, C.; Munkvold, B. A Research review on building information modeling in construction—An area ripe for IS research. Commun. Assoc. Inf. Syst. 2012, 31, 207–228. [Google Scholar] [CrossRef]
  56. Volk, R.; Stengel, J.; Schultmann, F. Building Information Modeling (BIM) for existing buildings—Literature review and future needs. Autom. Constr. 2014, 38, 109–127. [Google Scholar] [CrossRef] [Green Version]
  57. Shou, W.; Wang, J.; Wang, X.; Chong, H.Y. A Comparative Review of Building Information Modelling Implementation in Building and Infrastructure Industries. Arch. Comput. Methods Eng. 2015, 22, 291–308. [Google Scholar] [CrossRef]
  58. Cho, Y.K.; Ham, Y.; Golpavar-Fard, M. 3D as-is building energy modeling and diagnostics: A review of the state-of-the-art. Adv. Eng. Inform. 2015, 29, 184–195. [Google Scholar] [CrossRef]
  59. Lopez, R.; Chong, H.-Y.; Wang, X.; Graham, J. Technical Review: Analysis and Appraisal of Four-Dimensional Building Information Modeling Usability in Construction and Engineering Projects. J. Constr. Eng. Manag. 2016, 142, 06015005. [Google Scholar] [CrossRef] [Green Version]
  60. Parn, E.; Edwards, D.; Sing, C.P. The building information modelling trajectory in facilities management: A review. Autom. Constr. 2017, 75, 45–55. [Google Scholar] [CrossRef] [Green Version]
  61. Liu, X.; Wang, X.; Wright, G.; Cheng, J.C.P.; Li, X.; Liu, R. A State-of-the-Art Review on the Integration of Building Information Modeling (BIM) and Geographic Information System (GIS). ISPRS Int. J. Geo-Inf. 2017, 6, 53. [Google Scholar] [CrossRef] [Green Version]
  62. Santos, R.; Costa, A.A.; Grilo, A. Bibliometric analysis and review of Building Information Modelling literature published between 2005 and 2015. Autom. Constr. 2017, 80, 118–136. [Google Scholar] [CrossRef]
  63. Chong, H.-Y.; Lee, C.-Y.; Wang, X. A mixed review of the adoption of Building Information Modelling (BIM) for sustainability. J. Clean. Prod. 2017, 142, 4114–4126. [Google Scholar] [CrossRef] [Green Version]
  64. Lu, Y.; Wu, Z.; Chang, R.; Li, Y. Building Information Modeling (BIM) for green buildings: A critical review and future directions. Autom. Constr. 2017, 83, 134–148. [Google Scholar] [CrossRef]
  65. Eleftheriadis, S.; Mumovic, D.; Greening, P. Life cycle energy efficiency in building structures: A review of current developments and future outlooks based on BIM capabilities. Renew. Sustain. Energy Rev. 2017, 67, 811–825. [Google Scholar] [CrossRef] [Green Version]
  66. Zhou, W.; Qin, H.; Qiu, J.; Fan, H.; Lai, J.; Wang, K.; Wang, L. Building information modelling review with potential applications in tunnel engineering of China. R. Soc. Open Sci. 2017, 4, 170174. [Google Scholar] [CrossRef]
  67. Zhou, Y.; Ding, L.; Rao, Y.; Luo, H.; Medjdoub, B.; Zhong, H. Formulating project-level building information modeling evaluation framework from the perspectives of organizations: A review. Autom. Constr. 2017, 81, 44–55. [Google Scholar] [CrossRef] [Green Version]
  68. Martinez-Aires, M.D.; López-Alonso, M.; Martínez-Rojas, M. Building information modeling and safety management: A systematic review. Saf. Sci. 2018, 101, 11–18. [Google Scholar] [CrossRef]
  69. Saieg, P.; Sotelino, E.D.; Nascimento, D.; Caiado, R.G.G. Interactions of building information modeling, lean and sustainability on the architectural, engineering and construction industry: A systematic review. J. Clean. Prod. 2018, 174, 788–806. [Google Scholar] [CrossRef]
  70. Sanhudo, L.; Ramos, N.M.M.; Martins, J.P.; Almeida, R.M.S.F.; Barreira, E.; Simões, M.L.; Cardoso, V. Building information modeling for energy retrofitting—A review. Renew. Sustain. Energy Rev. 2018, 89, 249–260. [Google Scholar] [CrossRef]
  71. Geetha, N.B.; Velraj, R. Passive cooling methods for energy efficient buildings with and without thermal energy storage—A review. Energy Educ. Sci. Technol. Part A Energy Sci. Res. 2012, 29, 913–946. [Google Scholar]
  72. Yang, L.; Yan, H.; Lam, J.C. Thermal comfort and building energy consumption implications—A review. Appl. Energy 2014, 115, 164–173. [Google Scholar] [CrossRef]
  73. Guillén-Lambea, S.; Soria, B.R.; Marín, J.M. Review of European ventilation strategies to meet the cooling and heating demands of nearly zero energy buildings (nZEB)/Passivhaus. Comparison with the USA. Renew. Sustain. Energy Rev. 2016, 62, 561–574. [Google Scholar] [CrossRef]
  74. Saffari, M.; de Gracia, A.; Ushak, S.; Cabeza, L.F. Passive cooling of buildings with phase change materials using whole-building energy simulation tools: A review. Renew. Sustain. Energy Rev. 2017, 80, 1239–1255. [Google Scholar] [CrossRef] [Green Version]
  75. Johra, H.; Heiselberg, P. Influence of internal thermal mass on the indoor thermal dynamics and integration of phase change materials in furniture for building energy storage: A review. Renew. Sustain. Energy Rev. 2017, 69, 19–32. [Google Scholar] [CrossRef]
  76. Tian, W.; Han, X.; Zuo, W.; Sohn, M.D. Building energy simulation coupled with CFD for indoor environment: A critical review and recent applications. Energy Build. 2018, 165, 184–199. [Google Scholar] [CrossRef]
  77. Pérez-Lombard, L.; Ortiz, J.; Coronel, J.F.; Maestre, I.R. A review of HVAC systems requirements in building energy regulations. Energy Build. 2011, 43, 255–268. [Google Scholar] [CrossRef]
  78. Mirsadeghi, M.; Cóstola, D.; Blocken, B.; Hensen, J.L.M. Review of external convective heat transfer coefficient models in building energy simulation programs: Implementation and uncertainty. Appl. Therm. Eng. 2013, 56, 134–151. [Google Scholar] [CrossRef]
  79. Soares, N.; Costa, J.J.; Gaspar, A.R.; Santos, P. Review of passive PCM latent heat thermal energy storage systems towards buildings’ energy efficiency. Energy Build. 2013, 59, 82–103. [Google Scholar] [CrossRef]
  80. Lizana, J.; Chacartegui, R.; Padura, A.B.; Valverde, J.M. Advances in thermal energy storage materials and their applications towards zero energy buildings: A critical review. Appl. Energy 2017, 203, 219–239. [Google Scholar] [CrossRef]
  81. Marszal, A.J.; Heiselberg, P.; Bourrelle, J.S.; Musall, E.; Voss, K.; Sartori, I.; Napolitano, A. Zero Energy Building—A review of definitions and calculation methodologies. Energy Build. 2011, 43, 971–979. [Google Scholar] [CrossRef]
  82. Li, D.H.; Yang, L.; Lam, J.C. Zero energy buildings and sustainable development implications—A review. Energy 2013, 54, 1–10. [Google Scholar] [CrossRef]
  83. Liu, Z.; Zhang, L.; Gong, G.; Li, H.; Tang, G. Review of solar thermoelectric cooling technologies for use in zero energy buildings. Energy Build. 2015, 102, 207–216. [Google Scholar] [CrossRef]
  84. Chastas, P.; Theodosiou, T.; Bikas, D. Embodied energy in residential buildings-towards the nearly zero energy building: A literature review. Build. Environ. 2016, 105, 267–282. [Google Scholar] [CrossRef]
  85. Kivimaa, P.; Martiskainen, M. Innovation, low energy buildings and intermediaries in Europe: Systematic case study review. Energy Effic. 2017, 11, 31–51. [Google Scholar] [CrossRef]
  86. Ferrara, M.; Monetti, V.; Fabrizio, E. Cost-Optimal Analysis for Nearly Zero Energy Buildings Design and Optimization: A Critical Review. Energies 2018, 11, 1478. [Google Scholar] [CrossRef] [Green Version]
  87. Wang, Y.; Kuckelkorn, J.; Liu, Y. A state of art review on methodologies for control strategies in low energy buildings in the period from 2006 to 2016. Energy Build. 2017, 147, 27–40. [Google Scholar] [CrossRef]
  88. Sartori, I.; Hestnes, A.G. Energy use in the life cycle of conventional and low-energy buildings: A review article. Energy Build. 2007, 39, 249–257. [Google Scholar] [CrossRef]
  89. Heinstein, P.; Ballif, C.; Perret-Aebi, L.-E. Building Integrated Photovoltaics (BIPV): Review, Potentials, Barriers and Myths. Green 2013, 3, 125–156. [Google Scholar] [CrossRef]
  90. Ikkurti, H.P.; Saha, S. A comprehensive techno-economic review of microinverters for Building Integrated Photovoltaics (BIPV). Renew. Sustain. Energy Rev. 2015, 47, 997–1006. [Google Scholar] [CrossRef]
  91. Agathokleous, R.; Kalogirou, S.A. Double skin facades (DSF) and building integrated photovoltaics (BIPV): A review of configurations and heat transfer characteristics. Renew. Energy 2016, 89, 743–756. [Google Scholar] [CrossRef]
  92. Raji, B.; Tenpierik, M.J.; van den Dobbelsteen, A. The impact of greening systems on building energy performance: A literature review. Renew. Sustain. Energy Rev. 2015, 45, 610–623. [Google Scholar] [CrossRef] [Green Version]
  93. Zuo, J.; Pullen, S.; Rameezdeen, R.; Bennetts, H.; Wang, Y.; Mao, G.; Zhou, Z.; Du, H.; Duan, H. Green building evaluation from a life-cycle perspective in Australia: A critical review. Renew. Sustain. Energy Rev. 2017, 70, 358–368. [Google Scholar] [CrossRef]
  94. Yuan, Y.; Yu, X.; Yang, X.; Xiao, Y.; Xiang, B.; Wang, Y. Bionic building energy efficiency and bionic green architecture: A review. Renew. Sustain. Energy Rev. 2017, 74, 771–787. [Google Scholar] [CrossRef]
  95. Del Zendeh, E.; Wu, S.; Lee, A.; Zhou, Y. The impact of occupants’ behaviours on building energy analysis: A research review. Renew. Sustain. Energy Rev. 2017, 80, 1061–1071. [Google Scholar] [CrossRef]
  96. D’Oca, S.; Hong, T.; Langevin, J. The human dimensions of energy use in buildings: A review. Renew. Sustain. Energy Rev. 2018, 81, 731–742. [Google Scholar] [CrossRef] [Green Version]
  97. Hong, T.; Chen, Y.; Belafi, Z.; D’Oca, S. Occupant behavior models: A critical review of implementation and representation approaches in building performance simulation programs. Build. Simul. 2018, 11, 1–14. [Google Scholar] [CrossRef] [Green Version]
  98. Zhang, Y.; Bai, X.; Mills, F.P.; Pezzey, J. Rethinking the role of occupant behavior in building energy performance: A review. Energy Build. 2018, 172, 279–294. [Google Scholar] [CrossRef]
  99. Ralegaonkar, R.; Gupta, R. Review of intelligent building construction: A passive solar architecture approach. Renew. Sustain. Energy Rev. 2010, 14, 2238–2242. [Google Scholar] [CrossRef]
  100. Clements-Croome, D. Sustainable intelligent buildings for people: A review. Intell. Build. Int. 2011, 3, 67–86. [Google Scholar] [CrossRef]
  101. Ahmad, M.W.; Mourshed, M.; Mundow, D.; Sisinni, M.; Rezgui, Y. Building energy metering and environmental monitoring—A state-of-the-art review and directions for future research. Energy Build. 2016, 120, 85–102. [Google Scholar] [CrossRef] [Green Version]
  102. Morán, A.J.; Profaizer, P.; Zapater, M.H.; Valdavida, M.A.; Bribián, I.Z. Information and Communications Technologies (ICTs) for energy efficiency in buildings: Review and analysis of results from EU pilot projects. Energy Build. 2016, 127, 128–137. [Google Scholar] [CrossRef] [Green Version]
  103. Dubois, M.-C.; Blomsterberg, Å. Energy saving potential and strategies for electric lighting in future North European, low energy office buildings: A literature review. Energy Build. 2011, 43, 2572–2582. [Google Scholar] [CrossRef]
  104. Jakica, N. State-of-the-art review of solar design tools and methods for assessing daylighting and solar potential for building-integrated photovoltaics. Renew. Sustain. Energy Rev. 2018, 81, 1296–1328. [Google Scholar] [CrossRef] [Green Version]
  105. Davidavičienė, V. Research Methodology: An Introduction; Springer: Singapore, 2018; pp. 1–23. [Google Scholar]
  106. Espuny, M.; Neto, A.F.; Reis, J.S.D.M.; Neto, S.T.D.S.; Nunhes, T.V.; de Oliveira, O.J. Building new paths for responsible solid waste management. Environ. Monit. Assess. 2021, 193, 1–20. [Google Scholar] [CrossRef] [PubMed]
  107. Scopus—The Database with an Eye on Global Research; Elsevier: Amsterdam, The Netherlands, 2019; Available online: https://www.elsevier.com/__data/assets/pdf_file/0012/81120/Scopus-A4-Poster-HI-RES.pdf (accessed on 15 December 2019).
  108. Cristino, T.M.; Neto, A.F.; Costa, A.F.B. Energy efficiency in buildings: Analysis of scientific literature and identification of data analysis techniques from a bibliometric study. Science 2017, 114, 1275–1326. [Google Scholar] [CrossRef] [Green Version]
  109. Price, D.J.D.S. Little Science, Big Science; Columbia University Press: New York, NY, USA, 1963. [Google Scholar]
  110. Gilbert, R.O. Statistical Methods for Environmental Pollution Monitoring, 1st ed.; John Wiley & Sons: Hoboken, NJ, USA, 1987. [Google Scholar]
  111. Sun, Y.; Latora, V. The evolution of knowledge within and across fields in modern physics. Sci. Rep. 2020, 10, 1–9. [Google Scholar] [CrossRef]
  112. Robinson, J. A software system for laboratory experiments in image processing. IEEE Trans. Educ. 2000, 43, 455–459. [Google Scholar] [CrossRef] [Green Version]
  113. Dabi, Y.; Darrigues, L.; Katsahian, S.; Azoulay, D.; De Antonio, M.; Lazzati, A. Publication Trends in Bariatric Surgery: A Bibliometric Study. Obes. Surg. 2016, 26, 2691–2699. [Google Scholar] [CrossRef] [Green Version]
  114. Rasure, J.; Argiro, D.; Sauer, T.; Williams, C. Visual language and software development environment for image processing. Int. J. Imaging Syst. Technol. 1990, 2, 183–199. [Google Scholar] [CrossRef]
  115. Cristino, T.; Lotufo, F.; Delinchant, B.; Wurtz, F.; Neto, A.F. A comprehensive review of obstacles and drivers to building energy-saving technologies and their association with research themes, types of buildings, and geographic regions. Renew. Sustain. Energy Rev. 2021, 135, 110191. [Google Scholar] [CrossRef]
  116. Cristino, T.; Neto, A.F.; Wurtz, F.; Delinchant, B. Barriers to the adoption of energy-efficient technologies in the building sector: A survey of Brazil. Energy Build. 2021, 252, 111452. [Google Scholar] [CrossRef]
  117. Lobato, C.G.; Cristino, T.M.; Neto, A.F.; Costa, A.F.B. Lean System: Analysis of scientific literature and identification of barriers for implementation from a bibliometric study. Gestão Produção 2021, 28, 4769. [Google Scholar] [CrossRef]
  118. Johnson, R.A.; Wichern, D.W. Applied Multivariate Statistical Analysis, 6th ed.; Pearson Education: New Jersey, NJ, USA, 2007. [Google Scholar]
  119. Manly, B.F.J.; Navarro-Alberto, J.A. Multivariate Statistical Methods: A Primer, 4th ed.; CRC Press: Boca Raton, FL, USA, 2016. [Google Scholar]
Figure 1. Procedural flow diagram (source: authors).
Energies 15 00691 g001
Figure 2. Word Cloud used to build the search terms (source: authors).
Energies 15 00691 g002
Figure 3. Fragment of the query applied in the search on SCOPUS database (source: authors).
Energies 15 00691 g003
Figure 4. Frequency distribution of publications addressing Building Energy Efficiency. (a) Discrete, (b) cumulative (source: authors).
Energies 15 00691 g004
Figure 5. Keywords category (theme) and their number of members (source: authors).
Energies 15 00691 g005
Figure 6. Years grouped according to the profile of themes (source: authors).
Energies 15 00691 g006
Figure 7. Column profile from each period (source: authors).
Energies 15 00691 g007
Figure 8. Model of the interrelationship between themes (source: authors).
Energies 15 00691 g008
Figure 9. λ i j for each period (source: authors).
Energies 15 00691 g009
Figure 10. Evolution of the themes and relationship between them in each period (source: authors).
Energies 15 00691 g010
Table 1. Articles and their keywords.
Metadata Identification Keyword 1 Keyword 2 Keyword 3
a 1 [authors; …; year] k w 1 1 k w 1 2 k w 1 n 1
a i [authors; …; year] k w i 1 k w i 2 k w i n i
a 2000 [authors; …; year] k w 2000 1 k w 2000 2 k w 2000 n 2000
a i = article; k w i j = jth keyword extracted from the ith article.
Table 2. Keywords classified into 30 themes.
Theme 1 Theme 2 Theme 3
k w 1 1 k w 1 j k w 1 30
k w k 1 2 k w k 2 j k w k n 30
Table 3. Themes addressed by each article.
Article Theme 1 Theme 2 Theme 3
a 1 [authors; …; year]X - X
a i [authors; …; year]- X X
a 2000 [authors; …; year]X - X
Table 4. Annual participation of the themes, followed by their trends.
Theme200020012002200320042005...2015201620172018Annual ParticipationTrend (α = 5%)
BEV0%9%0%0%6%0%-3%2%2%3% Energies 15 00691 i001
SMB8%0%14%0%6%5%-6%6%4%8% Energies 15 00691 i002
TOB8%0%14%6%6%5%-5%9%7%4% Energies 15 00691 i003
BMS8%0%10%0%0%0%-0%1%2%2% Energies 15 00691 i004
BAC0%0%10%0%6%0%-7%6%4%7% Energies 15 00691 i005
... ...
BIM8%0%10%6%0%0%-15%12%18%12% Energies 15 00691 i006
OCB8%0%0%0%0%0%-5%4%11%5% Energies 15 00691 i007
BRF0%0%5%0%0%5%-7%6%9%7% Energies 15 00691 i008
ZEB0%0%5%0%0%5%-9%6%9%13% Energies 15 00691 i009
Table 5. The total number of articles dealing with each theme.
ThemesN%Interdisciplinarity
BEMBuilding energy modelling50525.330
DATData analysis techniques33716.927
BIMBuilding information modelling24412.222
HVACHeating-ventilation-air-conditioning1598.030
ENVEnvironmental1577.927
GRBGreen building1447.227
TOBTypes of buildings1306.527
ZEBZero energy building1286.428
SMBSmart buildings1216.126
THCThermal comfort1216.128
REGRegulations1175.926
SUSSustainability1145.723
BRFBuilding retrofitting1055.326
OCBOccupant behaviour1035.226
BACBuilding automation and control995.026
LCALife cycle assessment894.524
SEMEnergy management systems874.425
BIPBuilding integrated photovoltaics834.223
SMGSmart grids814.123
EPSEnergy performance software753.823
BEVBuilding envelope522.625
WINWindows522.617
LIGLighting522.624
DMKDecision making492.527
RNERenewable energy sources482.426
BMSBuilding management systems361.822
THSThermal storage251.314
ESTEnergy storage241.217
HPSHeat pumping systems170.912
WTHWater heating120.610
Table 6. The annual relative frequency of articles that address each of the thirty themes.
Theme2000200120022003200420052006200720082009201020112012201320142015201620172018Annual ParticipationTrend (α = 5%)
BEV0%9%0%0%6%0%2%0%6%2%4%2%4%2%2%3%2%2%3% Energies 15 00691 i010
SMB8%0%14%0%6%5%8%7%8%7%9%4%6%6%6%6%6%4%8% Energies 15 00691 i011
TOB8%0%14%6%6%5%0%7%10%4%9%7%6%6%7%5%9%7%4% Energies 15 00691 i012
BMS8%0%10%0%0%0%2%2%2%2%0%1%3%2%3%0%1%2%2% Energies 15 00691 i013
BAC0%0%10%0%6%0%0%5%0%1%6%4%4%6%6%7%6%4%7% Energies 15 00691 i014
EMS0%0%10%0%0%0%0%2%0%1%1%3%3%5%4%5%7%6%5% Energies 15 00691 i015
GRB8%0%0%19%0%15%2%15%14%6%7%10%6%7%7%10%6%5%5% Energies 15 00691 i016
HVAC0%0%14%19%6%5%12%15%18%12%4%11%9%5%6%7%8%7%7% Energies 15 00691 i017
WIN0%0%5%6%0%0%4%2%0%2%1%4%1%3%4%4%2%2%2% Energies 15 00691 i018
RNE0%0%0%6%0%0%0%0%2%0%0%2%3%4%2%3%4%1%5% Energies 15 00691 i019
DMK0%0%0%0%6%0%4%0%5%1%4%1%3%2%4%2%3%1%3% Energies 15 00691 i020
DAT0%0%0%6%12%25%6%10%8%11%19%14%19%17%19%19%20%18%20% Energies 15 00691 i021
SUS0%0%0%0%0%15%10%12%4%6%13%5%8%9%2%4%6%6%2% Energies 15 00691 i022
LCA0%0%5%6%0%10%8%7%4%1%4%7%3%5%3%3%5%7%5% Energies 15 00691 i023
EST0%0%0%0%0%5%2%2%0%0%0%2%1%3%0%1%2%1%2% Energies 15 00691 i024
LIG0%0%0%0%0%5%8%5%4%1%1%3%2%3%3%4%3%2%1% Energies 15 00691 i025
THC8%0%0%13%0%5%4%17%12%10%3%2%7%5%5%9%5%6%6% Energies 15 00691 i026
BIP0%0%5%0%6%0%4%7%6%7%1%5%2%5%3%5%4%3%7% Energies 15 00691 i027
WTH0%0%0%0%0%0%2%0%2%0%0%0%0%0%1%1%1%0%1% Energies 15 00691 i028
REG8%0%0%0%12%10%2%10%6%13%9%8%9%7%5%4%5%3%4% Energies 15 00691 i029
ENV8%0%5%0%6%10%8%5%12%12%10%8%5%9%7%9%8%8%5% Energies 15 00691 i030
EPS0%0%0%0%0%0%0%0%2%2%3%8%3%3%4%5%4%4%8% Energies 15 00691 i031
HPS0%0%0%0%0%0%0%0%0%1%1%0%1%2%0%1%1%1%2% Energies 15 00691 i032
THS0%0%0%0%0%0%0%0%0%0%0%0%1%3%1%2%2%2%2% Energies 15 00691 i033
BEM8%0%24%6%0%20%17%22%25%23%14%27%28%22%28%25%30%27%29% Energies 15 00691 i034
SMG0%0%0%0%0%0%0%0%2%5%0%2%5%3%6%3%7%3%6% Energies 15 00691 i035
BIM8%0%10%6%0%0%2%5%8%8%13%8%10%13%15%15%12%18%12% Energies 15 00691 i036
OCB8%0%0%0%0%0%6%5%0%2%1%7%5%4%6%5%4%11%5% Energies 15 00691 i037
BRF0%0%5%0%0%5%0%0%2%1%1%2%6%5%6%7%6%9%7% Energies 15 00691 i038
ZEB0%0%5%0%0%5%0%0%2%5%3%3%7%6%6%9%6%9%13% Energies 15 00691 i039
Publisher’s Note: MDPI stays neutral with regard to jurisdictional claims in published maps and institutional affiliations.

