Abstract
A 60-cell photovoltaic (PV) module was analyzed by optimizing the interconnection parameters of the solar cells to enhance the efficiency and increase the power of the PV module setup. The cell-to-module (CTM) losses and gains varied substantially during the various simulation iterations. Optimization was performed to inspect and augment the gain and loss parameters for the 60-cell PV module. The power and efficiency of the module were improved by refining several parameters, such as number of busbars, size of the contact pads, interconnected ribbon width, thickness of the core, and distance between the solar cells and strings, to obtain the maximum efficiency of 21.09%; the CTM efficiency achieved was 94.19% for the proposed strategy related to the common interconnection setup of the ribbon-based system. The CTM efficiency was improved by optimizing the geometrical, optical, and electrical parameters precisely, the power enhancement was up to 325.3 W, and a CTM power of 99.1% was achieved from a standard PV module with rectangular ribbon interconnections.
1. Introduction
The integration of solar cells into photovoltaic (PV) modules increases the efficiency and power, thereby enhancing the overall output of the system. Specific variations in solar cells are caused by geometrical, optical, and electrical impacts and generally enhance the power of the module relative to the total initial power of the solar cells [1,2,3]. The cell-to-module (CTMpower) ratio is the ratio of the overall initial power of the solar cells to the power following interconnection and module assimilation. The specific CTMs influence each other and enhance the PV module.
Such upgradation is necessary for improving the implementation of PV modules and preventing unnecessary failures resulting from the adverse arrangement of the module parts, such as the encapsulation material, interconnector ribbons, or cover materials. The electrical interconnection of the cell for conventional manufacturing modules used in industry depends on the ribbons that link the front-side connection of a single cell with the rear-side connection of the following cell. The concept of interconnection helps to optimize the ribbons of the cells and precisely attach the solar-cell stripes, as shown in Figure 1. Owing to this action, the process of interconnection of ribbons and strings is altered. When the spacing area of the cells is optimized, the efficiency of the module improves, increasing the proportion of the effective cell region inside the PV module, which increases the output [4,5,6].
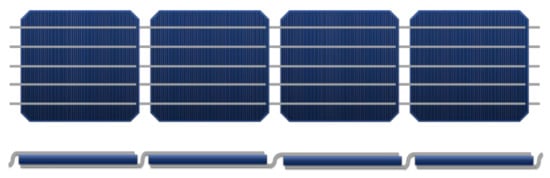
Figure 1.
Cell busbars interconnection based on ribbons.
Simulation provides an integrated approach for evaluating the PV module efficiency and power according to the CTM ratio [7]. Simulations for traditional cell interconnections have indicated that the efficiency and power of PV modules with 60 solar cells fluctuate because the process of interconnection reduces the effective area of the cell owing to in-creases in the number of cell busbars and the width of the finger. For traditional PV modules, the module area is always larger than the total cell area. For a 60-cell PV module, the preliminary area of the cell can exceed the total area of the module. A comprehensive paradigm for the computation of the efficiencies and power was simulated using the following properties of the available materials, specific setup of the module, and CTM gain. The loss factors were also analyzed for the 60-cell module. The software package SmartCalc.CTM was used for the optimized calculation of the CTM efficiency and power. This software is incorporated by Fraunhofer ISE [8] and is the latest tool for adaptable, accurate, and comprehensible computation [9,10].
1.1. Conventional Design for Cell-to-Module Ratio Calculation
In the current simulation, a model is categorized for the CTM factors of the cells and fits it with the original loss structures, including the different layers and components of the module that has been exhibited [7,11,12]. By using Equations (1) and (2), we obtain the design and computing of the module efficiency and power from the CTM k-factors (cell-to-module relative loss and gain factors [7,13]) and the total of the preliminary solar cell power.
1.2. CTM Definition
CTM ratio is the ratio of the module power to the sum of the power of all cells. CTM power can be calculate using Equation (3). The introduction of optical loss structures, such as the encapsulation of solar cells in a PV module, is shown in Figure 2. Generally, the sum of the individual cell powers exceeds the total module output power. The variations in power with different factors are described as CTM losses. Such losses usually occur because of layer reflection, e.g., glass–air, encapsulant–glass, and solar cell–encapsulant, as well as the front-glass absorption and encapsulant material, as shown in Figure 3 [4,6].
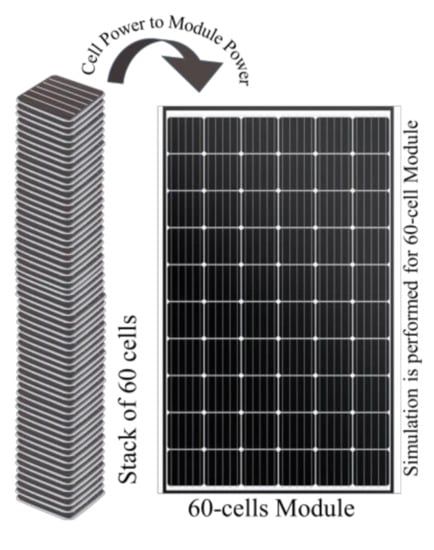
Figure 2.
Cell-to-module definition.
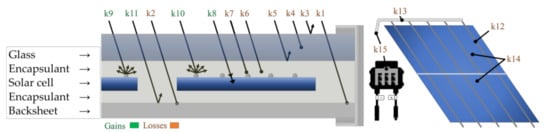
Figure 3.
Determination of k factors for geometrical, optical, and electrical gain and loss.
2. CTM Simulation Gain and Loss Mechanisms
CTM simulation involves a systematic analysis of the loss and gain mechanisms in a PV module with various k-factors, as shown in Figure 3 [13]. There are four categories of losses and gains that affect the module efficiency and power, as shown in Table 1: geometrical losses, optical losses, optical gains, and electrical losses. Therefore, a current simulation was performed to maximize the output efficiency and power by optimizing the electrical, mechanical, and optical parameters of the 60-cell module, as shown in Figure 3 and Figure 4 [14,15,16].

Table 1.
Diverse gain and loss factors of SmartCalc. CTM; loss and gain factors are presented in orange and green, respectively [13,16].
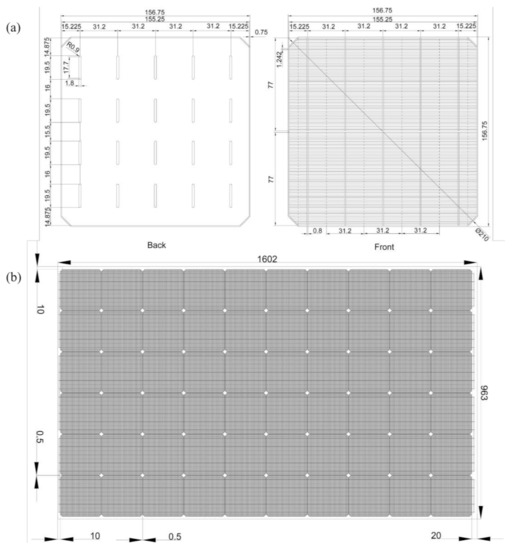
Figure 4.
Dimensions design parameters of (a) solar cell and (b) solar PV module (unit: mm).
The current simulation design is used to describe the CTM ratio for the 60-cell module to optimize its efficiency and power and to review the important elements. Encapsulation introduces optical gains. The encapsulant refractive index is larger than that of air, which causes a considerable drop in reflection from the front side of the surface [17,18]. This provides the advantage of direct optical coupling. Moreover, owing to the scattering of light, there can be further CTM increments in which light hits the backsheet between the margin spaces of the cells. Once the scattered angle of light exceeds the total internal reflection angle of the interface between the air and glass, it is transmitted back to the cells, where it can be immersed. Consequently, CTM losses can be minimized by selecting appropriate module materials while designing the module and considering the optics. Using a low-absorption ethylene-vinyl acetate (EVA) sheet, the transmittance of EVA can be maximized at shorter wavelengths by replacing standard EVA with downshifting EVA. Downshifting EVA supplies ultraviolet (UV) absorbers in EVA with molecules of down-shifting luminescence, which have comparatively greater absorption in the UV region of the solar spectrum, but consequently emit light at the minimum energy that can be employed by solar cells, which is why it is known as downshifting. Alternatively, low-absorption and high-transmittance EVA has higher transparency to UV light, which vali-dates the larger amount of light attained by the solar cell.
Introducing a backsheet with high reflectivity, which increases the optical gain, can provide enhancements compared with a standard backsheet. However, highly reflective backsheets are used to reduce the CTM loss in certain situations, for aesthetic purposes. This method allows the capture of light that usually does not encroach on the solar cell, thereby increasing the CTM gain. The ribbons used for the electrical interconnection of the solar cells are impenetrable and subsequently minimize the absorption in the solar cell. Nevertheless, the method can improve the light intensity immersed in the PV module by utilizing ribbons that have light-trapping characteristics or those that have films with light-trapping features. Each type of ribbon is inclined for light reflection, at an angle exceeding the total internal reflection angle in the glass–air interaction. The reflected light is redirected back to the solar cells, providing another opportunity for absorption. Such a method is not accessible when calculating a solar cell parameter in open air, which can ensure a gain in CTM performance [14,19,20,21,22,23,24].
CTM Gain and Loss Factors for 60-Cell Module
The losses caused by the margins of the quiescent module and the spacing areas of the cell and string are denoted as factors k1 and k2, respectively. These factors are considered geometrical losses for dormant areas of the module that do not participate in enhancing the power of the module, but can affect the module efficiency. The efficiency of the module depends on its inactive area, which comprises the cell spacing and module margin. The spacing between the cells is defined as the distance between various strings and the space between cells in a string. Hädrich [7] described this factor in detail. Adjustments in the factor k2, which represents the cell spacing, result from neglecting the spaces among the string cells. The string spacing was also optimized. The factor k2 illustrates the geometrical intersection and can be described as the area of the module, which can be minimized by optimizing the space between cells. The cell spacing includes not only the originally passive area of the cell for connection, but also certain active cell areas. The loss in power with such a cell is represented by k7, i.e., the interconnection shading. In such a situation, the amalgamated geometrical factor k2 miscalculates the efficiency improvement. The adjustment in the cell spacing influences the advantages of the reflection on the rear cover of the module, which is represented by k11. The factors k3, k4, k5, and k6 define the optical performance, such as the assimilation and contemplation of the encapsulation bulk, and marginally improve the 60-cell module. Variations occurred in the simulation when shading was performed by connecting the components of the cells (represented by the factor k7). The shading was due to the interconnection of the ribbons. The string of solar cells should be interconnected within a module in 6 columns and 10 rows, with a total of 60 cells per string. Therefore, the shading impacts include the string connector ribbons in k7. The factor k8 refers to the coupling of the encapsulant with the cell, and k9 refers to the coupling with the finger, which is unaffected by additional improvements to the module. After encapsulation, these factors resulted in gains from the optical coupling of the solar cell. Interconnector ribbons also cause gains due to reflection. The reflection of light from the interconnector ribbons in the active cell area causes interconnector coupling, and the corresponding factor is k10. From the back covering of the module, the factor k11 determines the gains due to reflection, usually from the backsheet. Although a substantial portion of the backsheet section is observable in the modules, this factor is modified to be related to traditional modules. The calculations from the simulation are presented utilizing the complete dimensions of 156.75 × 156.75 mm2 for the solar cells with a pseudo-square diameter of 210 mm, which appears to be an effective cell limit for a traditional module system. Such an approach can be utilized to correct the reflection gain from the back cover for pseudo-square cells or modules through various strings and cell spaces. The factor k12 corresponds to the cell-interconnection electrical loss. Ohmic losses in ribbons occur in small portions, although the cells can be interconnected using an electrically conductive adhesive (ECA). The contact resistances of the ECA and bulk resistance { were considered. The interconnection ECA and electrical resistance R are given by Equation (4):
The current and electrical resistance of the cell string can be used to calculate the power loss of each solar cell. The total proportion of the power loss and the power of the cell subtracted by unity was considered as the loss factor k12. The current in a traditional module, which introduces a series cell and string interconnection, is created, and can be utilized for all cells. Subsequently, the electrical properties of the cells and strings might diverge; furthermore, string currents that are interconnected with every cell must be used, and losses should be evaluated individually. Electrical loss occurs in the interconnection of the cell string, which is described by the factor k13. The effects of alterations in the electrical properties of the strings and cells are discussed in terms of the electrical mismatch factor k14. Sets of cells include the characteristics of electrical variations that have the advantage of electrical incompatibility. Module cells are generally divided according to the differences in the electrical properties of the solar cells, which may affect the splitting of heterogeneous standard cells. When such cells are attached to electric interconnections, a mismatch occurs between the cells. Deficiencies in the cabling and junction boxes of the module were measured using the factor k15. However, the significance of the probable difference in the number of bypass diodes and junction boxes is caused by a distinct string design in the modules [13,15,16,24,25,26,27].
3. Modelling of the Solar Cell
The solar cell grid pattern was simulated using the PV Lighthouse grid calculation tool [28]. The input and output parameters are presented in Table 2 and Figure 4. The software provided the option of computing the series resistance, optical shading, metal contacts of the solar cell, and cost of the materials utilized in the cell fabrication. There was an option in the calculator tool to select and design the geometry of the solar cells, and set their resistivity, along with the cost of the metal volume utilized in the grid and the cell dimensions. The current tool subsequently determined the surface area, volume, series resistance, shading, and cost of the metal employed to fabricate grids on the solar cells [28,29,30]. This modeling of the solar cell was utilized to generate the new material file for the CTM simulation.
Table 2.
Grid simulation parameters inputs and outputs.
4. CTM Simulation Input Parameter Setup
According to experimental measurements or datasheets, the parameters used to input the data for CTM analysis were determined from the industrially accessible materials of the modules. Multiple input parameters must be adjusted according to the module configuration for the maximum output. Therefore, it is feasible to optimize the input parameters for the maximum efficiency and power output [16].
Input Parameters of Simulation for Highest Efficiency and Power of Module
The module that was analyzed for the simulation comprised 3.2-mm-thick low-iron tempered glass with an antireflective (AR) coating. A 0.45-mm-thick encapsulant layer was used on the top and rear sides, with the polyolefin elastomer (POE) standard UV cutoff feature and a white polyamide backsheet. For the 60-cell module, it is expected that the cell interconnection was 1 mm wide and 0.3 mm thick, with a 20-μm-thick coating and a specific resistance of 0.018 Ωmm2/m. The monocrystalline cells with sizes of 156.75 × 156.75 mm2 had a pseudo-square diameter of 210 mm and an efficiency of 22.4% (5.74 W, Pmpp), as shown in Table 2 and Table 3. Five continuous busbars were selected that had H-pattern fingers (width of 0.8 mm) with metallization on the front surface of the cell and four contact pads (thickness of 1.8 mm and length of 19.5 mm per row) on the rear side. The module layout parameters were set as follows: 10 cells per string and six strings per module; string and cell distances of 0.5 mm; a margin of 20 mm at the top; and bottom and side margins of 10 mm. The cell strings were interconnected with a rectangular 6-mm-wide and 0.3-mm-thick ribbon with a 20-μm-thick coating and serial connection [6,13,15,16,27,31].
Table 3.
Simulation input parameters for the optimized efficiency and power of the module [1,2,3,4,6,7,10,11,13,14,17,18,19,20,21,22,24,25,26,27,31,32,33].
5. CTM Optimization
The simulation was performed using a conventional PV module that was commercially available. Therefore, a new database material file was created for a 5.74-W, 22.4%-efficiency P-type PERC (passivated emitter and rear cell) monocrystalline solar cell, and the PV module was optimized to obtain the highest efficiency and power by using the standard PV module for comparison. The spectral response of the selected cell and an overall CTM comparison of the optimized efficiency are presented in Figure 5, as well as the elevated power at the same scale, but at different simulation iterations. As shown in the figure, it is feasible to obtain the highest efficiency and power under equivalent parameter situations. Therefore, it is important to consider equivalent cell factors or parameters to simultaneously achieve the highest power or highest efficiency. The overall enhancement relative to the CTM efficiency and power was analyzed using a CTM graphs. The highest power (325.3 W) and highest efficiency (21.09%) were achieved by optimizing the PV module parameters. Thus, the highest CTM power (99.1%) and the highest CTM efficiency (94.19%) were obtained from simulation iterations by optimizing the cell parameters, which are presented in Table 3. Hence, the well-organized solar cell designing parameters that were optimized are shown in upcoming figures for power and efficiency optimization individually. These are the parameters that were changed at every iteration of the CTM simulation and then selected the optimized paraments for highest efficiency and power of the 60-cell module.
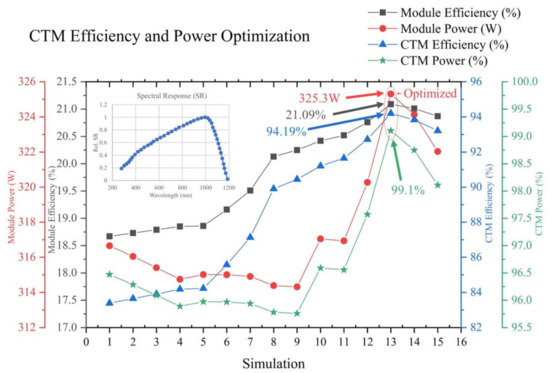
Figure 5.
Overall CTM comparison of the optimized efficiency and power at different simulation iterations and cell spectral responses.
5.1. CTM Efficiency Optimization
According to the simulation results, a CTM efficiency assessment was conducted for a standard module comprising 15 distinct gain and loss components. For a standard 60-cell module, the cell efficiency decreased from 22.39% to 18.67%, i.e., a CTM loss of 16.61% from the original efficiency. The total loss (from all loss k-factors) was −5.02%, and the total gain (from all gain k-factors) was +1.31%. The CTM efficiency before optimization was only 83.39% of the standard PV module.
Figure 6 shows the results of the optimized CTM efficiency evaluation for a standard module considering 15 distinct gain and loss factors. For an optimized 60-cell module, the cell efficiency was reduced from 22.39% to 21.09%, i.e., a 5.81% CTM loss only from the original efficiency for the optimized module. The total loss was −2.92%, which was 2.1% lower than that of the standard module, and the total gain was +1.82%, which was 0.51% higher than that of the standard module. However, the overall efficacy was 2.42% higher than that of the standard module. The CTM efficiency after optimization was 94.19%, which was 10.8% higher than that of the standard module.
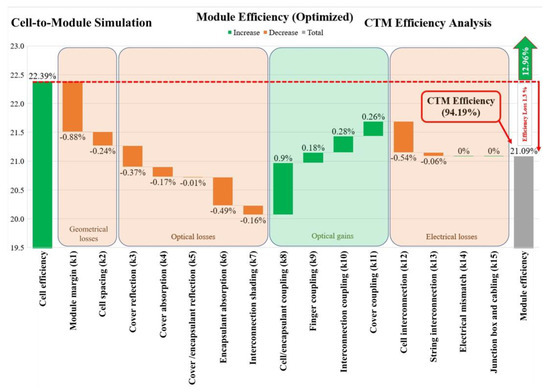
Figure 6.
CTM simulation to analyze the CTM efficiency for an optimized PV module.
5.2. CTM Power Optimization
According to the simulation results, a CTM power evaluation was conducted for a standard module by examining 13 factors related to the power gain and loss. For a standard 60-cell module, the cell power was reduced from 328.24 to 316.66 W, i.e., a 11.58 W loss from the original power only. The total loss was −33.53 W, and the total gain was only +21.95 W. The CTM power before optimization was only 96.47%.
Figure 7 shows the result of the optimized CTM power evaluation for an optimized module based on the analysis of 13 gain and loss factors. For an optimized 60-cell module, the cell power was reduced from 328.24 to 325.3 W, i.e., a loss of only 2.94 W from the original power. The total loss was only −27.92 W, which was 5.61 W lower than that of the standard module, and the total gain was +24.98 W, which was 3.03 W higher than that of the standard module. However, the overall power was 8.64 W higher than that of the standard module. The CTM efficiency after optimization was 99.1%, which was 2.63% higher than that of the standard module.
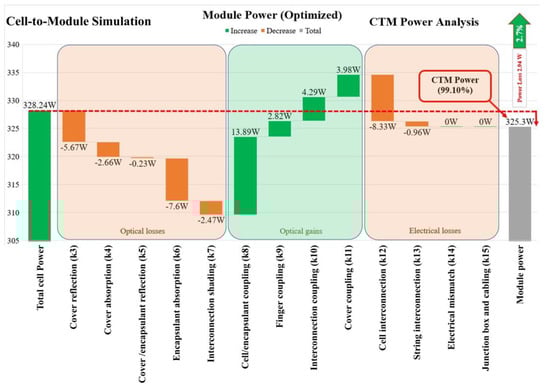
Figure 7.
CTM simulation to analyze the CTM power for an optimized PV module.
5.3. CTM Efficiency Comparison of Optimized and Standard Modules
A comparison was performed between the standard PV module and PV modules with different optimized k-factors, which were improved to maximize the efficiency of the PV module, as shown in Figure 8. A total of six k-factors were improved by optimizing the cell parameters to increase the final output efficiency, as shown in Figure 8, and the other k-factors were not affected. The first factor was k1, i.e., the “module margin” loss factor, which was improved from −2.5% to −0.88% (by 1.62%). The second improved loss factor was k2, which corresponded to the “cell spacing”; this factor was enhanced from −0.54% to −0.24% (by 0.3%). The third amelioration parameter k7, which corresponded to the interconnection shading, was improved from −0.51% to −0.15% (by 0.35%). The “cell/encapsulant coupling” optical gain factor (k8) was improved from 0.38% to 0.9% (by 0.52%). The “finger coupling” factor (k9) was improved from 0.17% to 0.18% (by 0.01%). The “cell interconnection” (k12) factor was improved from −0.59% to −0.54% (by 0.05%). Overall, the efficiency of the standard module was increased from 18.67% to 21.09% (by 2.42%) by improving the aforementioned parameters.
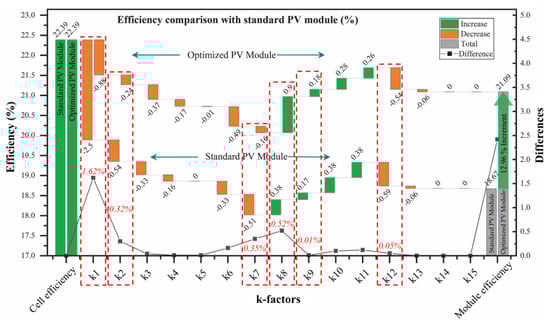
Figure 8.
Efficiency comparison of loss and gain k-factors with optimized parameters by the standard PV module.
5.4. CTM Power Comparison of Optimized and Standard Modules
A comparison between the standard PV module and PV modules with different optimized k-factors that affected the power of the PV module is shown in Figure 9. A total of three k-factors were improved by optimizing the cell parameters, which increased the final output power, as shown in Figure 9. The other k-factors were not affected. The first factor was the loss factor k7 (interconnection shading); this factor was improved from −8.66 to −2.47 W (by 6.19 W). The second improved factor was k8 (“cell/encapsulant coupling”), which was enhanced from 6.38 to 13.89 W (by 7.51 W). The third amelioration parameter was the “cell interconnection” loss factor k12, which was improved from −9.99 to −8.33 W (by 1.66 W). Overall, the power of the standard module was increased from 316.66 to 325.3 W (by 8.64 W) by improving the aforementioned parameters.
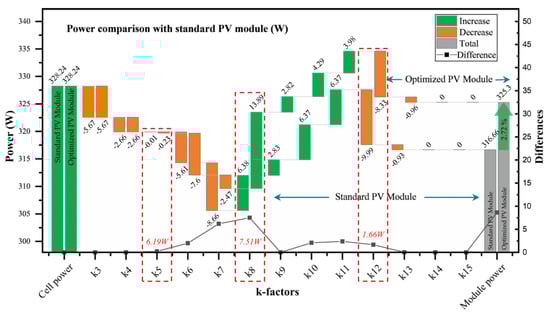
Figure 9.
Power comparison of loss and gain k-factors with optimized parameters by the standard PV module.
5.5. Solar Cell Parameter Optimization for Efficiency Enhancement
The solar cell parameters were adjusted to enhance the PV module efficiency. The standard 5-busbar solar cell has an efficiency of 18.67% [14]. When the cell and string distance decreased by up to 1.5 mm, the efficiency improved by up to 0.06%, and the module efficiency was 18.73%. The efficiency of the module was increased by 0.06% again (reaching 18.79%) by setting the top margins of the solar module to 50 mm, the side margins to 40 mm, and the bottom margins to 30 mm. Furthermore, a 0.06% improvement in efficiency was obtained by setting the cell and string distance up to 1 mm compared with the module efficiency of 18.85%. The width of the core was set to 1 mm, resulting in an efficiency improvement to 18.86%. An efficiency of 19.16% (improvement of 0.3%) was achieved by adjusting the distance between the cell and the string to 0.5 mm. When Cu-EPT1 SnPb was used for the string connection with dimensions of 1.2 mm × 0.15 mm, the efficiency was improved to 19.51%. When the top, bottom, and side margins were set to 20, 10, and 10 mm, respectively, a further improvement of 0.62% was obtained, and the module efficiency was 20.13%. A 0.12% enhancement in the efficiency of the module was obtained by setting the thickness of the coating to 20 µm on the connecting ribbon; when the size of the pad was set to 32.4 mm2, an efficiency of up to 20.42% achieved (improvement of 0.17%). A 0.1% increase in the efficiency (to 20.52%) was obtained when a POE encapsulant was included in the PV module. When white polyethylene terephthalate (PET) was used, the efficiency increased to 20.87% (by 0.11% compared with the previous setting), and when a PET-PET-EVA (PPE) white backsheet was used, the efficiency increased to 21.01% (by 0.14%). Finally, setting the busbar width to 0.8 mm yielded the largest efficiency improvement (0.08%) from the previous iteration of the PV module simulation as compared to solar cell parameter optimization up to 21.09%, as shown in Figure 10.
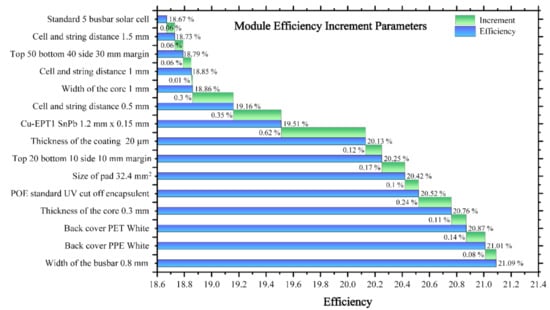
Figure 10.
Efficiency improvement of the module through solar cell parameter optimization.
5.6. Solar Cell Parameter Optimization for Power Improvement
The solar cell parameters were adjusted to enhance the PV module power. The standard 5-busbar solar cell had a module power of 314.32 W. When the coating thickness of the connecting ribbons was set to 20 µm, the power improved by 0.07 W, and the module power output became 314.39 W. The power of the module increased by 0.36 W (to 314.75 W) when the cell and string distance was set to 1.5 mm. A further 0.16-W improvement in the power (to 314.91 W) was obtained by setting the cell-interconnection data as Cu-EPT1 SnPb 1.2 mm × 0.15 mm. When the cell and string distance was set to 1 mm, the power output improved to 315.01 W. Adjusting the width of the core to 1 mm improved the power output to 315.02 W. When the top, bottom, and side margins were set to 50, 40, and 30 mm, respectively, the power was improved by 0.39 W (to 315.41 W). When the cell and string distance was set to 0.5 mm, the power was improved by 0.64 W (to 316.05 W). When the thickness of the ribbon core was set to 0.3 mm, the power was improved by 0.28 W (to 316.94 W). A further 0.11-W increase (to 317.05 W) was obtained by setting the size of the pad at the back side of the cell to 32.4 mm2. The largest improvement in the module power was 3.22 W, which caused an upsurge of the module power up to 320.27 W. A further 1.76-W enhancement (to 322.03 W) was obtained by using white PET for the back cover. When the width of the pads was set to 1.8 mm, the output power was improved by 2.1 W (to 324.13 W). The highest power was achieved by setting the width of the busbar to 0.8 mm; in this case, the module power was improved to 325.3 W (by 1.17 W). The current ultimate output is the highest power refinement for the module simulation of the optimized CTM power as compared to the standard solar cell, as shown in Figure 11.
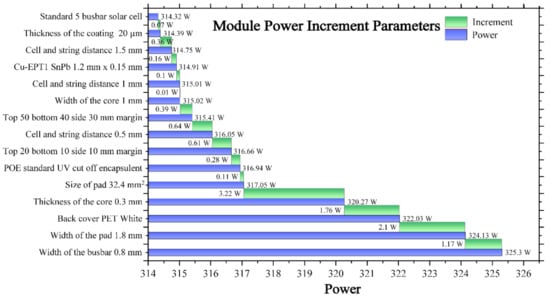
Figure 11.
Power improvement of the module through solar cell parameter optimization.
5.7. Current Practices and Methodology Adopted for Designing Solar PV Modules in Manufacturing Industry and Future Trends
The PV technology industry requires the delivery of products for power production that can compete with both renewable and traditional energy sources. The PV roadmap for international technology can assist in distinguishing developments and identifying constraints for several essential enhancements. The objectives of the PV roadmap (ITRPV) are to apprise industries and consumers of expected technological developments in crystalline silicon (c-Si)-supported PV manufacturing and to encourage consultations on necessary advancements and specifications. The current roadmap aims not only to identify comprehensive practical outcomes for recognized extents that need to progress, but also to accentuate the PV communal requirement for enhancement, to articulate necessities to fulfil, and to inspire in this manner the progress of inclusive results. The current practices and methodology adopted for designing solar PV modules in the manufacturing industry were cooperatively organized by various global poly-Si manufacturers, wafer traders, c-Si solar cell creators, module constructers, PV apparatus providers, and material manufacturing suppliers, as well as PV investigation organizations and professionals. The current research includes the complete value of c-Si PV production from the cell to the PV module fabrication system. Substantial factors were assessed, including various concepts regarding the development of technologies in the PV industry [34,35].
A thickness of >3 mm for the front glass is still used in the majority of PV module production processes in industry, and it is predicted that a thickness reduction of approximately 2 mm will occur over the next decade. The front glass thickness of <2 mm is anticipated to arrive on the market in 2023, along with the minimum market sector. The purpose of AR coverings is to enhance the transfer of light from the visible front glass. Glass with AR coatings will remain the major facade covering part for c-Si PV modules in the prospective, with a market share of approximately 95%. Specific coatings, e.g., antiglare, anti-soiling, structuring, and color coatings, in addition to uncoated glass, are intended to maintain a modest market share of approximately 1–3% [35].
The technology of cell interconnection and ribbons with copper are among the most widely used materials, but wire interconnection with copper has a rapidly growing market share and is expected to be the dominant interconnection technology in 2023 and beyond.
Corresponding to interconnection technologies and structured layer will also achieve a market share of approximately 10% in the next 10 years, and near approximately 6%, correspondingly. Technologies without Cu-type ribbons will emerge in 2025 as a recession [35].
It is essential to mention that the present and impending interconnection technologies will require reliability with larger and thinner cells that will eventually be employed. In this regard, methods utilizing minimum-temperature conductive adhesives or connections based on Cu wire systems have an essential benefit because of the smaller thermal effects related to other technologies. The reductions in cell thickness are no longer restricted by the technologies of the PV module, and there are no large restrictions, as shown in Figure 12 and Figure 13.
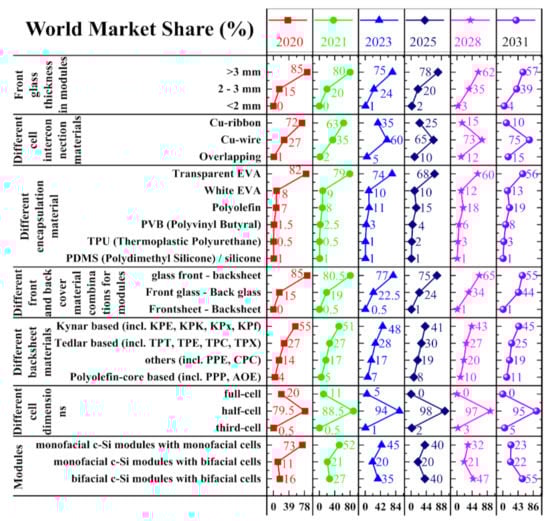
Figure 12.
World market shares of PV module design technologies with various materials and future predictions [35].
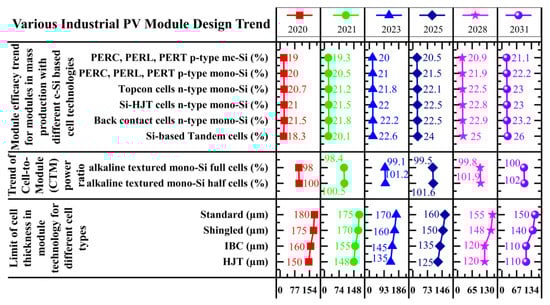
Figure 13.
PV module design parameters and future predictions [35].
The encapsulation material and part of the back cover or sheet are important components for the stability and longevity of the module. Rigorous attempts have been made to enhance such elements with regard to performance and cost. Upgrading the characteristics of such major factors is compulsory for successful maintenance over the lifetime of the module. EVA is the most extensively employed material for PV-module encapsulation, as shown in Figure 12. White EVA is expected to maintain a relatively stable market share of approximately 10% over the next decade. Polyolefins are forthcoming substitutes—particularly for glass–glass bifacial modules and HJTs (hetero-junction technology). It is expected that the market share of polyolefins will reach approximately 20% in the next 10 years, not more than anticipated, as reported by ITRPV [35].
Sheet layers will remain the standard material for the back cover of the module, although glass is projected to attain a substantially larger market share as a material for the back cover (specifically for applications of bifacial modules), and glass is expected to have a market share of approximately 45% in 10 years as back cover material. Glass on the back side of the bifacial module, with a thickness of <2 mm, is expected to be commercialized in 2021, with a growing market share prior to 10% up to 2031.
Minimizing the deficiencies in the electrical properties mostly entails modifications to the interconnection development, and the initial stage involved increasing the number of busbars. In the PV technology industry, 5-busbar cells have rapidly been adopted and are currently the benchmark. It is anticipated that 3- and 4-busbar cells, which had a market share of almost 5% in 2020, will be outmoded by 2022. PV modules with five busbars, which are currently produced by the majority of manufacturers, will gradually lose their dominance, reaching almost 65% market share in 2020 to nearly 10% in the next span. The ITRPV roadmap is confident regarding the design of 6+ busbar cells, predicting their market share to reach approximately 20% in 2020 and approximately 55% in 2030. The roadmap has encouraged the development of innovative cell-interconnection technology, e.g., multi-busbar and shingled “busbar-less” technology, as shown in Figure 14, and has expressed a confident perspective. These practices, which have a market share of approximately 10% in 2020, are expected to have a market share of almost 33% in 2030 [34].
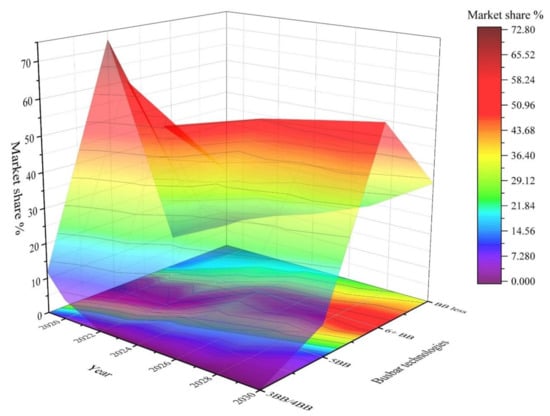
Figure 14.
Market shares of various busbar technologies, including future predictions [34].
In addition to increasing the number of busbars, the manufacturing industry has adopted other innovative techniques for PV modules, e.g., zero-gap, half cells, glass–glass, and bifacial technologies comprising shingling and tiling ribbon cells, which have been commercialized. Nevertheless, the utilization of larger cells for increasing the power in PV modules has been the dominant trend in the market. A significant aspect of the current innovative technologies of PV modules is that most of them are compatible with other systems and can be employed cooperatively, which allows various combinations of such technologies to be employed on a single PV module [34].
6. Conclusions
Simulations were performed to evaluate the conventional approach of CTM losses and gains by developing optimized models for the interconnection parameters affecting the cell efficiency and power. The simulation results were used to perform a CTM factor assessment of a 60-cell module system, and optimized efficiency and power were compared with those of standard and conventional PV modules. The efficiency and power were improved by 12.96% and 3.49%, respectively, compared with those of the conventional module. Additionally, the CTM ratios for the efficiency and power were enhanced for the optimized module. A simulation was performed to optimize the thickness of the ribbon core, width, number of busbars, cell margin, encapsulant, backsheet, and size of the cell contact pads, and it was discovered that these were the major parameters affecting the CTM power loss for the 60-cell module. A solar PV module with a standard module evaluated and achieved the output power of the module that was expanded by 10.98 Wp compared to a standard module, and the efficiency was increased by 2.42% for the same dimensions, as shown in Figure 10 and Figure 11. In the 60-cell module, an attempt was made to optimize the module efficiency and module power by adjusting the cell parameters, and the simulation results indicated that it is feasible to obtain the highest module power and efficiency with the same parameter settings; i.e., the parameter settings for the highest module power were equivalent to those for the highest module efficiency. In the simulation, the optimized CTM efficiency and CTM power for the 60-cell module were 94.19% and 99.1%, respectively, and the final module efficiency and power were 21.09% and 325.3 W, respectively.
Author Contributions
Conceptualization, H.Y.; methodology, E.-C.C., M.J., D.L., J.P.; software, H.Y., M.Q.K.; validation, Y.K., E.-C.C. and J.Y.; formal analysis, M.A.Z., M.J.; investigation, E.-C.C.; resources, H.Y.; data curation, M.A.Z.; writing—original draft preparation, H.Y.; writing and editing, H.Y.; visualization, E.-C.C., M.A.Z.; supervision, E.-C.C.; project administration, J.Y.; funding acquisition, E.-C.C. and J.Y. All authors have read and agreed to the published version of the manuscript.
Funding
This research received no external funding.
Institutional Review Board Statement
Not applicable.
Informed Consent Statement
Not applicable.
Data Availability Statement
Not applicable.
Acknowledgments
This research was supported by grants from the New & Renewable Energy Technology Development Program of the Korea Institute of Energy Technology Evaluation and Planning (KETEP) funded by the Korean Ministry of Trade, Industry and Energy (MOTIE) (Project No. 20203030010310 and 20203030010060).
Conflicts of Interest
The authors declare no conflict of interest.
References
- Singh, J.P.; Khoo, Y.S.; Chai, J.; Liu, Z.; Wang, Y. Cell-to-module power loss/gain analysis of silicon wafer-based PV modules. Photovolt. Int. 2016, 31, 98–105. [Google Scholar]
- Peters, M.; Guo, S.; Liu, Z. Full loss analysis for a multicrystalline silicon wafer solar cell PV module at short-circuit conditions. Prog. Photovolt. Res. Appl. 2016, 24, 560–569. [Google Scholar] [CrossRef]
- Hanifi, H.; Pfau, C.; Dassler, D.; Schneider, J.; Schindler, S.; Turek, M.; Bagdahn, J. Investigation of cell-to-module (CTM) ratios of PV modules by analysis of loss and gain mechanisms. Photovolt. Int. 2016, 32, 89–99. [Google Scholar]
- Li, B.; Segui, J.A.; Fountain, C.J.; Dubé, C.E.; Tsefrekas, B. Effect of encapsulant on cell-to-module efficiency loss in PV modules with ion implant and POCl3 cells. In Proceedings of the 38th IEEE Photovoltaic Specialists Conference, Austin, TX, USA, 3–8 June 2012; pp. 002336–002341. [Google Scholar]
- Halm, A.; Schneider, A.; Mihailetchi, V.D.; Libal, J.; Aulehla, S.; Galbiati, G.; Peter, K. Evaluation of cell to module losses for n-type IBC solar cells assembled with state of the art consumables and production equipment. In Proceedings of the IEEE 39th Photovoltaic Specialists Conference (PVSC), Tampa, FL, USA, 16–21 June 2013; pp. 2368–2372. [Google Scholar]
- Barretta, C.; Oreski, G.; Feldbacher, S.; Resch-Fauster, K.; Pantani, R. Comparison of Degradation Behavior of Newly Developed Encapsulation Materials for Photovoltaic Applications under Different Artificial Ageing Tests. Polymers 2021, 13, 271. [Google Scholar] [CrossRef]
- Haedrich, I.; Eitner, U.; Wiese, M.; Wirth, H. Unified methodology for determining CTM ratios: Systematic prediction of module power. Sol. Energy Mater. Sol. Cells 2014, 131, 14–23. [Google Scholar] [CrossRef]
- SmartCalc.Module. Available online: www.cell-to-module.com (accessed on 14 September 2021).
- Schneider, A.; Harney, R.; Koch, S. Impact of cell texturing quality on cell to module losses. Energy Procedia 2015, 77, 414–419. [Google Scholar] [CrossRef] [Green Version]
- Mittag, M.; Pfreundt, A.; Shahid, J. Impact of solar cell dimensions on module power, efficiency and cell-to-module losses. In Proceedings of the 30th PV Solar Energy Conference, Jeju, South Korea, 13 November 2020; pp. 1–6. [Google Scholar]
- Haedrich, I.; Wirth, H.; Storz, M.; Klingebiel, G. PV Module efficiency analysis and optimization. In Proceedings of the European American Solar Deployment Conference, PV-Rollout, Boston, MA, USA, 10–11 February 2011. [Google Scholar]
- Wohlgemuth, J.H.; Cunningham, D.W.; Monus, P.; Miller, J.; Nguyen, A. Long term reliability of photovoltaic modules. In 2006 IEEE 4th World Conference on Photovoltaic Energy Conference; IEEE: Piscataway, NJ, USA, 2006; Volume 2, pp. 2050–2053. [Google Scholar]
- Pfreundt, A.; Shahid, J.; Mittag, M. Cell-to-module Analysis beyond Standard Test Conditions. In Proceedings of the 2020 47th IEEE Photovoltaic Specialists Conference (PVSC); IEEE: Piscataway, NJ, USA, 2020; pp. 0921–0926. [Google Scholar]
- Mittag, M.; Ebert, M. Systematic PV-module optimization with the cell-to-module (CTM) analysis software. Sol. Cells 2014, 4, 585. [Google Scholar]
- Shahid, J.; Karabacak, A.Ö.; Mittag, M. Cell-To-Module (CTM) Analysis for Photovoltaic Modules with Cell Overlap. In Proceedings of the 30th PV Solar Energy Conference, Jeju, Korea, 13 November 2020; pp. 1–5. [Google Scholar]
- Mittag, M.; Zech, T.; Wiese, M.; Blasi, D.; Ebert, M.; Wirth, H. Cell-to-Module (CTM) analysis for photovoltaic modules with shingled solar cells. In Proceedings of the IEEE 44th Photovoltaic Specialist Conference (PVSC), Washington, DC, USA, 25–30 June 2017; pp. 1531–1536. [Google Scholar]
- Eymard, J.; Barth, V.; Sicot, L.; Commault, B.; Bettinelli, A.; Basset, L.; Favre, W.; Derrier, A. CTMOD: A cell-to-module modelling tool applied to optimization of metallization and interconnection of high-efficiency bifacial silicon heterojunction solar module. AIP Conf. Proc. 2021, 2367, 020012. [Google Scholar]
- Du, Y.; Tao, W.; Liu, Y.; Le, Z.; Zhang, M. Cell-to-Module Variation of Optical and Photovoltaic Properties for Monocrystalline Silicon Solar Cells with Different Texturing Approaches. ECS J. Solid State Sci. Technol. 2017, 6, 332–338. [Google Scholar] [CrossRef]
- Dupré, O.; Levrat, J.; Champliaud, J.; Despeisse, M.; Boccard, M.; Ballif, C. Reassessment of cell to module gains and losses: Accounting for the current boost specific to cells located on the edges. AIP Conf. Proc. 2018, 1999, 90001–90007. [Google Scholar]
- Roy, J.N. Comprehensive analysis and modeling of cell to module (CTM) conversion loss during c-Si Solar Photovoltaic (SPV) module manufacturing. Sol. Energy 2016, 130, 184–192. [Google Scholar] [CrossRef]
- Tian, H.; Mancilla-David, F.; Ellis, K.; Muljadi, E.; Jenkins, P. A cell-to-module-to-array detailed model for photovoltaic panels. Sol. Energy 2012, 86, 2695–2706. [Google Scholar] [CrossRef]
- Saw, M.H.; Khoo, Y.S.; Singh, J.P.; Wang, Y. Cell-to-module optical loss/gain analysis for various photovoltaic module materials through systematic characterization. Jpn. J. Appl. Phys. 2017, 56, 1–5. [Google Scholar] [CrossRef]
- Jansen, M.J.; Manshanden, P.; Slooff, L.H.; Bende, E.E.; Okel LA, G.; Danzl FJ, K. Cell to Module losses of an MWT module. In Proceedings of the European PV Solar Energy Conference and Exhibition EU PVSEC, Munich, Germany, 20–24 June 2016; pp. 1–4. [Google Scholar]
- Zhang, S.; Nampalli, N.; Payne, D.N.; Slade, A.; Edwards, M.B. Prediction and validation of solar cell-to-module and environmental losses based on refractive index data for various encapsulation materials. In Proceedings of the 2018 IEEE 7th World Conference on Photovoltaic Energy Conversion (WCPEC). A Joint Conference of 45th IEEE PVSC, 28th PVSEC & 34th EU PVSEC, Waikoloa, HI, USA, 10–15 June 2018; pp. 0660–0663. [Google Scholar]
- Ernst, M.; Haedrich, I.; Li, Y.; Lennon, A. Impact of (Multi-) Busbar design on the PERC cell-to-module yield under realistic conditions. In Proceedings of the Asia-Pacific Solar Research Conference, Canberra, Australia, 3–5 December 2019. [Google Scholar]
- Haedrich, I.; Surve, S.; Thomson, A. Cell to module (CTM) ratios for varying industrial cell types. In Proceedings of the 2015 Asia Pacific Solar Research Conference, Queensland, Australia, 8–10 December 2015; pp. 1–6. [Google Scholar]
- Shahid, J.; Mittag, M.; Heinrich, M. A multidimensional optimization approach to improve module efficiency, power and costs. In Proceedings of the 35th European Photovoltaic Solar Energy Conference and Exhibition (EU PVSEC), Brussels, Belgium, 24–28 September 2018; pp. 1–7. [Google Scholar]
- PV Lighthouse. Grid Calculator. Available online: https://www2.pvlighthouse.com.au/calculators/Grid%20calculator/Grid%20calculator.aspx (accessed on 28 November 2021).
- Haedrich, I.; Wiese, M.; Thaidigsman, B.; Eberlein, D.; Clement, F.; Eitner, U.; Wirth, H. Minimizing the Optical Cell-to-module Losses for MWT-modules. Energy Procedia 2013, 38, 355–361. [Google Scholar] [CrossRef]
- Guo, S.; Singh, J.P.; Peters, M.; Aberle, A.G.; Wong, J. Two-dimensional current flow in stringed PV cells and its influence on the cell-to-module resistive losses. Sol. Energy 2016, 130, 224–231. [Google Scholar] [CrossRef]
- Schneider, A.; Martínez JI, F.; Martínez, R.M.; Halm, A.; Rabanal-Arabach, J.; Harney, R. Material developments allowing for new applications, increased long term stability and minimized cell to module power losses. In Proceedings of the 31st European Photovoltaic Solar Energy Conference and Exhibition, Hamburg, Germany, 15 September 2015; pp. 153–156. [Google Scholar]
- Bermudez, V.; Perez-Rodriguez, A. Understanding the cell-to-module efficiency gap in Cu (In, Ga)(S, Se) 2 photovoltaics scale-up. Nat. Energy 2018, 3, 466–475. [Google Scholar] [CrossRef]
- Kim, J.; Rabelo, M.; Padi, S.P.; Yousuf, H.; Cho, E.C.; Yi, J. A Review of the Degradation of Photovoltaic Modules for Life Expectancy. Energies 2021, 14, 4278. [Google Scholar] [CrossRef]
- TaiyangNews. Advanced Module Technologies 2021 Report. Available online: http://taiyangnews.info/advanced-module-technologies-2021-report-download/ (accessed on 28 November 2021).
- ITRPV. Available online: https://itrpv.vdma.org/documents/27094228/29066965/20210ITRPV/08ccda3a-585e-6a58-6afa-6c20e436cf41 (accessed on 28 November 2021).
Publisher’s Note: MDPI stays neutral with regard to jurisdictional claims in published maps and institutional affiliations. |
© 2022 by the authors. Licensee MDPI, Basel, Switzerland. This article is an open access article distributed under the terms and conditions of the Creative Commons Attribution (CC BY) license (https://creativecommons.org/licenses/by/4.0/).