Abstract
The dye-sensitized solar cell (DSSC) has been on the market as a permanent power source for indoor IoT edge devices. In recent years, indoor illumination technology has been experiencing a drastic transition from incandescent and fluorescent lamps toward solid-state lighting devices with light-emitting diodes (LEDs). In addition to the high power efficiency, a virtue of LEDs is their prompt response, which enables precise change of the illumination level using pulse-width modulation (PWM) of the current source, and thus PWM illumination is commonly installed in society. The light intensity change from off to on states of an LED under PWM driving is literally infinity, which causes the lighting to flicker. The lighting flicker induces not only an optical illusion but also biological effects, including serious health problems, which can be mitigated by raising the modulation frequency. Because the peak intensity of a PWM illumination can be 100 times that of the average intensity, the indoor solar cell, which has a relatively high series resistance, is expected to underperform. In this paper, the characteristics of a commercial indoor DSSC under PWM illumination are studied. It is found that while PWM illumination at low frequency seriously deteriorates the performance of the DSSC, it recovers at high frequency. The latter feature is not found in indoor amorphous-Si solar cells, and the electrochemical impedance spectroscopy revealed that it stems from the electrochemical nature of some components of the series impedance in the DSSC, offering a key piece of evidence of the superiority for use in the modern indoor application of the DSSC over traditional amorphous-Si solar cells.
1. Introduction
The collection of big data through the Internet of Things (IoT) network consisting of wireless sensor nodes is becoming an essential tool for the medical, agricultural, manufacturing, infrastructure, building management, and energy industries [1]. Because the peak intensity of a PWM illumination can be 100 times that of the average intensity, the indoor solar cell, which has a relatively high series resistance, is expected to underperform. Among them, indoor light-energy harvesting technology using solar cells is one of the most attractive choices in a silent and comfortable living/working environment where neither a large thermal gradient nor a strong mechanical vibration exists [2,3,4,5,6,7].
Organic solar cells, including dye-sensitized solar cells (DSSCs), have been recognized as one of the most essential key elements of the permanent power source for indoor IoT devices [5,6,7,8,9,10,11,12,13,14,15,16,17,18,19,20,21]. Compared with the Pb-halide perovskite solar cells, the DSSCs have less potential hazardousness due to the exclusion of toxic elements such as Pb. This makes them much more attractive, especially when we bear in mind that the devices, including the solar cells, are not always disposed of in a correct manner. Research on DSSC, including the development of semi-transparent solar cells as decorative power sources and the development of photocathodes to replace precious Pt electrodes, has been actively conducted [22,23,24,25,26].
While the commercialization of DSSCs for indoor use has already been achieved [27,28], the lack of a standard evaluation method for indoor solar cells, which has been repeatedly pointed out, makes it difficult to compare the performance of different indoor solar cells [6,7]. For example, although fluorescent lamps and light-emitting diodes (LEDs) are used for modern indoor lighting, their emission spectra vary from product to product. Therefore, any standard light source with specified spectral irradiance for indoor solar cell evaluation, equivalent to the AM1.5G 1 sun (100 mW/cm2) solar simulator for outdoor solar cell evaluation, has not been established yet.
Aside from the previously mentioned known problem, the author recently pointed out that the instantaneous temporal variation of illumination intensity of modern solid-state lighting devices, known as “light flicker,” may cause another problem in indoor solar cells [29]. In recent years, indoor illumination technology has been experiencing a drastic transition from incandescent and fluorescent lamps toward solid-state lighting devices with LEDs. In addition to the high power efficiency, a virtue of LEDs is their prompt and linear response, which enables precise change of the illumination level using pulse-width modulation (PWM) of the current source, and thus PWM illumination is commonly installed in society.
Figure 1 illustrates various waveforms of PWM illumination, realizing a certain average illumination intensity of LAVG. The duty cycle D is the ratio of the pulse width TON at which the LED is powered to the total period T, which is equal to the inverse of the PWM frequency fPWM of the waveform. As illustrated in the figure, the peak illumination intensity LON during the time the LED is powered equals LAvg/D. D = 1 corresponds to the continuous wave (CW), and LON = LAvg in this case. The light intensity change from off to on states of an LED under PWM driving is literally infinity, and it induces not only an optical illusion but also biological effects, including serious health problems if the modulation frequency fPWM is not appropriately high. The fPWM is typically chosen to be higher than 120 Hz to make the flicker invisible [30,31].
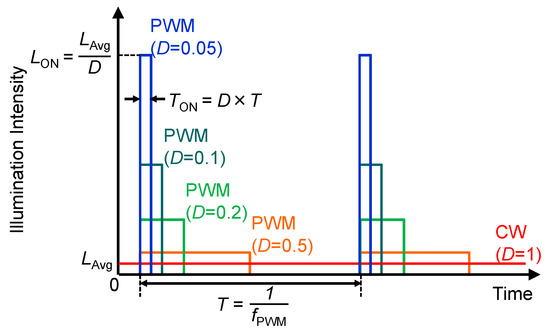
Figure 1.
Various PWM waveforms produce an average illumination intensity, LAvg.
Because the peak intensity of a PWM illumination can be 100 times that of the average intensity, the indoor solar cell, which has a relatively high series resistance, is expected to underperform. This paper addresses the impact of lighting flicker on the performance of a commercial DSSC.
2. Experimental
In this study, a DSSC FDSC-FSC6FG [32] from Fujikura was used as a sample. The current-voltage characteristics of the sample were measured by a Keithley 2400 source meter under the illumination of blue light (λ = 470 nm) from a high-power LED driven by a programmable current source. The reason for choosing the monochromatic LED over a white LED is that the emission spectrum of the phosphor changes due to the heating of the LED chip inside a white LED, resulting in a remarkable emission spectrum modulation of the white LED [33,34]. In order to maintain the uniformity of the illumination, the LED was equipped with optical devices to deliver uniform illumination, and the active area of the sample was covered by a metal mask with a 1 cm × 1 cm square aperture at the center of the sample.
The illumination intensity of the LED, which is referred to as L0 in this study, was determined to be 57 mW/cm2 since the current-voltage curve of the sample under the illumination mimics that under AM1.5G 1 sun illumination produced by an Asahi Spectra HAL-C100 solar simulator as shown in Figure 2. The power conversion efficiency (PCE) of the sample under illumination is calculated as 3.6 (6.3)% if we assume the input illumination power is 100 (57) mW/cm2. In order to maintain the average illumination light intensity L0 regardless of the modulation condition, it was measured by a Thorlabs PM100USB light power meter equipped with an S405C thermal power sensor head. The use of a thermal power sensor with a relatively slow response is key to the correct measurement of the average light intensity of modulated light.
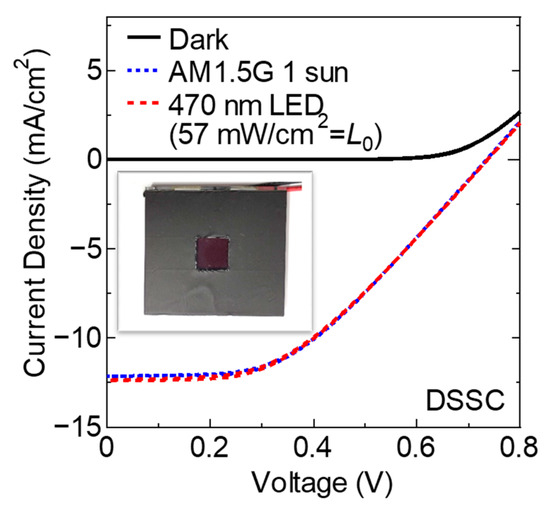
Figure 2.
Current density-voltage characteristics of the DSSC under dark conditions with AM1.5G 1 sun CW illumination from the solar simulator and 57 mW/cm2 (L0) CW illumination from the blue LED. The inset shows a photograph of the sample with a metal mask.
The fPWM changed from 50 to 794 Hz, and the D changed within a range of 0.05–1, as illustrated in Figure 1. The “power-line cycle” parameter of the Keithley 2400 was set to 50 Hz in order to reject the measurement fluctuation as reported in detail in a previous paper [35].
The electrochemical impedance spectrum of the DSSC sample was taken by a BioLogic SP-150 potentiostat at open-circuit voltage under CW L0 illumination. The magnitude of the sinusoidal voltage was 10 mV. The circuit parameters were extracted by using the solver function in Microsoft Excel.
3. Results and Discussion
Figure 3 shows the current density-voltage characteristics of the DSSC under various CW illumination intensities. The fill-factor (FF) of the device rapidly decreased with increasing illumination intensity. The overall phenomenon, which stems from the high series resistance of the solar cell, is qualitatively the same as that observed in the amorphous-Si solar cell reported in the previous paper [29]. The photocurrent at a low illumination level is small, and the voltage loss and thus the power loss caused by the series resistance are also limited, even if the series resistance is relatively high. However, the loss becomes high enough to skew the current-voltage curve to lower the FF of the device at a high illumination level and eventually limit the short-circuit photocurrent.
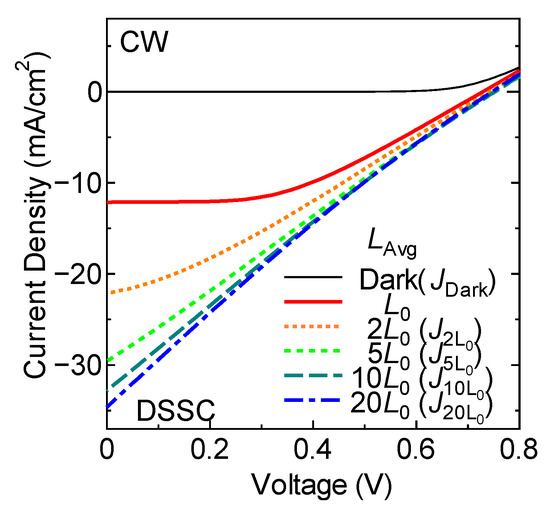
Figure 3.
Current density-voltage characteristics of the DSSC under CW illumination from the blue LED with various illumination intensities.
The dependences of the photovoltaic parameters extracted from Figure 3 on the illumination intensity are summarized in Figure 4. The slope in the double logarithmic plot of the short-circuit current density (JSC) versus the illumination intensity keeps unity until the illumination intensity is up to 2L0 and then starts to decline seriously. The slope in the semi-logarithmic plot of the VOC versus the illumination intensity is not constant in contrast to the amorphous-Si [29] and organic thin-film [14] solar cells. A significant reduction in the FF, as well as the PCE, due to the effect of the series resistance of the photovoltaic cell is also observed. The PCEs at 10L0 and 20L0 are only 16% and 8% of the PCE at L0, respectively.
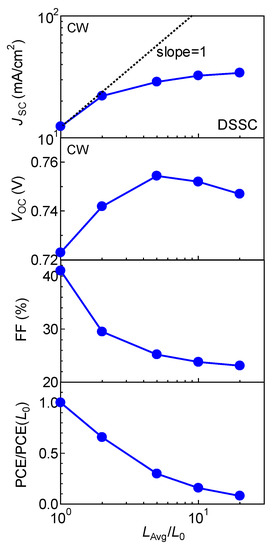
Figure 4.
Dependences of JSC, VOC, FF, and PCE/PCE(L0) of the DSSC on illumination light intensity.
The current density-voltage curves of the DSSC under PWM illumination at fPWM = 50 Hz with various D are shown in Figure 5. Although the average illumination intensity LAvg is kept at L0, the JSC, the VOC, the FF, and thus the PCE monotonically decrease by decreasing D. The decrease mainly comes from the higher LON under the smaller D, which increases the photocurrent under LON and increases the voltage and power loss due to the series resistance of the solar cell. In the case of the amorphous-Si solar cell, a simple superposition of the curves corresponding to the LON illumination and the dark conditions reasonably reproduces the curves under PWM illumination [29]. That is, the current density J at voltage V under the PWM illumination at the duty cycle D can be expressed as:
where and denote the current densities under the CW LON illumination and the dark conditions, respectively. On the other hand, as shown in Figure 5, the symbols calculated by Equation (1) seriously deviate from the experimental curves in the case of the DSSC.
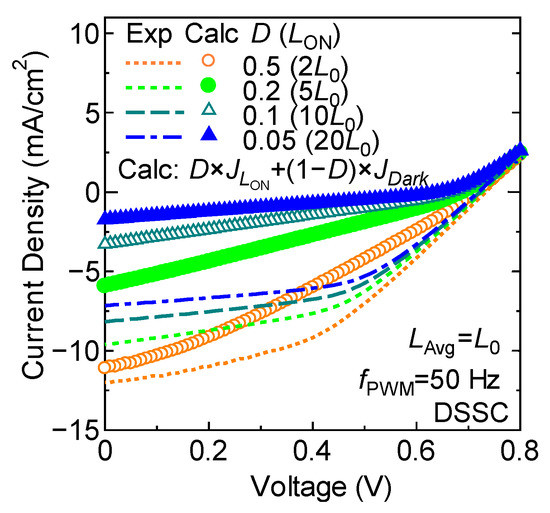
Figure 5.
Current density-voltage characteristics of the DSSC under 50 Hz-PWM illumination from the blue LED with various duty cycles. Symbols show plots of Equation (1) using and in Figure 3.
Figure 6 shows the current density-voltage characteristics of the DSSC under PWM illumination with varying fPWM and D. Figure 7 summarizes the dependences of the photovoltaic parameters extracted from Figure 6 on the fPWM. In contrast to the amorphous-Si solar cell, in which fPWM does not cause any effect on the photovoltaic parameters [29], the effect of illumination modulation on the DSSC is mitigated, similar to the biological effects of lighting flicker, which can be avoided by using properly high fPWM [30,31], providing a key piece of evidence of the DSSC’s superiority for use in modern indoor applications over traditional amorphous-Si solar cells [29]. The mitigation of PWM illumination effects on the photovoltaic performance at higher fPWM corresponds to the reduction of the effective series resistance at higher fPWM.
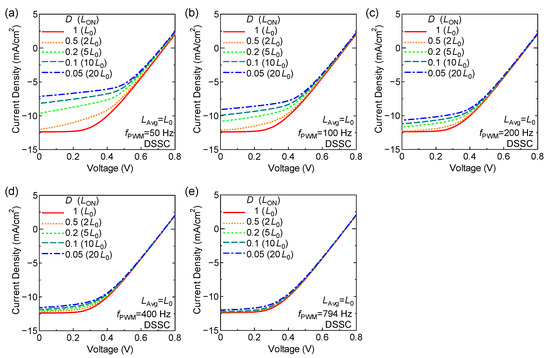
Figure 6.
Current density-voltage characteristics of the DSSC under PWM illumination with various PWM frequencies and duty cycles. Each panel corresponds to a different PWM frequency: (a) 50, (b) 100, (c) 200, (d) 400, (e) 794 Hz.
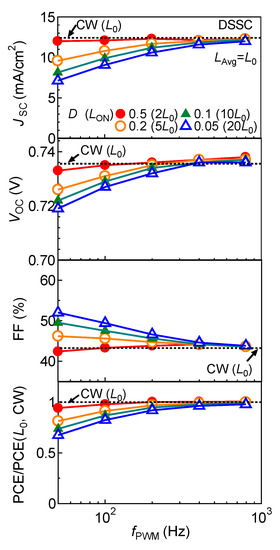
Figure 7.
Dependences of JSC, VOC, FF, and PCE/PCE (L0, CW) of the DSSC on fPWM.
Figure 8a shows an equivalent circuit model of a DSSC. [36] The series impedance component ZEC represents the electrochemical nature of a DSSC. As shown in the electrochemical impedance spectrum in Figure 8b, the effective series resistance, or the real part of the electrochemical impedance, becomes lower at a higher frequency. The observed electrochemical impedance clearly consists of three frequency-dependent components and a pure resistor, R0. The hemispherical nature of the spectrum requires the constant phase elements (CPEs), which are denoted by Q1–Q3 in the inset, in the equivalent circuit model of the electrochemical impedance of the DSSC. Each component is attributed as follows [37]:
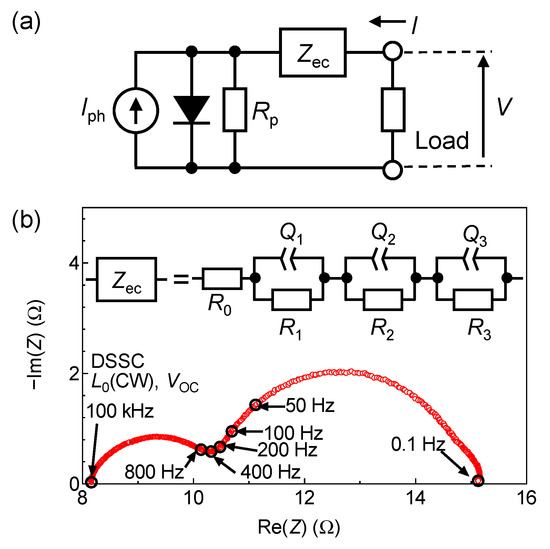
Figure 8.
(a) The equivalent circuit model of a DSSC. (b) Nyquist plot of the electrochemical impedance spectrum of the DSSC at open-circuit voltage conditions under CW L0 illumination.
- R0: The electrical resistance of the transparent electrode;
- R1 || Q1: Charge transfer at the counter electrode (above 1 kHz);
- R2 || Q2: Electron transport in the TiO2 layer and electron-hole recombination (between 1 Hz and 1 kHz);
- R3 || Q3: Electrolyte diffusion (for frequencies lower than 1 Hz).
The circuit parameters extracted by the curve fitting are listed in Table 1. As shown in Figure 9, the extracted parameters reasonably reproduced the experimental data. Although these results may provide useful insights into the operating mechanism of the device, we will not go any further into this. Instead, we will examine the results from an electrical engineering perspective, which has rarely been considered. In the viewpoint of electrical circuit theory, an imaginary part of the electrochemical impedance provides a “short-cut” path for sinusoidal current components with sufficiently high frequency [38].

Table 1.
Circuit parameters of the equivalent circuit model extracted by the least-squares curve fitting from the electrochemical impedance spectrum in Figure 8b.
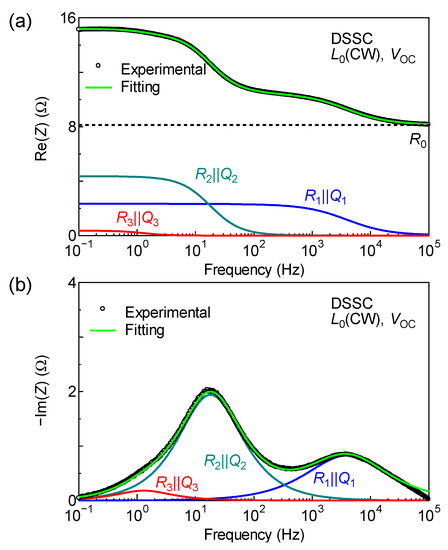
Figure 9.
Bode plots of the experimental data and fitting curves of (a) real and (b) imaginary parts of the electrochemical impedance spectra of the DSSC. The frequency dependences of individual electrochemical components are also shown.
Figure 10a shows the waveform of the photocurrent i(t) generated by the PWM illumination. For simplicity, assume that the ZEC is a simple circuit consisting of R0, R1, and Q1, as shown in Figure 10b. The real part of the ZEC at DC is R0 + R1. If the series resistance, or the real part of the series impedance, of a solar cell does not have any frequency dependence like an amorphous-Si solar cell, the average power dissipated in the ZEC is expressed as follows:
where ION corresponds to the photocurrent under LON = LAVG/D.
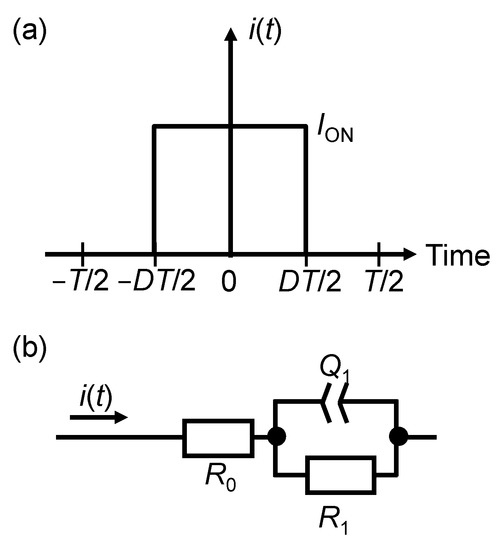
Figure 10.
(a) Waveform of the photocurrent i(t) generated by the PWM illumination. (b) Simplified electrochemical impedance of a DSSC.
The waveform of the photocurrent generated by PWM illumination with principal angular frequency ω0 can be expressed by the following Fourier series:
with Equation (3), P1 can also be expressed as,
On the other hand, Q1 is short-circuited if ω0 is high enough, so the real part of the ZEC can be approximated as R0. In this case, the average power dissipated in the ZEC is
By comparing Equations (2) and (5), we can see that the power loss due to R0 + R1 has decreased by a factor of D. In this case, the power loss is determined solely by LAVG = LOND, regardless of D.
From Equations (2) and (4):
thus, we obtain the following.
These equations predict that the power loss inside a DSSC is reduced more under a high-frequency PWM modulation with a smaller D, thanks to the unique frequency-dependent electrochemical impedance of a DSSC.
4. Conclusions
In recent years, indoor light-energy harvesting has been recognized as one of the key potential applications of organic solar cells like DSSCs. Previous studies have paid attention only to the characteristics of low-intensity CW light irradiation. PWM modulation, on the other hand, with short-time intensity variation that humans cannot perceive, is widely used in modern solid-state indoor lighting. Such intensity modulation has been a blind spot in conventional research on the indoor application of solar cells. One of the main reasons some solar cells are considered suitable for indoor rather than outdoor use is their relatively high series resistance. For this reason, under PWM light irradiation that gives a momentarily high light intensity to cover the dark period, there is a possibility that the electric power under PWM illumination does not achieve the level expected from the average illumination intensity.
In this paper, the characteristics of a commercial indoor DSSC under PWM illumination have been studied. It has been found that while PWM illumination at low frequency seriously deteriorates the performance of the DSSC, it recovers at high frequency. The latter feature is not found in indoor amorphous-Si solar cells, and the electrochemical impedance spectroscopy revealed that it stems from the electrochemical nature of some components of the series impedance in the DSSC, offering a key piece of evidence of the superiority for use in the indoor application of the DSSC over traditional amorphous-Si solar cells in the modern solid-state lighting era.
Funding
This work was partially funded by the Masuyakinen Basic Research Foundation.
Data Availability Statement
The data that support the findings of this study are available from the corresponding author upon reasonable request.
Conflicts of Interest
The author declares no conflict of interest.
References
- Rawat, P.; Singh, K.D.; Chaouchi, H.; Bonnin, J.M. Wireless sensor networks: A survey on recent developments and potential synergies. J. Supercomput. 2014, 68, 1–48. [Google Scholar] [CrossRef]
- Vullers, R.J.M.; van Schaijk, R.; Doms, I.; Van Hoof, C.; Mertens, R. Micropower energy harvesting. Solid-State Electron. 2009, 53, 684–693. [Google Scholar] [CrossRef]
- Sudevalayam, S.; Kulkarni, P. Energy Harvesting Sensor Nodes: Survey and Implications. IEEE Commun. Surv. Tutor. 2010, 13, 443–461. [Google Scholar] [CrossRef]
- Matiko, J.W.; Grabham, N.J.; Beeby, S.P.; Tudor, M.J. Review of the application of energy harvesting in buildings. Meas. Sci. Technol. 2013, 25, 012002. [Google Scholar] [CrossRef]
- Raj, A.; Steingart, D. Review—Power Sources for the Internet of Things. J. Electrochem. Soc. 2018, 165, B3130–B3136. [Google Scholar] [CrossRef]
- Mathews, I.; Kantareddy, S.N.; Buonassisi, T.; Peters, I.M. Technology and Market Perspective for Indoor Photovoltaic Cells. Joule 2019, 3, 1415–1426. [Google Scholar] [CrossRef]
- Venkateswararao, A.; Ho, J.K.; So, S.K.; Liu, S.-W.; Wong, K.-T. Device characteristics and material developments of indoor photovoltaic devices. Mater. Sci. Eng. R Rep. 2019, 139, 100517. [Google Scholar] [CrossRef]
- Mariotti, N.; Bonomo, M.; Fagiolari, L.; Barbero, N.; Gerbaldi, C.; Bella, F.; Barolo, C. Recent advances in eco-friendly and cost-effective materials towards sustainable dye-sensitized solar cells. Green Chem. 2020, 22, 7168–7218. [Google Scholar] [CrossRef]
- Li, B.; Hou, B.; Amaratunga, G.A.J. Indoor photovoltaics, The Next Big Trend in solution-processed solar cells. Infomat 2021, 3, 445–459. [Google Scholar] [CrossRef]
- Freitag, M.; Teuscher, J.; Saygili, Y.; Zhang, X.; Giordano, F.; Liska, P.; Hua, J.; Zakeeruddin, S.M.; Moser, J.-E.; Grätzel, M.; et al. Dye-sensitized solar cells for efficient power generation under ambient lighting. Nat. Photon. 2017, 11, 372–378. [Google Scholar] [CrossRef]
- Sacco, A.; Rolle, L.; Scaltrito, L.; Tresso, E.; Pirri, C.F. Characterization of photovoltaic modules for low-power indoor application. Appl. Energy 2013, 102, 1295–1302. [Google Scholar] [CrossRef]
- Li, Y.; Grabham, N.J.; Beeby, S.P.; Tudor, M.J. The effect of the type of illumination on the energy harvesting performance of solar cells. Sol. Energy 2015, 111, 21–29. [Google Scholar] [CrossRef]
- Mori, S.; Gotanda, T.; Nakano, Y.; Saito, M.; Todori, K.; Hosoya, M. Investigation of the organic solar cell characteristics for indoor LED light applications. Jpn. J. Appl. Phys. 2015, 54, 071602. [Google Scholar] [CrossRef]
- Tada, K. Characterization of polymer bulk heterojunction photocell with unmodified C 70 prepared with halogen-free solvent for indoor light harvesting. Org. Electron. 2016, 30, 289–295. [Google Scholar] [CrossRef]
- Lee, H.K.H.; Li, Z.; Durrant, J.R.; Tsoi, W.C. Is organic photovoltaics promising for indoor applications? Appl. Phys. Lett. 2016, 108, 253301. [Google Scholar] [CrossRef]
- Tada, K. Characteristics of PTB7-Th:C bulk heterojunction photocells under low-light illumination: Critical effect of dark parallel resistance. Phys. Status Solidi A 2017, 214, 1700018. [Google Scholar] [CrossRef]
- Tada, K. Low-light characteristics of polymer photocell with S-shaped current-voltage curve at 1 sun. Mol. Cryst. Liq. Cryst. 2017, 653, 39–43. [Google Scholar] [CrossRef]
- Aoki, Y. Photovoltaic performance of Organic Photovoltaics for indoor energy harvester. Org. Electron. 2017, 48, 194–197. [Google Scholar] [CrossRef]
- Tada, K. Effect of fullerene substituent on low-light characteristics of polymer: Fullerene bulk heterojunction solar cells. Mol. Cryst. Liq. Cryst. 2020, 705, 65–70. [Google Scholar] [CrossRef]
- Saeed, M.A.; Yoo, K.; Kang, H.C.; Shim, J.W.; Lee, J.-J. Recent developments in dye-sensitized photovoltaic cells under ambient illumination. Dye. Pigment. 2021, 194, 109626. [Google Scholar] [CrossRef]
- Devadiga, D.; Selvakumar, M.; Shetty, P.; Santosh, M.S. Dye-Sensitized Solar Cell for Indoor Applications: A Mini-Review. J. Electron. Mater. 2021, 50, 3187–3206. [Google Scholar] [CrossRef]
- Nattestad, A.; Perera, I.; Spiccia, L. Developments in and prospects for photocathodic and tandem dye-sensitized solar cells. J. Photochem. Photobiol. C: Photochem. Rev. 2016, 28, 44–71. [Google Scholar] [CrossRef]
- Daoud, A.; Cheknane, A.; Meftah, A.; Nunzi, J.M.; Shalabi, M.; Hilal, H.S. Spatial separation strategies to control charge recombination and dye regeneration in p-type dye sensitized solar cells. Sol. Energy 2022, 236, 107–152. [Google Scholar] [CrossRef]
- Bonomo, M.; Ekoi, E.J.; Marrani, A.G.; Zarate, A.Y.S.; Dowling, D.P.; Barolo, C.; Dini, D. NiO/ZrO2 nanocomposites as photocathodes of tandem DSCs with higher photoconversion efficiency with respect to parent single-photoelectrode p-DSCs. Sustain. Energy Fuels 2021, 5, 4736–4748. [Google Scholar] [CrossRef]
- Cheng, H.; Ayaz, M.; Wrede, S.; Boschloo, G.; Hammarström, L.; Tian, H. Assessing the effect of surface states of mesoporous NiO films on charge transport and unveiling an unexpected light response phenomenon in tandem dye-sensitized solar cells. Energy Adv. 2022, 1, 303–311. [Google Scholar] [CrossRef]
- Farré, Y.; Raissi, M.; Fihey, A.; Pellegrin, Y.; Blart, E.; Jacquemin, D.; Odobel, F. A Blue Diketopyrrolopyrrole Sensitizer with High Efficiency in Nickel-Oxide-based Dye-Sensitized Solar Cells. ChemSusChem 2017, 10, 2618–2625. [Google Scholar] [CrossRef]
- Aslam, A.; Mehmood, U.; Arshad, M.H.; Ishfaq, A.; Zaheer, J.; Khan, A.U.H.; Sufyan, M. Dye-sensitized solar cells (DSSCs) as a potential photovoltaic technology for the self-powered internet of things (IoTs) applications. Sol. Energy 2020, 207, 874–892. [Google Scholar] [CrossRef]
- Tanabe, N. Dye-Sensitized Solar Cell for Energy Harvesting Applications. Fujikura Tech. Rev. 2013, 42, 109–113. Available online: https://www.fujikura.co.jp/eng/rd/gihou/backnumber/pages/__icsFiles/afieldfile/2013/05/23/42e_30.pdf (accessed on 28 November 2022).
- Tada, K. Lighting flicker: A blind spot in indoor photovoltaic cell characterization. Appl. Phys. Express 2020, 13, 024005. [Google Scholar] [CrossRef]
- Lehman, B.; Wilkins, A.J. Designing to Mitigate Effects of Flicker in LED Lighting: Reducing risks to health and safety. IEEE Power Electron. Mag. 2014, 1, 18–26. [Google Scholar] [CrossRef]
- IEEE Std 1789–2015; IEEE Recommended Practices for Modulating Current in High-Brightness LEDs for Mitigating Health Risks to Viewers. IEEE: New York, NY, USA, 2015; pp. 1–80. [CrossRef]
- Available online: https://www.fujikura.co.jp/eng/products/infrastructure/dsc/01/dsc_brochure.pdf (accessed on 28 November 2022).
- Dyble, M.; Narendran, N.; Bierman, A.; Klein, T. Impact of Dimming White LEDs: Chromaticity Shifts Due to Different Dimming Methods. In Proceedings of the Fifth International Conference on Solid State Lighting, San Diego, CA, USA, 1–4 August 2005; p. 59411H. [Google Scholar] [CrossRef]
- Gu, Y.; Narendran, N.; Dong, T.; Wu, H. Spectral and luminous efficacy change of high-power LEDs under different dimming methods. In Proceedings of the Sixth International Conference on Solid State Lighting, San Diego, CA, USA, 14-17 August 2006; p. 63370J. [Google Scholar] [CrossRef]
- Tada, K. Performance evaluation method of dye-sensitized solar cell under modulated illumination. Mol. Cryst. Liq. Cryst. 2021, 727, 2–8. [Google Scholar] [CrossRef]
- Koide, N.; Chiba, Y.; Han, L. Methods of Measuring Energy Conversion Efficiency in Dye-sensitized Solar Cells. Jpn. J. Appl. Phys. 2005, 44, 4176–4181. [Google Scholar] [CrossRef]
- Sacco, A. Electrochemical impedance spectroscopy: Fundamentals and application in dye-sensitized solar cells. Renew. Sustain. Energy Rev. 2017, 79, 814–829. [Google Scholar] [CrossRef]
- Chua, L.O.; Desoer, C.A.; Kuh, E.S. Linear and Nonlinear Circuits; McGraw-Hill: New York, NY, USA, 1987. [Google Scholar]
Publisher’s Note: MDPI stays neutral with regard to jurisdictional claims in published maps and institutional affiliations. |
© 2022 by the author. Licensee MDPI, Basel, Switzerland. This article is an open access article distributed under the terms and conditions of the Creative Commons Attribution (CC BY) license (https://creativecommons.org/licenses/by/4.0/).