Abstract
The remediation of open-cast post-mining soil remains a big challenge. Here, the post-mining soils are considered from the viewpoints of CO2 emission and carbon sequestration. We investigated the dynamic of C stock in two different post-mining areas, i.e., the limestone post-mining soil remediated with embankment (S1), and the lignite post-mining soil remediated with sewage sludge (S2). Post-mining soils under four different remediation stages were used. The study was conducted in the spring of 2021 and 2022. The aim of the study was to assess the C sequestration in sewage sludge amended and non-amended post-mining soils at differently advanced remediation techniques. We noticed an increase in or stabilization of SOC in the S1. The stabilization of SOC was observed for the soil with a higher remediation age (S1C, S1D). The remediation of the S2 resulted in the increase in SOC among the soil remediation age. For both soils, we noticed a negative CO2 emission from the soil under remediation, and the net CO2 emission rate (NCER) further decreased after one year. A positive C feedback of both remediation techniques was shown to reflect lower active carbon (POXC). We also noticed an increase in nutrient content (K, Mg), and a decrease in heavy metals content after 1 year. Such a positive relationship between the remediation of post-mining soils and C sequestration indicates a step towards climate change mitigation.
1. Introduction
Mining has accompanied mankind for centuries. The mining industry has increased substantially in recent decades due to the growing economic demands of ever-increasing populations. However, mining has a strong impact on the natural environment, especially opencast mining, which is associated with the removal of the topsoil and contributing to soil degradation [1]. Extensive mining carried out for centuries has resulted in large damage to landscapes and soil quality. According to the Polish Central Statistical Office, degraded land areas reached 62,000 ha in 2019 [2]. Globally, nearly 33% of soils are degraded, and have significantly lost their organic carbon content [3].
Intensive and exhaustive resource exploitation disrupts the proper functioning of soils, causing ecosystem complications [4]. Furthermore, the remediation of post-mining areas is time and resource-consuming, and depending on the techniques involved, it may also be expensive [5]. The recultivation of post-mining areas is focused mainly on restoring the soil quality and productivity [6], but also improving the aboveground biodiversity [7]. Due to multifunctionality of soil in an overall ecosystem, soils are the most impactful element in a struggle to mitigate climate change through carbon sequestration [8]. In the face of emerging climate changes, the direct capture of CO2 from the air, followed by its sequestration in soils, is considered necessary to decarbonize the economy and achieve climate neutrality by 2050 under the European Green Deal, which further emphasizes the role of healthy soils [9]. To accomplish sustainable soil management, it is necessary to implement extensive restoration practices to decrease the negative trend in land degradation.
Many post-mining soil remediation practices are directed towards afforestation or reforestation [10]. The developing forestry ecosystem makes a new soil cover from the beginning to improve soil quality. In many cases, the initial soil quality (including depleted post-mining soils) does not allow for the proper growth and development of trees, thus different assistive techniques, such as the introduction of organic fertilizers, are usually implemented [11,12]. It has been noticed that the application of organic fertilizers allows for a quick and effective initiation of soil remediation leading to improved soil properties. It is well known that reforestation positively influences soil microorganisms, either their activity or diversity. Therefore, reforestation in a long-term study showed a changed functional role of soil microbes in the C cycle, which may favor C sequestration [13]. The anabolic byproducts of changed C turnover pathways may quickly interact with the soil’s aggregate structure, and soil minerals making a new and more stable C fraction increases soil C persistence and thus sequestration [14]. In Europe, in contrast to other parts of the world, there is a positive and visible trend of the afforestation process, resulting in an increased area of 19.3 Mha [15] which may positively favor the mitigation of climate change on the European scale.
For sequestration purposes, the most important is the translocation of sequestered C into deeper soil layers, and the formation of stable forms with a long half-time, which will support the long-term storage of C in the soil [16]. Since the risk connected with a reversion of C sequestration exists, it is shown that for forest soils such probability may be effectively decreased by buffering systems, which have proven to provide long persistence of C in the soil [14]. Even if such sequestration reverses, the decomposition and turnover will take hundreds and thousands of years, while the necessity to decrease CO2 concentration in the atmosphere is emerging and of immediate concern [17].
The most pressing demand and challenges worldwide are to decrease the ever-increasing concentration of green-house gases (GHGs) in the atmosphere, especially CO2. It is suggested that degraded soils may consist of a potentially valuable C sink, which via sequestration may bind C from the atmosphere and store it underground in a stable form [17].
The land use system has a crucial influence on the possibility of stable C storage [12]. Forest lands represent the highest C-stock, reaching 64.54 +/− 6.24 Mg ha−1 [18]. Reforestation of post-mining soils may potentially capture even 13.9 Mg CO2 equivalent ha−1 y−1 [19]. It has been reported that agroforestry has the potential for C capture between 0.09 to 7.29 Mg C ha−1 a−1. A lower boundary is assigned for the systems containing fever woody elements per area, and the highest boundary refers to systems with fast-growing tree species and good-quality soils [20]. Sequestration potential is also studied regarding tree species and soil maturity. Immature soils (spoil hips) showed lower carbon capturing under coniferous species, and higher under broadleaf. In contrast, mature soils (forests, agriculture areas) store more SOC under coniferous than broadleaf trees [21]. Beside soil maturity, land cover, land use type, and several other soil parameters have a crucial influence on the SOC sequestration. Fertile soils with high content of SOC provide good conditions for tree growth under remediation by reforestation. Active carbon represents the fraction of labile carbon and is widely used to assess the influence of soil management and land use on soil quality. Active carbon (permagnate oxidizable carbon (POXC)) is considered the most for SOC sequestration [22]. Microbial community and diversity NPK nutrients were found to be linearly correlated with soil organic carbon [23]. Therefore, phosphorus in soil is responsible for increased plant biomass and plays a key role as a transporter of metabolic energy in plant cells to regulate C sequestration by plants [24]. On the other hand, heavy metals inhibit photosynthesis through blocking the Calvin cycle [25] and may lead to reduced plant growth and lower C sequestration in the soil.
A previous study with fertilization and three types of straw returned to the opencast coal mine showed higher SOC content in the fertilized soils [26]. The highest SOC increase was observed in the combined fertilization with manure, and mineral fertilizer as compared to the application of inorganic or manure fertilizers applied separately [26]. Therefore, the combined inorganic and organic fertilizer caused a significant decrease in CO2 emission per C stock and per grain yield [26]. The straw application on the coal post-mining area showed the effect on C sequestration. The study reported that both straw-mixing and straw-mulching treatments enhanced the soil CO2 emissions in comparison to the soil with no straw application. The CO2 emission from the soil treated with straw mixing showed an increase of 102 g C m−2 yr−1, while the soil treated with straw mulching showed an increase of 48.6 g C m−2 yr−1 [26]. The previous study on the lignite post-mining soil remediated with sewage sludge reported the differences in the formation of C fractions. This study reported an increase in non-labile C (18.5%) and higher content of stable C fractions (alkyl C, aromatic C), which improved the stability of stored C [16]. Therefore, the remediation of post-mining soil with sewage sludge improved the capability of the soil for C sequestration purposes with better hydrophobicity, aromaticity, humification, and C/N ratio [16]. It was also shown that remediation of post-mining lands through reforestation improves the SOC content in soil by 102% by comparison to the non-restored sites [27].
Despite considerable work on C sequestration, the knowledge of how carbon sequestration works at different stages of soil remediation, and the C dynamics at different stages of remediation are, is still inadequate. Especially, there is a limited number of studies regarding the mechanisms of C storage at post-mining areas during the remediation. The main aim of this study was to assess the C sequestration and the fate of carbon in sewage sludge amended and non-amended post-mining soils at differently advanced remediation techniques. The sub-aims of the study were: (1) how SOC sequestration changed between lignite post-mining soil, and limestone post-mining soil; (2) how SOC sequestration changed between remediation advancement at both studied areas; (3) what is the impact of post-mining remediation management practices on SOC sequestration for the pedoclimatic conditions; (4) how soil properties influenced the SOC sequestration; (5) what is the rate of soil remediation (microbial community, NPK, and Mg) and how does it interact with C capturing; and finally, (6) does the presence of heavy metals inhibit C storage in remediated post-mining soils at different remediation ages?
2. Materials and Methods
2.1. Study Site
In this study, two different post-mining areas located in the central Poland were selected. There were open-cast mining areas: limestone mining (S1), and lignite mining (S2) placed on the premises of existing and operating mines. At both mining areas, soil remediation was targeted at reforestation; however, these two facilities differed between the application of assisting remediation actions. The remediation at limestone post-mining areas (S1) was conducted using embankment collected during the mining activity. In turn, at the lignite post-mining areas (S2), sewage sludge was applied to the soil in a single dose at the beginning of remediation process. The sewage sludge originated from the municipal wastewater treatment plant serving the administrative buildings of the mine facility.
Limestone post-mining area (S1): The annual average temperature for this area is 9.8 °C. The hottest month of the year is July, with an average temperature of 20.1 °C. The lowest average temperature of the year occurs in the month of January and is about −1.0 °C. In this area, the average annual rainfall is 736 mm. The driest month is February, with 43 mm of precipitation. The heaviest rainfall occurs in July, with an average of 103 mm. The vegetation period is above 220 days. The area of the mine is located in a lowland area; however, opencast mining of raw material has contributed to a change in the topography of the area. This area is dominated by loamy sands, and poor dry soils requiring organic fertilization. The remediation of post-calcareous workings was managed by reforestation, and to a lesser extent by water reclamation. At the post-mining soil at S1, three forest plantation crops: Scots pine (Pinus silvestris), silver birch (Betula verrucose), and grey alder (Alnus incana) were planted. Each species shows a pioneering characteristic and they are widely used for phytoremediation purposes [11].
Lignite post-mining area (S2): The average annual temperature is 9.1 °C. With an average of 19.6 °C, July is the hottest month. January with an average temperature of −2.1 °C. It has the lowest average temperature of the year. The average annual rainfall is 707 mm. The driest month is February. There is a rainfall of 43 mm at this time. Most of the precipitation occurs in July, with an average of 96 mm. The vegetation period oscillates between 210–217 days. Similarly to the limestone post-mining area (S1) the area of the mine is located in a lowland area, locally changed by opencast mining of the raw material. In the area of the mine, soils formed on a sandy substrate—podzols, and pseudo-whites prevail. The recultivation of post-mining soil in area S2 is similar to area S1 and was subjected to reforestation, sports, and recreation, but a part of the areas will also be subjected to water reclamation in the future after prior preparation of the bottom. In this study, we investigated the areas subjected to reforestation. The reclamation of the soils was assisted by sewage sludge containing >10% solids. Before the application of sewage sludge to the remediated areas, it was mixed with seeds. This procedure allowed for the stabilization of seeds in the remediated soil. As a part of remediation, various plant seeds were applied, i.e., shamrock (Trifolium repens), meadow clover (Trifolium pretense), Italian ryegrass (Lolium multiflorum), English ryegrass (Lolium perenne), and creeping cattle (Agrostis stolonifera). The dose of fermented and hydrated sewage sludge was 30 Mg/ha. For reforestation purposes at the post-mining locations of the lignite mining site, the trees planted were: Scots pine 45% (Pinus silvestris), black alder 30% (Alnus glutinosa), and pedunculate oak 25% (Quercus robur).
The detailed characteristics of the studied post-mining areas are described in a previous publication [16].
2.2. Sample Collection
In the study, we included four selected areas at both post-mining areas (S1 and S2) with different remediation advancements. The selected remediation stages were close for both studied areas. The characteristics of the studied areas are shown in Table 1. The localization of the selected areas is shown in Figure 1.

Table 1.
The characteristic of studied areas.
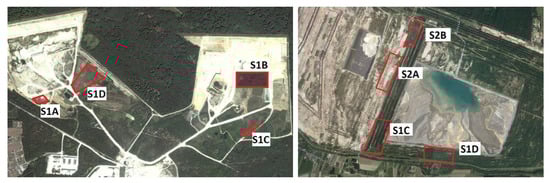
Figure 1.
Localization of selected study areas, and sampling scheme. Photos from satellite map. Source: Google Maps.
At both post-mining areas, we collected soil samples twice in the spring of April 2021 and April 2022. Each sampling was carried out under similar weather conditions. Before taking soil samples of the selected area, the topography of the areas was analyzed, and the sites for the collection of 12 primary soil samples were carefully determined. Soil samples were collected with soil from 0–20 cm soil depth, after the prior removal of dead plant parts (e.g., needles) at an equal distance between the sampling points. The average volume of each soil sample was 1 L. The scheme of the sampling is shown in Figure 1. For laboratory analyses, we prepared a representative sample to decrease the potential errors and ensure good accuracy in accordance with the principles of good laboratory practice. At each studied place, we conducted an in-situ soil gas exchange analysis using LCpro T® (ADC BioScientific, Hoddesdon, UK). The soil pot of the device was used for the study, enabling the control of its microclimate and the analysis of the selected soil parameters. During the study, the parameters describing the soil gas exchange and the net carbon dioxide emissions from the soil were measured.
The soil respiration Ce was calculated according to the equation:
where “u” is molar air flow [mol/s], and “Δc” is the difference in the concentration of CO2 in the chamber corrected to the proper dilutions [µmol/mol].
Ce = u (−Δc) [µmol/s]
The net carbon footprint from the soil (NCER) was calculated using the equation:
where “us” is a molar flow of air per square meter of soil, mol m−2 s−1, and “Δc” is the difference in the concentration of CO2 in chamber corrected to the proper dilutions [µmol/mol].
NCER = us(−Δc) [µmol/s m2]
2.3. Laboratory Analysis
The determination of the number of bacteria (mesophilic, psychrophiles, thermophiles), and fungi in the soil was made by a cultivation method in Petri dishes using the dilution techniques and distinguishing the favorable temperatures of cultivation for the selected microorganisms. Before microorganism cultivation, 1 g of fresh soil was added to the sterile 9 mL phosphate saline buffer (PBS), and shaken for 2 h at 200 rpm. For bacteria cultivation, we used a sterile Luria Broth (LB) medium, and for fungi we used a sterile Sabouraud medium. The temperature of cultivation for microorganisms was 36 °C for mesophiles, 45 °C for thermophiles, 15 °C for psychrophiles, and 25 °C for fungi. Each cultivation was conducted for 24 h, and after this period, we calculated the number of grown colonies considering only samples with countable numbers of colonies.
For physio-chemical soil analyses, samples were initially air-dried, ground, and passed gently through a <2 mm sieve. Absolute dry matter, and hygroscopic water content were measured using the method of Kabała and Kaczerwska [28]. Loss of ignition (LOI) was measured according to the method of Krogstad [29]. The pH was measured in H2O and in 1 M KCl solutions with a laboratory pH-meter (Elmetron Cp-401, Thane, India) in compliance with ISO 10390:2005. The total carbon (TC) was measured in agreement with the Polish standard PN-ISO 10694:2002 using a Multi N/C H 1300 Analityk Jena analyzer after dry combustion. The organic carbon content was determined with a Tyurin method [30]. The active carbon (permanganate oxidizable carbon, POXC) was determined in accordance with the methodology previously described by Weil et al. [31]. The determination of the calcium carbonate content was made by the volumetric Scheibler method using a Scheibler apparatus [32]. The total Kjeldahl nitrogen (TN) was determined according to the Polish standard PN-ISO 10694:2002 after mineralization with 95% H2SO4. The Egner-Reihm method was used for the determination of total phosphorus (TP) [28]. The hydrolytic acidity and the sum of basic cations were determined with a modified Kappen method [28] to calculate the sorption capacity. The concentration of selected elements (K, Mg, Cd, Cr, Pb, Zn) in the soils was measured with the ICP-OES (SPECTRO ARCOS II) apparatus after mineralization with 95% H2SO4 and a mixture of catalysts: K2SO4 and CuSO4 according to the Polish Standard PN-ISO 11047:2001. The selection of heavy metals for measurement in this study was based on their potential toxicity and law regulations for soil quality. Cd, Cr, Pb, and Zn as the most toxic and occurring in exceeding concentration (detected from previous study) in tested soils threatened by industrial activity were selected for monitoring under this study.
2.4. Statistical Analysis
Each soil analysis. Triplicate samples were used to ensure the precision, quality, and reliability of the results. Statistical analysis was conducted using Origin 8 Pro software. Results achieved in this study were expressed as mean values with a standard error. The differences between means were determined by one-way analysis of variance (ANOVA) and the Tukey’s test, with a level of significance p < 0.05. The Tukey’s test was used for the samples differing in the remediation advancement at the same sampling period for one of the tested post-mining areas (S1, and S2).
3. Results
3.1. Physicochemical Characteristics of Soils
For the limestone post-mining soil, the sorption capacity increased with the remediation advancement stage in comparison to the soil remediated for the shortest period for both sampling periods (Table 2). It was also seen that the sorption capacity in the soil remediated for the shortest (S1A-1, S1A-2) period increased after one year, while in the rest of the studied areas, it decreased slightly. In contrast to limestone post-mining soils, a decrease in sorption capacity along with remediation advancement for both sampling for the lignite post-mining soils was observed. However, we also observed an increase in the sorption capacity of the soil remediated since 2019 (S2A-1, S2A-2), and since 2013 (S2A-1, S2A-2) after one year, while for the soil remediated since 2007 (S2C-1, S2C-2) and since 2002 (S2D-1, S2D-2) it decreased.
Table 2.
Sorption capacity, and soil pH for the studied soils. S1: soil from the limestone open-cast mining remediated with embankment; S2: soil from the lignite open-cast mining remediated with sewage sludge; subsequent letters A–D mean different remediated areas located at the same mine site; subsequent numbers mean different sampling periods; 1: spring 2021, 2: spring 2022. Mean values ± SD, n = 3. Different letters in the columns indicate significant differences between tested treatments (p < 0.05) according to Tukey’s test. Small and capital letters indicate separate analyses for both sampling soils (capital letters indicate the tests between soils collected in 2021, small letters in 2022).
The pH value for limestone post-mining soil oscillated around the value of 7.50 (Table 2). We did not observe any statistically significant changes in pH value between different soil remediation advancement stages for both sampling in limestone post-mining soil. Similarly, for lignite post-mining soil the pH value was between 7.3 and 7.8.
Soil temperature influences soil respiration and as a consequence alters organic matter stability and soil C sequestration. The temperature of the soil at the limestone post-mining site for both sampling and in situ analysis was quite low and reached about 5.5 °C (Figure 2). The temperature of the soil was slightly higher in spring 2022 in comparison to spring 2021. The temperature of the soil at the lignite post-mining site was similar for each studied soil and both time periods—about 6.0 °C.
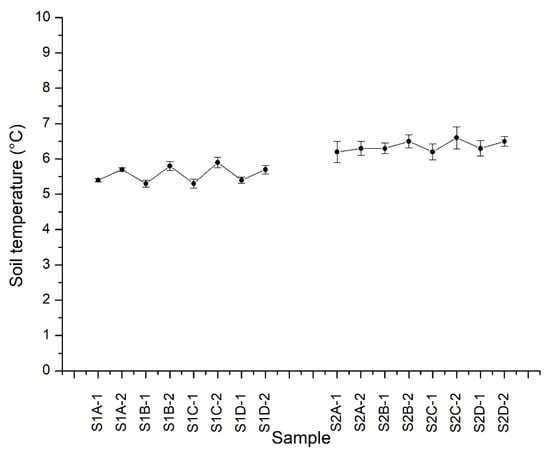
Figure 2.
The soil temperature in the studied areas during sampling, and in situ analysis. S1: soil from the limestone open-cast mining remediated with embankment; S2: soil from the lignite open-cast mining remediated with sewage sludge; subsequent letters A–D mean different remediated areas located at the same mine; subsequent numbers mean different sampling periods; 1:spring 2021, 2:spring 2022. Mean values ± SD, n = 3.
3.2. Chemical Composition
Beside carbon, nitrogen is an essential element determining soil quality. The nitrogen enhances primary productivity and consequently promotes the SOC storage. A percentage of the content of nitrogen (N) in the limestone post-mining soils (S1) did not show a clear tendency. We noticed a sizable decline in the soil remediated since 2014 (S1B-1, and S1B-2) for both sampling in comparison to the soil remediated since 2019 (properly S1A-1, S1A-2) (Table 3). Then, in the first sampling, we noticed a high rise in nitrogen content for soil remediated since 2008 (S1C-1) in comparison to the soil remediated since 2014 (S1B-1), followed by a slight decrease in the soil remediated since 2002 (S1D-1). For the second sampling, we observed a decrease in total N in the soil remediated since 2007 (S1C-2) in comparison to the soil remediated since 2013 (S1B-2). However, in the soil remediated since 2002 (S1D-2), we observed an increase in total N in comparison to the soil remediated since 2008 (S1C-2). Therefore, for the soil remediated since 2019 (S1A-1, S1A-2), and since 2014 (S1B-1, S1B-2), we observed a large increase in total nitrogen content after a one-year period, while for the soil remediated since 2008 (S1C-1, S1C-3) and since 2002 (S1D-1, S1D-2), we observed a decrease in nitrogen content in the soil by comparing the two sampling periods. For the lignite post-mining soil in spring 2021 (first sampling), we observed an increase in total nitrogen for the soil remediated since 2013 (S2A-1) in comparison to soil remediated since 2019 (S2A-1). For the soil remediated for a longer period—since 2007 (S2C-1), and since 2002 (S2D-1), we observed a decrease in comparison to the soil remediated since 2013. The nitrogen content in the soil remediated since 2002 (S2D-1) was lower than in the soil remediated for the shortest (S2A-1) period. Therefore, in the second sampling (spring 2022), we noticed that the concentration of nitrogen was increased in the soil remediated since 2013 (S2B-2) in comparison to the soil remediated for the shortest (S2B-1) period. We observed the lowest concentration of N in the soil remediated since 2007 (S2C-2). In the soil remediated since 2002 (S2D-2), the N concentration was much higher in comparison to the soil remediated since 2007 (S2C-2). While between the different soil remediation advancement stages, we observed a high N content fluctuation. After a one-year period, we noticed clear changes in N within the studied soils. For each tested soil, we observed an increase in the total N concentration after a one-year period.
Table 3.
Chemical composition of the studied soils. S1: soil from the limestone open-cast mining remediated with embankment; S2: soil from the lignite open-cast mining remediated with sewage sludge; subsequent letters A–D mean different remediated areas located at the same mine site; subsequent numbers mean different sampling periods; 1: spring 2021, 2: spring 2022. Mean values ± SD, n = 3. Different letters in the columns indicate significant differences between tested treatments (p < 0.05) according to Tukey’s test. Small and capital letters indicate separate analyses for both sampling soils (capital letters indicate the tests between soils collected in 2021, small letters in 2022).
Calcium carbonate is considered the most common form of carbon in soil, which makes it important for the understanding of the C cycle in the soil. In our study for the limestone post-mining area, we observed an increase in the concentration of CaCO3 in the soils along the remediation advancement stages for the first sampling (Table 3). In the second sampling, CaCO3 concentration increased for the soil remediated since 2014 (S1B-2) and 2008 (S1C-2), while in the soil remediated since 2002 (S1D-2) the concentration of CaCO3 decreased in comparison to the soil remediated for the shortest period (S1A-2). Therefore, after one year, the concentration of CaCO3 in the soil remediated since 2019 (S1A-1, S1A-2) increased, while it decreased for the rest of the studied soils. For the lignite post-mining soil, the highest concentration of CaCO3 was found in the soil remediated since 2002 in the second sampling (S2S-2), and the lowest for the soil remediated since 2007 in the second sampling (S2C-2). After one year, the increase in CaCO3 concentration was observed in each studied soil.
Phosphorus is an essential element for plant growth and its concentration in soil influences soil productivity, and as a consequence, also the soil’s ability to sequester carbon. For the limestone post-mining soil under both soil sampling times, the highest P2O5 concentration was for the soil S1A-1 and S1A-2, and for the rest of the soil samples it was much lower in comparison to the soil remediated since 2019 (S1A-1; S1A-2) (Table 3). Therefore, we observed that after one year, the P2O5 concentration in the soil remediated since 2019 (S1A) decreased, while in the rest of the studied soils it increased in comparison to the first sampling. For the lignite post-mining soil for the first sampling, the P2O5 concentration was highest for the soil remediated since 2013 (S2B-1) and the lowest for the soil remediated since 2002 (S2D-1). In the second sampling, the tendency in P2O5 concentration was the same as in the first sampling. Therefore, we noticed that after one year, the P2O5 concentration increased slightly in each studied soil.
For the limestone post-mining soil, we observed an increase in K concentration in each soil along with remediation advancement stages for both sampling, with a minor exception for the soil remediated since 2014, second sampling (S1B-2) (Table 3). It suggests that the concentration of K in the soil decreased after one year in comparison to the first sampling, except for soil remediated since 2014. For the lignite post-mining soil, the concentration of K decreased with the remediation advancement stages; however, in contrast to the limestone post-mining soil, after one year, the concentration of K in the soil significantly increased by 4–6 times for the soil remediated since 2007 (S2C-1, S2C-2).
For the limestone post-mining soil, we noticed that the Mg concentration was highest in the soil remediated since 2014 for both sampling (S1B-1, S1B-2), but the concentration of Mg decreased after a one-year period in the soil remediated since 2013, 2007, and 2002. In contrast, in the soil remediated for the shortest period, Mg increased after 1 year. For the lignite post-mining soil, we noticed a clearer tendency and gradual decline in Mg concentration with the advancement of remediation for both sampling. Therefore, we observed a large increase (the highest for S2D-1, S2D-2—4.2 times) in the concentration of Mg after 1 year in comparison to the first sampling for each studied soil.
For the limestone post-mining soil, we observed that Cd concentration increased in soil remediated since 2019 (S1A-1, S1A-2) and 2014 (S1B-1, S1B-2), while in the soil remediated for a longer period, it significantly decreased (Table 4). For the lignite post-mining soil, an opposite tendency was observed.
Table 4.
Selected heavy metals in the studied soils [mg kg−1]. S1: soil from the limestone open-cast mining remediated with embankment; S2: soil from the lignite open-cast mining remediated with sewage sludge; subsequent letters A–D mean different remediated areas located at the same mine site; subsequent numbers mean different sampling periods; 1: spring 2021, 2: spring 2022. Mean values ± SD, n = 3.
In the limestone post-mining soil, Cr in the soil fell down significantly after 1 year. For the lignite post-mining soil, a decrease in heavy metal (Cr and Zn) concentration in the soil after a one-year period was observed, except for soil remediated since 2013 (S2B-1, S2B-2).
After one year, the Pb and Zn concentration in the limestone post-mining soil was higher only in the soil remediated since 2019 (S1A-1, S1A-2). In each remaining studied soil, the Pb, and Zn concentrations decreased. In contrast, the lignite post-mining soil showed lower Pb, and Zn concentrations in each studied soil after 1 year, except for the soil remediated since 2013: S2C-1, S2C-2.
3.3. Soil Carbon
Forest soils are considered a carbon sink in contrast to other ecosystems. We observed large fluctuations in the total carbon (TC) concentration in the soil, both during a one-year period at each remediation site, but also between different remediation advancement stages. For limestone post-mining soil, in the first sampling period (spring 2021), we noticed a slight decrease in TC for the samples collected from the area remediated since 2014 (S1B) in comparison to the area remediated since 2019 (S1A) (Table 4). Nevertheless, in the area remediated since 2008 (S1C) and 2002 (S1D) we noticed no statistically significant differences in TC in comparison to soil remediated since 2019 (S1A). The highest TC concentration was in the soil remediated since 2008 (S1C) for both sampling periods. In the second sampling period (spring 2022), we noticed a similar tendency for each tested area in comparison to the first sampling period (spring 2021). Therefore, we noticed a high increase in TC after a one-year period at the soil remediated since 2019 (S1A-2) in comparison to the initial sampling period (S1A-1). For each tested soil we noticed an increase in TC after one year; however, for the longest remediated soil, we noticed the lowest increase indicating a stabilization of the soil. For the lignite post-mining soil, TC showed a higher fluctuation between different remediation advancement stages, similar for both sampling periods (spring 2021, spring 2022). We noticed a highly significant increase for the soil remediated since 2013 (S2B) in comparison to the soil remediated since 2019 (S2A). Next, we observed a large decrease in TC for the soil remediated since 2007 (S2C) in comparison to the soil remediated form 2013 (S2B). Therefore, a slight decrease in TC for the soil remediated since 2002 (S2D), in comparison to the soil remediated since 2007 (S2C) was noticed. The TC concentration in the longest remediated soil (S2D) was lower than in the shortest remediated soil (S2A). For the soil remediated since 2013 (S2B), since 2007 (S2C), and since 2002 (S2D) for both sampling periods we noticed an increase in TC; however, in the longest remediated area, we noticed the lowest concentration of TC for both sampling periods. Each tested soil showed a similar TC dynamic in a one-year period, indicating a slight growth in TC.
Soil organic carbon plays a key role for remediation purposes and consists of a good indicator for the quality of soil and soil management. Soil organic carbon is an essential characteristic of soil productivity and functionality. For the lignite post-mining soil, for the first sampling period (spring 2021), we noticed a decrease in SOC for the soil remediated since 2014 (S1B-1) in comparison to the soil remediated from 2019 (S1A-1) (Table 5). Then, we noticed a large increase in SOC in the soil remediated since 2008 (S1C-1) in comparison to the soil remediated since 2014 (S1B-1), followed by its decrease in the soil remediated the longest (since 2002, S1D-1) in comparison to the soil remediated since 2008 (S1C-1). For the second sampling period (spring 2022), we observed a slight linear decrease in the percentage content of SOC in soil for all the tested areas, and all soil remediation advancement stages. In the lignite post-mining soil, the SOC content in the soil decreased during the remediation period. However, we observed that after one year, the SOC content increased highly in the soil remediated since 2019 (S2A-1 in comparison to S2A2), and since 2014 (S2B-1 and S2B-2). For the soil remediated since 2008 (S2C-1, S2C-2) and 2002 (S2D-1, S2D-2), the SOC content remained at the same level between the sampling periods. For the lignite post-mining soil, we noticed that the SOC content increased along the soil remediation advancement stage for each of the tested soils and for both sampling periods. We observed that the SOC increased linearly in the soil remediated since 2013, 2007, and 2002, in comparison to the soil remediated since 2019. The SOC tendency is the same for both sampling periods. Therefore, we noticed a large increase in SOC in the same tested soils after one year. While TC decreased after one year, SOC increased for all different soil remediation advancement stages (S2A, S2B, S2C, S2D).
Table 5.
Total carbon, soil organic carbon, and loss of ignition in the studied soils. S1: soil from the limestone open-cast mining remediated with embankment; S2: soil from the lignite open-cast mining remediated with sewage sludge; subsequent letters A–D mean different remediated areas located at the same mine site; subsequent numbers mean different sampling periods; 1: spring 2021, 2: spring 2022. Mean values ± SD, n = 3. Different letters in the columns indicate significant differences between tested treatments (p < 0.05) according to Tukey’s test. Small and capital letters indicate separate analyses for both sampling soils (capital letters indicate the tests between soils collected in 2021, and small letters in 2022).
The loss of ignition (LOI) refers to the content of organic matter in the soil and it is an important indicator of soil quality. For the lignite post-mining soil, no clear change in the LOI was observed (Table 5). For all the studied areas, the LOI was very low, and in many cases did not exceed 1%. The highest LOI was observed for the soil remediated since 2008 in the second sampling (S1C-2). The changes in LOI after one year were not statistically significant. For lignite post-mining soils, the LOI was even lower than in lignite post-mining soils; however, here we observed slightly higher changes in the LOI over one year. For the studied soils, the LOI increase in the soil remediated for the shortest period (S2A-1, S2A-2) was three times higher than the longest remediated soil (S2D-1, S2D-2).
A negative net CO2 emission rate (NCER) is considered important for climate change scenarios. In our study, we observed a net negative CO2 emission rate for each studied soil, except for the lignite post-mining soil remediated since 2019 in the first sampling (S2A-1) (Figure 3). Therefore, for the lignite post-mining soil, the NCER decreased with the remediation advancement stage for each studied soil. After one year, a significant decrease in the NCER for the soil remediated since 2019 (S1A1-1, S1A-2) and since 2014 (S1B-1, S1B-2) was noticed for the soil remediated since 2008 (S1C-1, S1C-2), and since 2002 (S1D-1, S1D-2) we noticed a slight increase. However, it was not statistically significant. For the lignite post-mining soil, we also observed decreased NCER values with remediation advancement stages for both in situ analyses. In the soils with the most advanced remediation (remediated the longest), the NCER was the most negative. Therefore, we observed a significant decrease in NCER after one year for each studied soil, even doubled for soil remediated since 2013 (S2B-1, S2B-2). The dynamic changes in the NCER slowed down with the remediation advancement stage.
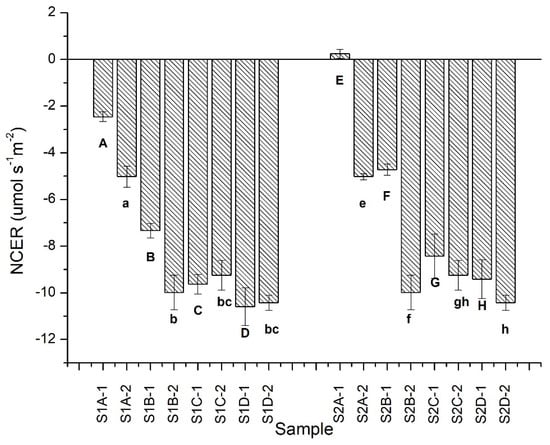
Figure 3.
Net CO2 emission rate (NCER) in the studied soils. S1: soil from the limestone open-cast mining remediated with embankment; S2: soil from the lignite open-cast mining remediated with sewage sludge; subsequent letters A–D mean different remediated areas located at the same mine; subsequent numbers mean different sampling periods; 1: spring 2021, 2: spring 2022. Mean values ± SD, n = 3. Different letters with bars indicate significant differences between tested treatments (p < 0.05) according to Tukey’s test. Small and large letters indicate separate analyses for both sampling soils.
Soil respiration (Ce) indicates soil’s ability to release CO2 into the atmosphere. In our study, we noticed negative soil respiration for both studied post-mining areas (Figure 4). In the limestone post-mining soil, we noticed that soil respiration decreased or remained stable with the remediation advancement stage for both in situ analyses. Therefore, after a one-year period, soil respiration decreased for all the studied soils. For the lignite post-mining soil, we observed a similar tendency of Ce for both in situ analyses. The soil respiration was higher in the soil remediated since 2013 (S2B-1, S2B-2) in comparison to the soil remediated since 2019 (S2A-1, S2A-2). For the rest of the studied soils, the Ce decreased significantly compared to the soil remediated for the shortest (S2A-1, S2A-2) period. The soil respiration was similar for the soil remediated since 2007 (S2C-1, S2C-2), and since 2002 (S2D-1, S2D-2). Therefore, similar to the limestone post-mining soils, we observed that after a one-year period the soil respiration decreased or remained stable.
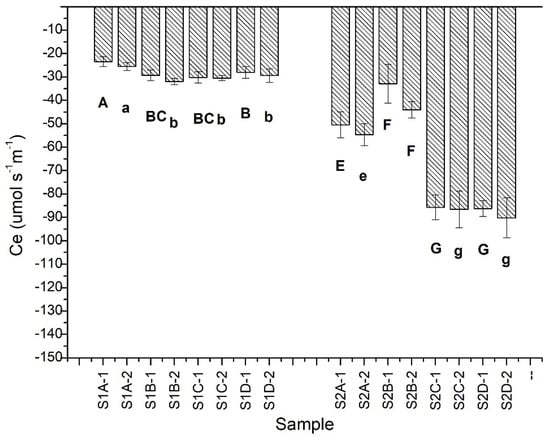
Figure 4.
Soil respiration Ce in the studied soils. S1: soil from the limestone open-cast mining remediated with embankment; S2: soil from the lignite open-cast mining remediated with sewage sludge; subsequent letters A–D mean different remediated areas located at the same mine; subsequent numbers mean different sampling periods; 1: spring 2021, 2: spring 2022. Mean values ± SD, n = 3. Different letters with bars indicate significant differences between tested treatments (p < 0.05) according to Tukey’s test. Small and large letters indicate separate analyses for both sampling soils.
Permanganate-oxidizable carbon (POXC) is an essential and sensitive tool to measure a soil carbon alternation. In our study, for the limestone post-mining soil, we observed a decrease in the concentration of POXC along the soil remediation advancement stage (Figure 5. The concentration of POXC in both sampling was about four times higher in the soil with the shortest remediation (S1A-1, S1A-2) period in comparison to other more advanced remediating soils. Therefore, after one year (spring 2022) in each studied soil, we observed an increased POXC concentration in comparison to spring 2021. For the lignite post-mining soils, the alternations in POXC are not clear along the soil remediation advancement stage but are the same for both samplings. The POXC was highest for the soil remediated since 2007 (S2C-1, S2C-2), and the lowest for soil remediated since 2002 (S2D-1, S2D-2). Therefore, we observed that the POXC in the soil remediated since 2013 (S2B-1, S2B-2) was statistically significantly higher in comparison to the soil remediated for the shortest (S2A-1, S2A-2) period. In contrast to the limestone post-mining soil, it was also noticed that after one year, the POXC concentration in the lignite post-mining soils decreased or remained at the same level in comparison to the first sampling.
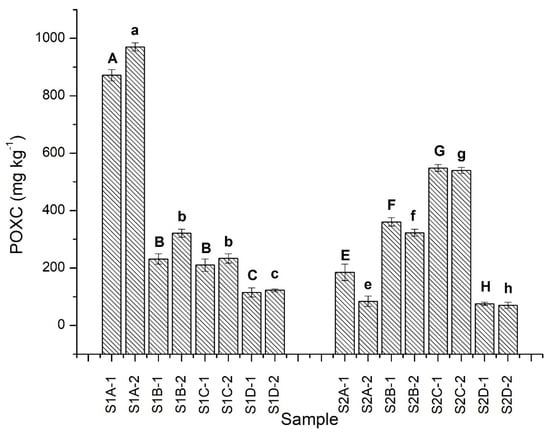
Figure 5.
Permanganate-oxidizable carbon (POXC) in the studied soils. S1: soil from the limestone open-cast mining remediated with embankment; S2: soil from the lignite open-cast mining remediated with sewage sludge; subsequent letters A–D mean different remediated areas located at the same mine; subsequent numbers mean different sampling periods; 1: spring 2021, 2: spring 2022. Mean values ± SD, n = 3. Different letters above the columns indicate significant differences between tested treatments (p < 0.05) according to Tukey’s test. Small and large letters indicate separate analyses for both sampling soils.
The C/N ratio is a common indicator for C dynamics in soils and especially in monitoring C sequestration. For the limestone post-mining soil, we observed a statistically significant decrease in the C/N ratio along the remediation advancement stage in comparison to the soil remediated for the shortest period for both samplings (S1A-1, S1A-2) (Figure 6). Therefore, after one year, the C/N ratio slightly decreased or remained at the same level in comparison to the first sampling for each studied soil. In contrast, for the lignite post-mining soil, an increase in the C/N ratio along the remediation advancement stage was observed. The C/N increased nearly four times in both samplings in the soil remediated since 2013 (S2B-1, S2B-2), since 2007 (S2C-1, S2C-2), and since 2002 (S2D-1, S2D-2), in comparison to the soil remediated since 2019 (S2A-1, S2A-2).
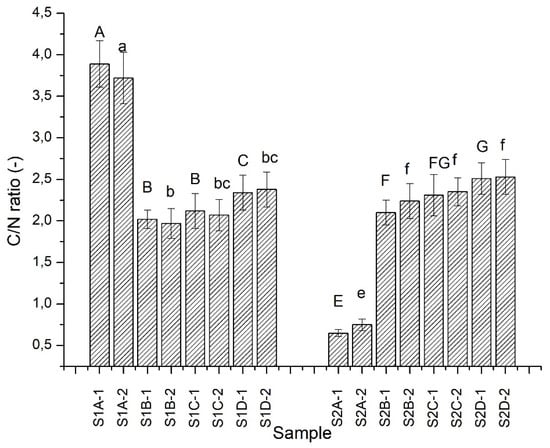
Figure 6.
C/N ratio in the studied soils. S1: soil from the limestone open-cast mining remediated with embankment; S2: soil from the lignite open-cast mining remediated with sewage sludge; subsequent letters A–D mean different remediated areas located at the same mine; subsequent numbers mean different sampling periods; 1: spring 2021, 2: spring 2022. Mean values ± SD, n = 3. Different letters with bars indicate significant differences between tested treatments (p < 0.05) according to Tukey’s test. Small and large letters indicate separate analyses for both sampling soils.
3.4. Soil Microbial Community
Microorganisms are important for soil functionality, quality, and productivity, and therefore, they are essential for C cycling. In our study, the mesophiles were the bigger group of microorganisms in the studied soils. We observed that for the limestone post-mining soil, the community of mesophilic bacteria decreased in the soil remediated since 2014 (S1B-1) in comparison to the soil remediated since 2019 (S1A-1) (Figure 7A). It showed that in the soil remediated since 2008 (S1C-1), the number of mesophiles was higher in comparison to other soil remediation advancement stages. The lowest number of mesophiles was noticed for the longest remediated soil (S1D-1). For the second sampling, the number of mesophiles was lower compared to the first sampling. For the lignite post-mining soil, we noticed a much higher number of mesophiles in the soil remediated for the shortest period for both samplings (S1A-1, S1A-2). We also noticed that the lowest number of mesophiles for the soil remediated since 2013 for both samplings (S2B-1, S2B-2). Generally, the number of mesophiles decreased for each studied soil after one year.
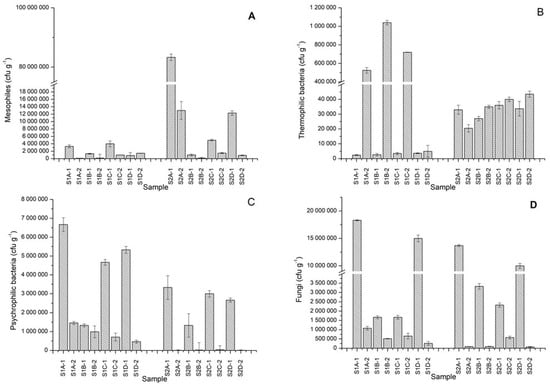
Figure 7.
The community of mesophiles (A), thermophiles (B), psychrophiles (C), and fungi (D) in the studied soils. S1: soil from the limestone open-cast mining remediated with embankment; S2: soil from the lignite open-cast mining remediated with sewage sludge; subsequent letters A–D mean different remediated areas located at the same mine; subsequent numbers mean different sampling periods; 1: spring 2021, 2: spring 2022. Mean values ± SD, n = 3.
The thermophilic bacteria were the lowest number for each studied soil (Figure 7B). However, we noticed that in the limestone post-mining soil, their number was slightly increased with the period of remediation. We observed a significant increase in the number of thermophilic bacteria for the soil remediated since 2019 (S1A-1, S1A-2), since 2014 (S1B-1, S1B-2), and since 2008 (S1C-1, S1C-2) after one year. For the soil remediated since 2002 (S1D-1, S1D-2), this increase was not so distinct in comparison to others. For the lignite post-mining soil, the number of thermophilic bacteria in the first sampling was the lowest for soil remediated since 2013 (S2B-1), and the highest for the soil remediated since 2007 (S2C-1). For the second sampling, we observed the highest number of thermophilic bacteria for the soil remediated since 2002, compared to the soil remediated since 2007 (S2C-2). We also observed that the number of thermophilic bacteria increased after one year in all the studied soils, except the soil remediated since 2019 (S2A).
The amount of psychrophilic bacteria was higher for the limestone post-mining soil in comparison to the lignite post-mining soil (Figure 7C). The highest number of psychrophilic bacteria for the limestone post-mining soil was observed for the soil remediated since 2019 in the first sampling (S1A-1), and the lowest for the soil remediated since 2002 for the second sampling (S1D-2). For the lignite post-mining soil, we observed much higher numbers of psychrophilic bacteria for the soils in the first sampling. For each studied soil, a significant decrease in the number of psychrophilic bacteria after a one-year period was observed
For fungi, we did not notice any clear tendency in the first sampling in the limestone post-mining soil (Figure 7D). However, we observed a much higher number of fungi in the soil remediated since 2019 (S1A-1) and since 2002 (S1D-1) in comparison to other soils. For the second sampling, we observed a slight decrease in the number of fungi along the remediation advancement stages. Therefore, after a one-year period, the number of fungi significantly decreased in each studied soil. For the lignite post-mining soil in the first sampling, we noticed a decrease in the number of fungi with remediation advancement stages for the soil remediated since 2013 (S2B-1) and since 2007 (S2C-1) in comparison to the soil remediated the shortest (S2A-1). For the soil remediated since 2002, this number decreased but still remained at quite a high level. For the second sampling, the highest number of fungi was for the soil remediated since 2007 (S2C-2). Therefore, it was shown that in the second sampling the number of fungi was much lower in comparison to the first sampling.
4. Discussion
4.1. Physicochemical Characteristics of Soil
Soil’s physico-chemical condition directly influences the soil capability for C capture and stabilization. In our study, we observed that sorption capacity decreased in the soil remediated with sewage sludge (e.g., 14.31 cmol(+) kg−1 for S2A to 6.07 cmol(+) kg−1 for S2D in first sampling), while in the soil remediated with embankment it increased highly (e.g., 7.29 cmol(+) kg−1 for S1A to 22.22 cmol(+) kg−1 for S1D in first sampling). The addition of organic matter to post-mining soil influenced the sorption capacity; however, in the soil remediated since 2019 and since 2013, the sorption capacity increased after one year. While organic additives are considered to have a high sorption capacity [33], in this study we noticed decreased sorption capacity after the addition of sewage sludge, which is considered a soil amendment with easily labile organic compounds.
Therefore, the temperature of the soil during sampling and in situ analysis did not seem to highly influence the CO2 fluxes; however, other studies indicated that CO2 emissions are dependent on the soil temperature in unreclaimed soils [34]. Moreover, a positive correlation between the CO2 emission from the soil and higher events of rainfall is observed [35].
4.2. Impact of Soil Remediation on Chemical Composition
Total nitrogen is crucial for controlling plant growth and is a good indicator of soil quality [27]. The reforestation of limestone post-mining soil inducted with embankment showed increased N content after one year in the soil remediated since 2019 (S1A), and 2014 (S1B) from 5.31% to 8.46%, and from 2.72% to 5.64%, respectively. In the more advanced remediated soil S1C (2008) and S1D (2002), N content decreased caused probably by higher N uptake by plants (from 7.14% to 3.21%, and from 6.18% to 4.42%, respectively). In the lignite post-mining soil, reforestation caused increased N content with remediation age, but it decreased for the longest remediated soil. Moreover, after one year we noticed a slight decline in N content (e.g., from 2.28% to 2.04% for S2B). Our findings are in accordance with the TN decrease noticed by Zhang et al. [36] in remediated mine soils after 10–13 years of reclamation. Therefore, in our study, the remediation with embankment (S1) showed high fluctuations in TN, which cannot be explained at this juncture. In the two soils remediated for the shortest period, TN increased after one year (e.g., 5.31% to 8.46% for S1A), but it decreased at the more advanced remediation stages (remediation since 2008, and 2002) for instance from 6.18% to 4.42% for S1D. However, the remediation with sewage sludge showed a consistent gradual decrease in TN with the soil remediation advancement stage. Due to the reforestation practices at both post-mining areas, the TN fluctuations may be justified by increasing the plant uptake of N. The increase in TN noticed in our study is confirmed in other studies regarding the recultivation of post-mining areas. Our findings are in agreement with the studies of Ahirwal and Maiti [4] who found increased TN in the reclaimed soil in comparison to the unreclaimed soil. Other studies also reported a significant increase in TN in reclaimed soil in comparison to unreclaimed post-mining coal soils [27].
CaCO3 in soils is considered beneficial for soil deacidification, structure-formation, and improving microbial activity. Therefore, CaCO3 is considered a superhydrophobic filter in the soil [29]. CaCO3 reacts slowly in the soil, and thus it is preferred as a better liming source in comparison to CaO [37]. However, the presence of CaCO3 in the soil is strictly related to the bedrock located in the area [38]. Thus, the limestone post-mining soil showed a higher CaCO3 content in comparison to the lignite post-mining soil (e.g., 2.45% for S1B1 and 0.34% for S2B1). We observed decreased CaCO3 content in the limestone post-mining soil after one year for all the studied soils except the soil remediated for the shortest (S1A) period. The highest decrease in CaCO3 content after one year has been noticed for the most mature soil S1D which reached 58%. In contrast, the remediation with sewage sludge at the lignite post-mining soils resulted in an opposite trend, with increased CaCO3 content (the highest increase of 295% for S2D). A dual perspective of CaCO3 content fate in the reclaimed soils has been observed by other researchers. Segura et al. [39] noticed a lower content of CaCO3 in afforestation practices in comparison to cereal crops in the semiarid soils, while other studies [40] showed increased CaCO3 with the soil remediation age being the highest in the soil remediated for the longest period. They tested soil remediation with organic matter addition, liming, and other amendments in red soils rich in Fe oxides of different hybrid variations.
Therefore, the reforestation and different remediation techniques influenced P content in different ways. In our study, decreased available P along the remediation age in the reforested limestone post-mining soils remediated with embankment was observed. However, we observed an annual growth in P2O5 in each studied soil. The remediation of the lignite post-mining soil with sewage sludge amendment resulted in the increase of P2O5 concentration in soil for the two shorter remediated areas (from 0.28 mg kg−1 for S2A1, to 0.40 mg kg−1 for S2B1, and from 0.33 mg kg−1 for S2A2 to 0.42 mg kg−1 for S2B2), and decrease in the longer remediated soils (S2C, S2C) (from 0.31 mg kg−1 for S2C1 to 0.19 mg kg−1 for S2D1, and from 0.32 mg kg−1 for S2C2 to 0.22 mg kg−1 for S2D2). Our findings are in contrast to the previously conducted studies on soil remediation, which indicate a significant increase in P2O5 concentration after organic fertilizing [41]. A simillar observation in increased P2O5 content in the soil with a higher application dose of organic additive was reported by Zaeni et al. [24] which studied the influence of different compost doses (0%, 9%, 13%, and 17%) on soil quality. This disagreement with the previous studies may be associated with higher plant biomass and P incorporation to the plant biomass through higher P plant uptake.
In the studied remediation management of post-mining soils, we noticed a similar tendency in K and Mg concentration in the soil. These nutrients play an important role in setting seeds, and grains influencing strongly on soil plant biomass, and plant productivity [42]. In our study, the remediation of post-mining areas, both with embankment and with sewage sludge, contributed to the increase in K and Mg concentration with the remediation age with a minor exception. At the most advanced remediation stage, Mg concentration decreased for both limestone and lignite post-mining soils. Therefore, we observed a decrease in K, and Mg (up to 50% for K, and 23% for Mg at S1D) after one year for S1 (except S1A where K rose), and an increase in K, and Mg after one year for S1 (up to 400% for K, and Mg at S2D). The increase in K and Mg allows for the proper growth and development of plants in the soils under reforestation management.
Therefore, we noticed a strong influence of SOM on the concentration of heavy metals (HMs) in both studied soils. The remediation of the limestone post-mining soil with embankment (S1) resulted in increased SOC concentration causing sorption capacity and higher sorption of HMs. The annual decrease in HMs (Cd, Cr, Pb, Zn), e.g., for Cd from 0.84 mg kg−1 to 0.12 mgkg−1 for S2A, was probably associated with their immobilization by organic matter in the soils remediated for the longest period. The remediation advancement in the post-mining soil amended with sewage sludge resulted in a high decrease in HMs content in the soil. The remediation with sewage sludge not only contributed to the increase of organic matter, but it also allowed for a cleaning-up of the soil from a toxic element positively influencing soil properties and soil health. A similar influence of increased organic matter in the soil (including amendment with organic matter) was noticed previously by other researchers [43]. Other studies also indicated that reforestation may be a proper way to effectively decrease the soil contamination of HMs [44]. Thus, despite the many beneficial roles of reforestation on SOC and climate change, this recultivation method seems to be helpful for the alleviation of soil contamination in HMs.
4.3. Dynamic of Soil C under Soil Remediation
Soil management is of high relevance for the quality of the soil and its further functionality. Soil remediation is one of the most important soil management practices influencing soil properties, improving and restoring soil quality. Among degraded areas, post-mining soils are considered to contribute to increased CO2 emissions into the atmosphere. Lack of remediation activities in such areas would drive climate changes, and thus is of biggest concern for scientists, politicians, and society as a whole. Thus, remediation seems to be an inevitable element of the post-mining economy. Therefore, it has been previously noticed that well-managed soil remediation may contribute to lowering CO2 release from the soil and decreasing climate change. The remediation of degraded soils localized in the open-cast post-mining areas is difficult because of poor low soil fertility and extremally low organic matter content. The improvement in the soil properties of open-cast post-mining areas, similar to other degraded soils, is determined by the remediation management practice. In our study, we observed increased content of TC after one year in all the studied soils at both limestone post-mining soil and lignite post-mining soil remediated with sewage sludge. The highest increase in TC after one year has been observed for S1A reaching an increase of 71% for limestone post-mining soil, and of 11% at S2A for lignite post-mining area. A similar tendency of TC increase in the remediation of degraded soils using organic additives was noticed by Tregubova et al. [45] and by Placek et al. [11] after the addition of sewage sludge or compost. Our findings are in agreement with other studies indicating the increased TC concentration in mining soil under agricultural use, and the highest for the soil under the shortest (4 years) remediation period in comparison to the soil remediated for 7, 10, and 13 years [46]. However, in their study, a statistically significant increase in comparison to control was observed only in the soils remediated for 4 years.
In addition to TC, SOC content is also an important determinant for soil remediation. In our study, we noticed an increase or stabilization of SOC in the limestone post-mining soil remediated with embankment. The stabilization of SOC was observed for the soil with a higher remediation age (S1C, S1D) where the changes after one year were only at the level of 1%. The remediation of the lignite post-mining soil resulted in the increase of SOC among the soil remediation age—the highest for S2B where we observed an increase in SOC at the level of 387%. Our findings are consistent with the other study which also showed the increase of SOC as an effect of remediation activities [47]. Similar to our study, different remediation advancement stages influenced the increase in SOC concentration [40]. Therefore, similar studies regarding soil remediation with biosolids resulted in a higher SOC by >45% [48]. Another study indicated a decrease in SOC which resulted after cessation of biosolids application into the soil [26], while the other study also indicated an increased SOC content in the soil amended with different doses of compost, showing a higher increase in SOC with the higher dose of compost (17%) [24]. Our observations are in agreement with other studies which indicated higher SOC accumulation in soils with remediation age under reforestation [13]. Moreover, we noticed an interesting tendency in reforested lignite post-mining soil remediated with sewage sludge. While a TC decreased with remediation age, the SOC content showed an increasing tendency suggesting enhanced formulation of organic C compounds in the remediated soil. In the limestone post-mining soil remediated with embankment, we found an opposite tendency with increased TC and decreased SOC with remediation age.
The remediation method strongly influences the loss of ignition. We noticed that in the soil remediated with embankment (S1) the LOI values varied to a lower extent in comparison to the soil remediated with sewage sludge (S2). In this remediation technique, LOI increased 3.5 times for the soil remediated since 2002 (S2D-1) in comparison to the soil remediated since 2019 (S2A-1). Such high variations in LOI were not noticed for the soil remediated with embankment. It was probably caused by the application of organic additives with sewage sludge causing variations in the soil through improved soil quality. Similarly to our study, Placek et al. [11] observed that remediation of the post-mining area with the application of organic fertilizers results in a slight increase in LOI. The level of this increase in their study was similar to ours. Other studies also compared to our findings and indicated the increase in LOI after post-mining soil reclamation [49].
The carbon footprint in remediated post-mining soils, the ability of the soil to sequester C, and future perspectives to promote the mitigation of climate change are determined by several indicators including the net CO2 emission rate (NCER). This is the tool that indicates the balance between the amount of CO2 fluxes released into soil to the amount of CO2 removed from the atmosphere. For both studied post-mining soils, we noticed a negative CO2 emission from the soil under remediation, and NCER further decreased after one year. The highest NCER for S1 was noticed for S1A (−2.5 µmol s−1 m−2), and the lowest for the S1D (−11 µmol s−1 m−2), while for S2 the highest were about -5 µmol s−1 m−2 for S2A, and the lowest—11 µmol s−1 m−2 for S2D. Such negative values of NCER and negative Ce indicate the removal of CO2 from the atmosphere. Thus, it indicates that more CO2 is absorbed from the atmosphere than that which is released by the studied soil. This is a perfect situation for C sequestration and mitigation of climate change. Such NCER and Ce values that we observed in this study contribute to zero net CO2 emission at the regional scale as laid down under the Paris agreement [50]. There are very few similar studies regarding CO2 emission from post-mining soils under recultivation; however, some are similar to our findings and reported a decreased CO2 emission rate from the soil after restoration [51]. Therefore, related studies found a positive correlation between CO2 emission, and soil air porosity, and a negative correlation between CO2 emission and soil penetration resistance after tillage [52]. Our findings are in accord with the studies on the differences between reforestation, and grasslands. The mentioned study reported lower emissions of CO2 under reforestation as compared to grasslands. This improves the positive feedback of remediation driven by reforestation. In turn, other studies indicated a reverse trend of CO2 emission and showed that in unreclaimed mining soil, the emission of CO2 was lower in comparison to reclaimed mining soil and forest soil [34]. However, in this study, the emission of CO2 from forest soil was much lower in comparison to the reclaimed post-mining soil. It may suggest the similarity with our study, where we found lower emissions in the areas with a longer remediation time, and thus with more forestry landscape. Other studies observed that CO2 efflux is higher under higher tree cover, which is contrary to our reports [53]. The study on the reclaimed mine soil indicated a four-times higher CO2 flux at reclaimed mine soil compared to the natural forest soils after 11 years of reclamation indicating its important role to offset the increased emission of CO2 into the atmosphere [34].
Carbon footprint is also determined by the content of active carbon (POXC) in the soil. The POXC is the labile fraction of C that is sensitive to decomposition. In our study, we noticed a slight increase in POXC in the limestone post-mining soil remediated with embankment after one year. The highest POXC for limestone post-mining soil was observed for S1A and ranged about 900 mg kg−1 over one year. However, the POXC content significantly decreased with remediation age as compared to those remediated for the shortest (since 2019) period, reaching about 100 mg kg−1 for S1D. In the lignite post-mining soils remediated with sewage sludge, the POXC content showed a decreasing trend or remained stable after one year. However, for the soil remediated for the longest (since 2002) period, the POXC concentration was the lowest (55 mg POXC kg−1 for S2D). The increase in POXC for the post-mining soil remediated with sewage sludge may have been caused by the wood residue, as previously reported [54]. The active fraction of carbon in the soil is not beneficial for carbon sequestration; however, it may drive microbial activity influencing soil quality.
Both C and N are considered to help humankind to strive with climate change [55]. The C/N ratio well characterizes the transformation of SOC in the soil. The C/N ratio was, generally, lower in the post-mining soil remediated with sewage sludge. The highest C/N ratio was for the lignite post-mining soil remediated with embankment at the shorter remediation time (3.89 for S1A1, and 3.71 for S1A2), and it decreased in the longer remediated soils (2.33 for S1D1, and 2.37 for S1D2). Rumpel et al. [56] showed a decreasing tendency in the C/N ratio with the soil remediation advancement stage. Therefore, Shi et al. [57] noticed the highest C/N ratio of 14,98 for the forestation of baren land. The lower C/N ratio was noted for the forestation of grassland (9.68), being further lower for the forestation of croplands (7.72). It is suggested that a higher C/N ratio decreases the soil’s ability to sequester SOC [21]. Other studies indicated a lower C/N ratio under reforestation and observed a reverse correlation between the C/N ratio and SOC sequestration [21].
4.4. Soil Microbial Community Fluctuations
Therefore, the remediation of post-mining soils altered the composition of the microbial community in the soil. In most cases, in the lignite post-mining soil, the diversity of microorganisms decreased, with a prevailed increase in thermophilic bacteria in the second sampling. The number of fungi decreased after a one-year period for each studied area. A similar change in the microbial community was noticed in the soil remediated with sewage sludge; however, the increase in the number of fungi was not as large as observed in the limestone post-mining soil. The alternation in the microbial community in both studied areas would be strongly affected by environmental conditions.
5. Conclusions
A positive C feedback in the remediated soil was observed with increased SOC in the post-mining soils after one year by implementing climate-friendly forest management practices in the studied post-mining soils; both limestone and lignite post-mining soils. The soil remediation by reforestation amended with sewage sludge contributes to higher SOC sequestration leading to the mitigation of climate change. The negative net CO2 emission rate (NCER) and soil respiration (Ce) observed in both remediated post-mining soils also indicated a possibility of SOC sequestration in these soils. In addition to SOC sequestration, both remediation techniques on post-mining soils also showed improvement in the content of nutrients (e.g., K, Mg), which are supposed to promote plant growth and lead to enhanced SOC sequestration. We also observed a decrease in the concentration of heavy metals after one year of remediation at each remediation advancement either for lignite or limestone post-mining soils. Such a positive complex interaction between the remediation of post-mining soils and SOC dynamics suggests the right step toward the climate change mitigation process.
Author Contributions
Conceptualization, A.K. and A.G.; methodology, A.K. and A.G.; validation, A.K.; formal analysis, A.K.; investigation, A.K.; resources, A.K. and A.G.; data curation, A.K.; writing—original draft preparation, A.K.; writing—review and editing, A.G. and B.R.S.; visualization, A.K.; supervision, B.R.S. and A.G.; funding acquisition, A.G. All authors have read and agreed to the published version of the manuscript.
Funding
The research leading to these results received funding from the EnviSafeBioC project—contract No. PPI/APM/2018/1/00029/U/001. The project was financed by the Polish National Agency for Academic Exchange (NAWA). The research was funded by BS/PB-400/301/22.
Data Availability Statement
The data presented in this study are available on request.
Conflicts of Interest
The authors declare no conflict of interest.
References
- Kong, X.; Tian, T.; Xue, S.; Hartley, W.; Huang, L.; Wu, C.; Li, C. Development of alkaline electrochemical characteristics demonstrates soil formation in bauxite residue undergoing natural rehabilitation. Land. Degrad. Dev. 2017, 29, 58–67. [Google Scholar] [CrossRef]
- Central Statistical Office. Ochrona Środowiska 2020. Available online: https://stat.gov.pl/files/gfx/portalinformacyjny/pl/defaultaktualnosci/5484/1/21/1/ochrona_srodowiska_2020.pdf (accessed on 23 July 2022).
- Amelung, W.; Bossio, D.; de Vries, W.; Kögel-Knabner, I.; Lehmann, J.; Amundson, R.; Bol, R.; Collins, C.; Lal, R.; Leifeld, J.; et al. Towards a global-scale soil climate mitigation strategy. Nat. Commun. 2020, 11, 5427. [Google Scholar] [CrossRef] [PubMed]
- Maiti, S.K.; Ahirwal, J. Chapter 3—Ecological Restoration of Coal Mine Degraded Lands: Topsoil Management, Pedogenesis, Carbon Sequestration, and Mine Pit Limnology. In Phytomanagement of Polluted Sites; Pandey, V.C., Bauddh, K., Eds.; Elsevier Science: Amsterdam, The Netherlands, 2018; pp. 83–111. [Google Scholar] [CrossRef]
- Ignatyeva, M.; Yurak, V.; Pustokhina, N. Recultivation of Post-Mining Disturbed Land: Review of Content and Comparative Law and Feasibility Study. Resources 2020, 9, 73. [Google Scholar] [CrossRef]
- Fajariani, W.; Hendra, M.; Susanto, D. Estimation of Above Ground Carbon Sequestration in Trembesi (Albizia saman) and Johar (Senna siamea) at PT Multi Harapan Utama, East Kalimantan. J. Trop. Biodivers. Biotechnol. 2020, 5, 115–123. [Google Scholar] [CrossRef]
- Vacek, Z.; Cukor, J.; Vacek, S.; Linda, R.; Prokůpková, A.; Podrázský, V.; Gallo, J.; Vacek, O.; Šimůnek, V.; Drábek, O.; et al. Production potential, biodiversity and soil properties of forest reclamations: Opportunities or risk of introduced coniferous tree species under climate change? Forstwiss. Cent. 2021, 140, 1243–1266. [Google Scholar] [CrossRef]
- White, R.E. The Role of Soil Carbon Sequestration as a Climate Change Mitigation Strategy: An Australian Case Study. Soil Syst. 2022, 6, 46. [Google Scholar] [CrossRef]
- Montanarella, L.; Panagos, P. The relevance of sustainable soil management within the European Green Deal. Land Use Policy 2020, 100, 104950. [Google Scholar] [CrossRef]
- Hendrychová, M.; Svobodova, K.; Kabrna, M. Mine reclamation planning and management: Integrating natural habitats into post-mining land use. Resour. Policy 2020, 69, 101882. [Google Scholar] [CrossRef]
- Placek-Lapaj, A.; Grobelak, A.; Fijalkowski, K.; Singh, B.R.; Almås, R.; Kacprzak, M. Post – Mining soil as carbon storehouse under polish conditions. J. Environ. Manag. 2019, 238, 307–314. [Google Scholar] [CrossRef]
- Grobelak, A.; Placek, A.; Grosser, A.; Singh, B.R.; Almås, R.; Napora, A.; Kacprzak, M. Effects of single sewage sludge application on soil phytoremediation. J. Clean. Prod. 2016, 155, 189–197. [Google Scholar] [CrossRef]
- Shao, P.; Liang, C.; Lynch, L.; Xie, H.; Bao, X. Reforestation accelerates soil organic carbon accumulation: Evidence from microbial biomarkers. Soil Biol. Biochem. 2019, 131, 182–190. [Google Scholar] [CrossRef]
- Dynarski, K.A.; Bossio, D.A.; Scow, K.M. Dynamic Stability of Soil Carbon: Reassessing the “Permanence” of Soil Carbon Sequestration. Front. Environ. Sci. 2020, 8, 514701. [Google Scholar] [CrossRef]
- Kaliszewski, A.; Jabłoński, M. Is It Possible for Poland to Achieve the Policy Goal of 33% Forest Cover by Mid-Century? Sustainability 2022, 14, 6541. [Google Scholar] [CrossRef]
- Kowalska, A.; Kucbel, M.; Grobelak, A. Potential and Mechanisms for Stable C Storage in the Post-Mining Soils under Long-Term Study in Mitigation of Climate Change. Energies 2021, 14, 7613. [Google Scholar] [CrossRef]
- Madigan, A.P.; Zimmermann, J.; Krol, D.J.; Williams, M.; Jones, M.B. Full Inversion Tillage (FIT) during pasture renewal as a potential management strategy for enhanced carbon sequestration and storage in Irish grassland soils. Sci. Total. Environ. 2021, 805, 150342. [Google Scholar] [CrossRef]
- Hammad, H.M.; Nauman, H.M.F.; Abbas, F.; Ahmad, A.; Bakhat, H.F.; Saeed, S.; Shah, G.M.; Ahmad, A.; Cerdà, A. Carbon sequestration potential and soil characteristics of various land use systems in arid region. J. Environ. Manag. 2020, 264, 110254. [Google Scholar] [CrossRef]
- Fox, J.F.; Campbell, J.E.; Acton, P.M. Carbon Sequestration by Reforesting Legacy Grasslands on Coal Mining Sites. Energies 2020, 13, 6340. [Google Scholar] [CrossRef]
- Kay, S.; Rega, C.; Moreno, G.; Herder, M.D.; Palma, J.H.N.; Borek, R.; Crous-Duran, J.; Freese, D.; Giannitsopoulos, M.; Graves, A.; et al. Agroforestry creates carbon sinks whilst enhancing the environment in agricultural landscapes in Europe. Land Use Policy 2019, 83, 581–593. [Google Scholar] [CrossRef]
- Hüblová, L.; Frouz, J. Contrasting effect of coniferous and broadleaf trees on soil carbon storage during reforestation of forest soils and afforestation of agricultural and post-mining soils. J. Environ. Manag. 2021, 290, 112567. [Google Scholar] [CrossRef]
- Bongiorno, G.; Bünemann, E.K.; Oguejiofor, C.U.; Meier, J.; Gort, G.; Comans, R.; Mäder, P.; Brussaard, L.; de Goede, R. Sensitivity of labile carbon fractions to tillage and organic matter management and their potential as comprehensive soil quality indicators across pedoclimatic conditions in Europe. Ecol. Indic. 2018, 99, 38–50. [Google Scholar] [CrossRef]
- Guo, Z.; Zhang, Z.; Zhou, H.; Wang, D.; Peng, X. The effect of 34-year continuous fertilization on the SOC physical fractions and its chemical composition in a Vertisol. Sci. Rep. 2019, 9, 2505. [Google Scholar] [CrossRef] [PubMed]
- Zaeni, A.; Alwahab; Hasmawati; Hade, S.; Irnawati; Susilowati, P.E. Utilization of Compost as ameliorant in a Nickel post mining soil. J. Phys. Conf. Ser. 2021, 1899, 012031. [Google Scholar] [CrossRef]
- Souri, Z.; Cardoso, A.A.; Da-Silva, C.J.; de Oliveira, L.M.; Dari, B.; Sihi, D.; Karimi, N. Heavy Metals and Photosynthesis: Recent Developments. In Photosynthesis, Productivity and Environmental Stress; Wiley: Hoboken, NJ, USA, 2019; pp. 107–134. [Google Scholar] [CrossRef]
- Li, J.; Li, H.; Zhang, Q.; Shao, H.; Gao, C.; Zhang, X. Effects of fertilization and straw return methods on the soil carbon pool and CO2 emission in a reclaimed mine spoil in Shanxi Province, China. Soil Tillage Res. 2019, 195. [Google Scholar] [CrossRef]
- Yan, M.; Fan, L.; Wang, L. Restoration of soil carbon with different tree species in a post-mining land in eastern Loess Plateau, China. Ecol. Eng. 2020, 158, 106025. [Google Scholar] [CrossRef]
- Kabała, C.; Karczewska, A. Metodyka Analiz Laboratoryjnych Gleb I Roślin, Uniwersytet Przyrodniczy We Wrocławiu. Instytut Nauk O Glebie I Ochrony Środowiska; Zakład Ochrony Środowiska: Wrocław, Poland, 2008. [Google Scholar]
- Krogstad, T. Methods for Soil Analysis; NLH Report No. 6; Institutt for Jordfag, Norwegian University of Life Sciences: Ås, Norway, 1992. [Google Scholar]
- FAO. Standard Operating Procedure for Soil Organic Carbon: Tyurin Spectrophotometric Method; FAO: Rome, Italy, 2021. [Google Scholar]
- Weil, R.R.; Islam, K.R.; Stine, M.A.; Gruver, J.B.; Samson-Liebig, S.E. Estimating active carbon for soil quality assessment: A simplified method for laboratory and field use. Am. J. Altern. Agric. 2003, 18, 3–17. [Google Scholar] [CrossRef]
- Kobierski, M.; Kondratowicz-Maciejewska, K.; Banach-Szott, M.; Wojewódzki, P.; Peñas Castejón, J.M. Humic substances and aggregate stability in rhizospheric and non-rhizospheric soil. J. Soils Sediments 2018, 18, 2777–2789. [Google Scholar] [CrossRef]
- Hamid, Y.; Tang, L.; Hussain, B.; Usman, M.; Hashmi, M.L.U.R.; Khan, M.B.; Yang, X.; He, Z. Immobilization and sorption of Cd and Pb in contaminated stagnic anthrosols as amended with biochar and manure combined with inorganic additives. J. Environ. Manag. 2019, 257, 109999. [Google Scholar] [CrossRef]
- Ahirwal, J.; Maiti, S.K. Assessment of soil carbon pool, carbon sequestration and soil CO2 flux in unreclaimed and reclaimed coal mine spoils. Environ. Earth Sci. 2018, 77, 9. [Google Scholar] [CrossRef]
- Rutkowska, B.; Szulc, W.; Sosulski, T.; Skowrońska, M.; Szczepaniak, J. Impact of reduced tillage on CO 2 emission from soil under maize cultivation. Soil Tillage Res. 2018, 180, 21–28. [Google Scholar] [CrossRef]
- Zhang, P.P.; Le Zhang, Y.; Jia, J.C.; Cui, Y.X.; Wang, X.; Zhang, X.C.; Wang, Y.Q. Revegetation pattern affecting accumulation of organic carbon and total nitrogen in reclaimed mine soils. PeerJ 2020, 8, e8563. [Google Scholar] [CrossRef]
- Ma, X.; Zhu, Z.; Zhang, H.; Tian, S.; Li, X.; Fan, H.; Fu, S. Superhydrophobic and deacidified cellulose/CaCO3-derived granular coating toward historic paper preservation. Int. J. Biol. Macromol. 2022, 207, 232–241. [Google Scholar] [CrossRef] [PubMed]
- Zhong, S.; Han, Z.; Du, J.; Ci, E.; Ni, J.; Xie, D.; Wei, C. Relationships between the lithology of purple rocks and the pedogenesis of purple soils in the Sichuan Basin, China. Sci. Rep. 2019, 9, 13272. [Google Scholar] [CrossRef] [PubMed]
- Segura, C.; Jiménez, M.N.; Fernández-Ondoño, E.; Navarro, F.B. Effects of Afforestation on Plant Diversity and Soil Quality in Semiarid SE Spain. Forests 2021, 12, 1730. [Google Scholar] [CrossRef]
- Pastor-Jáuregui, R.; Paniagua-López, M.; Aguilar-Garrido, A.; Martín-Peinado, F.; Sierra-Aragón, M. Long-term assessment of remediation treatments applied to an area affected by a mining spill in Spain. Land Degrad. Dev. 2021, 32, 2481–2492. [Google Scholar] [CrossRef]
- Sopialena, S.; Rosfiansyah, R.; Sila, S. The benefit of top soil and fertilizer mixture to improve the ex-coal mining land. Nusant. Biosci. 2017, 9, 36–43. [Google Scholar] [CrossRef]
- Kumar, A.; Singh, B.; Raigond, P.; Sahu, C.; Mishra, U.N.; Sharma, S.; Lal, M.K. Phytic acid: Blessing in disguise, a prime compound required for both plant and human nutrition. Food Res. Int. 2021, 142, 110193. [Google Scholar] [CrossRef]
- Wen, J.; Li, Z.; Luo, N.; Huang, M.; Yang, R.; Zeng, G. Investigating organic matter properties affecting the binding behavior of heavy metals in the rhizosphere of wetlands. Ecotoxicol. Environ. Saf. 2018, 162, 184–191. [Google Scholar] [CrossRef]
- Zhang, Q.; Han, G.; Xu, X. Reforestation Impacted Soil Heavy Metal Fractionation and Related Risk Assessment in the Karst Area, Southwest China. Forests 2021, 12, 891. [Google Scholar] [CrossRef]
- Tregubova, P.; Koptsik, G.; Stepanov, A. Remediation of degraded soils: Effect of organic additives on soil properties and heavy metals’ bioavailability. IOP Conf. Ser. Earth Environ. Sci. 2019, 368, 012054. [Google Scholar] [CrossRef]
- Qu, J.-F.; Hou, Y.-L.; Ge, M.-Y.; Wang, K.; Liu, S.; Zhang, S.-L.; Li, G.; Chen, F. Carbon Dynamics of Reclaimed Coal Mine Soil under Agricultural Use: A Chronosequence Study in the Dongtan Mining Area, Shandong Province, China. Sustainability 2017, 9, 629. [Google Scholar] [CrossRef]
- Feng, Y.; Wang, J.; Bai, Z.; Reading, L. Effects of surface coal mining and land reclamation on soil properties: A review. Earth-Sci. Rev. 2019, 191, 12–25. [Google Scholar] [CrossRef]
- Wijesekara, H.; Bolan, N.S.; Thangavel, R.; Seshadri, B.; Surapaneni, A.; Saint, C.; Hetherington, C.; Matthews, P.; Vithanage, M. The impact of biosolids application on organic carbon and carbon dioxide fluxes in soil. Chemosphere 2017, 189, 565–573. [Google Scholar] [CrossRef] [PubMed]
- Fraser, L.H.; Hamme, J.D.V.; Gardner, W. Post-Mining Reclamation in South-Central British Columbia: Investigating Microbial and Geochemical Changes in Topsoil Stockpiles in Opencast Mining. GeoscienceSB 2020, 1, 167–172. [Google Scholar]
- Waisman, H.; Bataille, C.; Winkler, H.; Jotzo, F.; Shukla, P.; Colombier, M.; Buira, D.; Criqui, P.; Fischedick, M.; Kainuma, M.; et al. A pathway design framework for national low greenhouse gas emission development strategies. Nat. Clim. Chang. 2019, 9, 261–268. [Google Scholar] [CrossRef]
- Iram, N.; Maher, D.T.; Lovelock, C.E.; Baker, T.; Cadier, C.; Adame, M.F. Climate change mitigation and improvement of water quality from the restoration of a subtropical coastal wetland. Ecol. Appl. 2022, 32, e2620. [Google Scholar] [CrossRef]
- Buragienė, S.; Šarauskis, E.; Romaneckas, K.; Adamavičienė, A.; Kriaučiūnienė, Z.; Avižienytė, D.; Marozas, V.; Naujokienė, V. Relationship between CO2 emissions and soil properties of differently tilled soils. Sci. Total. Environ. 2019, 662, 786–795. [Google Scholar] [CrossRef]
- Valente, F.D.A.; Gomes, L.C.; Castro, M.F.; Neves, J.C.L.; Silva, I.R.; Oliveira, T.S. Influence of different tree species on autotrophic and heterotrophic soil respiration in a mined area under reclamation. Land Degrad. Dev. 2021, 32, 4288–4299. [Google Scholar] [CrossRef]
- Danish, M.; Ahmad, T. A review on utilization of wood biomass as a sustainable precursor for activated carbon production and application. Renew. Sustain. Energy Rev. 2018, 87, 1–21. [Google Scholar] [CrossRef]
- Cai, Z.; Yan, X.; Gu, B. Applying C:N ratio to assess the rationality of estimates of carbon sequestration in terrestrial ecosystems and nitrogen budgets. Carbon Res. 2022, 1, 2. [Google Scholar] [CrossRef]
- Rumpel, C.; Knicker, H.; Kögel-Knabner, I.; Skjemstad, J.; Hüttl, R. Types and chemical composition of organic matter in reforested lignite-rich mine soils. Geoderma 1998, 86, 123–142. [Google Scholar] [CrossRef]
- Shi, S.; Peng, C.; Wang, M.; Zhu, Q.; Yang, G.; Yang, Y.; Xi, T.; Zhang, T. A global meta-analysis of changes in soil carbon, nitrogen, phosphorus and sulfur, and stoichiometric shifts after forestation. Plant Soil 2016, 407, 323–340. [Google Scholar] [CrossRef]
Publisher’s Note: MDPI stays neutral with regard to jurisdictional claims in published maps and institutional affiliations. |
© 2022 by the authors. Licensee MDPI, Basel, Switzerland. This article is an open access article distributed under the terms and conditions of the Creative Commons Attribution (CC BY) license (https://creativecommons.org/licenses/by/4.0/).