
Perspectives for Expansion of Concentrating Solar Power (CSP) Generation Technologies in Brazil

 , and
, and 
Abstract
1. Introduction
2. Materials and Methods
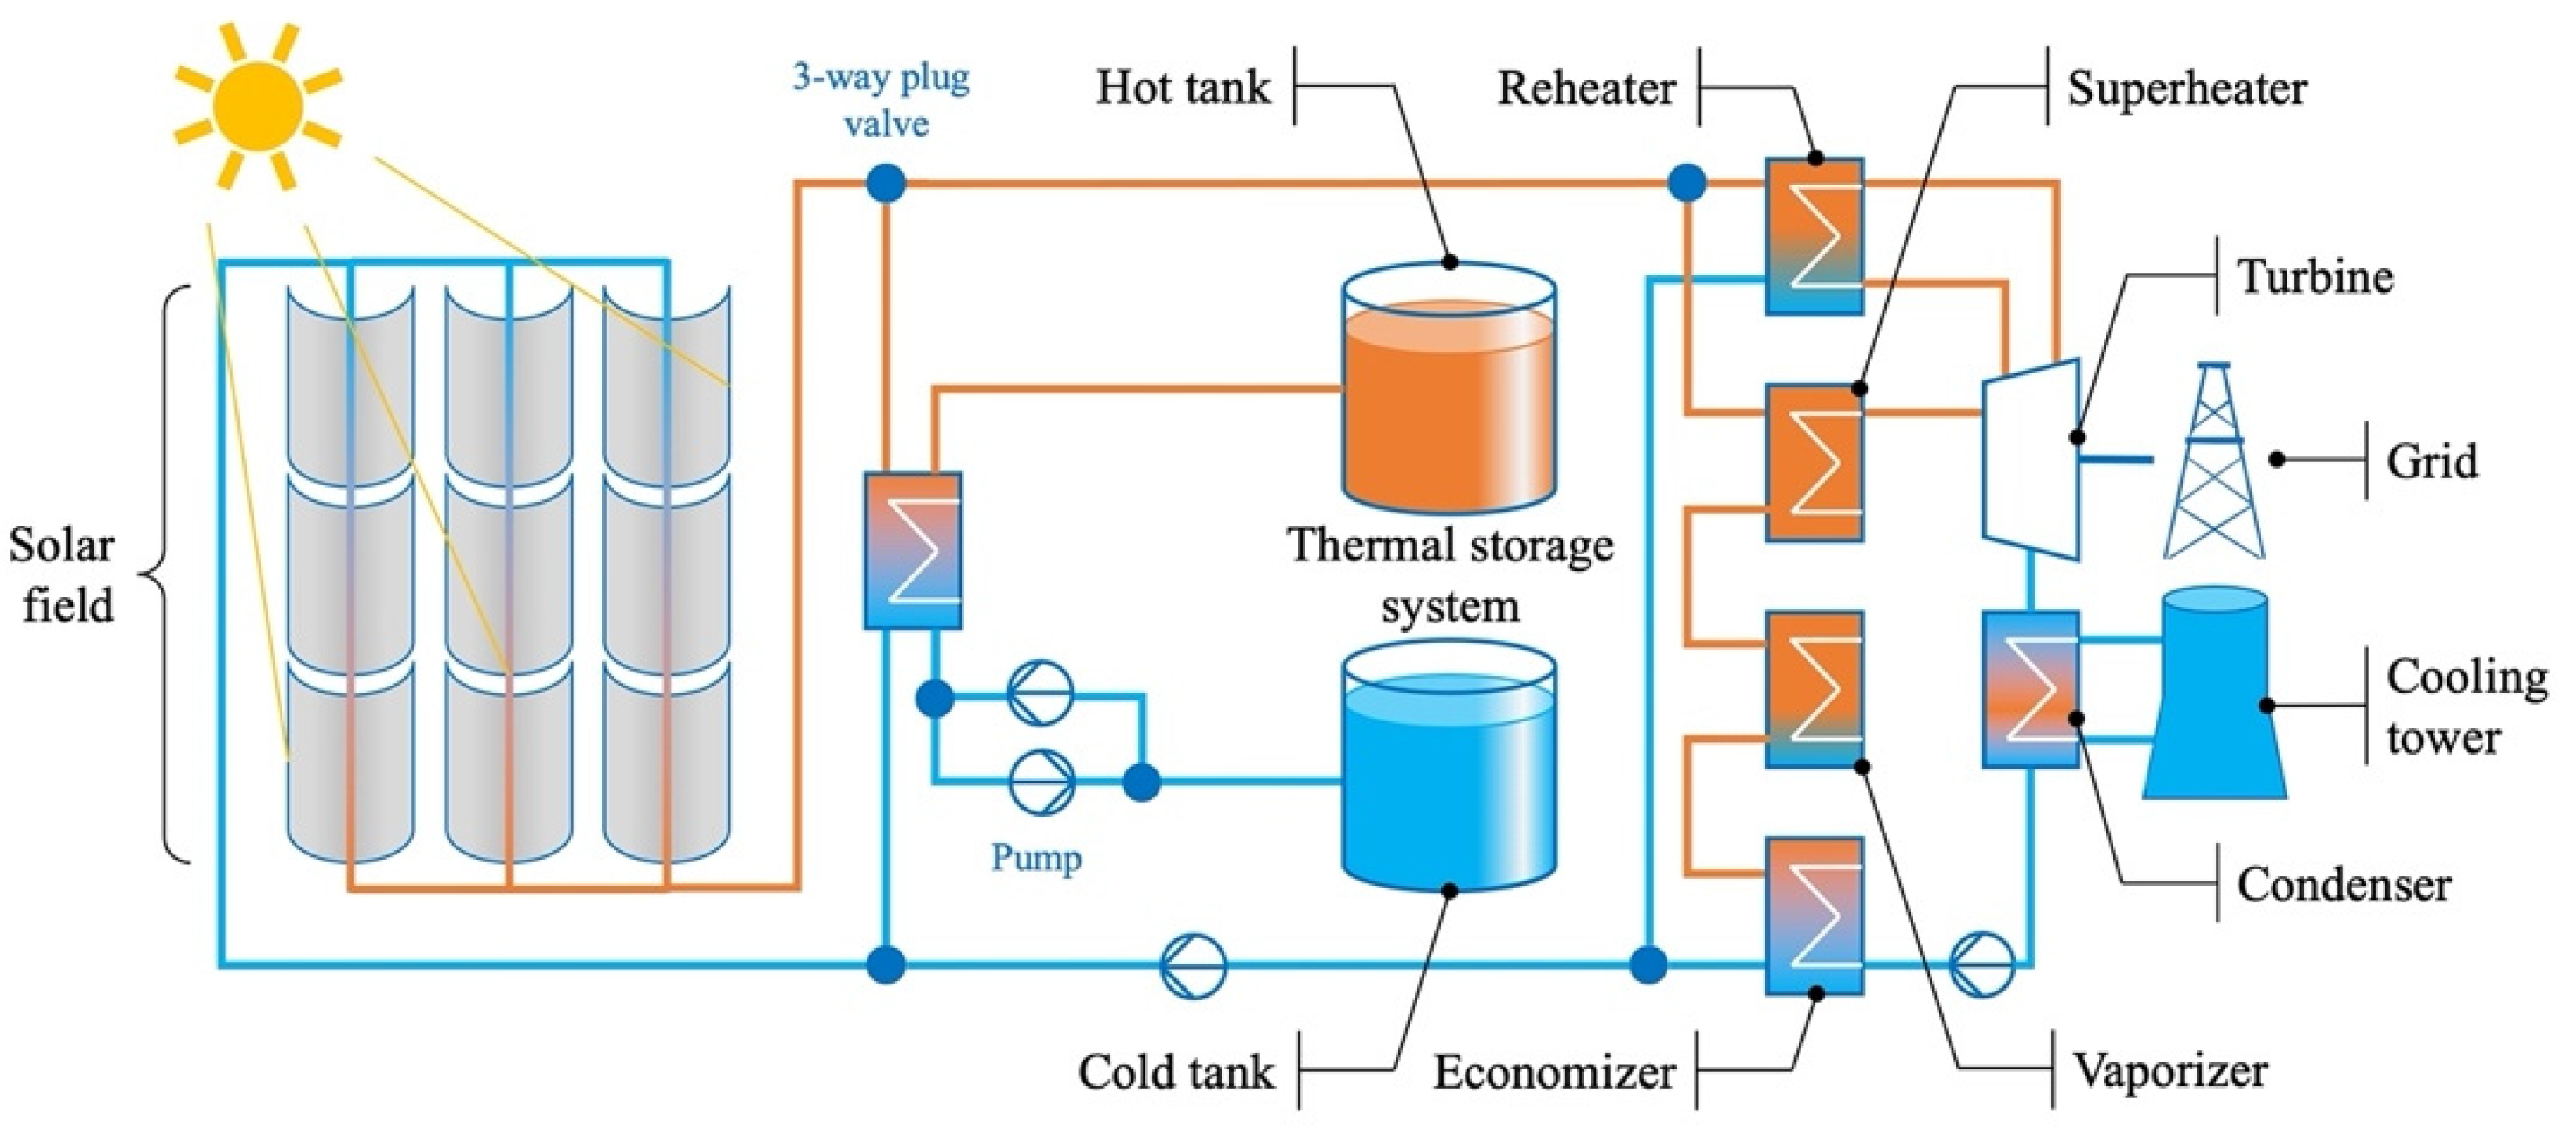
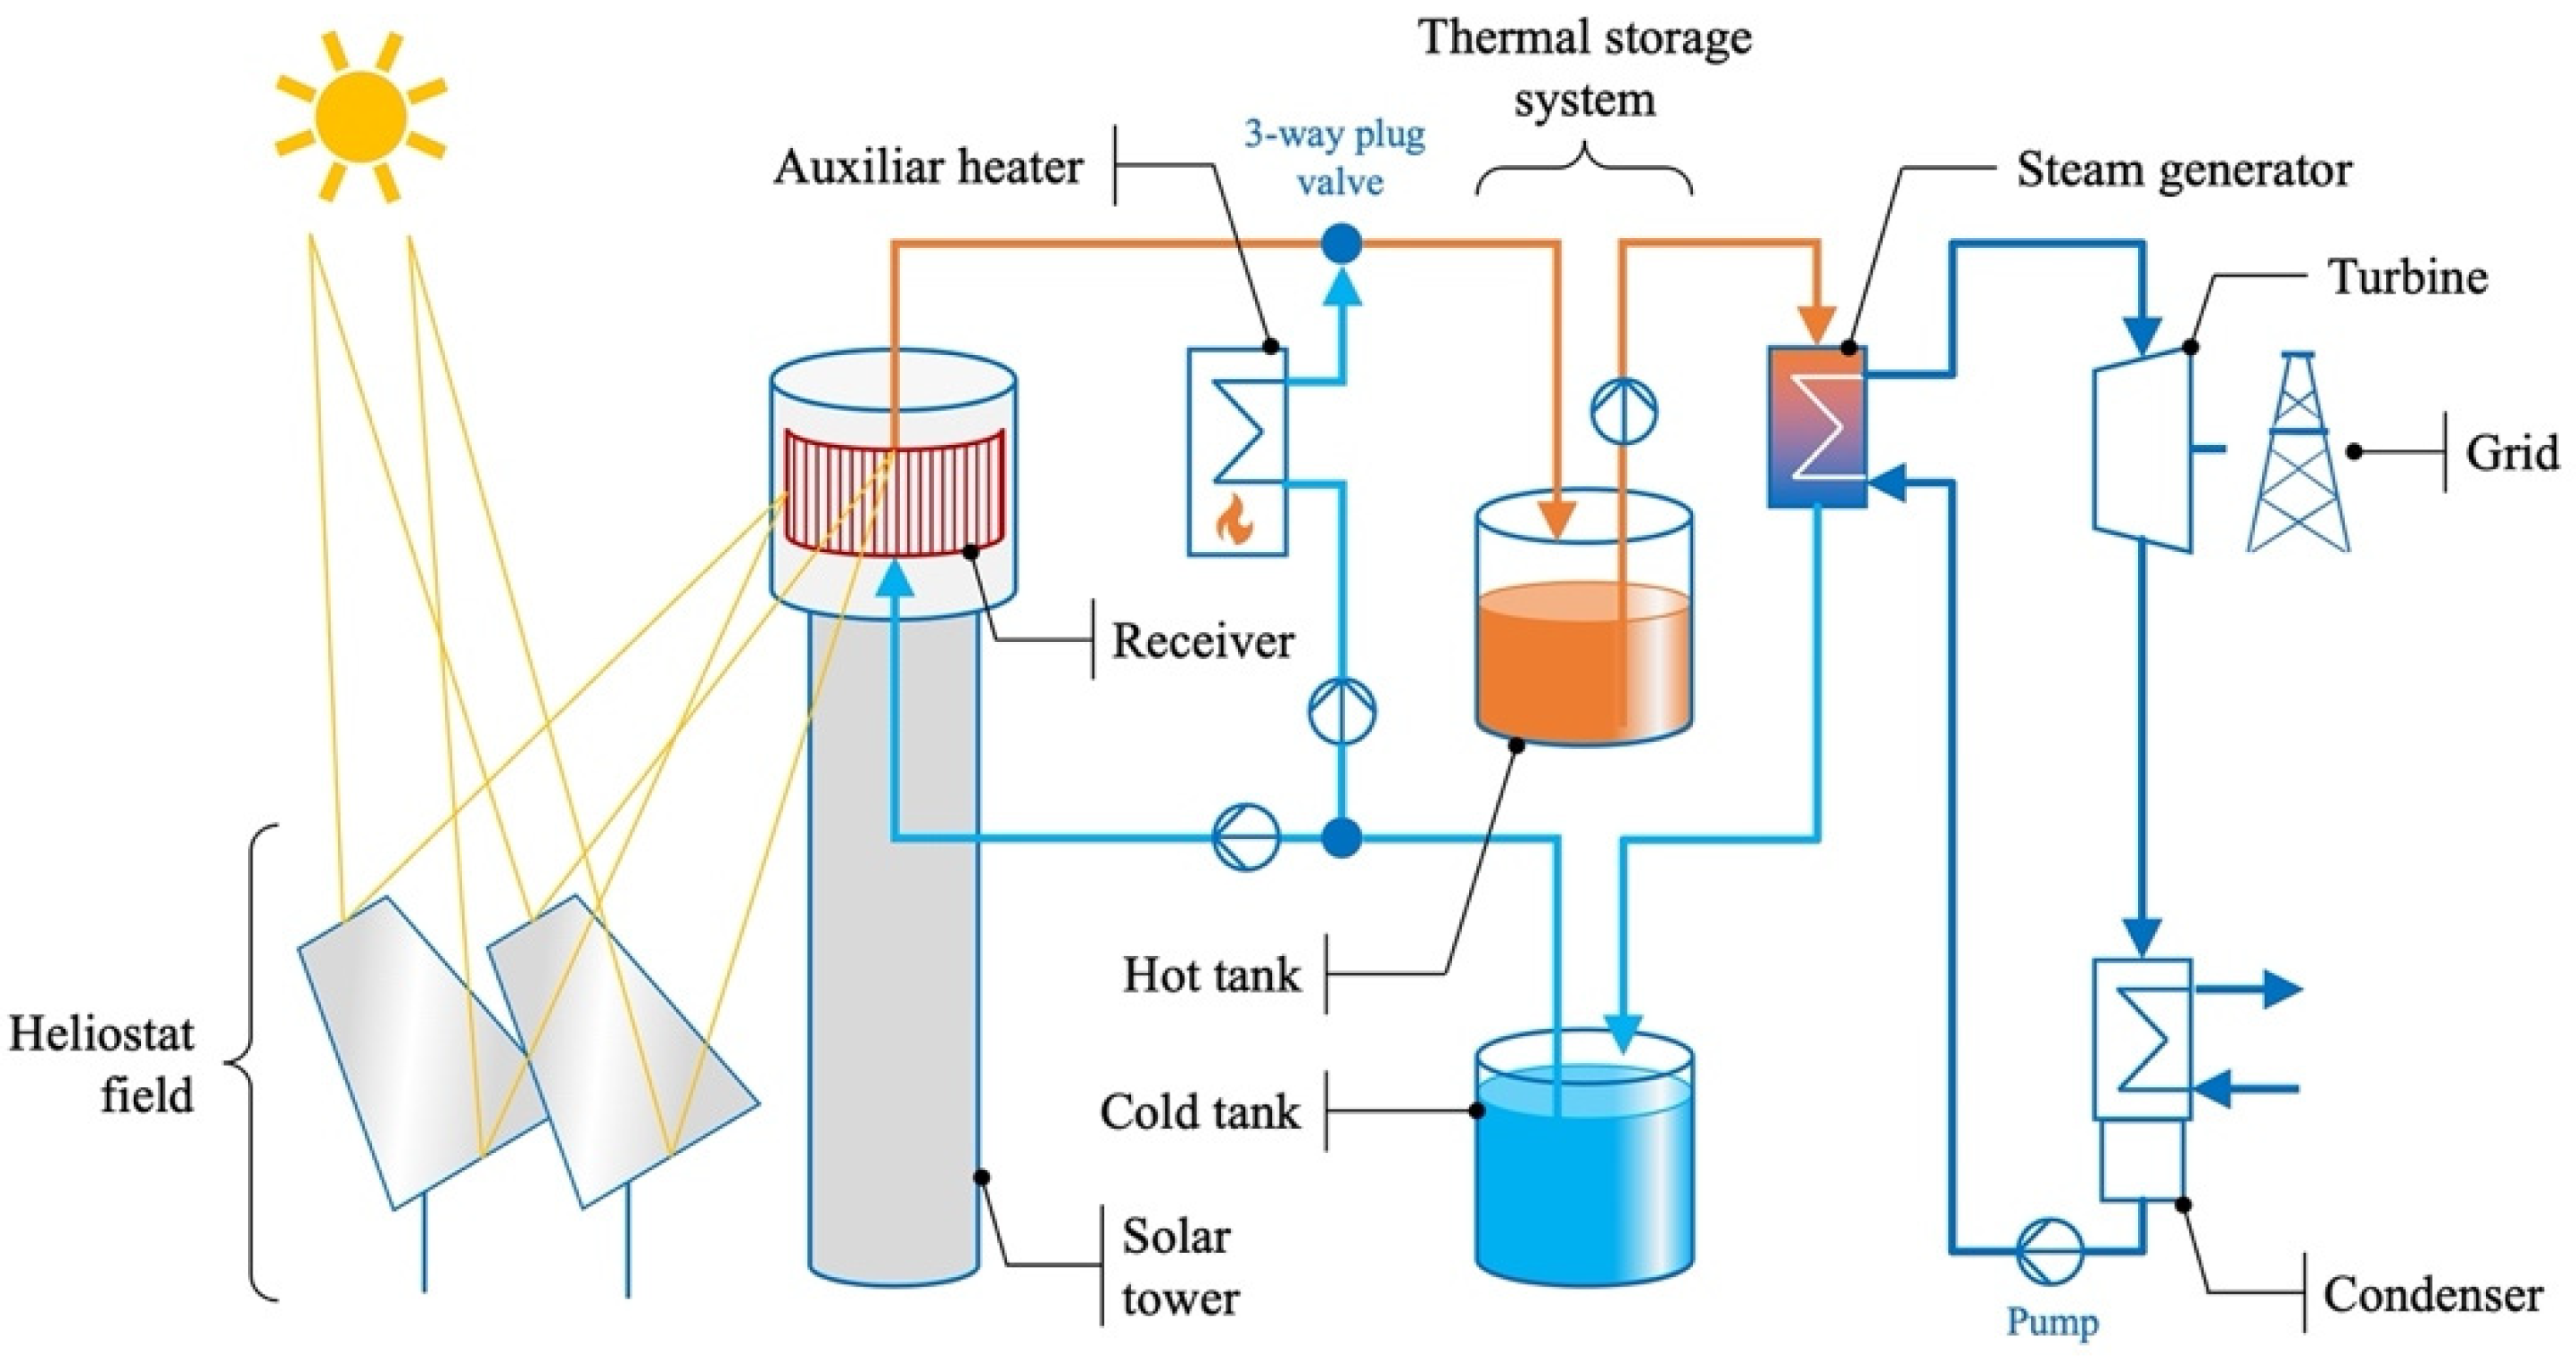
2.1. An Overview of Solar Thermal Technologies and Their Environmental Aspects
2.2. MATRIZ Model
2.3. Life Cycle Assessment (LCA)
2.4. Incorporating CSP Generation in the MATRIZ Model: Environmental Impacts
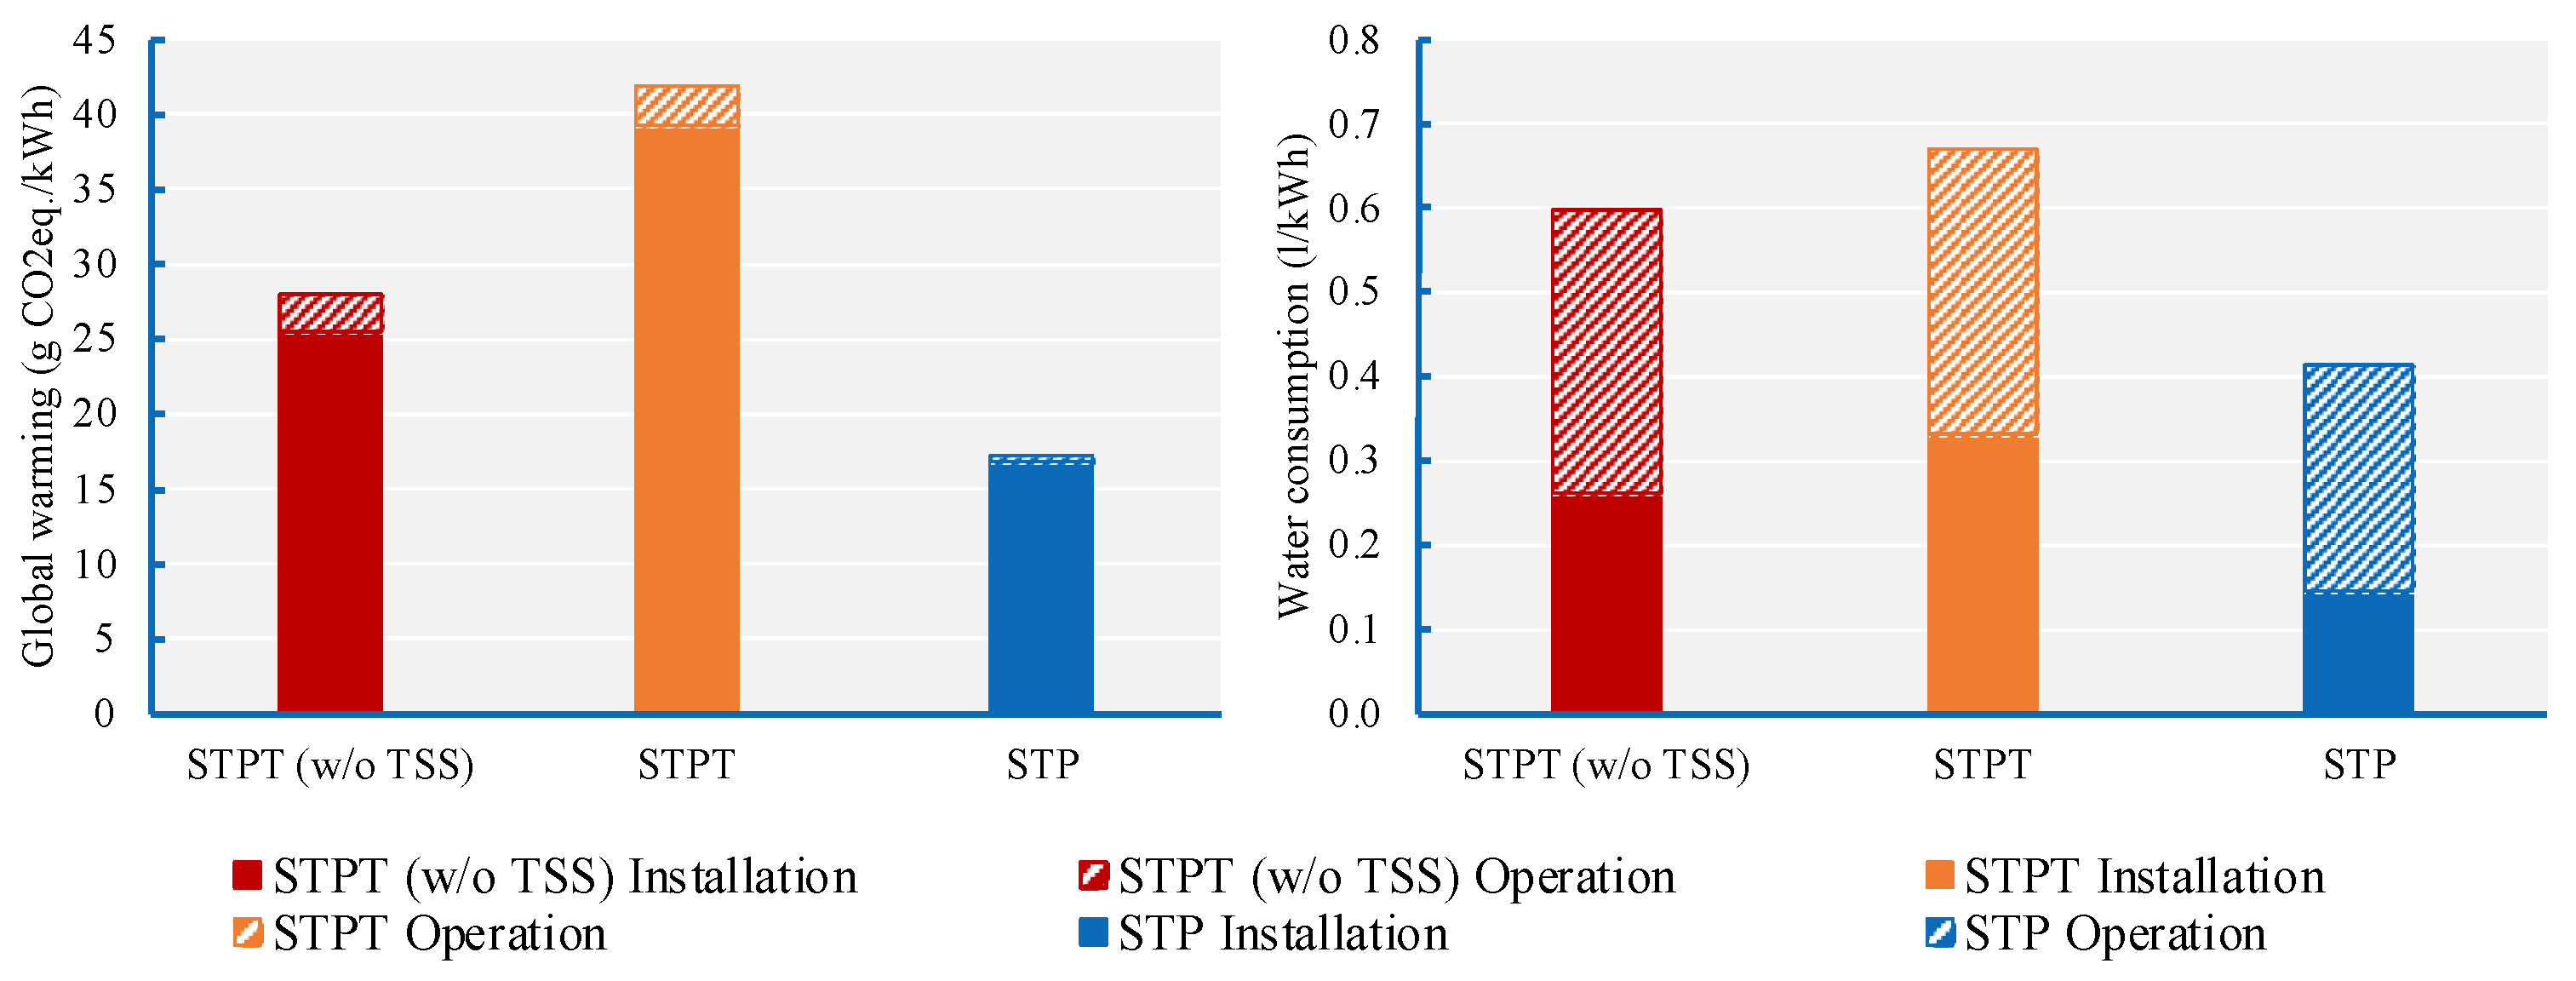
3. Results
4. Discussion
5. Conclusions
Supplementary Materials
Author Contributions
Funding
Data Availability Statement
Acknowledgments
Conflicts of Interest
Abbreviations
| CCGT | Combined-cycle gas turbine |
| CSP | Concentrating solar power |
| DNI | Direct normal irradiance |
| EPE | Brazilian Energy Research Office |
| ETSAP | Energy Technology Systems Analysis Program |
| GHG | Greenhouse gas |
| IEA | International Energy Agency |
| Inst. | Installation |
| kWh | Kilowatt-hour |
| LCA | Life cycle assessment |
| LCI | Life cycle inventory |
| LCIA | Life cycle impact assessment |
| MW | Megawatt |
| Opr. | Operation |
| PV | Photovoltaic |
| SAM | System advisory model |
| SCGT | Simple-cycle gas turbine |
| SIN | Brazilian National Interconnected System |
| STP | Solar tower power |
| STPT | Solar thermal parabolic trough |
| TIMES | The integrated MARKAL-EFOM system |
| TPP | Thermal power plant |
| TSS | Thermal storage system |
References
- Tolmasquim, M. Renewable Energy: Hydro, Biomass, Wind, Solar, Ocean; Brazilian Energy Research Office, Ed.; Brazilian Energy Research Office: Rio de Janeiro, Brazil, 2016. [Google Scholar]
- Brazil. Brazilian Energy Balance 2020; Brazilian Energy Research Office: Brasília, Brazil, 2020. [Google Scholar]
- Brazil. The Ten-Year Energy Expansion Plan 2030; Brazilian Energy Research Office: Brasília, Brazil, 2021. [Google Scholar]
- Perez-Arriaga, I.J.; Batlle, C. Impacts of intermittent renewables on electricity generation system operation. Econ. Energy Environ. Policy 2012, 1, 3–18. [Google Scholar] [CrossRef]
- Trama, C.P.; Júnior, A.O.P.; Guimarães, A.P.C.; Diniz, A.L.; Vieira, L.D.S.R. Cost–benefit analysis of solar thermal plants with storage in a hydrothermal system. Energies 2021, 14, 5662. [Google Scholar] [CrossRef]
- Soria, R.; Lucena, A.F.P.; Tomaschek, J.; Fichter, T.; Haasz, T.; Szklo, A.; Schaeffer, R.; Rochedo, P.; Fahl, U.; Kern, J. Modelling concentrated solar power (CSP) in the Brazilian energy system: A soft-linked model coupling approach. Energy 2016, 116, 265–280. [Google Scholar] [CrossRef]
- Vieira de Souza, L.E.; Gilmanova Cavalcante, A.M. Concentrated Solar Power deployment in emerging economies: The cases of China and Brazil. Renew. Sustain. Energy Rev. 2017, 72, 1094–1103. [Google Scholar] [CrossRef]
- Brazil. The Ten-Year Energy Expansion Plan 2029; Brazilian Energy Research Office: Brasília, Brazil, 2020. [Google Scholar]
- Ma, R.; Yan, C.; Yu, J.; Liu, T.; Liu, H.; Li, Y.; Chen, J.; Luo, Z.; Tang, B.; Lu, X.; et al. High-Efficiency Ternary Organic Solar Cells with a Good Figure-of-Merit Enabled by Two Low-Cost Donor Polymers. ACS Energy Lett. 2022, 7, 2547–2556. [Google Scholar] [CrossRef]
- Yao, S.; Yang, T.; Shen, X.; Li, T.; Huang, B.; Liu, H.; Lu, X.; Liu, T.; Zou, B. Realizing the efficiency-stability balance for all-polymer photovoltaic blends. J. Mater. Chem. C 2022, 10, 9723–9729. [Google Scholar] [CrossRef]
- IRENA. The Power to Change: Solar and Wind Cost Reduction Potential to 2025; IRENA: Bonn, Germany, 2016. [Google Scholar]
- Brazil. 2050 Brazilian Energy Plan; Brazilian Energy Research Office: Brasília, Brazil, 2020. [Google Scholar]
- Lisboa, M.L.V.; Damásio, J.M.; Sabóia, C.H.M.; Maceira, M.E.P.; Melo, A.C.G.; Hollauer, G.; Masili, G.; Patusco, J.M. MATRIZ—A Model for Integrated Long-Term Planning Studies for the Brazilian Energy System. In Proceedings of the Symposium of Specialists in Electric Operational and Expansion Planning, Rio de Janeiro, Brazil, 20–23 May 2012. [Google Scholar]
- Tong, D.; Farnham, D.J.; Duan, L.; Zhang, Q.; Lewis, N.S.; Caldeira, K.; Davis, S.J. Geophysical constraints on the reliability of solar and wind power worldwide. Nat. Commun. 2021, 12, 6146. [Google Scholar] [CrossRef]
- IPCC. Annex I: Glossary—Global Warming of 1.5 °C. In Global Warming of 1.5 °C; An IPCC Special Report on the impacts of global warming of 1.5 °C above pre-industrial levels and related global greenhouse gas emission pathways, in the context of strengthening the global response to the threat of climate change; Cambridge University Press: Cambridge, UK; New York, NY, USA, 2018. [Google Scholar]
- Viebahn, P.; Lechon, Y.; Trieb, F. The potential role of concentrated solar power (CSP) in Africa and Europe—A dynamic assessment of technology development, cost development and life cycle inventories until 2050. Energy Policy 2011, 39, 4420–4430. [Google Scholar] [CrossRef]
- Mazzaferro, C. Life Cycle Assessment of Electricity Production from Concentrating Solar Thermal Power Plants; Universita Degli Studi Di Padova: Padua, Italy, 2017. [Google Scholar]
- Mayo, C.; Batuecas, E.; Díaz, R.; Pérez, F.J. Comparative environmental assessment of two materials suited to central tower CSP technology. Sol. Energ. 2018, 162, 178–186. [Google Scholar] [CrossRef]
- Gasa, G.; Lopez-Roman, A.; Prieto, C.; Cabeza, L.F. Life Cycle Assessment (LCA) of a Concentrating Solar Power (CSP) Plant in Tower Configuration with and without Thermal Energy Storage (TES). Sustainability 2021, 13, 3672. [Google Scholar] [CrossRef]
- Liang, Y.; Chen, J.; Yang, Z.; Chen, J.; Luo, X.; Chen, Y. Economic-environmental evaluation and multi-objective optimization of supercritical CO2 based-central tower concentrated solar power system with thermal storage. Energy Convers. Manag. 2021, 238, 114140. [Google Scholar] [CrossRef]
- Barteczko-Hibbert, C.; Bonis, I.; Binns, M.; Theodoropoulos, C.; Azapagic, A. A multi-period mixed-integer linear optimisation of future electricity supply considering life cycle costs and environmental impacts. Appl. Energy 2014, 133, 317–334. [Google Scholar] [CrossRef]
- Rauner, S.; Budzinski, M. Holistic energy system modeling combining multi-objective optimization and life cycle assessment. Environ. Res. Lett. 2017, 12, 124005. [Google Scholar] [CrossRef]
- Louis, J.-N.; Allard, S.; Kotrotsou, F.; Debusschere, V. A multi-objective approach to the prospective development of the European power system by 2050. Energy 2020, 191, 116539. [Google Scholar] [CrossRef]
- GIZ/MCTI Basic Mapping of General Pre-Conditions for CSP Technologies in Brazil; GIZ/MCTI: Brasília, Brazil, 2014.
- GIZ/MCTI Parabolic Trough CSP Technology—State of the Art and Market Overview; GIZ/MCTI: Brasília, Brazil, 2014.
- GIZ/MCTI Tower CSP Technology—State of Art and Market Review; GIZ/MCTI: Brasília, Brazil, 2014.
- Ko, N.; Lorenz, M.; Horn, R.; Krieg, H.; Baumann, M. Sustainability Assessment of Concentrated Solar Power (CSP) Tower Plants—Integrating LCA, LCC and LCWE in One Framework. In Proceedings of the Procedia CIRP, Stockholm, Sweden, 16–18 May 2018; Volume 69. [Google Scholar]
- Pihl, E.; Kushnir, D.; Sandén, B.; Johnsson, F. Material constraints for concentrating solar thermal power. Energy 2012, 44, 944–954. [Google Scholar] [CrossRef]
- Seebregts, A.J.; Goldstein, G.A.; Smekens, K. Energy/Environmental Modeling with the MARKAL Family of Models. In Operations Research Proceedings 2001; Springer Berlin Heidelberg: Berlin/Heidelberg, Germany, 2002; pp. 75–82. [Google Scholar]
- Brazil. Brazilian Energy Balance 2012; Brazilian Energy Research Office: Brasília, Brazil, 2012. [Google Scholar]
- Loulou, R.; Remme, U.; Kanudia, A.; Lehtila, A.; Goldstein, G. Documentation for the TIMES Model Part I. IEA Energy Technology Systems Analysis Programme; IEA: Paris, France, 2005. [Google Scholar]
- Medeiros, A.; Raupp, I.; Damázio, J.; Costa, F. Incorporating the cost of water and carbon into long-term energy planning. In Proceedings of the XXV Seminário Nacional de Produção e Transmissão de Energia Elétrica, Belo Horizonte, Brazil, 10–13 November 2019. [Google Scholar]
- Carbon Pricing Leadership Coalition (CPLC). Report of the High-Level Commission on Carbon Prices; World Bank: Washington DC, USA, 2017. [Google Scholar]
- Brazil. Law No. 9433—Brazilian National Water Resources Policy; Brazil: Brasília, Brazil, 1997. [Google Scholar]
- Wernet, G.; Bauer, C.; Steubing, B.; Reinhard, J.; Moreno-Ruiz, E.; Weidema, B. The ecoinvent database version 3 (part I): Overview and methodology. Int. J. Life Cycle Assess. 2016, 21, 1218–1230. [Google Scholar] [CrossRef]
- Laurent, A.; Espinosa, N.; Hauschild, M.Z. LCA of Energy Systems. In Life Cycle Assessment; Hauschild, M., Rosenbaum, R., Olsen, S., Eds.; Springer International Publishing: Cham, Switzerland, 2018; pp. 633–668. [Google Scholar]
- ISO ISO 14040; Environmental Management—Life Cycle Assessment—Principles and Framework. International Organization for Standardization: Geneva, Switzerland, 2006.
- ISO ISO 14044; Environmental Management—Life Cycle Assessement—Requirements and Guidelines. International Organization for Standardization: Geneva, Switzerland, 2006.
- Bjørn, A.; Moltesen, A.; Laurent, A.; Owsianiak, M.; Corona, A.; Birkved, M.; Hauschild, M.Z. Life cycle inventory analysis. In Life Cycle Assessment: Theory and Practice; Hauschild, M., Rosenbaum, R., Olsen, S., Eds.; Springer International Publishing: Cham, Switzerland, 2017; pp. 117–166. [Google Scholar]
- Lassio, J.G.; Magrini, A.; Castelo Branco, D. Life cycle-based sustainability indicators for electricity generation: A systematic review and a proposal for assessments in Brazil. J. Clean. Prod. 2021, 311, 127568. [Google Scholar] [CrossRef]
- CML-IA Characterisation Factors. Available online: https://www.universiteitleiden.nl/en/research/research-output/science/cml-ia-characterisation-factors (accessed on 23 July 2022).
- Goedkoop, M.; Heijungs, R.; Huijbregts, M.; De Schryver, A.; Struijs, J.; Van Zelm, R. ReCiPe 2008—A Life Cycle Impact Assessment Method Which Comprises Harmonised Category Indicators at the Midpoint and the Endpoint Level; Ministerie van VROM: The Hague, Netherlands, 2008. [Google Scholar]
- Huijbregts, M.; Steinmann, Z.; Elshout, P.; Stam, G.; Verones, F.; Vieira, M.; Zijp, M.; Hollander, A.; van Zelm, R. ReCiPe2016: A harmonised LCIA method at midpoint and endpoint level. Int. J. Life Cycle Assess. 2017, 22, 138–147. [Google Scholar] [CrossRef]
- Burgi, A. Assessment of the Technical Potential of Solar Thermal Electricity Production in Brazil Based on GIS Modeling and Simulation of Virtual Plants; Federal University of Rio de Janeiro: Rio de Janeiro, Brazil, 2013. [Google Scholar]
- Corona, B.; San Miguel, G. LCSA applied to an innovative configuration of concentrated solar power. Int. J. Life Cycle Assess. 2019, 24, 1444–1460. [Google Scholar] [CrossRef]
- Bjørn, A.; Owsianiak, M.; Molin, C.; Hauschild, M.Z. LCA history. In Life Cycle Assessment: Theory and Practice; Hauschild, M., Rosenbaum, R., Olsen, S., Eds.; Springer International Publishing: Cham, Switzerland, 2017; pp. 17–30. [Google Scholar]
- NREL. System Advisory Model (SAM) (Version 2018.11.11). 2020. Available online: https://sam.nrel.gov/ (accessed on 13 April 2022).
- Blair, N.; Dobos, A.P.; Freeman, J.; Neises, T.; Wagner, M.; Ferguson, T.; Gilman, P.; Janzou, S. System Advisor Model, SAM; NREL Rep. No. TP-6A20-61019; National Renewable Energy Laboratory—Golden Campus: Golden, CO, USA, 2014. [Google Scholar]
- Burkhardt, J.J.; Heath, G.; Cohen, E. Life Cycle Greenhouse Gas Emissions of Trough and Tower Concentrating Solar Power Electricity Generation. J. Ind. Ecol. 2012, 16, S93–S109. [Google Scholar] [CrossRef]
- Norton, B.; Eames, P.C.; Lo, S.N. Full-energy-chain analysis of greenhouse gas emissions for solar thermal electric power generation systems. Renew. Energy 1998, 15, 131–136. [Google Scholar] [CrossRef]
- Lechón, Y.; de la Rúa, C.; Sáez, R. Life Cycle Environmental Impacts of Electricity Production by Solarthermal Power Plants in Spain. J. Sol. Energy Eng. 2008, 130, 021012. [Google Scholar] [CrossRef]
- Caldés, N.; Lechón, Y. Socio-economic and environmental assessment of concentrating solar power systems. In Concentrating Solar Power Technology, 2nd ed.; Lovegrove, K., Stein, W., Eds.; Woodhead Publishing: Duxford, UK, 2021; pp. 127–162. [Google Scholar]
- Heath, G.; Turchi, C.; Decker, T.; Burkhardt, J.; Kutscher, C. Life Cycle Assessment of Thermal Energy Storage: Two-Tank Indirect and Thermocline. In ASME 2009 3rd International Conference on Energy Sustainability, Proceedings of the ASME 2009 3rd International Conference on Energy Sustainability Collocated with the Heat Transfer and InterPACK09 Conferences, San Francisco, CA, USA, 19–23 July 2009; ASME: San Francisco, CA, USA, 2009; pp. 689–690. [Google Scholar]
- Lenzen, M. Greenhouse gas analysis of solar-thermal electricity generation. Sol. Energy 1999, 65, 353–368. [Google Scholar] [CrossRef]
- Asdrubali, F.; Baldinelli, B.; Presciutti, A.; Baldassarri, C.; Scrucca, F. Comparative analysis of solar power technologies through life cycle assessment approach. In Proceedings of the 3rd International Energy, Life Cycle Assessment, and Sustainability Workshop & Symposium (ELCAS3), Nisyros, Greece, 7–9 July 2013; pp. 1059–1067. [Google Scholar]
- Brazil. Brazilian Energy Balance 2014; Brazilian Energy Research Office: Brasília, Brazil, 2014. [Google Scholar]
- IEA. World Energy Balances; IEA: Paris, France, 2014. [Google Scholar]
- Viana, T.S. Potential of Electricity Generation with Concentrating Photovoltaic System in Brazil. Ph.D. Thesis, Federal University of Santa Catarina, Florianópolis, Brazil, 9 April 2010. [Google Scholar]
- Rohani, S.; Abdelnabi, N.; Fluri, T.; Heimsath, A.; Wittwer, C.; Ainsua, J.G.P. Optimized mirror cleaning strategies in PTC plants reducing the water consumption and the levelized cost of cleaning. In Proceedings of the AIP Conference Proceedings, Atlantic City, NJ, USA, 25 July 2019; American Institute of Physics Inc.: College Park, MD, USA, 2019; Volume 2126. [Google Scholar]
- Telsnig, T. Location-Specific Analysis and Assessment of Solar Thermal Power Plants in South Africa; University of Stuttgart: Stuttgart, Germany, 2015. [Google Scholar]


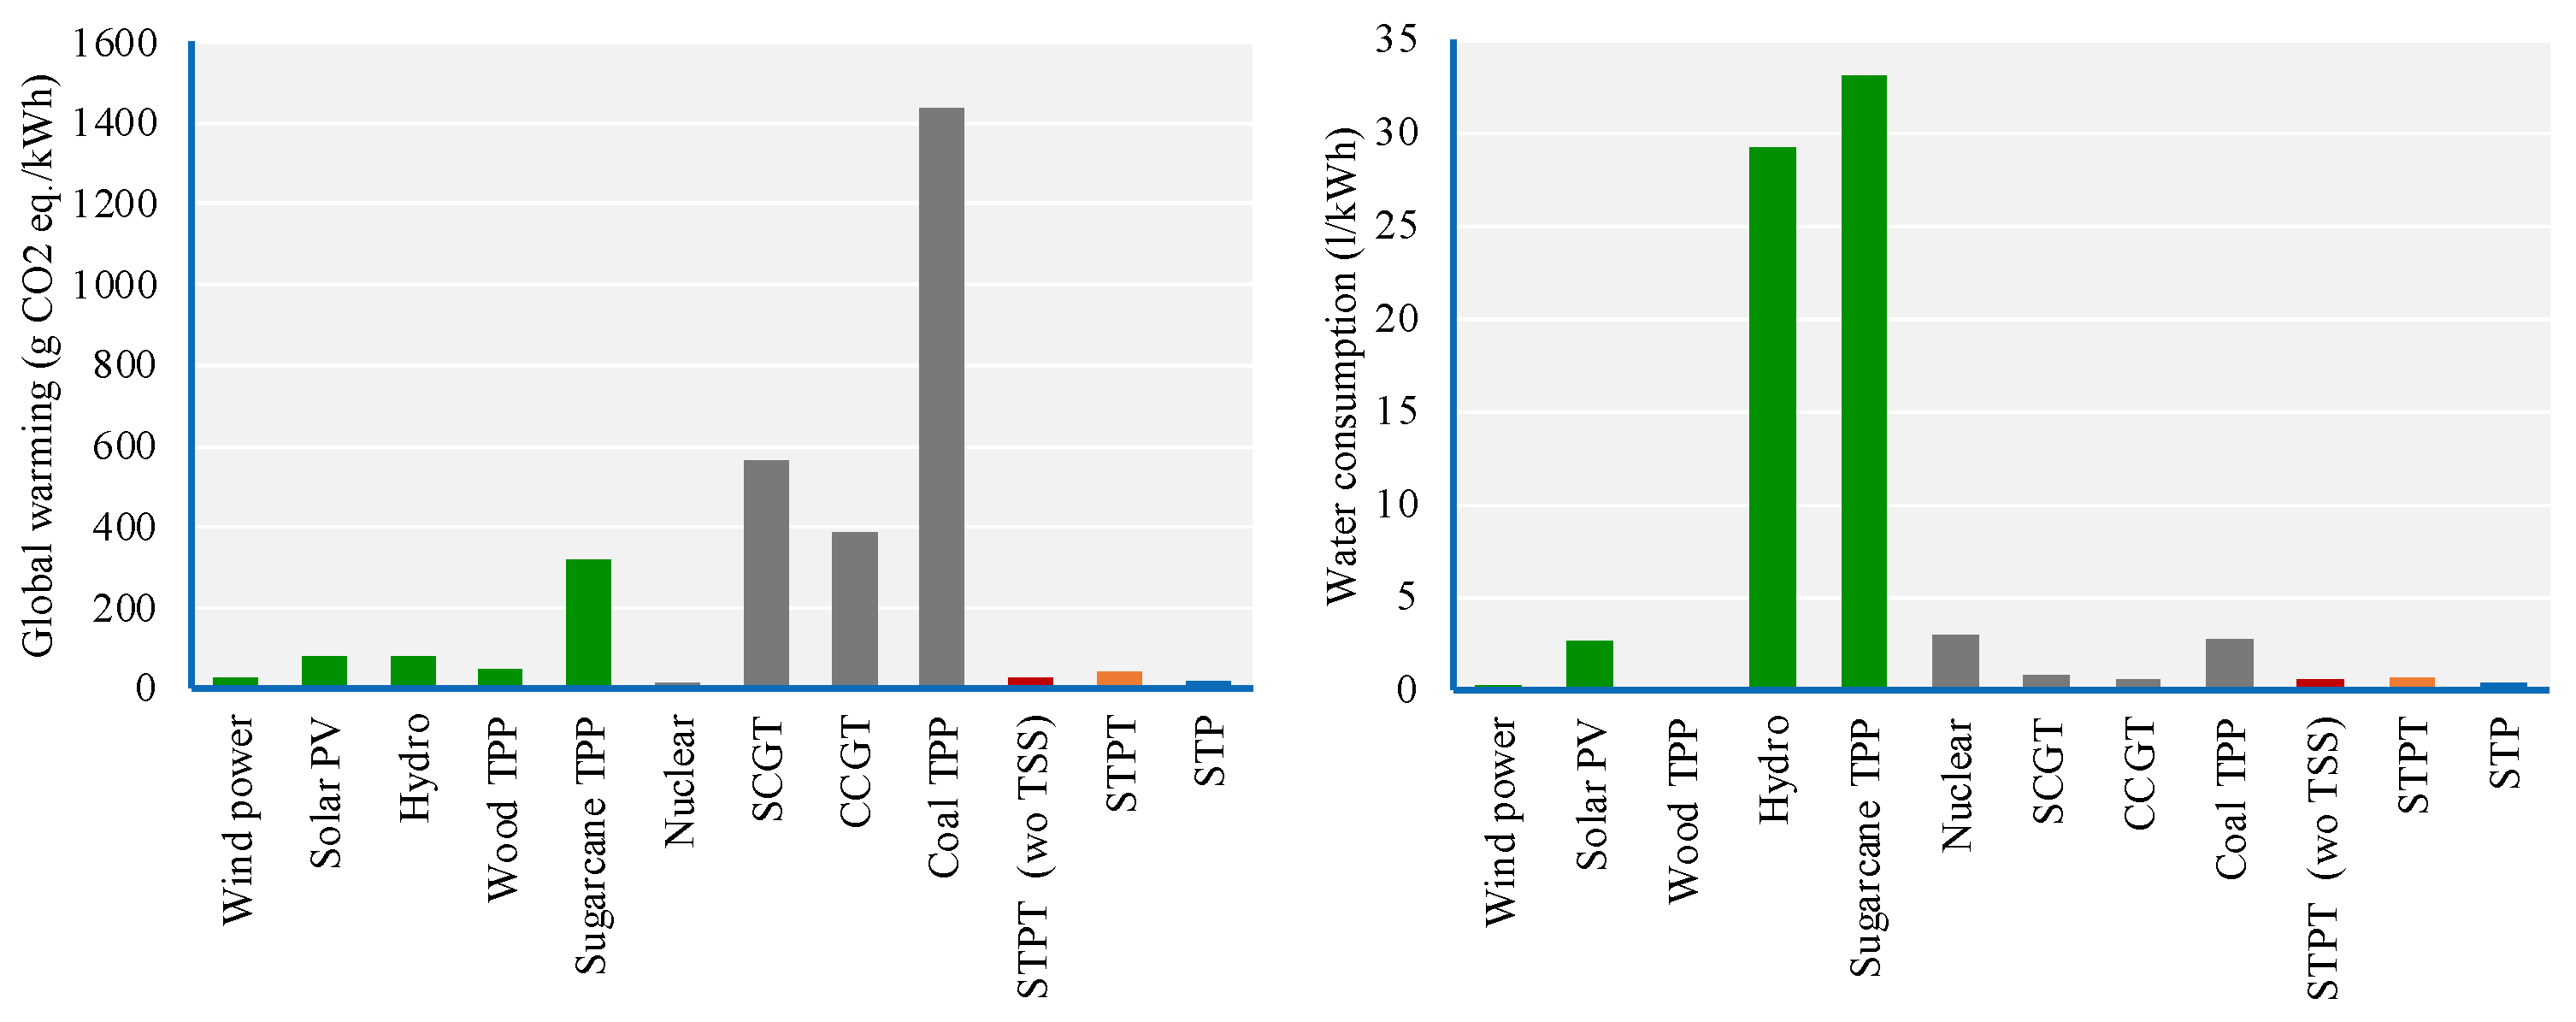
| Electricity Generation Technology | Impact Category | |
|---|---|---|
| Global Warming (g CO2eq./kWh) | Water Consumption (L/kWh) | |
| Wind power | 25.61 | 0.31 |
| Solar PV | 80.07 | 2.68 |
| Hydro | 81.08 | 29.30 |
| Wood TPP | 47.23 | 0.17 |
| Sugarcane TPP | 320.72 | 33.07 |
| Nuclear | 12.17 | 2.99 |
| SCGT | 565.64 | 0.85 |
| CCGT | 389.49 | 0.57 |
| Coal TPP | 1438.45 | 2.76 |
| CSP Technology | Installed Capacity | Thermal Storage System | Cooling System |
|---|---|---|---|
| Solar thermal parabolic trough without TSS (STPT w/o TSS) | 100 MW | - | Air cooling |
| STPT | 100 MW | 6 h | Air cooling |
| Solar tower power (STP) | 100 MW | 7.5 h | Air cooling |
| Main Components and Processes | CSP Technologies | ||
|---|---|---|---|
| STPT (w/o TSS) | STPT | SPT | |
| Installed capacity (From-to) | 50 MW–100 MW | 50 MW–100 MW | 20 MW–100 MW |
| Building structures and activities | () 1.6 1 | () 1.6 1 | () 2.56 2 |
| Collector filed area | Ratio between collector field areas | Ratio between collector field areas | Ratio between collector field areas |
| Power block | Ratio between installed capacity of the CSP plants | Ratio between installed capacity of the CSP plants | Ratio between installed capacity of the CSP plants |
| Receiver system | N/A | N/A | Ratio between tower heights |
| TSS | N/A | Ration between tank storage volumes | Ration between tank storage volumes |
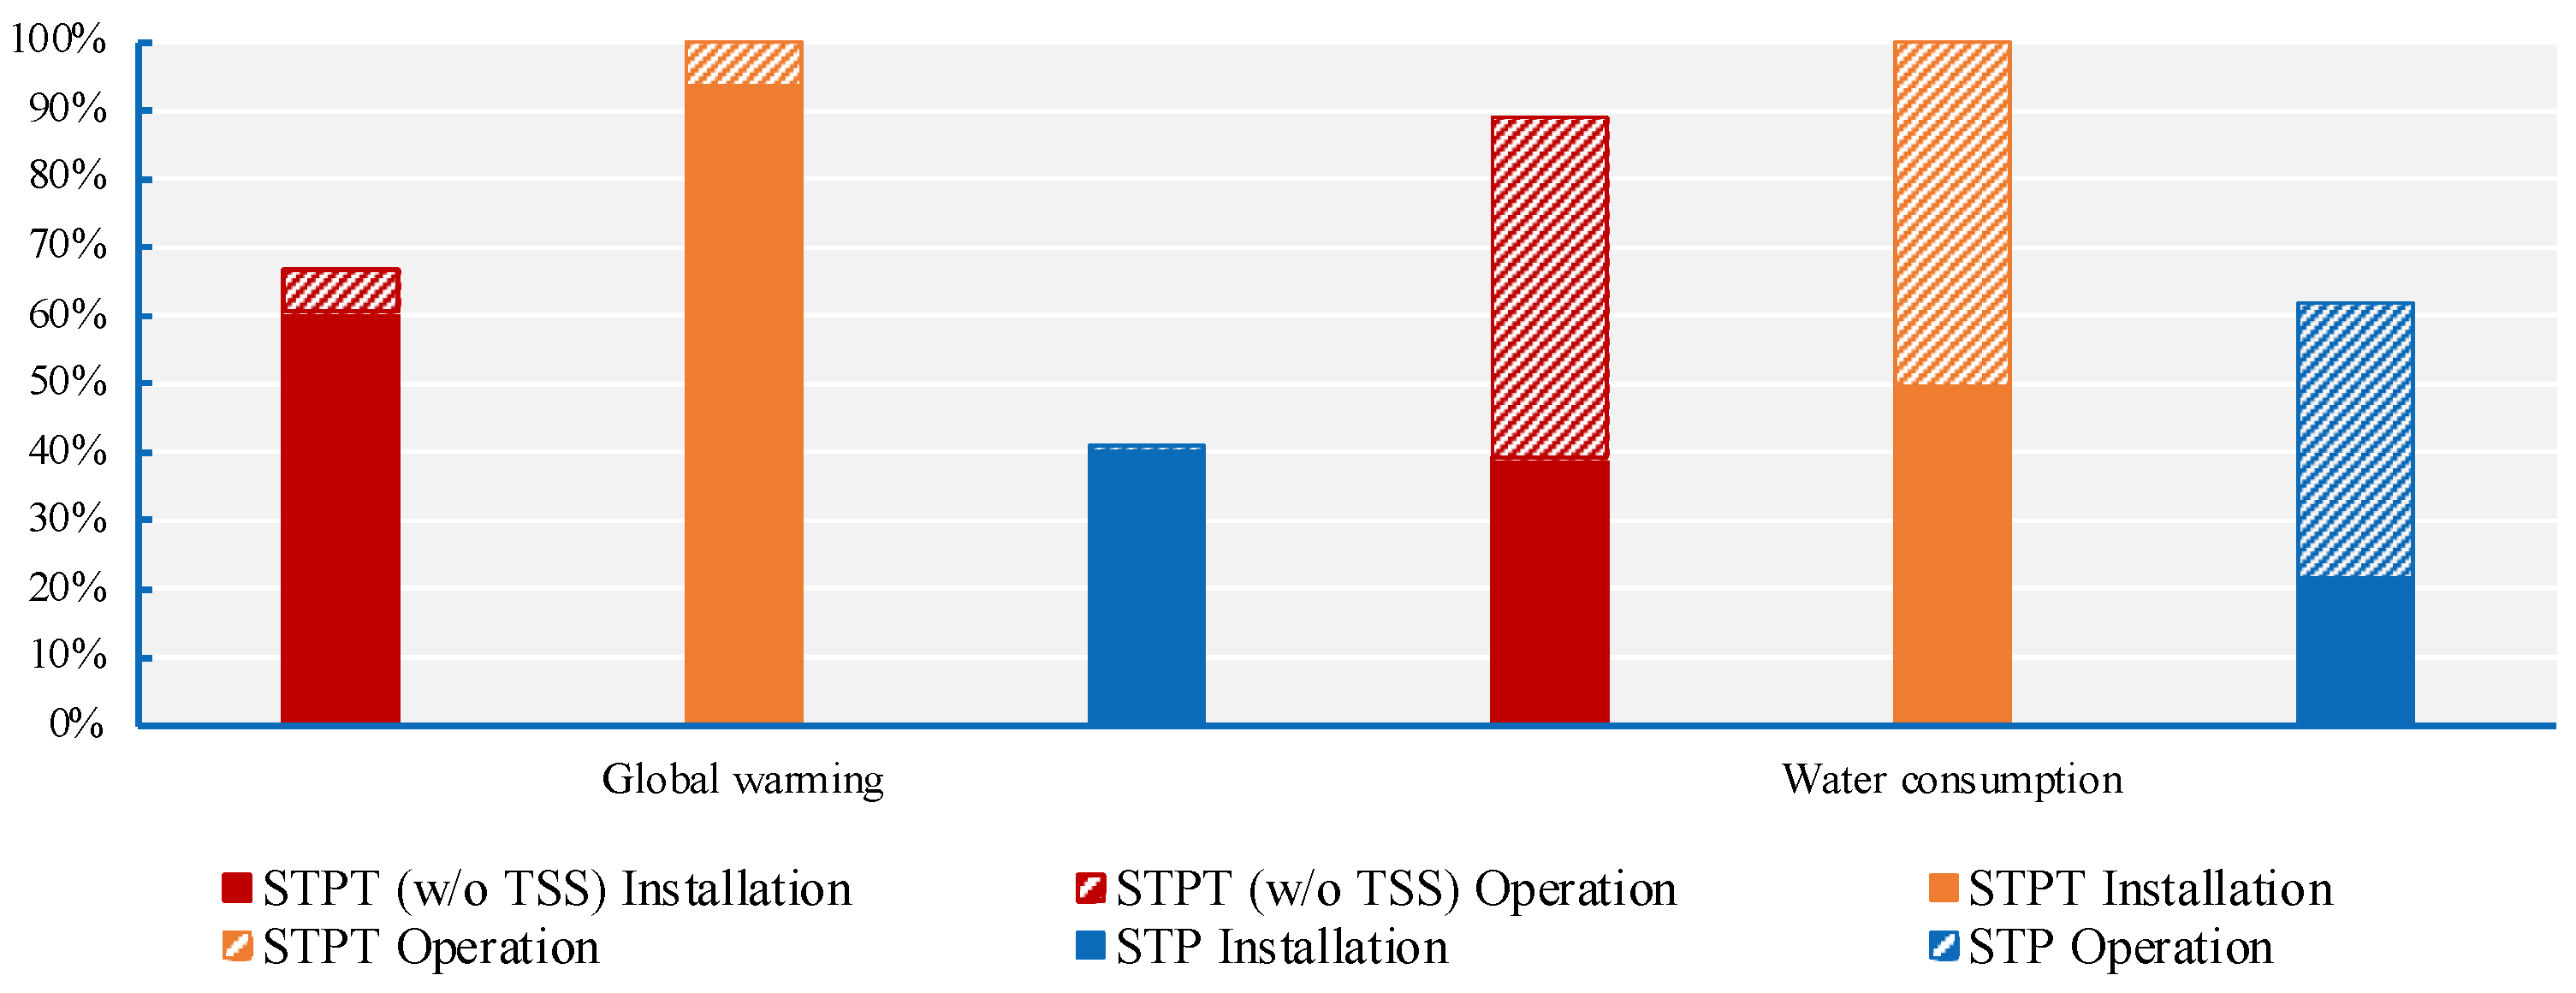
| Impact Category | Unit | STPT (w/o TSS) | STPT | STP | ||||||
|---|---|---|---|---|---|---|---|---|---|---|
| Inst. | Opr. | Total | Inst. | Opr. | Total | Inst. | Opr. | Total | ||
| Global warming | g CO2eq. | 25.43 | 2.59 | 28.02 | 39.30 | 2.60 | 41.90 | 16.81 | 0.41 | 17.22 |
| Water consumption | l | 0.26 | 0.33 | 0.60 | 0.33 | 0.34 | 0.67 | 0.14 | 0.27 | 0.41 |
Publisher’s Note: MDPI stays neutral with regard to jurisdictional claims in published maps and institutional affiliations. |
© 2022 by the authors. Licensee MDPI, Basel, Switzerland. This article is an open access article distributed under the terms and conditions of the Creative Commons Attribution (CC BY) license (https://creativecommons.org/licenses/by/4.0/).
Share and Cite
Matos, D.; Lassio, J.G.; Castelo Branco, D.; Pereira Júnior, A.O. Perspectives for Expansion of Concentrating Solar Power (CSP) Generation Technologies in Brazil. Energies 2022, 15, 9286. https://doi.org/10.3390/en15249286
Matos D, Lassio JG, Castelo Branco D, Pereira Júnior AO. Perspectives for Expansion of Concentrating Solar Power (CSP) Generation Technologies in Brazil. Energies. 2022; 15(24):9286. https://doi.org/10.3390/en15249286
Chicago/Turabian StyleMatos, Denise, João Gabriel Lassio, David Castelo Branco, and Amaro Olímpio Pereira Júnior. 2022. "Perspectives for Expansion of Concentrating Solar Power (CSP) Generation Technologies in Brazil" Energies 15, no. 24: 9286. https://doi.org/10.3390/en15249286
APA StyleMatos, D., Lassio, J. G., Castelo Branco, D., & Pereira Júnior, A. O. (2022). Perspectives for Expansion of Concentrating Solar Power (CSP) Generation Technologies in Brazil. Energies, 15(24), 9286. https://doi.org/10.3390/en15249286