Abstract
The twentieth century started with engineers’ new concepts and ideas to develop the built environment, with ideas ranging from reducing weight to automated industrialisation, enhancing energy efficiency, etc. However, they failed to predict the negative impact of automation on the environment and its resources. Therefore, future technologies proposed by engineers should consider the adverse effects on nature and the surrounding ecosystem. Using the science of ecology and integrating it into building typology can help avoid unwanted scenarios. Such technologies prioritise the performance of buildings and cities by using simulation tools to explore more ideas for designing and testing their performance. This work explores the obstacles and challenges opposing the plan to successfully supply Egypt with clean, renewable energy that reaches 42% of its total electricity. Furthermore, some solutions are proposed to tackle those barriers, such as installing thermal cooling systems and ball wind turbines in residential buildings.
1. Introduction
This work investigates the barriers and challenges facing Egypt and hindering the achievement of its plan to produce 42% of its electricity from renewable sources by 2035 [1]. At earlier stages of renewable energy, implementation barriers were related to societal, legislation, policymaking, economic, technological, research, and education reasons. However, with changes in legislations and energy tariffs and the expansion of renewable-energy-implemented projects, different threats have emerged resulting from the built environment, climatic conditions, operation and maintenance requirements, and other technical issues [2,3,4]. Identifying and removing barriers to renewables allows for a shift towards more localised energy and brings the power source closer to the people. The Egyptian building stock faces challenges in renewable energy integration, leading to low energy efficiencies and high energy consumption, the most consumable stage being the building’s operational stage [5]. Residential buildings represent an important sector, as they consume 40% of the total energy produced globally, which would largely contribute to the increased uptake of renewable energy [6]. Energy consumption in the building industry, particularly for heating and cooling, presents a significant challenge as the need for cooling solutions has increased worldwide in recent years, not only for high-income nations but also middle-income nations [7,8]. The Egyptian electricity consumption rate has one of the highest average annual growth rates worldwide, as it records 6.2% in the last two decades. More than half of the Egyptian electricity consumption is accounted for by the building sector [9]. According to the Ministry of Electricity and Renewable Energy in Egypt, the electricity consumption of the residential sector in Egypt was about 42.2% in 2016/2017, 42.3% in 2017/2018, 39.5% in 2018/2019, 41.4% in 2019/2020, and 0.40 in 2020/2021, as shown in Figure 1 [10]. The share for space cooling, HVAC equipment, and refrigeration electricity consumption in the Egyptian building sector is about 61–66% [9]. An Egyptian energy building code was developed by the Housing and Building Research Centre (HBRC) for implementation in new residential buildings to be an effective tool for energy reduction [11]. However, this is challenged by the architectural identity of the built environment in Egypt and the challenges associated with integrating renewables into heritage buildings [12]. Several studies have been conducted during the last ten years, investigating the uptake of renewable energy in Egypt. This study highlights some challenges and opportunities relevant to the built environment regarding integrated renewable energy in buildings.
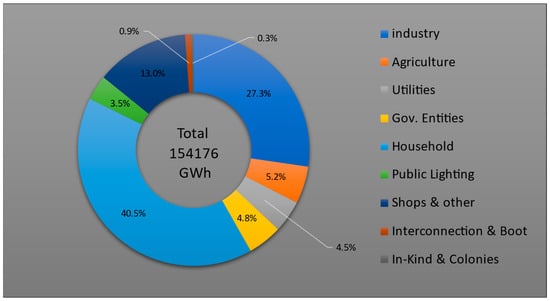
Figure 1.
Electricity consumption in Egypt classified by usage [10].
Studying the Egyptian Building Stock
Egypt’s total population has an annual change of 1.5%, with about 1,500,000 new individuals yearly. To cope with the population growth, it is estimated that the number of units needed annually is 175,000 to 200,000 [13]. In 2006, the total number of units reached 11.6 million; by 2017, it increased to 14.3 million. Building stocks in Egypt can be divided into eight types. Type 1 is high-rise buildings; each building contains more than five storeys with multiple apartments. This type can be mainly found in big cities, such as Cairo (24.1%) and Alexandria (25.43%). However, this type is only 10.44% of the total building units in Egypt [14,15]. Type 2 is medium-rise buildings; each building contains up to five storeys. This is the most dominant type in Egypt, with a percentage of 61% in all the country and 63.5% in Cairo [14,15]. Types 3 and 4 are low-rise buildings; type 3 are villas and type 4 are houses. Villas consist of one or two storeys and are occupied by a single family. They are mainly found in big cities, such as Cairo (5.8%) and Alexandria (5.1%). The last decade showed an increase in type 3 buildings, as shown in Figure 2, due to them being one of the most used types in the new cities built, such as New Cairo, El-Shorouk, New Heliopolis, El-Obour, October 6, and Sheikh Zayed. Type 4 is much similar than type 3 in structure. However, unlike type 3, it is mainly found in the countryside and not in major cities, and they are about 31.58% of buildings in Egypt [14,15]. Figure 2 compares the growth rates of buildings in the past decade in four different cities in Egypt. Other building types are nonresidential and work buildings (Hospitals, schools, etc.), commercial centres, chalets (resorts and tourist villages), regular housing units, public houses, and establishments [14,15]. Figure 3 shows the different percentages of residential building types in Egypt. Types 2, 3, and 4 are the most common, representing 79.84% of the total buildings, while type 1 represents only 10.44% of the buildings. Moreover, other nonresidential buildings represent only 10.08% of all buildings [14,15]. Based on the growth rates illustrated in Figure 2 and the estimation of share for space cooling, HVAC equipment and refrigeration electricity consumption in the Egyptian building sector is about 61–66% [9]. It may be concluded that the annual growth need for cooling space in Egypt may double or triple.
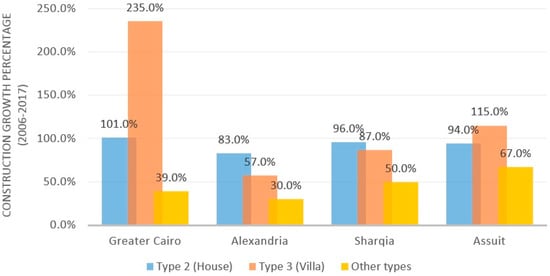
Figure 2.
The growth rate of buildings in the past decade in 4 different cities based on data from [14,15].
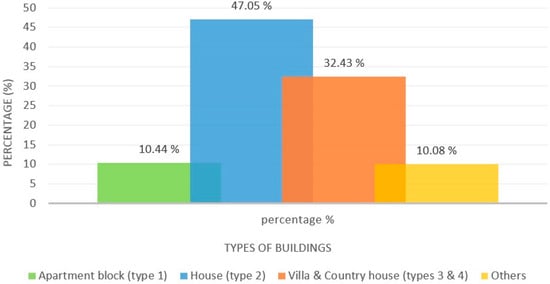
Figure 3.
Percentages of different buildings based on data from [14,15].
2. Recent Trends for Integrating RE Systems in Building Stocks
With the global economy’s rapid expansion, fossil fuel energy consumption has increased rapidly. Particularly in recent years, the world’s attention has been attracted to the energy crisis and environmental challenges. The growth in energy consumption and the depletion of fossil fuels have increased the need for the rapid development of renewable energy sources to meet demand. In response to these circumstances, the notion of sustainable development has progressively become the worldwide community’s consensus. Renewable energy has been extensively regarded as the key alternative energy for attaining sustainable development [16]. Energy is frequently considered the backbone of a country’s economic and human growth [17]. Energy is required for development, and sustainable energy systems are needed for long-term development [18]. Solar energy, wind energy, geothermal energy, ocean energy, and biomass energy are common renewable energy resources with high recyclability and low environmental contamination [16]. While the world has experienced a remarkable expansion in recent decades, with renewable energy sources reaching double-digit percentages in power supply in numerous nations, many other countries and industries remain at an introductory level in renewable penetration [19]. Since 1965, global energy demand has increased at an annual average of 2.2 percent [20]. According to the International Energy Agency [21], global energy consumption will increase by 25 percent in 2040.
Despite breakthroughs in renewable energy, the world is still far from fulfilling climate change targets. While the share of renewable energy in total energy use for various countries seems to be at a low level [22], indeed, during the previous two decades [23], renewable energy technologies have undergone significant growth and quick penetration, with the percentage of gross final energy consumption increasing from 9% in 2005 to 17% in 2020 [24]. According to the Energy Information Administration [25], the United States has the most significant CO2 emissions per capita, with energy consumption accounting for more than 80% of these emissions. To counteract this negative environmental effect, many private and public building owners require significant home energy use reductions [26]. Hence, renewable energy has become essential and desired all over the world, with adoption rapidly increasing in the last decade in most developed and developing countries such as Australia, Canada, China, Denmark, France, Germany, India, Italy, Japan, the Netherlands, Portugal, South Africa, Sweden, the United Kingdom, and the United States [27].
Renewable energy resources have become more appealing in these countries for producing electricity because the energy generated from renewable sources is considered cleaner, more cost-effective, environmentally friendly, and sustainable compared to energy generated from conventional or traditional power resources [26]. Nowadays, the development and use of renewable energy have already been recognised as an essential component of energy strategy in some countries, which have established national objectives or appropriate laws and regulations to stimulate domestic renewable energy development [27]. Canale et al. [28] opined that renewable energy exploitation is site-specific, catering to locally accessible renewable energy sources. As a result, moving to a renewable energy supply necessitates resource evaluations, appropriate technologies, and systems capable of appropriately integrating renewable energy sources by fulfilling demand with the appropriate temporal profile. There is a significant potential to use renewable energy in buildings, and associated technologies are continuously maturing.
In contrast, the use of solar power has garnered a growing amount of attention internationally due to its endless source and zero greenhouse gas emissions [16]. Past studies have identified the institutional structure as a predictor of renewable energy growth, with the number of factors proving to be huge, and the exact features of these determinants were frequently critical [29]. Overall, two significant aspects may be distinguished: First, regulatory measures are incredibly effective, such as feed-in tariffs [30,31] or building codes and standards [32]. Second, policy dependability and continuity impact perceived policy risk [33]. Photovoltaics and solar-thermal systems can be integrated into buildings through either superimposition, wherein the system is mounted over the existing building envelope, or integration, wherein the system is a part of the building envelope. A solar photovoltaic (PV) system or thermal system is said to be building-integrated if the solar collector or PV module is required to maintain the building’s functionality. In this case, dismounting the STS or PV module will affect either partially or entirely other building components and must be replaced with a conventional and appropriate building component.
This is primarily true in the case of structurally bonded modules, but it also holds in other situations, such as when one of the walls in a double-wall façade is replaced with building-integrated photovoltaic (BIPV) systems and building-integrated solar-thermal (BIST) systems [34,35]. Due to its versatility in energy production and easy integration into the design envelope of building designs, the idea of BIPV systems has recently received much attention from the global community, especially in the architectural and engineering sector. Due to the development and advancement of contemporary technology, the falling cost of the raw materials needed to produce PVs, and the rising number of government incentives and exemptions for adopting renewable energy technology, BIPV systems have become more appealing for future research and application. In recent years, the global BIPV system market has expanded quickly. Compared to the 343.12 MWp obtained in 2012, the annual global BIPV system installation is predicted to reach a fantastic 1152.3 MWp in 2019, with a compounded annual growth rate (CAGR) of 18.7 percent [33,34]. Solar building envelopes are becoming more and more popular. Solar building envelopes have several subdivisions, one of which is BIST systems. In 2002, a study investigated 14 BIST system installations and concluded that thermal expansion must be considered, heat-resistant materials must be employed, and peak temperatures for the heat-transfer fluid of up to 195 °C can be obtained during stagnation. Mineral wool 10 cm thick was used to prevent interior overheating. During days with high irradiance in the winter, up to 90% of thermal losses via the building envelope can be avoided over the BIST system areas.
Incorporating PV and solar-thermal-cooling (STC) systems into buildings gives them a more aesthetically pleasing appearance and doing so during construction is more cost-effective than hanging them later. For instance, they could offer a substantial amount of solar shading for the building, which is essential in hotter areas. Three zones are often used to integrate the systems into structures. Roofs, façades, and building elements such as balcony railings, sunshades, and sunscreens are included [34,35].
Wind energy is among the most promising renewable sources with the potential to be integrated with buildings. Several types of wind turbines can be classified under horizontal axis wind turbines (HAWTs) and vertical axis wind turbines (VAWTs). Both types have been available in the market of small-scale wind turbines for a while. A possible variant of the HAWT for small-power applications involves a diffuser shell that encloses the turbine. The function of this shell is to accelerate the flow before it passes through the turbine rotor, thus enhancing the power output of the turbine [36]. A brimmed diffuser is another variant, wherein the exit of the diffuser is equipped with a flange (called a brim), which creates a negative-pressure zone at the diffuser outlet, which causes more air induction into the diffuser (Figure 4) [37]. The performance of the brimmed diffuser is much better than the bare turbine [38]; therefore, it is more suitable for urban applications. VAWTs are also candidates to satisfy the need for wind-energy harvesting in urban environments considering their low cost, simple design, independence of wind direction, low noise level, and ease of maintenance.

Figure 4.
Diffuser-augmented HAWT with a brim (wind lens) 3 kW.
Further, VAWTs do not require installing high towers as the current practice in utility-scale turbines does. Therefore, they represent the feasible solution to a wide application soon in off-grid applications. Despite their merits, VAWTs suffer from two pitfalls. They are challenging to start, and their performance is not as good as HAWTs. Recent advances in numerical modelling have been used to investigate innovative methods for enhancing the performance of VAWTs, such as blade modifications and boundary-layer control. Several references are already available, reporting the outcome of these theoretical studies. These studies promise a breakthrough in turbine performance based on their results, which encourages more application of this type in urban applications [39].
The urban environment contains three types of buildings: (1) isolated low-rise buildings (height < 10 m, spacing > 10 m); (2) clusters of low-rise buildings (height < 10 m, spacing < 6 m); (3) isolated high-rise buildings (height < 30 m, spacing > 30 m); and (4) building blocks of high-rise buildings (height < 30 m, spacing 30 m). Various investigators have studied wind-energy utilization in urban environments. These studies included building aerodynamics investigations for the three categories shown in Figure 5 [40]: isolated buildings, simplified urban surroundings, and real cities. Studies related to isolated buildings focused on wind conditions over roofs and their suitability for wind turbine installation and sitting, concerning power concentration and turbulence tensity. Previous studies showed that the threshold height for a HAWT over a flat roof is around 30% of the building height. This threshold avoids high-turbulence-intensity zones. Below this threshold, the VAWT is more suitable. This conclusion is also dependent on the nature of the surrounding buildings. Flat roofs showed more advantageous conditions than pointed roofs (i.e., pitched and shed) [40]. Studies of simplified urban surroundings concerned the effect of the surrounding buildings on the wind flow around a target building for wind turbine installation [41]. Such an effect can be significant on available wind power, which is proportional to the cube of the wind speed. Few investigations have targeted entire urban areas [41]. Although the conclusions of such studies are only applicable to the particular case studied, their findings can provide guidelines for wind turbine positioning on similar building roofs. Wind-energy exploitation in building clusters or blocks has focused on flow through passages inside buildings (due to the possible large pressure difference in such areas). Buildings with double-skin façades can also produce similar effects [42].
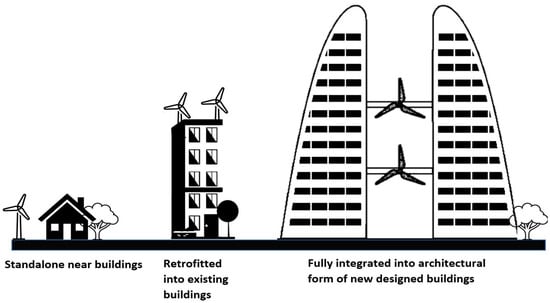
Figure 5.
Categories of urban wind-energy-harvesting systems.
Wind energy in urban areas can be harvested by installing wind turbines on the roofs of buildings, especially high-rise buildings. During the early stages of urban planning, voids between buildings represent a viable location for wind turbine installation since these voids enjoy high-speed wind conditions [43]. Existing building blocks can also be studied to evaluate the wind acceleration in these voids. Wind-energy harvesting in urban environments is an attractive distributed-energy generation option that can significantly reduce cities’ carbon footprints. Integrating wind turbine technology in the built environment poses significant challenges for technology providers and architects interested in this field. However, there are many challenges facing wind-energy harvesting in an urban environment, which can be summarised in the following points [44]: (1) low mean wind speed and high turbulence; (2) the presence of neighbouring buildings resulting in high fluctuations of wind speed; (3) employing small wind turbines results in less efficient wind-energy capture; and (4) concerns regarding noise, safety, vibrations, and public acceptance.
Wind behaviour upstream and downstream of high-rise buildings poses another challenge for wind turbine installations on building roofs [40]. The flows over rooftops of rectangular or square dimensions produce an amplification of velocity in the vertical direction [45]. A maximum velocity of 10% higher than the approach wind velocity can be reached while turbulence also increases. The normalized velocity gradually increases from the roof surface with the height until a maximum value is reached, whereas its turbulence intensity shows the opposite trend. Eventually, the rooftop flow recovers to the free stream flow. These phenomena are contributed to jointly by the acceleration effect and the presence of a boundary layer on the building roofs [40]. Therefore, wind turbines sitting on the building roof must be studied to maximize the energy yield of specific turbine sizes.
Rezaeih et al. [45] presented a framework for large-scale urban wind-energy potential assessment for roof-mounted wind turbines. They suggested the following tasks to obtain an annual energy yield assessment:
- -
- Collecting the building data, i.e., the number of potential candidates for high-rise buildings and their height and rooftop surface area.
- -
- Obtaining the annual mean wind-speed statistics at the height of these buildings and sorting the building data based on these statistics.
- -
- Obtaining the turbine characteristics and determining the average number of turbines per building roof.
- -
- Calculating the annual energy production (AEP).
They estimated that 150 KWh could be generated by installing 18,156 small wind turbines on the roofs of 1513 existing high-rise buildings in 12 major cities in the Netherlands.
3. Trends for Implementing RE in Buildings in Egypt: Opportunities and Challenges
Several studies have been conducted by researchers aiming at examining and proposing different opportunities for integrating renewable energy into the built environment in Egypt. The studies included coastal areas, desert areas, and urban city areas.
Badawy et al. [46] explored the potential of integrating PV solar systems onto pitched roofs in Port Fouad City, Egypt (representing the dominant building style in coastal cities in Egypt). Different PV solar panel technologies were compared and analysed using PV-Sol Premium software to find the optimised PV system design for all roof surfaces. The study recommended monocrystalline and thin-film technologies as preferable to polycrystalline for such types of villas under similar weather conditions in terms of performance. The study concluded that the monocrystalline array is preferable to the thin film, as the optimisation results showed that monocrystalline provides the highest performance and annual yield with the smallest covered roof area.
Attia [47] investigated active and passive design strategies for an existing chalet located on the Red Sea coastline of Egypt to reach a net zero energy with a retrofit approach. Several different strategies were applied to achieve net-zero-energy demand, such as reducing heat gain using a thermal-skin insulation strategy, reducing-internal-load strategy, passive-cooling strategy, solar-thermal system using solar-thermosyphon strategy, solar-electric-system strategy using polycrystalline-grid-connected panels, and wind-turbine-system strategy using small-scale wind turbines (D400 wind turbine). The study used TRNSYS simulation software to examine and compare the proposed approaches to achieve the net-zero-energy performance for the building. The study concluded that, although the intensity of solar radiation and the wind speed are strong and available, most active strategies, such as solar-electric and wind turbine systems, are not feasible. The only exception for solar-thermal systems was using thermosyphon with a 2–7 year payback period.
Fouad et al. [48] presented a study on a summer home located on Egypt’s north coast (usually occupied for only two to three months in the year), in which he proposed transforming the partly occupied residence into a green-energy building producing electricity and, accordingly, reducing consumption to gain profit from selling electricity to the public grid. An intelligent microgrid design was proposed, offering two-way communications between the user and the power supplier. Using HOMER software to simulate a hybrid power system including PV panels and wind turbines, it was shown that RE integration would result in a stand-alone feeding home during the summer period, with little feed from the general grid (about 1% of the consumption/year), while all the electricity produced during the year would be sold to gain profit.
Mourad et al. [49] proposed a new idea based on designing a sustainable, energy-efficient single-family smart home with integrated renewables as a prototype sample for new cities in Egyptian deserts. The suggested design used four cross-opening wind-catcher earth–air tunnels for fresh-air-cooling supply and a vertical and horizontal solar-chimney collector for hot-air exhaust, as shown in Figure 6. Moreover, hybrid photovoltaic–thermal collectors were used for electric power and heating provision. A small-scale vertical-axis helical wind turbine was proposed for electricity production, mounted on a side-hung tower. The proposed design was connected to the grid to obtain electricity from the public grid during off-peak hours. The study was conducted using ENER-WIN software to calculate the annual energy supply from the energy systems. It was shown that the suggested design could be efficient and save about 20% of the energy bill in cases of using the active-energy HVAC system. In the case of insufficient or exceeding power from renewable sources, the multiplexer was equipped with a smart meter for the energy-management system.
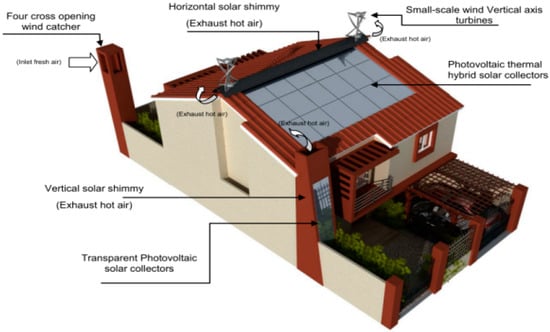
Figure 6.
The integrated renewable energy system in the building [49] Copyright 2022 WIT Press.
Samir and Ali [50] evaluated the possible opportunities for applying solar energy in existing buildings in Egypt to find the potential and constraints affecting the development of attaching or integrating photovoltaics in buildings in Egypt (BAPV and BIPV systems). Based on the installed PV type, the study determined the tilt angle by applying PV software for a maximised annual output of the PV panels. It was concluded that the BAPV system is more dominant in Egypt than BIPV, as in some cases, the esthetical aspects of architecture were neglected in favour of cost. So, the PV panels are just attached to the building’s roof, rather than dealing with a BIPV system’s complex structure, durable maintenance, and difficult mounting. The selected facilities for the case study are situated in Shobra Alkhima, Alexandria, Beheira, and Nasr City. Moreover, it was found that BIPV and BAPV systems are more effective when grid-connected than when they are stand-alone. In addition, the PV integration for nonresidential buildings with grid connection was found feasible for selling extra energy compared with residential constructions. The study also attributed the cost of the PV system to exporting solar cells and other components rather than local fabrication. In this context, it was shown by Kares and Singh [51], in a study on BIPV systems in residential buildings located in three cities (Cairo, Alexandria, and Asyut), that the price of electricity from PV systems was higher than grid electricity (up to 2016).
Rosado et al. [52], together with the local partner, the Khairy Foundation for Human and Social Development (KFHSD), implemented a project on “Sustainability Assessment of Nabta Smart Town (NST) and Actions for Improvement: an Overview”. The project created a design for an eco-city with an energy-efficiency feasibility assessment. The selected town for the study was Nabta Smart Town (NST), located in Alexandria—New Borg El Arab City. The study used TRANSYS software to estimate the energy demand of the town by generating building models. Three building models were created to simulate residential, office, and educational buildings. The energy assessment results depicted imported and exported energy from and to the grid, the on-site energy consumption from a PV system (energy produced and consumed in the same building), and the building-to-building energy transaction. It has been concluded that using a PV system alone generates more energy export than using a hybrid system of PV and wind renewable energy systems. In addition, building-to-building energy transactions were found less than on-site consumption.
Towards applying the concept of net-zero-energy buildings “NZEB”, Albadry [53] studied the applicability of converting existing residential buildings in the Nasr City area to NZEBs by applying retrofit actions and installing PV systems. The study showed that the building can be a zero-energy building if the electricity production was generated through renewable energy sources and the energy performance was enhanced. The proposed enhancement of the energy performance was completed by assessing the weather conditions in the study zone, collecting the building data, then applying the retrofitting approaches. These approaches included window type, coating, wall insulation, and roof insulation, all aiming to save energy inside the building. The optimal PV system and type that achieved annual electricity consumption equal to zero when subtracted from energy generated to be an NZEB was determined. Accordingly, the grid-connected system was suggested by this study for the existing buildings. Finally, the Design-Builder energy simulation software was used to analyse the effects of applying a retrofitting approach on the amount of electricity saved, and a cost analysis was conducted to calculate the savings. The study confirmed the feasibility of converting existing buildings in Egypt to zero-energy or near-zero-energy goals at an affordable price. In addition, this study recommended that the optimal PV panel type fitting with the Egyptian climate is the polycrystalline type, and the optimal PV system used in applying the retrofitting approach is the on-grid system. It is worth noting the disagreement with the previous study [46].
Khattab [54] discussed the economic aspects of integrating renewable energy in a residential building in Nasr City, Cairo, with a north–south orientation, to study the feasibility of converting it into an NZEB. The study identified a recommended optimal integrated renewable energy system for existing buildings in Egypt, with the overall system cost comparable to conventional methods. The economical alternative of renewable energy systems in buildings was selected using HOMER (hybrid optimisation model for electric renewables) software. The study proposed grid-tied or stand-alone systems without retrofitting approaches. The proposed systems consisted of two renewable energy sources, photovoltaic and wind for stand-alone cases, and only photovoltaic for the grid-tied case. The results showed that the wind hybrid system is not optimal compared to the hybrid PV/diesel/battery for the stand-alone. It was shown that the grid-tied system made the building nearly zero energy.
More studies explored different alternatives for integrating solar energy into buildings [55,56,57,58,59]. Eltanboly and Afify [55] explored an opportunity to convert existing building façades to be sustainable following three steps to design sustainable façades. First was analysis of energy consumption, then reduction in energy consumption, and, finally, fulfilment of energy requirements using renewable energy sources. Using the software tools Envi-met, world weather data, and climate consultant, the study showed that the large downtown Opera Garage building façade could be converted into a responsive façade. This would reduce the building’s energy consumption (depending on climate conditions). Rady et al. [56] proposed a conceptual design for using a small-scale solar-thermal power plant to produce electricity for a medical centre located in Egypt. Shouman [57] presented a study using PV solar-energy technology to feed electricity to rural residential buildings in villages in Egypt. Gabr et al. [58] evaluated the integration of a PV solar-energy grid connected to a residential building rooftop in Egypt. Shouman et al. [59] presented a study using a stand-alone PV solar system located in El kharga Oasis in Egypt to feed electricity to a family house without access to the general grid.
Unlike all previous studies, a recent study in Egypt by Elshazly et al. [60] investigated the energy produced by small-scale wind turbines (energy-ball wind turbine (EBWT)). The study suggested that this type of wind turbine has good options for being integrated into buildings. Small-scale wind turbines are added to building structures to create “building mounted” wind turbines, which can be successfully employed as a tower to raise the turbine to an appropriate height to obtain the desired wind flow. They can be supported independently by the building, but their integration into its design will help it merge with its surroundings. However, the building’s construction must be strong enough to support the turbine under all applicable loads and noise and vibration restrictions should be considered [61,62].
A recent review by Salma et al. [3] investigated the potential of renewable energy in several technologies in Egypt to show the market challenges and opportunities. The review presented studies covering solar, wind, hydropower, wave, tidal, bio-, nuclear, hydrogen, and geothermal energy for several applications and sectors in Egypt. Although this review by Salma et al. [3] presented valuable information on renewable energy in many sectors, integration of renewable energy in Egyptian buildings was overlooked. However, this review showed that recent optimization strategies for hybrid renewable energy systems with hydrogen technologies and other RE technologies should be seriously considered for developing trends and future directions for the Egyptian built environment. The previous studies also emphasized the need for investigations and analysis of effective approaches, opportunities, bottlenecks, and future potential capabilities for digitalization of energy systems and sustainable development goals, such as the grey wolf and crow search optimization (GWCSO) algorithm [63] and optimal GWCSO-based home appliance scheduling for demand response considering end-user’s comfort.
The previous review of the literature shows that most of the investigated models for integrating RE into the built environment in Egypt are based on PV systems. Yet, the limited space for integrating the needed number of panels to cover the whole energy demand has limited the success of these solutions, which has driven some researchers to suggest utilising façades. The review also shows the discrepancies and disagreements between some studies, possibly due to the variance in the studied locations and the different topologies included in the building stock, ranging from multistorey buildings in big cities to pitched roofs in coastal areas. Moreover, the review has revealed that hybrid systems have not been thoroughly investigated. Opportunities for novel ideas shall be presented in this work, motivated by integrating more than one system.
4. Case Studies for Novel RE Implementation
4.1. Introduction to Case Studies
In this study, the practicality of the application of solar-thermal-cooling systems and energy-ball wind turbines in new/existing low-rise buildings in new cities and the countryside (Figure 7), and small wind turbines on the roofs of high-rise buildings in Cairo, Egypt, is investigated.
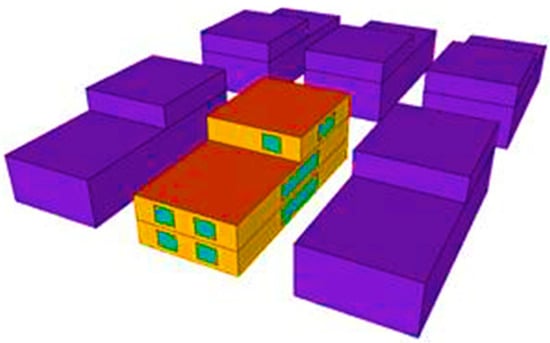
Figure 7.
The house model surrounded by shaded buildings (Google Sketchup).
Solar-thermal-cooling systems are based on absorption chillers. The idea of the absorption chiller depends on a thermochemical process involving water and a nontoxic solution to establish a pressure difference in mechanical compression that is used to compress and transport the refrigerant vapor to the condenser, rather than using mechanical ways. In addition, the absorption chiller can be operated using a heat source commercially available in the form of steam, gas, or hot water to operate the chiller rather than using electricity (which is conventionally utilised by most of the vapor-compression chillers) [64]. In solar-thermal-cooling systems, solar energy is used as the source of heating. The study includes the performance analysis of two types of energy-ball wind turbines available in the market by the Home Energy company: V100 and V200 EBWT. The V100 EBWT is a small, six-bladed, spherical wind turbine with a diameter of 1 m. The V200 features five rotor blades, with a larger diameter of roughly 2 m. The two versions are mounted on a free-standing pole and are set up to automatically point in the direction of the wind [65].
4.2. Methods and Tools
Two approaches were adopted to achieve the aim of this study: simulation and analytical analysis. The simulation tools utilised in this study are TRNSYS and ANSYS for evaluating the solar-thermal-cooling system and the energy-ball wind turbine, respectively. The data collected for the weather were obtained from the weather station located on the BUE Campus.
Figure 8 shows the main components of the solar-thermal-cooling system. Solar-thermal energy is used to provide the energy required to thermally power the chiller. In order to design the solar-thermal-cooling systems, a parametric analysis of the main parameters affecting the performance of the solar-thermal-cooling system is performed using different input values, as shown in Table 1. The outcome of the parametric analysis is used to develop the optimal system component size that can provide the solar-thermal-cooling (STC) system with the designated hot water temperature range (70–95 °C). The study was within the temperature range (70–95 °C) and mass flow rate (50 L/h.m2) recommended by the chiller manufacturer to avoid chiller failure. Furthermore, it should be noted that the chiller efficiency is limited, as it reaches its maximum efficiency at 90 °C, and then will gradually decrease. Increasing the temperature will cause an increase in the pressure, which brings the risk of chiller breakdown [66].
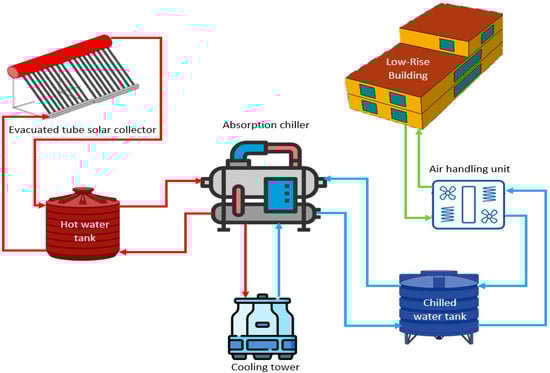
Figure 8.
Principal components of the solar-thermal-cooling system.

Table 1.
Initial parametric analysis layout.
The kinetic and potential energies and the annual wind energy of the wind turbines were evaluated at two wind speeds (0.8 m/s and 0.5 m/s). The local cities selected in this work were new cities (El-Shorouk, Sheikh Zayed, Obour, etc.) for villas and the countryside (Aswan, Luxor, etc.) for houses. The maximum wind energy can be delivered from the energy-ball wind turbine and from staggered small wind turbine arrangements on typical roofs of high-rise building clusters.
TRNSYS (TRaNsient SYstem simulation program) simulation tool was selected to be the tool for conducting the thermal analysis for the solar-thermal-cooling system as it represents the transient thermal analysis method. This method is based on running dynamic calculations based on transfer functions developed by Mitalas and Arsenault [67], which can generate outcomes over shorter time steps (hourly, minutely, etc.), with consequently improved accuracy. Figure 7 shows the house model.
4.3. Analysis of the Solar-Thermal-Cooling (STC) System
Table 1 lists the investigated parameters with their different values in the parametric analysis. The values are selected to represent the topologies relevant to Egyptian buildings. The building description, loads, required cooling-set-point temperature and relative humidity, and the necessary cooling load are shown in Table 2. The parametric analysis study covers three different ranges of values for the five main components (parameters) of the solar-thermal-cooling system. This parametric analysis included identifying the optimum system component sizes for the solar-thermal-cooling system that can accommodate the cooling loads required by the selected building types in Egypt; further details may be found in [66].
Table 2.
Building loads and properties.
The main components of the solar-thermal-cooling system (Figure 8) are as follows:
- -
- Evacuated tube solar collector
- -
- Hot and chilled water storage tanks
- -
- Absorption chiller
- -
- Cooling tower
- -
- Air-handling unit
5. Results
5.1. Results from the STC System Parametric Analysis
The most important design parameters of the system are the area of the solar collectors and the capacity of the storage tanks for specific water flow rates. Figure 9, Figure 10 and Figure 11 show the effects of the solar collector area on the average hot water temperatures entering the chiller from the tank at different pump mass flow rates. Figure 12 shows the effect of the storage tank capacity on the average hot water temperatures in the chillers. It can be observed that by increasing the solar collector area and hot storage capacity, the average inlet water temperature increases. At 0.6 kg/s, increasing the solar collector area (from 70 m2 to 130 m2) showed a significant increase in the inlet temperature from about 50 °C to 85 °C, when the storage capacity changes (from 1 m3 to 9 m3). The difference in temperature was more significant for a solar collector area between 70 m2 and 100 m2 than between 100 m2 and 130 m2. On the other hand, as for the hot storage capacity, increasing the storage volume from 1 m3 to 5 m3 showed a significant increase in temperature, while a lesser increase in temperature was observed between 5 m3 and 9 m3. Moreover, increasing both parameters reduced the temperature increment, which shows that the change between 9 m3 and 5 m3 at an area of 130 m2 was almost constant. The 0.8 kg/s and 1 kg/s followed the same trend as the 0.6 kg/s; however, the average temperature values were lower, which can be observed from Figure 12. It is also worth mentioning that at 1 kg/s, the change in temperature between the hot storage capacity was more significant than the other two flow rates, except between 9 m3 and 5 m3 for the 130 m2 area.
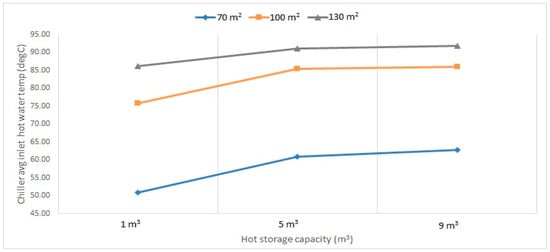
Figure 9.
Chiller average inlet hot water temperature at 0.6 kg/s for different hot storage capacities and solar collector areas (collector–HW tank–chiller) pumps flow rates.
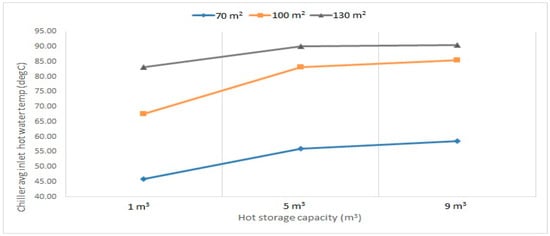
Figure 10.
Chiller average inlet hot water temperature at 0.8 kg/s for different hot storage capacities and solar collector areas (collector–HW tank–chiller) pumps flow rates.
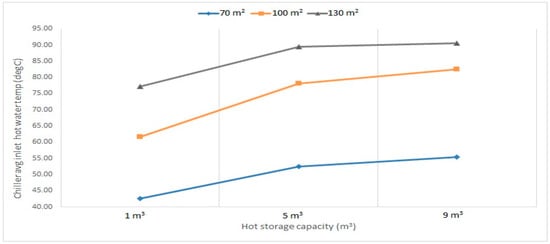
Figure 11.
Chiller average inlet hot water temperature at 1 kg/s for different hot storage capacities and solar collector areas (collector–HW tank–chiller) pumps flow rates.

Figure 12.
Chiller average inlet hot water temperature at 0.6, 0.8, and 1 kg/s (collector–HW tank–chiller) pumps flow rates.
A previous study by the authors showed that a solar-thermal collector area of 100 m2 and thermal storage of 5 m3 delivers 48.54 kW of thermal power to the absorption chiller from the thermal storage tank during the summer season, providing a cooling capacity of 35 kW. This is calculated from the following equations:
where EER for absorption chiller is 0.721; useful chiller load is 35 kW; and thermal power delivered to the chiller = 35/(0.721) = 48.54 kW.
Absorption chiller Energy Efficiency Ratio (EER) = (Useful chiller load in kW (Cooling capacity))/(Thermal power delivered to the chiller in kW)
It is worth noticing that this cooling power is almost equivalent to seven large air conditioners.
5.2. Results and Analysis of the Wind-Energy System
Low annual mean wind speeds and more turbulent flow are two key characteristics of the urban wind regime. When choosing turbines that can function in these circumstances, these qualities must be considered. The design must enable the turbine to respond swiftly to shifting wind directions, capture more energy from turbulent flows, and produce power even at low wind speeds. In addition, society demands that the turbine integrates smoothly into the building, both structurally and visually, with minimal maintenance and noise, especially in heavily crowded locations [67]. All these demands nominate Venturi turbines as a good option for such applications. The Venturi turbines’ aerodynamic characteristics allow the generation of a low-pressure area within the sphere, resulting in air being pulled in front of the rotor towards the sphere, increasing wind speed [60]. The two types of energy-ball wind turbines (EBWT) selected for this case study have their specifications shown in Table 3.
Table 3.
V100 and V200 EBWT specifications.
5.2.1. Mathematical Evaluation of the Wind Turbine Performance Parameters
Allowing a wind mass flow rate of 1 m/s through the turbine (as shown in Figure 13), we may create the continuity equation by using the following:
by neglecting ƍ, the density of air from both sides is
A1 v1 = A2 v2
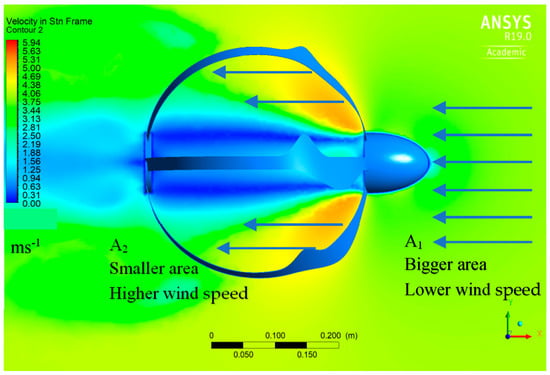
Figure 13.
Velocity distribution around the energy ball.
By calculating the area of each blade Ab and the area of the whole sphere area A, we can obtain the solidity percentage from the following equation:
The results show that the region inside the energy ball’s diameter is almost 0.8, and the solidity of the six-bladed EBWT is 23.4%. It can be shown from the following mathematical analysis that the speed increases by about 1.5 times the initial speed. Assuming upstream diameter (D1) = 1 m and inside ball diameter (D2) = 0.8 D1, it is shown that
¼ × П × (D1)2 × v1 = ¼ × П × (0.8 D1)2 × v2
0.785 v1 = 0.5024 v2
v2 = 1.56 v1
A1 > A2 and v1 > v2
Figure 13 illustrates the velocity distribution through the EBWT.
Three-dimensional simulations using computational fluid dynamics (CFD) ANSYS FLUENT are shown in Figure 14 and Figure 15, from which the mathematical approach, explained above, is illustrated. The velocity contours demonstrate the creation of low-velocity zones behind the turbine’s nose and high-velocity regions, particularly behind the blades. With an increase in tip speed ratio, the low-velocity area expands, and the increased-velocity area concentrates behind the turbine blades at high tip speed ratios. The blocking effect of the blades is increased with greater tip speed ratios, and a larger wake is created, which may impact the air moving through the turbine.
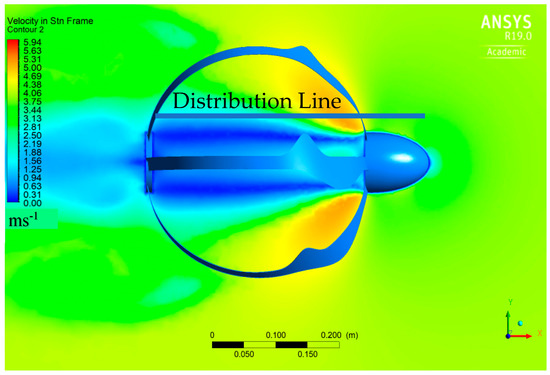
Figure 14.
Velocity contours around six-bladed EBWT at 0.8 TSR and illustration line for pressure and velocity distribution.
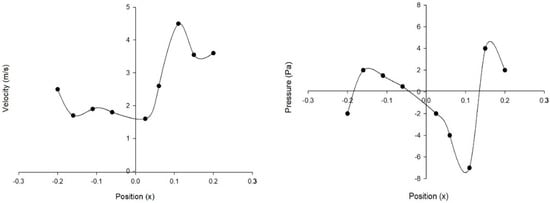
Figure 15.
Pressure and velocity distribution across the distribution line.
5.2.2. Analytical Evaluation of the Annual Wind Turbine Energy
Kinetic energy is the energy of motion of the moving air and can be calculated as:
Ec = ½ ƍ V v2
The air flowing through area A per second is expressed by:
V = A × v (m3/s)
So, wind power can be calculated by:
P = ½ ƍ × A × v3 (W)
Table 4 shows the calculated kinetic power, the annual potential wind power, the electric power output of the wind turbine (assuming Betz limit and yield losses), and the real yearly wind turbine energy production for V100 and V200 EBWTs for two different inlet wind speeds (5 m/s and 8 m/s).
Table 4.
Specifications and output of the wind turbines.
6. Discussion
Unlike most of the previous studies reviewed in this work [46,47,50,51,52,53,54,55], the case studies investigated through this study focus on two nonconventional renewable energy systems that have been discussed and presented as challenging [48,49,56,57,58,59,60,61,62,63,64,65,66,67] in Egyptian buildings. Though thermal-solar systems are widely used in new cities in Egypt with the primary function of heating water, they are not used to cool, as recommended by this study.
It can be revealed from the above two case studies that the application of an STC system is practically possible by using an evacuated tube solar collector with a total area of 100 m2 and a hot water storage tank with a capacity of 5 m3, which can be located at the top of the roof of the first and second floor of the building. The case study revealed that small-sized thermal-cooling systems with absorption chillers and a cooling tower could be integrated and fit into the available space of Egyptian buildings.
The findings also revealed that the energy-ball wind turbine (EBWT) could provide the household of a typical low-rise building in Egypt with around 4.4 kW of clean energy, annually, with only 8 m/s wind speed, which can be used to power low-capacity home appliances. In addition, one of the most severe constraints of wind-energy implementation in urban locations in Egypt is the presence of clusters of high-rise buildings (Figure 16). These clusters comprise groups of buildings 33 to 42 m in height, with spacing as small as 12 m. In some areas, small facilities exist in between high-rise buildings too. The only valuable areas for small wind turbines are the roofs of high-rise buildings. Intermediate-rise buildings in between have abysmal chances of harvesting a feasible amount of wind energy.
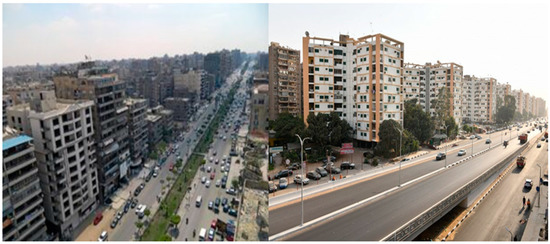
Figure 16.
Typical high-rise building layouts in Cairo (Nasr City), by authors.
In high-rise buildings, harvesting wind energy can be maximised by using conventional wind turbines on the roofs of these buildings, rather than using the energy-ball technique, but with some installation recommendations. The presence of high-rise buildings is considered an artificial roughness element that modifies the regular airflow pattern associated with ground effects. To install wind turbines in such situations, a rotor height of not less than 6 m above roof level is required. Considering the wake effect, small-power wind turbines must be installed staggered. A typical building footprint is 20 m × 30 m. This implies a possible downstream spacing between turbines of approximately 30 m and lateral spacing of 30 m (or 15 m for staggered arrangement. In terms of turbine rotor diameter of a HAWT, downstream spacing of 5 D and crosswind spacing of 3 D is usually recommended for turbines in clusters. This implies a maximum diameter of a HAWT, which can be adopted in an application of not more than 6 m. Since wind speed in urban areas cannot exceed 7 m/s, such a turbine would generate approximately 2 kW, assuming a HAWT power coefficient of 30%. If three turbines are installed on each roof, the total power generation per building using wind turbines could reach 6 kW. This power can be used to cover elevator loads as well as water-pumping loads for the building. Figure 17 shows a proposal for a staggered wind turbine arrangement on typical roofs of building clusters for two cases: a wind direction parallel to the building’s short side and a wind direction parallel to the building’s long side.

Figure 17.
Proposed staggered arrangement of wind turbines on the typical building roof by authors.
This study shows that despite the challenges facing RE integration in the built environment in Egypt, many opportunities appear for traditional and novel solutions. This study presents a novel solution of applying solar-thermal-cooling systems and energy-ball wind turbines to new/existing low-rise buildings in new cities and the countryside. However, it should be emphasized that governmental actions are necessary at this stage to achieve energy-efficient residential buildings [68]. This can only be achieved by generating effective energy-efficiency (EE) codes for residential buildings. Building energy-efficiency codes (BEECs) have been initiated in Egypt between 2005 and 2009 [69]. These codes were created to assure better energy performance for residential, commercial, and governmental buildings. Unfortunately, these codes have not met any compulsory actions to execute them on newly built dwellings and, consequently, no training for actors in the building chain has commenced, and no compulsory actions or obligations, nor encouragement policies that include incentives and penalties, have been generated to apply the BEECs in Egypt. Thus, the BEECs in Egypt have been voluntary until now.
The advance in technology witnessed by our societies now makes the implementation of sustainability ideas feasible. At this stage, thousands of research ideas and patents are produced each year, but what is really missing is the real implementation. However, this will not happen without establishing three main pillars (laws, people, and technology). Laws should be implemented by policy makers, people should be educated and trained, and technology should be made available to society. In the context of this work, energy efficiency in buildings and an integrated renewable energy built environment are a must.
7. Conclusions
The following conclusions are obtained from this study.
- (1)
- The Egyptian building stock has several standard features with trends in other countries. Significant research efforts have been contributed towards studying the opportunities of integrating renewables into the built environment and the reviewed studies showed good opportunities for integrating PV solar energy on the roofs of Egyptian buildings; however, actual implementation in Egypt has only been achieved on a very limited stage, almost only based on solar water heaters.
- (2)
- Solar-thermal-cooling systems are technically viable to be applied to low-rise buildings in Egypt. An evacuated tube solar collector with a total area of 100 m2 and a hot water storage tank with a capacity of 5 m3 can be located on the rooftop of these buildings.
- (3)
- Opportunities for integrating wind energy in the energy mix for residential applications exist by utilizing the energy-ball wind turbine (EBWT), which can provide the household of a typical low-rise building in Egypt with around 4.4 kW of clean energy annually with only 8 m/s wind speed. In high-rise buildings in Egypt, if three HAWTs are installed on each roof with the proposed staggered arrangement, the total power generation per building using wind turbines could reach 6 kW.
- (4)
- Serious efforts must be taken in Egypt towards the actual implementation and integration of renewables into the Egyptian built environment. Enforcing national and international codes is a must. Meanwhile, energy efficiency in buildings should be the starting point. Energy-efficient and integrated-renewable-energy built environments must be seriously investigated and implemented.
Author Contributions
Conceptualization, I.E.-M., A.M.R.E., O.T.O. and M.Q.R.; methodology, A.I.E. and E.E.; software, A.I.E., E.E., S.T.E.-B. and M.E.; validation, K.D. and A.M.R.E.; formal analysis, I.E.-M., O.T.O. and M.Q.R.; investigation, A.I.E., E.E., S.T.E.-B. and M.E.; resources, A.I.E., E.E., S.T.E.-B. and M.E.; data curation, A.I.E., E.E., S.T.E.-B. and M.E.; writing—original draft preparation, All authors; writing—review and editing, I.E.-M., M.Q.R. and O.T.O.; visualization, S.T.E.-B., M.E. and R.S.A.e.-L.; supervision, I.E.-M., A.M.R.E., O.T.O. and M.Q.R.; project administration, I.E.-M., A.M.R.E., O.T.O. and M.Q.R.; funding acquisition, M.Q.R., O.T.O. and I.E.-M. All authors have read and agreed to the published version of the manuscript.
Funding
This research was funded by the UK British Council allowing the project fund and The British University in Egypt allowing logistic support to the Centre for Renewable Energy to conduct this investigation.
Data Availability Statement
Not applicable.
Acknowledgments
The authors acknowledge the administrative support and kind assistance received by Ahmed Saleh (director of contracts and grants), Abdelwahab Ahmed (mechanical engineering TA), and Reem Ibrahim (accounting senior supervisor—finance department).
Conflicts of Interest
The authors declare no conflict of interest.
References
- NREA. Annual Report 2021; New and Renewable Energy Authority: Cairo, Egypt, 2021. [Google Scholar]
- IRENA. Renewable Energy Outlook: Egypt; International Renewable Energy Agency: Abu Dhabi, The United Arab Emirates, 2018. [Google Scholar]
- Salah, S.I.; Eltaweel, M.; Abeykoon, C. Towards a sustainable energy future for Egypt: A systematic review of renewable energy sources, technologies, challenges, and recommendations. Clean. Eng. Technol. 2022, 8, 100497. [Google Scholar] [CrossRef]
- El-Mahallawi, I.; Elshazly, E.; Ramadan, M.; Nasser, R.; Yasser, M.; El-Badry, S.; Elthakaby, M.; Oladinrin, O.T.; Rana, M.Q. Solar PV Panels-Self-Cleaning Coating Material for Egyptian Climatic Conditions. Sustainability 2022, 14, 11001. [Google Scholar] [CrossRef]
- Susan, S.; Wardhani, D. Building integrated photovoltaic as GREENSHIP’S on site renewable energy tool. Results Eng. 2020, 7, 100153. [Google Scholar] [CrossRef]
- Guen, M.L.; Mosca, L.; Perera, A.T.D.; Coccolo, S.; Mohajeri, N.; Scartezzini, J.-L. Improving the energy sustainability of a Swiss village through building renovation and renewable energy integration. Energy Build. 2018, 158, 906–923. [Google Scholar] [CrossRef]
- Hara Chakravarty, K.; Sadi, M.; Chakravarty, H.; Sulaiman Alsagri, A.; James Howard, T.; Arabkoohsar, A. A review on integration of renewable energy processes in vapor absorption chiller for sustainable cooling. Sustain. Energy Technol. Assess. 2022, 50, 101822. [Google Scholar] [CrossRef]
- Paraschiv, S.; Bărbuţă-Mişu, N.; Paraschiv, L.S. Technical and economic analysis of a solar air heating system integration in a residential building wall to increase energy efficiency by solar heat gain and thermal insulation. Energy Rep. 2020, 6, 459–474. [Google Scholar] [CrossRef]
- Ahmed, A.H.; Norhan, E.D.; Jan, G.; Nesen, S.-A. Cooling Sector Status Report Egypt: Analysis of the Current Market Structure, Trends, and Insights on the Refrigeration and Air Conditioning; Guidehouse Germany GmbH: Cairo, Egypt, 2022; Available online: https://www.coolupprogramme.org/wp-content/uploads/2022/07/Cool-Up_Cooling-Sector-Status-Report_Egypt_2022.pdf (accessed on 30 October 2022).
- MORE. Egyptian Electricity Holding Company: Annual Report 2020/2021; Ministry of Electricity & Renewable Energy: Cairo, Egypt, 2021.
- GamalEldine, M.; Corvacho, H. Compliance with Building Energy Code for the Residential Sector in Egyptian Hot-Arid Climate: Potential Impact, Difficulties, and Further Improvements. Sustainability 2022, 14, 3936. [Google Scholar] [CrossRef]
- Cabeza, L.F.; de Gracia, A.; Pisello, A.L. Integration of renewable technologies in historical and heritage buildings: A review. Energy Build. 2018, 177, 96–111. [Google Scholar] [CrossRef]
- UN. World Urbanization Prospects: The 2014 Revision, Department of Economic and Social Affairs, Population Division; United Nations: New York, NY, USA, 2014. [Google Scholar]
- CAPMAS. CAPMAS Statistical Yearbook; Central Agency for Public Mobilization and Statistics: Cairo, Egypt, 2017. Available online: http://www.capmas.gov.eg/Pages/StaticPages.aspx?page_id=5034 (accessed on 30 July 2022).
- CAPMAS. Housing Statistical Yearbook; Central Agency for Public Mobilization and Statistics: Cairo, Egypt, 2017. Available online: https://www.capmas.gov.eg/ (accessed on 30 July 2022).
- Zhang, W.; Liu, S.; Li, N.; Xie, H.; Li, X. Development forecast and technology roadmap analysis of renewable energy in buildings in China. Renew. Sustain. Energy Rev. 2015, 49, 395–402. [Google Scholar] [CrossRef]
- Adu, D.T.; Denkyirah, E.K. Economic growth and environmental pollution in West Africa: Testing the Environmental Kuznets Curve hypothesis. Kasetsart J. Soc. Sci. 2019, 40, 281–288. [Google Scholar] [CrossRef]
- Østergaard, P.A.; Sperling, K. Towards sustainable energy planning and management. Int. J. Sustain. Energy Plan. Manag. 2014, 1, 1–6. [Google Scholar]
- Østergaard, P.A.; Duic, N.; Noorollahi, Y.; Mikulcic, H.; Kalogirou, S. Sustainable development using renewable energy technology. Renew. Energy 2020, 146, 2430–2437. [Google Scholar] [CrossRef]
- Salam, R.A.; Amber, K.P.; Ratyal, N.I.; Alam, M.; Akram, N.; Gómez Muñoz, C.Q.; García Márquez, F.P. An Overview on Energy and Development of Energy Integration in Major South Asian Countries: The Building Sector. Energies 2020, 13, 5776. [Google Scholar] [CrossRef]
- IEA. Annual Energy Outlook. 2017. Available online: https://www.eia.gov/outlooks/aeo/ (accessed on 14 July 2022).
- Woldeyohannes, A.D.; Woldemichael, D.E.; Baheta, A.T. Sustainable renewable energy resources utilization in rural areas. Renew. Sustain. Energy Rev. 2016, 66, 1–9. [Google Scholar] [CrossRef]
- Eurostat. 2022. Available online: https://ec.europa.eu/eurostat/data/database (accessed on 1 July 2022).
- European Commission. A Clean Planet for all A European Strategic Long-Term Vision for a Prosperous, Modern, Competitive and Climate Neutral Economy. 2018. Available online: https://op.europa.eu/en/publication-detail/-/publication/59671a41-f3d6-11e8-9982-01aa75ed71a1/language-en (accessed on 19 July 2022).
- U.S. EIA. International Energy Outlook 2016; U.S. Energy Information Administration: Washington, DC, USA, 2016. Available online: www.eia.gov/forecasts/ieo/pdf/0484(2016).pdf (accessed on 30 July 2022).
- Hassan, A.A.; El-Rayes, K. Optimizing the integration of renewable energy in existing buildings. Energy Build. 2021, 238, 110851. [Google Scholar] [CrossRef]
- Mbungu, N.T.; Naidoo, R.M.; Bansal, R.C.; Siti, M.W.; Tungadio, D.H. An overview of renewable energy resources and grid integration for commercial building applications. J. Energy Storage 2020, 29, 101385. [Google Scholar] [CrossRef]
- Canale, L.; Di Fazio, A.R.; Russo, M.; Frattolillo, A.; Dell’Isola, M. An Overview on Functional Integration of Hybrid Renewable Energy Systems in Multi-Energy Buildings. Energies 2021, 14, 1078. [Google Scholar] [CrossRef]
- Curtius, H.C. The adoption of building-integrated photovoltaics: Barriers and facilitators. Renew. Energy 2018, 126, 783–790. [Google Scholar] [CrossRef]
- Zhao, Y.; Tang, K.K.; Wang, L.-l. Do renewable electricity policies promote renewable electricity generation? Evidence from panel data. Energy Policy 2013, 62, 887–897. [Google Scholar] [CrossRef]
- Antonelli, M.; Desideri, U. The doping effect of Italian feed-in tariffs on the PV market. Energy Policy 2014, 67, 583–594. [Google Scholar] [CrossRef]
- Polzin, F.; Migendt, M.; Täube, F.A.; von Flotow, P. Public policy influence on renewable energy investments—A panel data study across OECD countries. Energy Policy 2015, 80, 98–111. [Google Scholar] [CrossRef]
- Aguirre, M.; Ibikunle, G. Determinants of renewable energy growth: A global sample analysis. Energy Policy 2014, 69, 374–384. [Google Scholar] [CrossRef]
- Research, T.M. Global Growth And Factors Of Defibrillators Market 2019: Defibrillators Market (Advanced Life Support, Automated External Defibrillators, Implantable Cardioverter Defibrillators, Wearable Defibrillators)-Global Industry Analysis, Size, Share, Growth, Trends and Forecast, 2013–2019; Transparency Market Research: Albany, NY, USA, 2014. [Google Scholar]
- Maurer, C.; Cappel, C.; Kuhn, T.E. Progress in building-integrated solar thermal systems. Sol. Energy 2017, 154, 158–186. [Google Scholar] [CrossRef]
- Rezaeiha, A.; Montazeri, H.; Blocken, B. A framework for preliminary large-scale urban wind energy potential assessment: Roof-mounted wind turbines. Energy Convers. Manag. 2020, 214, 112770. [Google Scholar] [CrossRef]
- Takahashi, S.; Hata, Y.; Ohya, Y.; Karasudani, T.; Uchida, T. Behavior of the Blade Tip Vortices of a Wind Turbine Equipped with a Brimmed-Diffuser Shroud. Energies 2012, 5, 5229–5242. [Google Scholar] [CrossRef]
- Mohamed, A.; El-Baz, A.; Mahmoud, N.; Hamed, A.; El-kohly, A. CFD Simulation of Ducted Dual Rotor Wind Turbine for Small-Scale Applications. In Proceedings of the ASME 2019 Gas Turbine India Conference, Chennai, Tamil Nadu, India, 5–6 December 2019. [Google Scholar] [CrossRef]
- Ibrahim, A.A.; Elbaz, A.M.R.; Melani, P.F.; Mohamed, O.S.; Bianchini, A. Power augmentation of Darrieus wind turbine blades using trapped vortex cavity. J. Wind. Eng. Ind. Aerodyn. 2022, 223, 104949. [Google Scholar] [CrossRef]
- Toja-Silva, F.; Kono, T.; Peralta, C.; Lopez-Garcia, O.; Chen, J. A review of computational fluid dynamics (CFD) simulations of the wind flow around buildings for urban wind energy exploitation. J. Wind. Eng. Ind. Aerodyn. 2018, 180, 66–87. [Google Scholar] [CrossRef]
- Toja-Silva, F.; Peralta, C.; Lopez-Garcia, O.; Navarro, J.; Cruz, I. Roof region dependent wind potential assessment with different RANS turbulence models. J. Wind. Eng. Ind. Aerodyn. 2015, 142, 258–271. [Google Scholar] [CrossRef]
- Abohela, I.M.M.M. Effect of Roof Shape, Wind Direction, Building Height and Urban Configuration on the Energy Yield and Positioning of Roof Mounted Wind Turbines. Ph.D. Thesis, University of Newcastle Upon Tyne, Newcastle upon Tyne, UK, 2012. Available online: http://hdl.handle.net/10443/1686 (accessed on 30 August 2022).
- Abohela, I.; Hamza, N.; Dudek, S. Effect of roof shape, wind direction, building height and urban configuration on the energy yield and positioning of roof mounted wind turbines. Renew. Energy 2013, 50, 1106–1118. [Google Scholar] [CrossRef]
- Micallef, D.; van Bussel, G. A Review of Urban Wind Energy Research: Aerodynamics and Other Challenges. Energies 2018, 11, 2204. [Google Scholar] [CrossRef]
- Peng, H.Y.; Dai, S.F.; Lin, K.; Hu, G.; Liu, H.J. Experimental investigation of wind characteristics and wind energy potential over rooftops: Effects of building parameters. J. Wind. Eng. Ind. Aerodyn. 2020, 205, 104304. [Google Scholar] [CrossRef]
- Badawy, N.M.; El Samaty, H.S.; Waseef, A.A.E. Relevance of monocrystalline and thin-film technologies in implementing efficient grid-connected photovoltaic systems in historic buildings in Port Fouad city, Egypt. Alex. Eng. J. 2022, 61, 12229–12246. [Google Scholar] [CrossRef]
- Attia, S. Zero Energy Retrofit: Case Study of a Chalet in Ain-Sukhna, Egypt. In Proceedings of the 39th Annual American National Solar Energy Conference, Phoenix, AZ, USA, 17–22 May 2010; ASES: Singapore, 2010. Available online: https://www.researchgate.net/publication/339273977_Zero_energy_retrofit_Case_study_of_a_chalet_in_Ain-Sukhna_Egypt (accessed on 24 July 2022).
- Fouad, M.; Awny, K.M.; Hussein, A. Study to Turning Summer Home to Green Energy Building Through Design Smart Grid. Int. J. Civ. Eng. Technol. 2017, 8, 687–693. Available online: http://iaeme.com/Home/issue/IJCIET?Volume=8&Issue=12 (accessed on 24 July 2022).
- Mourad, M.M.; Ali, A.H.H.; Ookawara, S.; Abdel-Rahman, A.K.; Abdelkariem, N.M. An energy-efficient smart home for new cities in Egypt. In Proceedings of the ECO-ARCHITECTURE 2014, Siena, Italy, 24–26 September 2014; WIT Press: Southampton, UK, 2014. [Google Scholar] [CrossRef]
- Samir, H.; Ali, N.A. Applying Building-integrated Photovoltaics (BIPV) in Existing Buildings, Opportunities and Constrains in Egypt. Procedia Environ. Sci. 2017, 37, 614–625. [Google Scholar] [CrossRef]
- Kares, M.; Singh, P. Assesment of building integrated photovolatics for the residential section in representative Urban areas in Egypt. In Proceedings of the 2016 IEEE Global Humanitarian Technology Conference (GHTC), Seattle, WA, USA, 13–16 October 2016; IEEE: Piscataway, NJ, USA, 2016. [Google Scholar] [CrossRef]
- Antuña-Rozado, C.; Reda, F.; El Mahgary, Y. Smart and sustainable urban development in Egypt: The case of Nabta Smart Town. IOP Conf. Ser. Earth Environ. Sci. 2019, 297, 012002. [Google Scholar] [CrossRef]
- Albadry, S. Feasibility of Converting Existing Residential Buildings to Net-Zero-Energy Buildings in Egypt. Master’s Thesis, American University in Cairo-Egypt, Cairo, Egypt, 2016. Available online: https://fount.aucegypt.edu/etds/628/ (accessed on 30 July 2022).
- Khattab, N. A Feasibility Study of A Zero Energy Building in Egypt. Int. J. Eng. Inf. Syst. 2018, 2, 36–43. Available online: https://philarchive.org/archive/KHAAFS (accessed on 30 July 2022).
- Eltanboly, M.F.; Afify, M.M. The Influence of Using Responsive Façade as a Tool for Improving the Built Environment: Case study: Attaba–Opera square. IOP Conf. Ser. Earth Environ. Sci. 2022, 992, 012005. [Google Scholar] [CrossRef]
- Rady, M.; Amin, A.; Ahmed, M. Conceptual Design of Small-Scale Multi-Generation Concentrated Solar Plant for a Medical Center in Egypt. Energy Procedia 2015, 83, 289–298. [Google Scholar] [CrossRef][Green Version]
- Shouman, E.R. International and national renewable energy for electricity with optimal cost effective for electricity in Egypt. Renew. Sustain. Energy Rev. 2017, 77, 916–923. [Google Scholar] [CrossRef]
- Gabr, A.Z.; Helal, A.A.; Abbasy, N.H. Economic evaluation of rooftop grid-connected photovoltaic systems for residential building in Egypt. Int. Trans. Electr. Energy Syst. 2020, 30, e12379. [Google Scholar] [CrossRef]
- Shouman, E.R.; El Shenawy, E.T.; Khattab, N.M. Market financial analysis and cost performance for photovoltaic technology through international and national perspective with case study for Egypt. Renew. Sustain. Energy Rev. 2016, 57, 540–549. [Google Scholar] [CrossRef]
- Elshazly, E.; Eltayeb, N.; Abdel Fatah, A.A.; El-Sayed, T.A. Experimental and computational investigation of energy ball wind turbine aerodynamic performance. Adv. Mech. Eng. 2019, 11, 168781401987954. [Google Scholar] [CrossRef]
- Mertens, S. The wind conditions at flat roofs for small wind turbines. In Proceedings of the European Wind Energy Conference, Madrid, Spain, 16–19 June 2003. [Google Scholar]
- Müller, G.; Jentsch, M.F.; Stoddart, E. Vertical axis resistance type wind turbines for use in buildings. Renew. Energy 2009, 34, 1407–1412. [Google Scholar] [CrossRef]
- Waseem, M.; Lin, Z.; Liu, S.; Sajjad, I.A.; Aziz, T. Optimal GWCSO-based home appliances scheduling for demand response considering end-users comfort. Electr. Power Syst. Res. 2020, 187, 106477. [Google Scholar] [CrossRef]
- Noor, D.N.; Arshad, A.; Azran, Z.; Ibrahim, H.; Basrawi, F. A review on the recent development of solar absorption and vapour compression based hybrid air conditioning with low temperature storage. MATEC Web Conf. 2016, 38, 02007. [Google Scholar] [CrossRef]
- Home Energy. 2022. Available online: https://www.homeenergy.nl/en-gb/home (accessed on 1 July 2022).
- Elshamy, A.I. Investigating the Potential for Implementing Solar Thermal Cooling Systems and Energy Efficiency Measures for Dwellings in Egypt. Ph.D. Thesis, Loughborough University, Loughborough, UK, 2020. Available online: https://repository.lboro.ac.uk/articles/thesis/Investigating_the_potential_for_implementing_solar_thermal_cooling_systems_and_energy_efficiency_measures_for_dwellings_in_Egypt/13721494 (accessed on 30 July 2022).
- Dutton, G.; Halliday, J.A.; Blanch, M.J. The Feasibility of Building-Mounted/Integrated Wind Turbines: Achieving Their Potential for Carbon Emission Reduction Final Report of Carbon Trust Contract 2002-07-028-1-6. London, UK. 2005. Available online: https://ukerc.rl.ac.uk/pdf/BUWT_final_v004_full.pdf (accessed on 30 July 2022).
- De Lieto Vollaro, R.; Guattari, C.; Evangelisti, L.; Battista, G.; Carnielo, E.; Gori, P. Building energy performance analysis: A case study. Energy Build. 2015, 87, 87–94. [Google Scholar] [CrossRef]
- Edeisy, M.; Carlo, C. Energy Efficiency for Egyptian Housing: Code Compliance and Enforcement. Int. J. Constr. Environ. 2018, 9, 1–15. [Google Scholar] [CrossRef]
Publisher’s Note: MDPI stays neutral with regard to jurisdictional claims in published maps and institutional affiliations. |
© 2022 by the authors. Licensee MDPI, Basel, Switzerland. This article is an open access article distributed under the terms and conditions of the Creative Commons Attribution (CC BY) license (https://creativecommons.org/licenses/by/4.0/).