Abstract
A systematic study of the influence of synthesis conditions on the structural, morphological, and electrical properties, as well as the electrochemical performance of hemp fiber-derived carbon materials was performed. An analysis of the capacitive response of carbons obtained under various activation conditions with additional treatment with HNO3 and annealing was completed. The contribution of the formation of an electrical double layer at the outer electrode–electrolyte interface, as well as on surfaces inside micropores, has been studied and analyzed in terms of the effect of the turbostratic carbon properties (average lateral size of graphite crystallites, pore size distribution, BET surface area).
1. Introduction
Ensuring energy security is a goal pursued by countries in order to maintain the efficient functioning of their economies and the population’s access to reliable and affordable sources of energy. Growth in the world’s demand for energy has led to the constant use of energy sources based on fossil fuels (coal, oil, and gas) [1]. This situation creates a number of problems, such as nonrenewable energy resource depletion leading to a threat to energy security, greenhouse gas emissions, the harmful ecological footprint of modern production, and in general, a threat to the safety of human life [2,3,4]. Nevertheless, the yearly report of the International Energy Agency reasonably predicts that liquid, gaseous, and solid fuels of various types will continue to make a major contribution to the global energy mix up to the year 2050 [5]. Considerable attention is paid to the study of energy security [6]. The world continues to actively develop new technologies and effective methods for the intensification of oil, gas, and coal production [7,8,9], which require reliable equipment [10,11,12,13]. In particular, classic and new mining technologies, including environmentally attractive and energy-saving ones are being modernized to increase the productivity of oil and gas fields [14,15,16]. However, an energy system designed in this way is the single largest source of anthropogenic greenhouse gases; therefore, it is no surprise that decarbonizing the supply of energy services is a key element of climate change policy [17].
Electricity is taking on an ever-more central role in the lives of consumers and, for an increasing number of households, it promises to become the energy source on which they rely for allof their everyday needs, including mobility, cooking, lighting, heating, and cooling. Clean, efficient, and sustainable ways to store energy are needed to solve energy demand problems. For electrical energy storage, it is necessary to develop an inexpensive material that can be synthesized from widely available renewable energy sources and natural resources [18,19]. It should be noted that the electrical properties of carbon strongly depend on obtaining methods and postprocessing conditions [20,21]. Versatile electrode materials, especially carbon-based hybrids, play a decisive role in the adhibition of various types of energy conversion and storage equipment [22].
Porous carbon materials (PCMs) are multifunctional materials with a very wide range of applications, from medicine to nanoelectronics. According to the Franklin model, PCM or glassy carbon can be described as a system formed by agglomeration and sintering of turbostratically organized multilayer packages of sp2-carbon layers separated by disordered sp3-carbon, which form a complex spatial network [23,24]. The presence of cross-links (bridges) between packages (graphite crystallites) in PCMs determine their resistance to graphitization under temperature influence, the mechanical properties, and the ability to form pores of a certain size. The Franklin model assumes the reconstruction and growth of randomly oriented packages of stacked graphitic layers during heat treatment as a result of structural changes of the amorphous carbon surrounding them. Typical sizes of packages in the direction normal to the (002) basal plane are about 3–4 nm, while the lateral size varies widely from ranges of 3–5 to 10–20 nm, and depends on the type of raw material and the method of synthesis [24]. An increase in interplanar distances up to 0.35–0.37 nm is observed in comparison with bulk graphite at (d(002) = 0.335 nm). An increase in temperature causes a spatial separation of crystal-ordered and amorphous regions with the formation of a framework built by interconnected packages of graphitic planes. Functional groups located on the surfaces of graphitic planes will determine the properties of carbon materials [25]. When functionalized carbon is used as an electrode material, the electrochemical activity of functional groups makes it possible to use rapid redox reactions as a way of charge accumulation by the so-called pseudocapacitive mechanism. The presence of surface functionalities and heteroatoms makes it possible to improve the properties of the PCM for specific applications, primarily adsorption and electrochemical applications. The electrochemical activity of nitrogen functionalities makes it possible to use rapid surface redox reactions for charge accumulation (pseudocapacitive mechanism) [26]. At the same time, nitrogen-containing functional groups increase the wettability of the carbon surface by an aqueous electrolyte, which makes it possible to increase the capacitance by using small-radius pores for the formation of the electrical double layer (EDL) (an electrostatic mechanism) [27]. An increase in electrical conductivity is another benefit of carbon doped with nitrogen, resulting in an increase in capacitance [28]. Moreover, finding a balance between structural, morphological, and electrophysical properties is fundamentally important for obtaining carbon materials with the most improved characteristics.
There are already a few works dealing with the synthesis of carbon from hemp bast fiber, for example [29,30,31], but a feature of our work is the complex optimization of morphological and electrical properties of hemp-derived carbons for electrodes of symmetric supercapacitors. Comparatively to [32], the novelty of this work lies inthe analysis of the nitrogen functionality effect of capacitive properties of hemp-derived carbon with the separation of EDL and pseudocapacitive mechanisms of charge storage.
The purpose of this work is to study the porous carbon synthesis conditions influence from hemp bast fiber on its physical and electrochemical properties for the further use of porous carbon as an electrical energy store.
To achieve the goal, the following tasks should be completed:
- -
- development of a technology for the production of carbon from hemp bast fiber;
- -
- investigation of the effect of carbon synthesis modes on the structure, spectra, porosity, electrical conductivity at different voltage frequencies and temperatures, and electrochemical properties.
2. Materials and Methods
Hemp bast fiber was used as a precursor for the preparation of carbon. For theresearch, samples of porous carbon were produced according to the developed technological process (Figure 1).
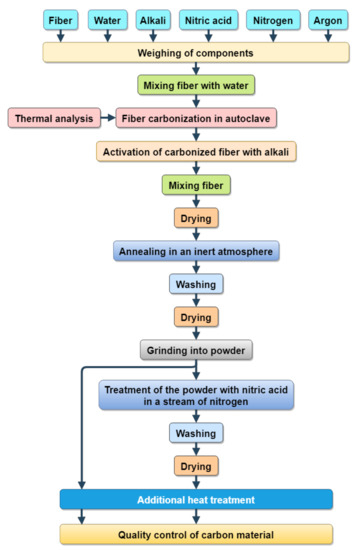
Figure 1.
Scheme of carbon manufacturing hemp bast fiber.
Hemp bast fiber was used as a precursor for carbon preparation. A mixture of hemp fiber and water (mass ratio about 1:1) was transferred to a stainless steel autoclave and carbonized at 800 °C. The self-locking threaded connections were used [33] for the autoclave design. The conditions of the carbonization procedure were based on a previous thermal analysis of the hemp fiber [34] according to which thermal treatment of hemp fiber at 400 °C leads to thermal depolymerization of hemicellulose and cellulose as well as thepartial decomposition of lignin.
Chemical activation of the carbonized fiber was carried out using KOH as a chemical activation agent. The mass ratio of KOH, carbon, and water upon the activation procedure was 1:1:1 (sample K1) or 1:2:1 (sample K2). The resulting mixtures were stirred for 2 h, dried at 90 °C, and annealed in an argon atmosphere at 600 °C (heating rate of 10 °C/min) for 20 min. The obtained carbons were washed to pH = 5.5–6.0, dried, and ground to a fraction of 100–150 μm. The carbon powders were mixed with HNO3 as the nitrogen source with stirring at 70 °C under N2 stream, and after washing and drying, they were labeled as KN1 and KN2, respectively. Additional thermal treatment of both initial and nitrogen-doped carbons was carried out in air at 400 °C for 1 h; the resulting samples were labeled as KO1 and KO2, and KNO1 and KNO2, respectively. For the synthesis of porous charcoal, vicor was tested chemically and qualified for analyses.
X-ray diffraction (XRD) phase analysis (XRD-7000, Shimadzu, Kyoto, Japan) was performed using CuKα-radiation with 2θ scanning from 10° to 70° with a step of 0.02°.
The Raman spectra were measured on a T64000 Jobin-Yvon spectrometer (1800/mm, resolution about 1 cm−1) in reverse dispersion geometry using an argon–krypton laser (λ = 488 nm). The laser irradiation power was less than 1 mW/cm2, which made it possible to avoid local overheating of the samples.
The specific surface area and pore size distribution of the carbon samples were analyzed by a nitrogen adsorption–desorption method on a Quantachrome Autosorb Nova2200e porosimeter. The carbon samples were predegassed at 160 °C for 18 h. The specific surface area (SBET, m2/g) was estimated by the multipoint BET method. The calculation of the pore size distribution was carried out by the nonlocal density functional theory (NLDFT) method in the approximation of slit-like pores.
The frequency dependence of electrical conductivity was studied by impedance spectroscopy (Autolab PGSTAT 12/FRA-2) in the frequency range of 0.01–100 kHz and the temperature range of 25–175 °C. Cylindrical samples with a diameter of 2.5 cm were obtained by pressing at 20 kN. Electrical conductivity was measured on samples compressed between two stainless steel electrodes in a spring-loaded sample holder.
The foil made from thermally expanded graphite (TEG) on a rolling machine was washed with acetone and dried in air at 70 °C. The foil was coated with an aqueous slurry-like mixture containing 85 wt. % carbon material, 10 wt. % carbon black Super P, and 5 wt. % polyvinylidene fluoride (PVDF). The slurry was applied to a TEG foil substrate at 110°C followed by vacuum drying for 5–6 h (coating area about 1.5 cm2). Electrochemical performance was tested for a symmetric configuration (two identical electrodes) in coin cells and 6 M aqueous KOH electrolyte using galvanostatic charge–discharge cycles. Cyclic voltammetry (CVA) study was carried out in a three-electrode cell with an Ag/AgCl reference electrode, a platinum plate as a counter electrode, and a “carbon on TEG” working electrode. CVA wasperformed using Autolab PGSTAT12 with GPES and FRA-2 software. Electrochemical impedance spectroscopy (EIS) measurements were carried out in the frequency range from 0.01 Hz to 10 kHz. Galvanostatic cycling was carried out on a NEWARE BTS4000-5V6A battery tester, the galvanostatic charge–discharge (GCD) curve was obtained at various current densities in the voltage range of 0.01–1.0 V.
3. Results and Discussion
The X-ray patterns of the series of samples K1 and K2 (Figure 2a,b) showed diffraction peaks in the 2θ ranges of 22–24° and 43–44°, corresponding to the (002) and (101) carbon peaks, respectively. The broadening of the reflexes indicated a high structural disorder of the carbons and the possible presence of a microporous morphology. The observed reflexes were fitted with Lorentzian function using Origin software, and the full width at half maximum (FWHM) and peak positions were obtained. The interplanar distance d(002) of the layers calculated using the Bragg’s equation (Table 1) was correspondingly greater than that of graphite (0.335 nm). The average heights D(002) of the stacking layers along the normal to the basal plane (002) were estimated using the Scherrer equation with a constant K equal to 0.9. The Warren constant of 1.84 [35] for the Scherrer equation was applied to the two-dimensional (10) reflection to estimate the average lateral size of the stacking layers, denoted as LXRD.
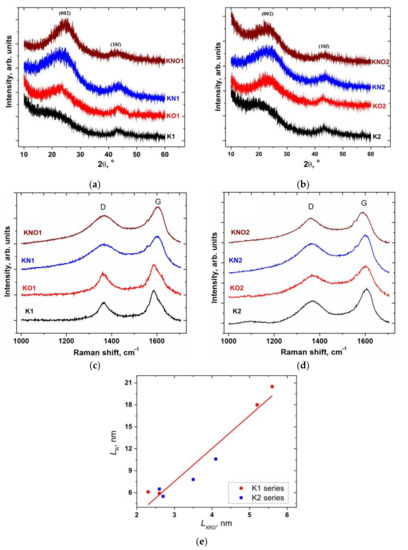
Figure 2.
(a,b) XRD patterns and (c,d) Raman spectra of a series of carbon samples K1 and K2; (e) correlation map between the average lateral particle sizes calculated from the XRD and Raman data.

Table 1.
Parameters of XRD patterns and Raman spectra of a series of carbon samples K1 and K2, as well as their structural characteristics (d(002) is the interplanardistance, D(002) is the average height of the stacking layers, LXRD and LR are the average lateral sizes of the stacking layers and particles calculated from the XRD and Raman data, respectively).
Raman spectroscopy makes it possible to obtain independent data on the lateral size of the graphite crystallite for a series of K1 and K2 samples. The Raman spectra of all materials (Figure 2c,d) consist of E2g modes at about 1590 cm−1, which is an in-phase vibration of the graphite lattice (G band), and a peak at about 1370 cm−1, caused by the disordered structure of the sp2-carbon breathing mode of aromatic rings due to the defect formation (D band) [36]. The ratio of the integral intensities of the D and G bands (ID/IG) is inversely proportional to the size of graphite crystallites in the basal (002) plane [37]: , where λ is the laser excitation wavelength. The integral intensities ID and IG of the D and G bands were estimated using the Lorentzian fit of the recorded Raman spectra, and the lateral size (LR) of the graphitic particles was calculated (Table 1). The positive correlation (adjusted coefficient of determination is 0.94) between the lateral size of the stacking layers (LXRD) calculated from XRD data and the average particle size along the (002) basal plane (LR) calculated from the Raman data can be explained by the assumption that graphitic particles consist of several (2–3) coherently scattered stacking layers (Figure 2e).
N2 adsorption–desorption isotherms of K1 series carbons (Figure 3a) weretype IV with limited capillary condensation uptake at high relative pressures. The obtained results were associated with the presence of both micro- and mesopores. The observed hysteresis loops of the H3 type corresponded to slit-shaped pores or plate-like particles, which is consistent with the turbostratic ordering of carbons with the presence of well-defined mesopores [38]. Hysteresis loops for the isotherms of samples K1 and KN1 took place at a relative pressure of P/P0 ≈ 0.80, when thermal treatment caused some shift of the starting points of the characteristic shoulder to P/P0 ≈ 0.70–0.75. These effects are a result of a change in the ratio of micro- and mesopores, which led to a decrease in the average pore curvature. The volume of adsorbed nitrogen increased for samples of the K1 series after additional annealing and wasclose to both the KO1 and KNO1 samples. The shape of N2 adsorption–desorption isotherms of K2 series carbons (Figure 3f) belonged to type I (IUPAC classification) [39] and wascharacterized by significant uptake at low relative pressures, which corresponded to adsorption in micropores. The narrow hysteresis loop at medium and high relative pressures corresponds to capillary condensation in small slit-like mesopores [40]. The largest amount of adsorbed N2 for the K2 series was observed for sample KNO2. The BET specific surface area reflected the significant effect of the amount of the activation agent on the morphological properties of carbon materials (Table 1). Additional thermal treatment caused an increase in SBET, with the maximum increase observed for sample KO1.
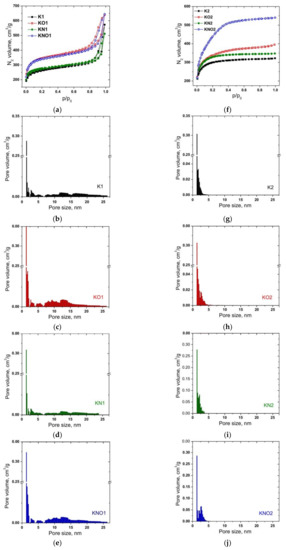
Figure 3.
(a,f) Nitrogen adsorption–desorption isotherms and (b–e,g–j) the corresponding pore diameter distributions of carbon samples of K1 and K2 series.
Narrow distributions of micropores with maxima at 1.3 nm wereobserved for all samples of both the K1 and K2 series. The pore size distribution curve for sample K1 (Figure 3b) demonstrated the presence of both micro- and mesoporous components (33% and 67% of the total pore volume, respectively). Micropores predominated in sample K2—the content of pores with an average diameter of more than 2nm wasonly 15% (Figure 3g). Thermal treatment caused an expansion of the range of micropores and a decrease in the content of mesopores to 61% for KO1, but the opposite trend wasobserved for sample KO2 (an increase in the content of mesopores to 31%) (Figure 3c,h). Treatment with nitric acid caused a decrease in the content of mesopores to about 56% for sample KN1, but for sample KN2, the effects of acid and thermal treatment werethe same (an increase in the content of mesopores to about 31%) (Figure 3d,i). Additional annealing of samples treated with nitric acid (KNO1 and KNO2) caused an increase in the content of mesopores to 62 and 54%, respectively (Figure 3e,j). Additional annealing and acid treatment caused an increase in the BET surface area as a result of the development of meso- and micropores, respectively. The observed difference can be explained by the burnout of small fragments with the disclosure of previously closed pores and etching of the particle surface.
The electrical conductivity of the carbon material is an important factor that determines the internal resistance of the electrode and the voltage drop during galvanostatic cycling, affecting both the discharge capacity and cycling properties. The Nyquist plots (Z″ imaginary vs. Z′ real) of the studied carbon materials were measured in the frequency range of 0.01–105 Hz at 25 °C, and the frequency dependences of the real part of the conductivity (σ) were calculated (Figure 4a,b).

Figure 4.
(a,b) Electrical conductivity spectra of carbon materials (solid lines are best-fit experimental data using Drude formula) and (c) comparison diagram of conductivity relaxation times of the carbon samples of the K1and K2 series at room temperature.
The ac conductivity σ(f) of all samples at low frequencies (f) does not depend on frequency, when the decrease in σ(f) at f > 103 Hz in the dispersive region corresponds to the Drude model [41]: , where σdc is the dc conductivity and τ is the relaxation time between two electron-phonon collisions. The best fit madeit possible to estimate the value of relaxation time (7.20 ± 0.14)⋅10−6 s for sample K1, when material dispergation after annealing caused a decrease in τ to (5.72 ± 0.12)⋅10−6 s for sample KO1. Treatment with nitric acid and subsequent annealing led to a decrease in τ to (3.87 ± 0.07)⋅10−6 and (2.11 ± 0.03)⋅10−6 s for samples KN1 and KNO1, respectively. The decrease in the relaxation time to (6.92 ± 0.16)⋅10−6 s for the initial sample K2 compared to the sample K1 wasconsistent with the data on the absorption of nitrogen and the growth of its porosity. For annealed sample KO2, a decrease in τ to (5.80 ± 0.13)⋅10−6 s wasobserved. Samples KN2 and KNO2 demonstrate a decrease in the relaxation time to (1.67 ± 0.04)⋅10−6 and (1.04 ± 0.07)⋅10−6 s. The decrease in the relaxation time after annealing and acid treatment is caused by the material dispergation, which was consistent with the presence of a weak correlation with an adjusted coefficient of determination of 0.45 between the values of the relaxation time and the average lateral sizes of graphite crystallite (Figure 4c). Figure 5a−f show the CVA curves measured at various scan rates for the initial and N-doped samples before and after annealing, respectively. The CVA curves obtained at a low scan rate have a quasi-rectangular shape, demonstrating the electrostatic behavior of charge storage with predominanceof the electrical double-layer mechanism. The CV curves of N-doped carbons showeddeviation from the rectangular shape, in particular, a slight bump within 0.2 to 0.8 V could beobserved for the KN1 sample (Figure 5b) associated with the pseudocapacitance caused by the presence of surface nitrogen functionalities.
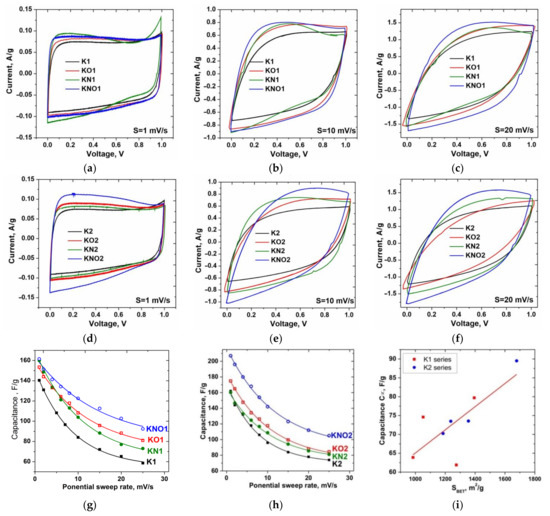
Figure 5.
Curves of cyclic voltammetry (CVA) of carbons series (a–c) K1 and (d–f) K2 at selected scan rates; (g,h) dependences of specific capacitance on potential sweep rate, and (i) the correlationmap between capacitance C∞ and SBET.
The specific capacitance C of materials was calculated based on the CVA measurements according to [36] using the following equation: , where U1 and U2 are the cutoff potentials in cyclic voltammetry, I(U) is the instantaneous current, m is the mass of an individual sample, and s is the scan sweep rate. Additional annealing of both initial and acid-treated samples led to a significant increase in specific capacitance, possibly due to a change in the surface area and pore size distribution (Figure 5g,h). The maximum specific capacitance values at s = 1 mV/s were obtained for the KNO1 and KNO2 samples (161 and 207 F/g, respectively). The experimental dependences of the specific capacitance estimated from the CVA on the potential sweep rate were fitted with descending exponential functions, and equilibrium values of the capacitance C∞ at s → ∞ were determined. The adjusted R2 of linear correlation between C∞ and BET surface area (Figure 5i) was 0.51, which corresponds to a rather weak relationship.
An increase in the potential sweep rate caused a transformation of the CVA curves corresponding to the presence of relatively slower charge accumulation mechanisms compared to the fast EDL formation at the electrode–electrolyte interface. It can be assumed that the observed changes weredue to the difference between the capacitive contribution of the “outer” (outer carbon surface, unimpeded ion transport) and “inner” (surface deep in pores, limited ion transport) interfaces. According to [42], it is possible to separate the capacitances of the “outer” (Co) and “inner” (Ci) centers using cyclic voltammetry and the difference in the dependence of each capacitance on the potential sweep rate (s). This dependency is described as follows: and , where Q is the total charge obtained by integrating the CVA curves, is the charge accumulated at fast “outer” centers, and is the maximum value of the total accumulated charge; a and b are constants. The contributions of Co and total capacitance were calculated from and values, which were defined as the y-axis intercepts in plots of Q versus s−1/2 and Q−1 versus s1/2 (Figure 6a–d). Results in Figure 6e represent the contributions of the “outer” centers to the total capacitance of the K1 and K2 carbons.
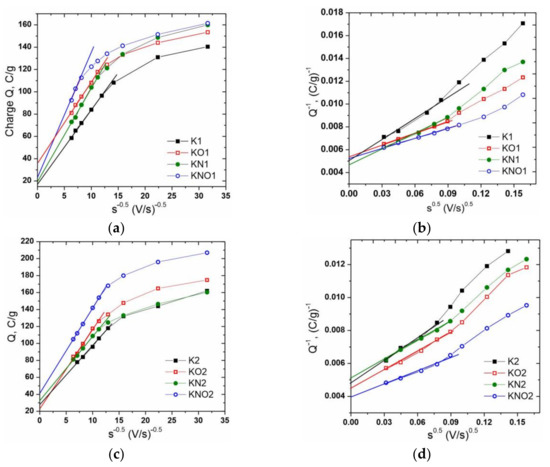
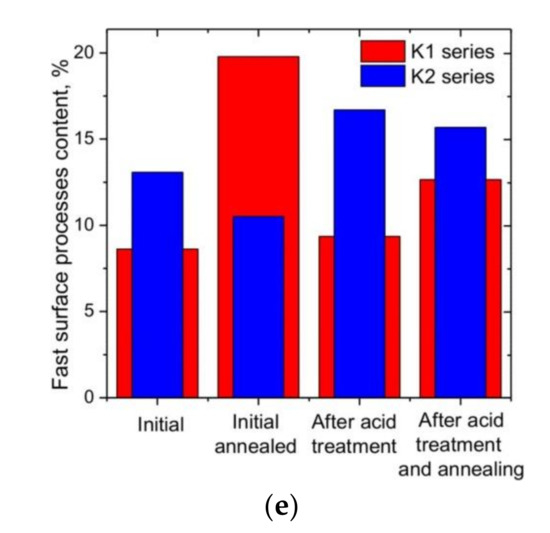
Figure 6.
The dependencesof (a,c) charge Q on s−1/2 and (b,d) Q−1 on s1/2 and (e) contributions of the capacitance of the “outer” center to the total capacitance of porous carbons of the K1 and K2 series.
The dependence of the capacitance Co on the BET-specific surface area showed a high level of correlation (adjusted R-squared is about 0.85), which confirms the reliability of the used model (Figure 7a). In this case, no correlation between the capacitance Ci and the specific surface area of electrode materials wasobserved (Figure 7b)
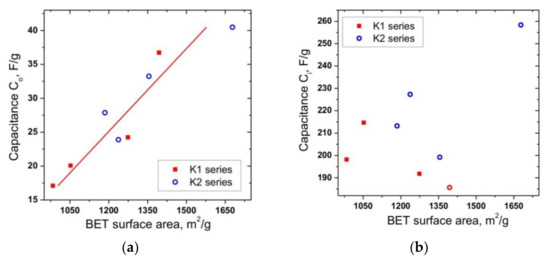
Figure 7.
Dependences of (a) “outer” and (b) “inner” capacitances on the BET surface area for K1 and K2 carbons.
The charge–discharge tests were carried out in a potential window of 0–0.1 V with an increase in the applied current density from 15 to 300 mA⋅g−1; the obtained GCD curves are shown in Figure 8a–f. GCD curves at current densities above 50 mA⋅g−1 usually have a shape close to a triangle, which indicates the predominance of capacitive behavior.
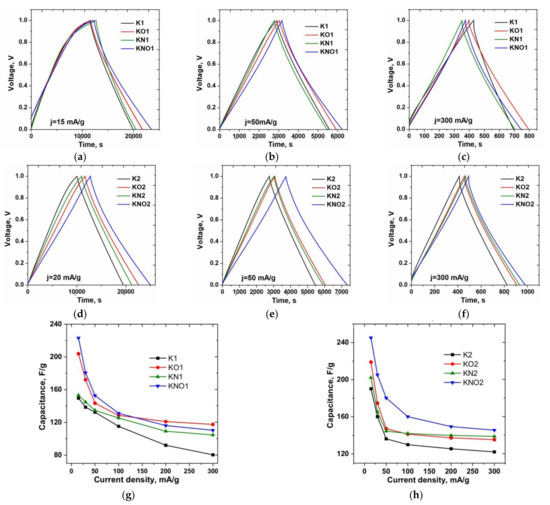
Figure 8.
Galvanostatic charge–discharge curves of the K1 and K2 series carbons at (a,d) 15, (b,e) 50, and (c,f) 300 mA⋅g−1; (g,h) capacitance versus the current density for all samples.
It is not surprising that the GCD curves for samples of the K1 and K2 series hada clear bend during charging and discharging due to the presence of “slower” processes at the electrode–electrolyte interface in pores with difficult access of electrolyte ions. The specific capacitance of the synthesized materials wascalculated from the charge–discharge curves (obtained in a three-electrode configuration) using the following equation: , where I is the discharge current, Δt is the discharge time, m is the mass of active materials (g), and ΔU is the potential discharge window. The maximum values of the specific capacitance current density of 15 mA⋅g−1 were also obtained for KNO1 and KNO2 carbons after both acid and additional thermal treatment—221 and 245 F/g, respectively (Figure 8g,h). The K2 series materials showed a correspondingly higher performance with increasing current density.
4. Conclusions
The correlation between the electrochemical performance of microporous carbons obtained on the basis ofhemp fiber and activation conditions, as well as the structure of materials, morphology, and electrical properties wasanalyzed. It has been established that a twofold increase in the content of the activation agent (KOH) in the K2 samples compared to the K1 samples makes it possible to reduce the average lateral sizes (L) of the graphene stacking layers in the composition of turbostratically ordered carbons from 20.5 to 10.6 nm. A linear correlation was observed between the L values obtained from the XRD data and the Raman data. An increase in the concentration of the activation agent led to the disappearance of mesopores with a diameter of more than 5nm and an increase in the number of micropores. Thermal treatment (at air, 400 °C) of as-synthesized carbons led to an expansion of the range of micropores and a redistribution of mesopores. Treatment with nitric acid and additional annealing in air madeit possible to change the ratio between micro- and mesopores, as well as the total BET surface area of carbons. The frequency dependences of the conductivity of all obtained carbons can be described by the Drude model with a weak correlation between the relaxation time of conductivity and the average lateral sizes of graphitic particles as a structural component of turbostratic carbons. The electrochemical response showed an increase in specific capacitance up to 245 F/g for materials after additional acid and thermal treatment. The presence of “fast” and “slow” components of the electrostatic charge storage mechanism corresponding to the formation of electrical double layers on the “outer” and “inner” (inside micropores) electrode–electrolyte interfaces with different ion transport efficiencieswas observed. An analysis of the CVA curves madeit possible to separate these two contributions and establish that the internal capacitance component predominates (about 20% of the total capacitance), but there wasa strong correlation between the capacitance of outer centers and the BET-specific surface area. The next step of the investigations is the study of the electrochemical performance of synthesized carbons using organic electrolytes of various types.
Author Contributions
Conceptualization, V.K., V.B., B.R., I.B. and M.B.; methodology, V.K., V.B., B.R., I.B. and L.R.; software, V.K., B.R., I.B. and Ł.K.; validation, V.K., B.R., I.B. and L.R.; formal analysis, V.K., V.B., B.R. and I.B.; investigation, V.K., V.B., B.R. and I.B.; resources, V.K., V.B. and I.B.; data curation, V.K., V.B., I.B. and M.B.; writing—original draft preparation, V.K., V.B., B.R., I.B. and Ł.K.; writing—review and editing, V.K., V.B., B.R., I.B., M.B. and L.R.; visualization, V.K., V.B., B.R., I.B. and L.R.; supervision, V.K., V.B., B.R. and I.B.; project administration, V.K., V.B., B.R., I.B. and L.R.; funding acquisition, V.K., V.B., B.R., I.B., M.B. and Ł.K. All authors have read and agreed to the published version of the manuscript.
Funding
This work was funded by the National Research Foundation of Ukraine (2020.02/0043). APC of the publication was financed by IDUB AGH UST (501.696.7997) and Subsidy grant number 16.16.130.942/KSW.
Institutional Review Board Statement
Not applicable.
Informed Consent Statement
Not applicable.
Data Availability Statement
Data are contained within the article.
Acknowledgments
The authors are grateful to the Ministry of Science and Education of Ukraine for the grant to implement projects (0121U109591 and 0122U002082). The authors are also grateful for thorough consultations with the Vasyl Vytvytskyi Department of Engineering and Computer Graphics, Ivano-Frankivsk National Technical University of Oil and Gas. The team of authors expresses their gratitude to the reviewers for valuable recommendations that have been taken into account to significantly improve the quality of this paper.
Conflicts of Interest
The authors declare no conflict of interest.
References
- Le Billon, P.; Kristoffersen, B. Just cuts for fossil fuels? Supply-side carbon constraints and energy transition. Environ. Plan. A: Econ. Space 2020, 52, 1072–1092. [Google Scholar] [CrossRef]
- Hirschnitz-Garbers, M.; Araujo, S.A.; Hinzmann, M. Exploring perspectives on climate-resource-nexus policies: Barriers and relevance in different world regions. J. Sustain. Dev. Energy Water Environ. Syst. 2022, 10, 1–28. [Google Scholar] [CrossRef]
- Mehdi, R.; Khoja, A.H.; Naqvi, S.R.; Gao, N.; Amin, N.A.S. A Review on Production and Surface Modifications of Biochar Materials via Biomass Pyrolysis Process for Supercapacitor Applications. Catalysts 2022, 12, 798. [Google Scholar] [CrossRef]
- Liu, H.; Kim, H. Ecological Footprint, Foreign Direct Investment, and Gross Domestic Production: Evidence of Belt & Road Initiative Countries. Sustainability 2018, 10, 3527. [Google Scholar] [CrossRef]
- IEA. World Energy Outlook. Flagship Report—2021; International Energy Agency: Paris, France, 2021. Available online: https://www.iea.org/reports/world-energy-outlook-2021 (accessed on 7 October 2022).
- Mara, D.; Nate, S.; Stavytskyy, A.; Kharlamova, G. The Place of Energy Security in the National Security Framework: An Assessment Approach. Energies 2022, 15, 658. [Google Scholar] [CrossRef]
- Bazaluk, O.; Slabyi, O.; Vekeryk, V.; Velychkovych, A.; Ropyak, L.; Lozynskyi, V. A Technology of Hydrocarbon Fluid Production Intensification by Productive Stratum Drainage Zone Reaming. Energies 2021, 14, 3514. [Google Scholar] [CrossRef]
- Ilin, S.; Adorska, L.; Samusia, V.; Kolosov, D.; Ilina, I. Conceptual bases of intensification of mining operations in mines of Ukraine. based on monitoring and condition management of mine hoisting systems. E3S Web Conf. 2019, 109, 00030. [Google Scholar] [CrossRef]
- Falshtynskyi, V.; Lozynskyi, V.; Saik, P.; Dychkovskyi, R.; Tabachenko, M. Substantiating parameters of stratification cavities formation in the roof rocks during underground coal gasification. Min. Miner. Depos. 2016, 10, 16–24. [Google Scholar] [CrossRef]
- Bazaluk, O.; Velychkovych, A.; Ropyak, L.; Pashechko, M.; Pryhorovska, T.; Lozynskyi, V. Influence of heavy weight drill pipe material and drill bit manufacturing errors on stress state of steel blades. Energies 2021, 14, 4198. [Google Scholar] [CrossRef]
- Shatskyi, I.; Vytvytskyi, I.; Senyushkovych, M.; Velychkovych, A. Modelling and improvement of the design of hinged centralizer for casing. In Proceedings of theThe 23rd edition of IManEE 2019 International Conference, Pitesti, Romania, 22–24 May 2019; Volume 564, p. 12073. [Google Scholar] [CrossRef]
- Tutko, T.; Dubei, O.; Ropyak, L.; Vytvytskyi, V. Determination of Radial Displacement Coefficient for Designing of Thread Joint of Thin-Walled Shells. In Advances in Design, Simulation and Manufacturing IV; Ivanov, V., Trojanowska, J., Pavlenko, I., Zajac, J., Peraković, D., Eds.; DSMIE 2021. Lecture Notes in Mechanical Engineering; Springer: Cham, Switzerland, 2021; pp. 154–196. [Google Scholar] [CrossRef]
- Bembenek, M.; Prysyazhnyuk, P.; Shihab, T.; Machnik, R.; Ivanov, O.; Ropyak, L. Microstructure and Wear Characterization of the Fe-Mo-B-C—Based Hardfacing Alloys Deposited by Flux-Cored Arc Welding. Materials 2022, 15, 5074. [Google Scholar] [CrossRef]
- Carvalho, F.P. Mining industry and sustainable development: Time for change. Food Energy Secur. 2017, 6, 61–77. [Google Scholar] [CrossRef]
- Bazaluk, O.; Dubei, O.; Ropyak, L.; Shovkoplias, M.; Pryhorovska, T.; Lozynskyi, V. Strategy of Compatible Use of Jet and Plunger Pump with Chrome Parts in Oil Well. Energies 2022, 15, 83. [Google Scholar] [CrossRef]
- Ovetska, O.; Ovetskyi, S.; Vytiaz, O. Conceptual principles of project management for development of hydrate and other unconventional gas fields as a component of energy security of Ukraine. E3S Web Conf. 2021, 230, 01021. [Google Scholar] [CrossRef]
- Ayoo, C. Towards Energy Security for the Twenty-First Century. In Energy Policy; IntechOpen: London, UK, 2020. [Google Scholar] [CrossRef]
- Ani, P.C.; Nzereogu, P.U.; Agbogu, A.C.; Ezema, F.I.; Nwanya, A.C. Cellulose from waste materials for electrochemical energy storage applications: A review. Appl. Surf. Sci. Adv. 2022, 11, 100298. [Google Scholar] [CrossRef]
- Ariyamparambil, V.J.; Kandasubramanian, B. A mini-review on the recent advancement of electrospun MOF-derived nanofibers for energy storage. Chem. Eng. J. Adv. 2022, 11, 100355. [Google Scholar] [CrossRef]
- Szroeder, P.; Sagalianov, I.Y.; Radchenko, T.M.; Tatarenko, V.A.; Prylutskyy, Y.I.; Strupiński, W. Effect of uniaxial stress on the electrochemical properties of graphene with point defects. Appl. Surf. Sci. 2018, 442, 185–188. [Google Scholar] [CrossRef]
- Szroeder, P.; Sahalianov, I.; Radchenko, T.; Tatarenko, V.; Prylutskyy, Y. The strain- and impurity-dependent electron states and catalytic activity of graphene in a static magnetic field. Optical Materials 2019, 96, 109284. [Google Scholar] [CrossRef]
- Zhang, M.; Zhang, J.; Ran, S.; Sun, W.; Zhu, Z. Biomass-Derived sustainable carbon materials in energy conversion and storage applications: Status and opportunities. A mini review. Electrochem. Commun. 2022, 138, 107283. [Google Scholar] [CrossRef]
- Ma, L.L.; Liu, W.J.; Hu, X.; Lam, P.K.; Zeng, J.R.; Yu, H.Q. Ionothermal carbonization of biomass to construct sp2/sp3 carbon interface in N-doped biochar as efficient oxygen reduction electrocatalysts. Chem. Eng. J. 2020, 400, 125969. [Google Scholar] [CrossRef]
- Jurkiewicz, K.; Pawlyta, M.; Burian, A. Structure of carbon materials explored by local transmission electron microscopy and global powder diffraction probes. J. Carbon Res. 2018, 4, 68. [Google Scholar] [CrossRef]
- Shen, W.; Li, Z.; Liu, Y. Surface chemical functional groups modification of porous carbon. Recent Pat. Chem. Eng. 2008, 1, 27–40. [Google Scholar] [CrossRef]
- Frackowiak, E.; Beguin, F. Carbon materials for the electrochemical storage of energy in capacitors. Carbon 2001, 39, 937–950. [Google Scholar] [CrossRef]
- Candelaria, S.L.; Garcia, B.B.; Liu, D.; Cao, G. Nitrogen modification of highly porous carbon for improved supercapacitor performance. J. Mater. Chem. 2012, 22, 9884–9889. [Google Scholar] [CrossRef]
- Sevilla, M.; Yu, L.; Zhao, L.; Ania, C.O.; Titiricic, M.M. Surface modification of CNTs with N-doped carbon: An effective way of enhancing their performance in supercapacitors. ACS Sustain. Chem. Eng. 2014, 2, 1049–1055. [Google Scholar] [CrossRef]
- Kotsyubynsky, V.; Rachiy, B.; Boychuk, V.; Budzulyak, I.; Turovska, L.; Hodlevska, M. Correlation between structural properties and electrical conductivity of porous carbon derived from hemp bast fiber. Fuller. Nanotub. Carbon Nanostructures 2022, 30, 873–882. [Google Scholar] [CrossRef]
- Hossain, M.Z.; Wu, W.; Xu, W.Z.; Chowdhury, M.B.I.; Jhawar, A.K.; Machin, D.; Charpentier, P.A. High-Surface-Area Mesoporous Activated Carbon from Hemp Bast Fiber Using Hydrothermal Processing. J. Carbon Res. 2018, 4, 38. [Google Scholar] [CrossRef]
- Gunasekaran, S.S.; Badhulika, S. High-performance solid-state supercapacitor based on sustainable synthesis of meso-macro porous carbon derived from hemp fibres via CO2 activation. J. Energy Storage 2021, 41, 102997. [Google Scholar] [CrossRef]
- Rosas, J.M.; Bedia, J.; Rodríguez-Mirasol, J.; Cordero, T. HEMP-derived activated carbon fibers by chemical activation with phosphoric acid. Fuel 2009, 88, 19–26. [Google Scholar] [CrossRef]
- Shatskyi, I.; Ropyak, L.; Velychkovych, A. Model of contact interaction in threaded joint equipped with spring-loaded collet. Eng. Solid Mech. 2020, 8, 301–312. [Google Scholar] [CrossRef]
- Kotsyubynsky, V.; Rachiy, B.; Budzulyak, I.; Boychuk, V.; Budzulyak, S.; Hodlevska, M. SAXS and Raman Study of the Structural Evolution in Hemp Bast Fiber Derived Porous Carbon. In Proceedings of the 2021 IEEE 11th International Conference Nanomaterials: Applications & Properties (NAP), Odessa, Ukraine, 5−11 September 2021; pp. 1–5. [Google Scholar] [CrossRef]
- Bai, Y.; Liu, Y.; Li, Y.; Ling, L.; Wu, F.; Wu, C. Mille-feuille shaped hard carbons derived from polyvinylpyrrolidone via environmentally friendly electrostatic spinning for sodium ion battery anodes. RSC Adv. 2017, 7, 5519–5527. [Google Scholar] [CrossRef]
- Boychuk, V.; Kotsyubynsky, V.; Kachmar, A.; Budzulyak, S.; Budzulyak, I.; Rachiy, B.; Yablon, L. Effect of Synthesis Conditions on Pseudocapacitance Properties of Nitrogen-Doped Porous Carbon Materials. J. Nano Res. 2019, 59, 112–125. [Google Scholar] [CrossRef]
- Pimenta, M.A.; Dresselhaus, G.; Dresselhaus, M.S.; Cancado, L.G.; Jorio, A.; Saito, R. Studying disorder in graphite-based systems by Raman spectroscopy. Phys. Chem. Chem. Phys. 2007, 9, 1276–1290. [Google Scholar] [CrossRef] [PubMed]
- Sing, K.S.; Williams, R.T. Physisorption hysteresis loops and the characterization of nanoporous materials. Adsorpt. Sci. Technol. 2004, 22, 773–782. [Google Scholar] [CrossRef]
- Sing, K.S. Reporting physisorption data for gas/solid systems with special reference to the determination of surface area and porosity. Pure Appl. Chem. 1985, 57, 603–619. [Google Scholar] [CrossRef]
- Sych, N.V.; Trofymenko, S.I.; Poddubnaya, O.I.; Tsyba, M.M.; Sapsay, V.I.; Klymchuk, D.O.; Puziy, A.M. Porous structure and surface chemistry of phosphoric acid activated carbon from corncob. Appl. Surf. Sci. 2012, 261, 75–82. [Google Scholar] [CrossRef]
- Maity, K.P.; Patra, A.; Prasad, V. Influence of the chemical functionalization of carbon nanotubes on low temperature ac conductivity with polyaniline composites. J. Phys. D: Appl. Phys. 2020, 53, 125303. [Google Scholar] [CrossRef]
- Ardizzone, S.; Fregonara, G.; Trasatti, S. “Inner” and “outer” active surface of RuO2 electrodes. Electrochim. Acta 1990, 35, 263–267. [Google Scholar] [CrossRef]
Publisher’s Note: MDPI stays neutral with regard to jurisdictional claims in published maps and institutional affiliations. |
© 2022 by the authors. Licensee MDPI, Basel, Switzerland. This article is an open access article distributed under the terms and conditions of the Creative Commons Attribution (CC BY) license (https://creativecommons.org/licenses/by/4.0/).