Abstract
In this study, we developed a new methodology to analyze the off-design performance of the organic Rankine cycle. The methodology enabled us to predict the performance based on four-dimensional decision variables and a set of constraints. A corresponding formulation and algorithm with general applicability were constructed. The reliability and feasibility of this methodology were validated by a test rig of the cycle with R245fa as the working fluid and three experimental schemes. Under specific working conditions, the theoretical results illustrated the operation maps, functionality limitations, and their variation laws, considering the interactive characteristics among the variables. The functionality limitations predicted a maximum thermal efficiency of 9.42%, corresponding to a net power output of 697.1 W, whereas the maximum net power output was 2251.5 W, corresponding to a thermal efficiency of 8.04%. The experimental results indicated that when the R245fa mass flow rate was 0.120 kg/s, the experimental efficiency and power output were 6.94% and 1873.4 W, respectively; when the R245fa mass flow rate was 0.049 kg/s, they were 3.54% and 274.1 W, respectively. These findings were in good agreement with the theoretical results, with relative errors below 7.64%. This work is expected to be applied in future dynamic control systems to update the setting points and manipulated variables in real time.
1. Introduction
The rapid transition to renewable energy and energy efficiency was responsible for a quarter of global electricity production during 2018 and 2019. However, worldwide emissions still escalated, particularly due to the 30% increase in fossil fuel subsidies from 2017 to 2018 [1]. Thus, the flexible transformation of the heating, cooling, and transport sectors beyond the use of electricity from renewable energy sources is urgently needed to achieve a highly decarbonized future [1,2]. The organic Rankine cycle (ORC), with its compact configuration and economic feasibility, is attractive for all of the above sectors [3,4], specifically in the applications of solar energy [5], industrial waste heat [6], internal combustion engines, and heavy-duty diesel engines [7]. It employs low-boiling-point working fluids to generate power or to function as the primary drivers of polygeneration systems, which are typically powered by low-grade thermal energy. Recent developments in the ORC have leveraged the system scale, cost, and performance to approach the optimum theoretical design. This research has essentially focused on new cycle couplings, the selection of working fluids [8,9], and the identification of rated parameters [10,11] for specific (fixed) heat-source conditions [12]. In particular, the conditions of cooling source has often been optimized to match the variable heat released from the working fluid.
Aside from its conceptual and theoretical design, the ORC’s complicated operation and limited condition scope in dynamic surroundings have restricted its popularization thus far, especially in the field of solar energy [13,14,15]. The possible disturbances to the ORC in different sectors represents various off-design working conditions, and were summarized in our previous research [7]. Essentially, fluctuations in the heat source temperature or cooling source temperature are the most common and inevitable disturbances. Additionally, in the ORC application of industrial waste heat, the mass flow rate of the heat source, namely the exhaust gas, also fluctuates randomly [6]. Conversely, other liquid-state heat sources, such as diathermic oil in solar ORCs [16,17] and brine in geothermal ORCs [18], usually retain stable flow rates. Therefore, in response to such temperature disturbances, three degrees of freedom are typically manipulated in general ORC systems, namely the mass flow rates of the working fluid, heat source, and cooling source. However, determining the appropriate manipulation necessitates interdisciplinary research between the control science and thermophysical engineering fields. Specifically, the dynamic behavior of ORC systems under changeable working conditions must be considered to formulate reasonable control strategies. Prior dynamic research has mainly focused on model development [19] and validation [20], performance prediction [21], experiments on variable sensitivity [7,22,23,24,25], thermal inertia validation [26], and even control strategy tests [6]. However, owing to concerns regarding costs and time requirements, the coarse and aggregated data collected from such dynamic experiments have failed to evaluate the performance and provide the basis for operation maps under off-design working conditions. Thus, the operation boundaries within the scope of practical conditions remain elusive. This is mainly attributed to the interactions between operation variables, which results in excessive volumes of data for processing.
Nevertheless, the above explorations of the dynamic behavior of the ORC laid the foundations for the two common control strategies summarized in Figure 1. Figure 1a depicts the conventional control strategy, in which the manipulated variables are the pump speed () and the expander speed (), etc. The two manipulated variables mainly correspond to the controlled variables of the superheating degree (ΔTsh) and the evaporation temperature (Teva) [6,15]. Such conventional strategies feature fixed setting points for all off-design working conditions [27], with the controller acting according to the errors between the controlled variables and their setting values. For example, both Quoilin et al. [6]. and Seitz et al. [28] took the constant superheating degree of 15 K as the setting point to prevent droplets. Rathod et al. [29] experimentally implemented a superheat-tracking controller with a superheating degree of 60 °C.
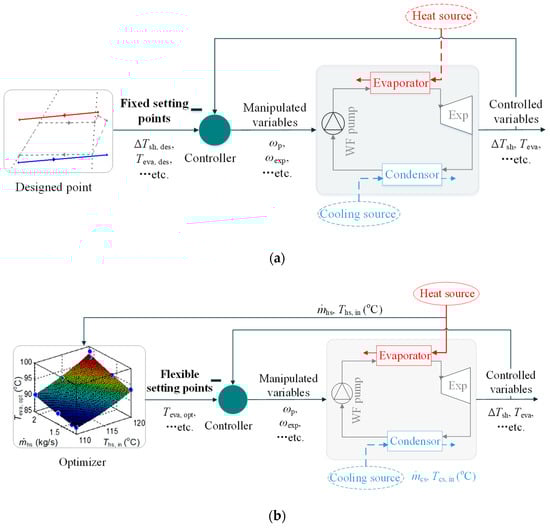
Figure 1.
State-of-the-art ORC operation and control strategies: (a) conventional strategy; (b) advanced strategy [12].
However, under new off-design working conditions, the operation variables, especially the setting values, should be updated to achieve the optimal off-design performance. This led to the state-of-the-art control strategy shown in Figure 1b, where in the setting points are flexible instead of fixed and advanced control strategies are applied. It relies on an estimation of the off-design performance explicitly accounting for the interactions between the operation variables. Rathod et al. [29] designed and validated a nonlinear model predictive controller (MPC) for a heavy-duty-diesel-engine ORC, of which the superheating degree was tuned online ranging from 10 °C to 60 °C due to system aging. The tuned superheating degree of 60 °C remained constant even though the heat source conditions were variable. Taking into account a fluctuating waste heat source, Hernandez et al. [14] developed an adaptive control law for an MPC to maximize the power output of a small-scale ORC, implementing an optimizer for the evaporation temperature via a polynomial regression method. It was pointed out that the MPC outperformed the conventional PID strategy by up to 17% power output. In this manner, the controller enabled the adaptation to the new heat source working conditions in order to maximize the off-design power generation. However, the optimal evaporation temperature was correlated with the mass flow rate and the temperature of the heat source, which were derived from the experimental results involving a specific ORC test rig, as shown in Figure 1b. Thus, this finding was not universally applicable for achieving optimum off-design performance in general ORC applications. Furthermore, advanced control strategies such as model predictive control mainly aim to improve control system performance. Such strategies replace the estimation of a specific state by using transfer functions to characterize the ORC system as a multivariable and nonlinear model [29,30,31]. Zhang et al. [32] optimized the setting points of the evaporating pressure and the temperature at the evaporator outlet for a controlled ORC system by simulation. Considering that optimal setting points are difficult to analytically determine, the optimization was achieved by combining a genetic algorithm with a least-squares support vector machine rather than by establishing a precise model. The improvements in off-design performance achieved by advanced strategies are usually evaluated through comparisons with conventional strategies, due to the lack of explicit solutions. Consequently, the off-design functionality limitations of the ORC have not been identified as part of the assessment of control system performance or potential ORC enhancement.
In this regard, research on off-design ORC performance has garnered much attention. Such research has mainly aimed to optimize the design or performance of a single component. Narasimhan et al. [33] and Ma et al. [34] focused on the off-design performance of the expander in the ORC. Manente et al. [18] used MATLAB/Simulink to build an off-design model of the ORC that analyzed the effects of the ambient temperature and geofluid inlet temperature on the power output. Wang et al. [35] carried out a parametric analysis of a solar ORC, examining the effect of both the off-design ambient temperature and heat source mass flow rate on the net power output and exergy efficiency. However, such a parametric analysis based on a single variable was insufficient to achieve off-design optimization, as it did not reflect the influence of each variable on the performance. Liu et al. [36] comprehensively reviewed the simulation methods and tools for optimizing ORC performance under off-design working conditions. They concluded that such off-design studies usually neglect the influence of the heat source, heat sink, and ambient conditions. Chatzopoulou et al. [12,37] attempted the off-design optimization of an ORC-based system under variable heat-source conditions, considering the interactions among components and within the whole system. A detailed optimization plan for the whole system was designed, involving working fluid selection, heat transfer coefficients, and expander-type comparison. The theoretical off-design optimization plan was expected to inform design decisions.
In general, the abovementioned research on off-design optimization included: (1) studies evaluating the off-design performance of a single component, especially the expander, in order to optimize component design [33,34]; (2) studies using parametric analysis rather than off-design optimization to investigate the effect of the working conditions and the parameters on the performance [18,35]; (3) studies focusing on the achievement of an optimal ORC configuration by determining the appropriate component types and sizes [12,37]; and (4) studies adopting theoretical analysis or modeling for off-design optimization, without experimental validation.
Lecompte et al. [38] introduced a comprehensive off-design model of an individual ORC that required the pump and expander speeds as inputs alongside the heat source and sink conditions. Several values for the power output or the mass flow rate of the working fluid were predicted by the model and were validated by a small-scale ORC experiment with an algorithm for steady-state detection. Unfortunately, the authors neither developed off-design operation maps (as mentioned above) nor identified the off-design functionality limitations for the further assessment or dynamic optimization of the advanced control system.
Therefore, in an attempt to bridge the knowledge gap between fixed optimization and off-design optimization, this paper makes the following contributions:
- A methodology for determining the operation maps and functionality limitations of an ORC under specific working conditions was developed. This method surpasses those detailed in other off-design studies in the literature by accounting for the interactions among the multidimensional operation variables and a set of constraints.
- A corresponding formulation and algorithm with general applicability are presented, instead of an empirical formula from experimental results. These are expected to be expanded for the off-design optimization of universal ORC operation.
- The accuracy and reliability of the methodology were validated by three ORC experimental schemes, wherein the mass flow rate of the working fluid, heat source, and cooling source were regulated, respectively.
The paper is organized as follows. The theoretical analysis and algorithm for the novel off-design operation maps and functionality limitations are introduced in Section 2. The change law of the operation boundaries and the corresponding solution domain for off-design operation are presented and discussed in Section 3. The ORC platform established to validate the accuracy and reliability of the developed algorithm is described in Section 4.
2. Theoretical Analysis and Methodology
As summarized in the introduction, the evaluation of the off-design performance is the prime requirement for updating the setting-point values for dynamic control. Figure 2 provides a schematic of an ORC system with a closed-type heat source and water-cooling source, which was built and tested in our previous research with R245fa as the working fluid [7]. In practical operation, the ORC has many variables due to the different thermophysical processes and complex coupling relationships between the three fluids. As a consequence, the system performance under new off-design working conditions may vary, depending on the combinations of variables. In order to determine the operation maps and functionality limitations of such a complex system, a general off-design performance formulation was developed on the basis of the ORC thermodynamic model, as presented in Equations (1)–(8).
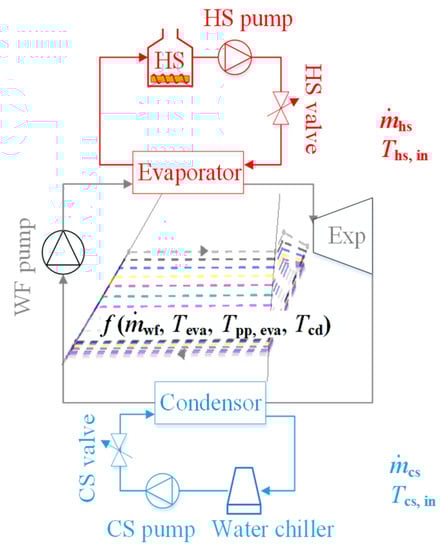
Figure 2.
Schematic of a practical ORC system with operation parameters.
The heat absorbed by the working fluid in the evaporator:
The heat released from the heat source:
The heat released from the working fluid in the condenser:
The heat absorbed by the cooling source:
The gross power of the expander:
The power consumed by the pump:
The net power of the ORC:
The thermal efficiency of the ORC:
Since the cycle is able to be formed only when the thermodynamic processes conform to a predefined pattern, the constraints on the variables should be considered to determine the operation map under off-design heat-source and cooling-source working conditions. In detail, the evaporation temperature (Teva) and condensation temperature (Tcd) are bound by the inlet temperature of the heat source (Ths,in) and the cooling source (Tcs,in), respectively. In the evaporator and condenser, the pinch-point temperature (Tpp,eva and Tpp,cd) should be positive for a normal heat-exchange process. Furthermore, at the evaporator outlet, the vapor quality () should reach one to avoid droplets forming in the following expander, which results in the superheating degree (). Similarly, at the condenser outlet, the vapor quality () should reach zero to avoid cavitation in the following pump. Thus, the abovementioned constraints are defined as the associated set of constraints (), which are presented in Equations (10)–(15).
Considering the ORC performance indicators of net power () (Equation (7)) and thermal efficiency () (Equation (8)) as the objective function (), the off-design performance function () with the associated set of constraints () was constructed. To solve the function, a vector with decision variables () was considered, which consisted of the mass flow rate of the working fluid (); the evaporation temperature (Teva); the condensation temperature (Tcd); the pinch-point temperature in the evaporator (Tpp,eva) and in the condenser (Tpp,eva); the superheating degree in the evaporator (ΔTsh); and the vapor quality at the outlet of the evaporator () and the condenser (). Accordingly, the general off-design performance formulation is as follows, based on the typical single-objective optimization formulation described in [37].
Objective function: solve
Subject to:
where the isentropic efficiency of the pump and the expander are assumed to be 0.75 and 0.7, respectively, in order to simplify the analysis.
The corresponding algorithm to determine the off-design performance is depicted in Figure 3. Typical cooling-source and heat-source conditions from the experiments are employed to illustrate the process of quantifying the operation maps and functionality limitations of the ORC under specific working conditions. However, we expect that the algorithm will be able to determine the off-design performance under any specific heat-source and cooling-source working conditions. The models included in Figure 3 were calculated using MATLAB and the thermodynamic properties of the R245fa fluid were acquired by linking MATLAB with the commercial software REFPROP 9.1 [39].
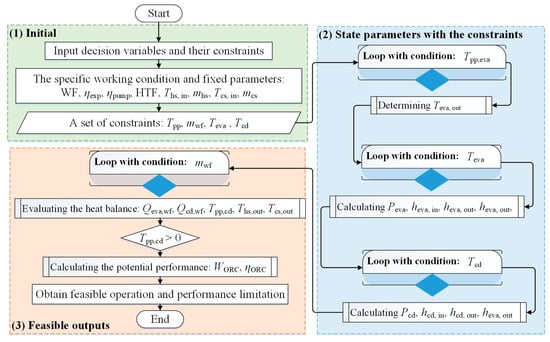
Figure 3.
Flow chart for process of determining the operation boundaries under specific heat source and heat sink conditions.
Specifically, the inlet temperature of the heat source (Ths,in) was 82.0 °C; the mass flow rate of the heat source () was 0.635 kg/s; the inlet temperature of the cooling source (Tcs,in) was 20.0 °C; and the mass flow rate of the cooling source () was 0.650 kg/s. Ranges of the four decision variables were imposed as constraints within the algorithm: ,, , and . The other decision variables, namely the superheating degree () and the pinch-point temperature in the condenser (), could thus be solved. Therefore, the off-design performance was essentially decided by the four-dimensional (4D) variables. The criterion for identifying the operation maps and functionality limitations using the 4D variables is that the pinch-point temperature in the condenser () is above 0 K. During each iterative calculation, the specific values of the were 0.029 kg/s, 0.041 kg/s, 0.052 kg/s, 0.063 kg/s, 0.075 kg/s, 0.085 kg/s, 0.098 kg/s, 0.107 kg/s, and 0.120 kg/s, respectively. Furthermore, for each iteration step, the value of Tpp,eva, Teva, and Tcd was 1 °C.
3. Results and Discussion
3.1. Operation Maps
Figure 4 depicts the thermal efficiency boundaries of the ORC with different combinations of 4D variables. The results showed that similar or identical ORC thermal efficiency (ηORC) values could be obtained for different combinations of variables, as indicated by the areas of the same color in Figure 4. Meanwhile, a higher ηORC was observed in the area with a higher evaporation temperature (Teva), lower condensation temperature (Tcd), and lower pinch-point temperature in the evaporator (Tpp,eva). The corresponding ηORC ranged between 7.2 and 8.4%. It should be mentioned that the highest ηORC did not occur at the extreme point, defined as the working conditions with the maximum Teva and minimum Tpp,eva and Tcd.
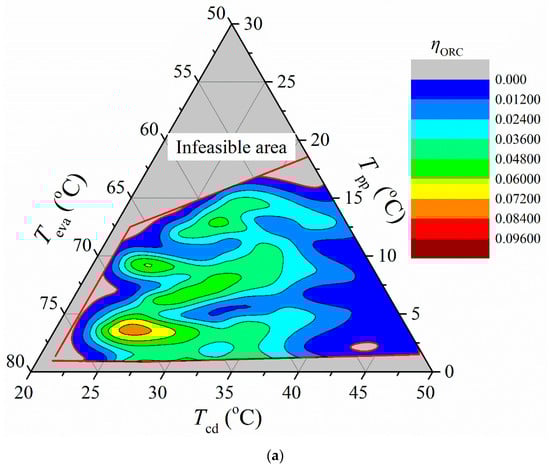
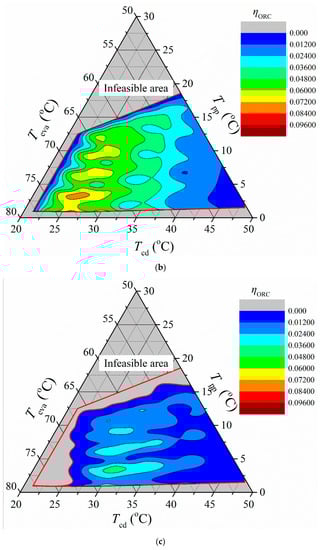
Figure 4.
Operation maps and boundary variations of ORC thermal efficiency: (a) ; (b) ; (c).
However, within the experimentally feasible range of R245fa mass flow rate (), the ηORC at the extreme point was a non-solution, as shown in Figure 4a. The range of the operation boundaries, namely the feasible area, was affected by the combination of the 4D variables. It should be pointed out that the 4D variables were mutual coupled and inter-restricted. This is explained by Figure 4b,c, with a specific of 0.041 kg/s and 0.120 kg/s, respectively. When the was 0.041 kg/s (Figure 4b), the range of the feasible ηORC was wider, with a maximum value of 9.22%. Furthermore, the non-zero solution could only be achieved when the Tcd was higher than 23.0 °C. However, when the was 0.120 kg/s, the range of the feasible ηORC narrowed, with a maximum value of 8.15%. The ηORC was below 0 in the area with a lower condensation temperature. To conclude, concerning the 4D variables, the maximum ηORC and the feasible operation area with an ηORC above 0 decreased as the increased.
Figure 5 depicts the net power output () boundaries of the ORC according to different 4D variable values. Similarly to the thermal efficiency (ηORC) results, the system could achieve similar or identical values with different combinations of the variables. The higher values were located in the areas with higher Teva, lower Tcd, and lower Tpp,eva values. The ranged between 1260.0 W and 1510.0 W, corresponding to the green area in Figure 5. Once again, the highest power output did not occur at the extreme point where the Teva was at its maximum and the Tcd and Tpp,eva were at their minimum. Figure 5b indicates that when the was 0.041 kg/s, the range of the feasible was wider, but with a lower maximum value of 894.5 W. Furthermore, the non-zero solution could only be achieved when the Tcd was higher than 23.0 °C. However, when the was 0.120 kg/s, the range of the feasible narrowed, with a higher maximum value of 2288.6 W. Additionally, the was below 0 in the area with a lower Tcd. To conclude, concerning the 4D variables, the feasible operation area with a above 0 decreased in size as the increased, which was consistent with the changes in the ηORC. However, the maximum increased as the increased.
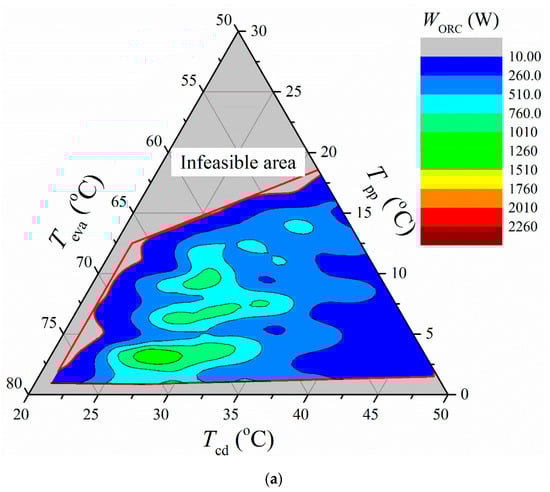
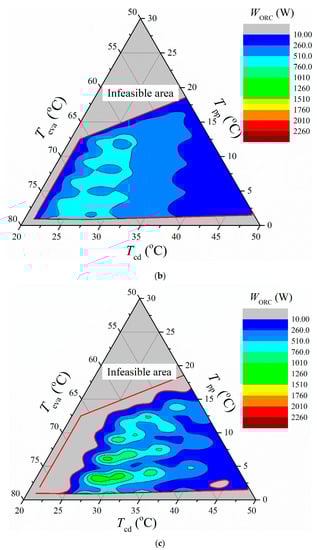
Figure 5.
Operation boundaries of ORC power output: (a) ; (b); (c).
3.2. Solution Domain and Functionality Limitations
Based on the operation map, the solution domain within the 4D boundary conditions was further explored. Through the surface interpolation fitting of the calculated results, the solution domain of the ηORC was obtained, as shown in Figure 6. The figure indicates that when the Tcd was 22.0 °C, the system was impossible to operate, regardless of the combination of the other three variables. As a result, the ηORC is 0 in Figure 6, due to the low Tcd. Specifically, under known cooling-source conditions, namely an inlet temperature of 20.0 °C and an of 0.650 kg/s, the absorbed heat power of the cooling source is equal to the released heat power of the working fluid. Thus, as the value increased, the heat released by the working fluid in the condenser increased. This led to a higher outlet temperature in the cooling source, causing a temperature difference (namely, the pinch-point temperature in the condenser (Tpp,cd)) of less than zero. As a result, the heat transfer greatly deteriorated, and its performance may have been restricted. This led to the phenomenon that the feasible operation area of the decreased as the increased.
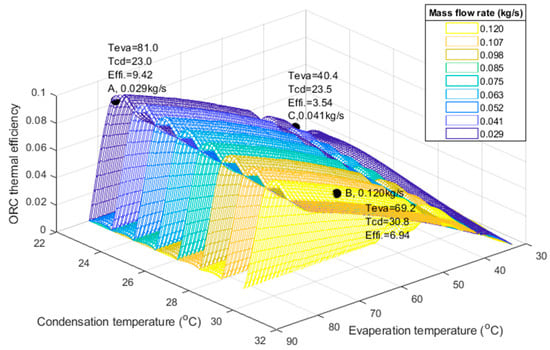
Figure 6.
ORC thermal efficiency map within 4D boundary conditions.
As the increased from 0.029 kg/s to 0.120 kg/s, the Tcd, which guarantees a normal heat transfer process, increased from 22.0 °C to 29.0 °C. This meant that the non-zero solution area of the ηORC moved in the direction of an increasing Tcd. This explained the phenomena illustrated in Figure 4, where the operation boundary decreased as the increased. In addition, the solution for the highest ηORC was 9.42%, located at point A in Figure 6. Correspondingly, the was 0.029 kg/s, the evaporation temperature was 81.0 °C, and the Tcd was 23.0 °C. With the increase in the , the maximum ηORC of each presented a declining trend, reaching 8.15% when the increased to 0.120 kg/s. It should be pointed out that, within the solution domain, the had no influence on the ηORC when the combination of the Teva, Tcd, and Tpp,eva was identical for different R245fa mass flow rates. On the other hand, with a constant value, the ηORC increased as the Teva increased but decreased as the Tcd increased.
It is important to emphasize that the 4D variables are interactive and mutually coupled. In addition to the constraint that the Teva is higher than the Tcd, the Tpp,eva and the range of the Teva are inter-restricted, as shown in Figure 7. Due to the limitations of the heat-source conditions, with an inlet temperature of 82.0 °C and an of 0.635 kg/s, each Tpp,eva corresponded to a different range of Teva values. With the increase in the Tpp,eva, the maximum viable Teva decreased. To guarantee the superheating temperature at the outlet of the evaporator, the maximum Teva was 67.0 °C under the selected 4D boundary conditions when the Tpp,eva was 15.0 °C. However, when the Tpp,eva was 1.0 °C, the maximum Teva was 81.0 °C. Figure 7 shows that as the Tpp,eva decreased, the range of the Teva increased.
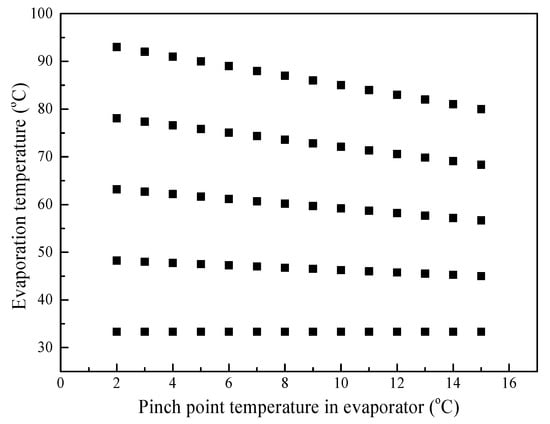
Figure 7.
The coupling effect between the pinch-point temperature in the evaporator and the evaporation temperature.
Figure 8 depicts the solution domain of the . In terms of the variation laws of the operation boundaries, the results were the same as those for the ηORC. When the Tcd was 22 °C, the system was impossible to operate, regardless of the combination of the other three variables. Specifically, the was zero, corresponding to the infeasible ηORC in Figure 4. As the increased from 0.029 kg/s to 0.120 kg/s, the Tcd, which guarantees a normal heat transfer process, increased from 22.0 °C to 29.0 °C. This meant that the non-zero solution area of the moved in the direction of an increasing Tcd. Similarly, the 4D variables were mutually coupled and inter-restricted.
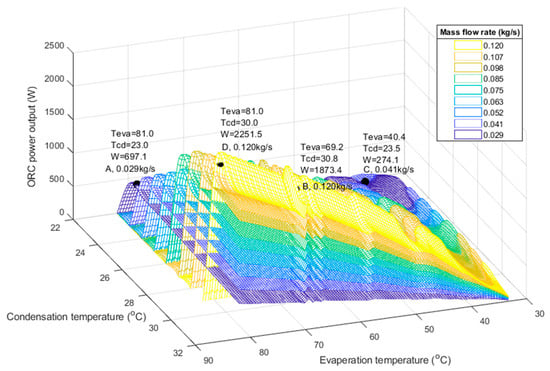
Figure 8.
ORC power output map within 4D boundary conditions.
In contrast to the change laws of the ηORC, the was determined by the . Thus, the at the maximum ηORC, namely point A, was only 697.2 W, which was attributed to the lower of 0.029 kg/s. The maximum was located at point D in Figure 8, with a value of 2251.5 W. The corresponding was 0.120 kg/s, the Teva was 81.0 °C, the Tcd was 30.0 °C, and the ηORC was 8.04%.
4. Experimental Validation
4.1. Description of the Test Rig
Figure 9 shows the test rig and a schematic of the experimental ORC system, using R245fa as the working fluid. It should be noted that the test rig lacked an expander due to the problem of expander leakage. Instead, a self-made expansion valve was employed to temporarily take the place of the expander, consisting of a ball valve and a gate valve, as shown in Figure 9a. The heat source adopted was hot water with a maximum thermal power of 4 2.5 kW achieved by electrical heaters. The cooling source was a 7.5 kW water chiller. The specific parameters and a description of the system can be found in [7]. The variables in the test rig included the mass flow rate of the working fluid (), the heat source (), and the cooling source (). Specifically, the was manipulated by regulating the motor speed of the working fluid pump, and the and were manipulated by opening valves on the heating and cooling water loops, respectively. Except for the bypass valves of the expander, which had specific and constant opening positions, the rest of the valves in Figure 9a were kept fully open during the test.
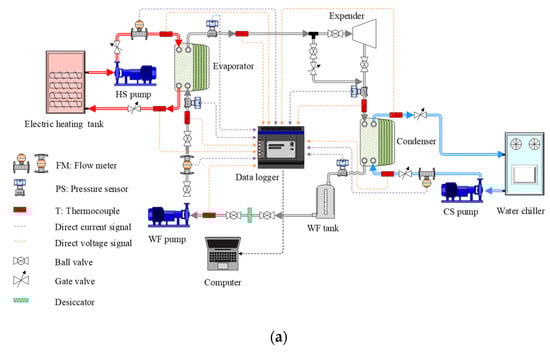
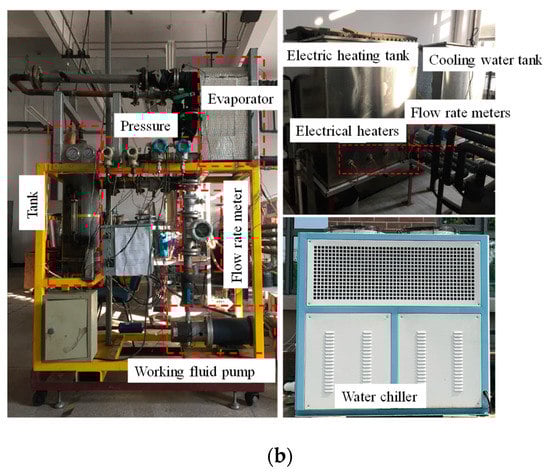
Figure 9.
The experimental system: (a) schematic of the system; (b) photographs of the system [7].
Three experimental schemes were tested, within which the , , and values were regulated, respectively. It should be mentioned that the electric power for the heat source was kept constant at 10.0 kW for all the schemes. In the scheme with the regulation of the , the values of the were the same to those mentioned in Section 2. The other initial working conditions also corresponded with the conditions described in Section 2. Specifically, the inlet temperature of the heat source was 82.0 °C, with an of 0.630 kg/s, and the inlet temperature of the cooling source was 20.9 °C, with an of 0.641 kg/s. The other two experimental schemes were implemented to help draw up the operation maps of the ORC depicted in Figure 4 and Figure 5. When the was regulated, the inlet temperature of the heat source was 85.8 °C and the inlet temperature of the cooling source was 20.4 °C, with an of 0.644 kg/s and an of 0.040 kg/s. The mass flow rate of the heat source was decreased from 0.633 kg/s to 0.156 kg/s. When the was regulated, the inlet temperature of the heat source was 87.3 °C, with an of 0.139 kg/s; the inlet temperature of the cooling source was 20.2 °C, and the was 0.039 kg/s. The mass flow rate of the cooling source was decreased from 0.642 kg/s to 0.081 kg/s.
The reliability and feasibility of the above test were validated by uncertainty and heat-balance analysis. The uncertainty of the indirect measurements, such as the heat transfer of the fluids, was less than 20% under most working conditions. The discrepancy in the evaporator and condenser ranged between 2.51% and 21.45% under the above working conditions [7].
4.2. Algorithm Validation
Figure 10 depicts the variation ranges in the T-s diagram of the system, corresponding to the above three schemes. The initial stable operation parameters are represented by the solid line, while the final stable operation parameters are represented by the dashed line and the shaded area. Figure 10a indicates that as the decreased from 0.120 kg/s to 0.029 kg/s, the evaporation and condensation pressure declined, while the superheating degree and the irreversibility increased obviously. The pinch-point temperature in the evaporator increased as the decreased, with a range of 4.0~6.0 °C. Furthermore, the opposite variation trend was observed in the condenser, with a range of 1.0~2.0 °C. Thus, the variable operation parameters confirmed the interactions between the operation variables, in agreement with the comparisons of ORC performance under different 4D variable combinations. Meanwhile, Figure 11 shows that the higher the . the greater the and ηORC. It should be mentioned that both the inlet and outlet temperatures of the heat source declined (Figure 10a). This was due to the high during operation, which caused a more heat to be absorbed by the working fluid than the available electric heating power of 10 kW. Thus, for the system driven by the closed-type heat source of the electric heater, the premise of the operation optimization was to sustain the heat balance in the evaporator. On this basis, under the requirement that the superheating degree in the evaporator was above 0 K, the higher the , the higher the evaporation pressure, resulting in a higher and ηORC.
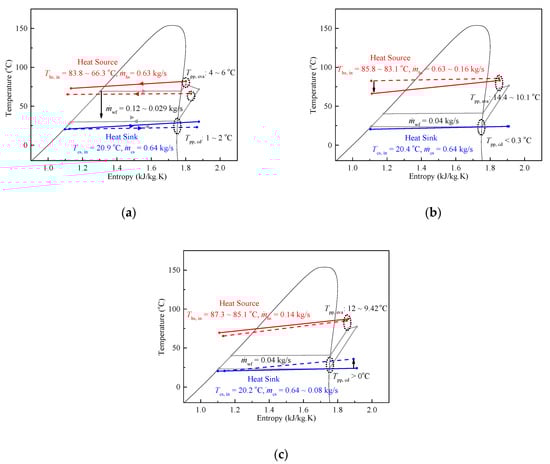
Figure 10.
T-s diagrams for downward step change with a constant mass flow rate: (a) changes in ; (b) changes in ; (c) changes in .
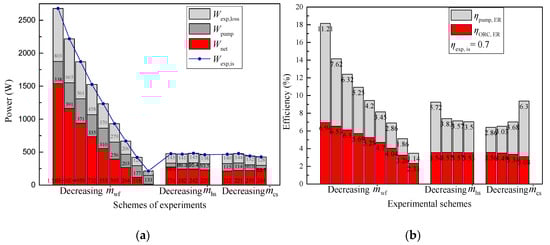
Figure 11.
Steady-state performance predicted for experimental working conditions: (a) power analysis; (b) efficiency analysis.
Figure 10b indicates that as the decreased from 0.633 kg/s to 0.156 kg/s, the outlet temperature of the heat source and the irreversibility in the evaporator decreased. The pinch-point temperature in the evaporator presented a declining trend and ranged from 14.4 to 10.1 °C. The pinch-point temperature in the condenser approached but remained higher than 0 °C. The was fixed at 0.040 kg/s. In this manner, even though the changed, the heat transfer of the working fluid remained at 9306.2 W and matched the electric heating power of 10 kW. Thus, the closed-type heat source was in an equilibrium state, resulting in a relatively constant outlet temperature of the heat source in the evaporator, ranging between 85.8 and 83.1 °C. In terms of the operation optimization, it can be concluded that the lower the , the lower the irreversibility in the evaporator. Figure 10c indicates that as the decreased from 0.642 to 0.081 kg/s, the outlet temperature of the cooling source in the condenser increased. This led to an increase in the condensation temperature and the pressure of the working fluid. The pinch-point temperature in the evaporator presented a declining trend, with a range of 12.0~9.4 °C. The pinch-point temperature in the condenser approached but remained higher than 0 °C. Similarly, the closed-type heat source was in an equilibrium state due to the constant of 0.040 kg/s, resulting in a relatively constant outlet temperature for the heat source in the evaporator, ranging between 85.1 and 87.3 °C. In terms of the operation optimization, the higher the , the lower the condensation pressure. As a result, the of the system could be promoted. However, it is important to avoid an excessive value, which may cause heat transfer deterioration and decrease the thermal efficiency [40].
In general, the results from all three schemes depicted in Figure 10 showed that the operation variables were numerous, mutually coupled, and inter-restricted. Our findings indicated that the main operation variables were the Tpp,eva, , Teva, and Tc, which was in agreement with the 4D variables proposed in Section 2.
Figure 11 shows the results predicted by Equations (8)–(15) for the experimental working conditions, with the expander replaced by the expansion valve. When the decreased, the power consumed by the pump () and the loss of the expander power output () decreased. However, the net power output of the ORC () and its efficiency (ηORC,ER) also decreased. Specifically, the decreased from 1874.7 W to 148.5 W, and the ηORC,ER decreased from 6.94% to 2.33%. When the decreased, the decreased from 274.1 W to 229.2 W, while the ηORC,ER remained at about 3.55%. On the contrary, when the decreased, the increased slightly from 211.7 W to 244.5 W, while the ηORC,ER decreased slightly from 3.56% to 3.08%. For all the experimental schemes illustrated in Figure 11, even though the combinations of operation variables differed, the system could achieve a similar performance. This phenomenon supported the operation maps presented in Section 3, corresponding to the areas of the same color in Figure 4 and Figure 5.
Furthermore, we used the experimental results to validate the reliability and accuracy of the solution domain for the ηORC in Figure 6 and for the in Figure 8. Point B in Figure 6 and Figure 8 indicates the optimal performance achieved by the experiment, which corresponded to the conditions and results when the was 0.120 kg/s. The experimental thermal efficiency (ηORC,ER) was 6.94%, located in the solution domain with the of 0.120 kg/s, while its theoretical value was 6.41%, with a relative error of 7.64%. The experimental power output () was 1873.4 W, also located in the solution domain with the of 0.120 kg/s, while its theoretical value was 1770.3 W, with a relative error of 5.56%. Point C in Figure 6 and Figure 8 corresponds to the experimental results for the initial steady-state conditions, with an of 0.041 kg/s. The ηORC,ER was about 3.54%, while the theoretical value was 3.61%, with a relative error of 1.98%. The was 274.1 W, while the theoretical value was 289.75 W, with a relative error of 5.71%. Table 1 presents a comparison of the ORC parameters between the experimental and theoretical results. The relative errors for the system performance were acceptable, which was attributed to the appropriateness of the hypothesis in the theoretical analysis, the limited experimental conditions, and the interpolation technique. It should be mentioned that since the Tpp,eva could not be identified in the solution domain, it could not be predicted as were the other parameters in Table 1.

Table 1.
Comparison between the experimental and theoretical results.
5. Conclusions
ORC systems usually operate under variable heat-source and cooling-source conditions. In this work, a methodology was developed and applied to generate off-design ORC operation maps and a solution domain to determine the functionality limitations. A corresponding formulation and algorithm with general applicability were developed and characterized by 4D decision variables, including , Tpp,eva, Teva, and Tcd. The interactions among the variables and a set of constraints were also identified. The algorithm could be used in ORC dynamic controllers to update the setting points and adjust the operation in real time. Based on our prior knowledge of the variable constraints from the ORC test rig, we provided both quantitative and qualitative results. Furthermore, three experimental schemes were implemented in the ORC test rig to verify the reliability and accuracy of the proposed methodology. The conclusions were as follows.
- (1)
- The off-design performance was indicated by operation maps, which were decided by different combinations of the 4D variables. Under the designated working conditions and constraints, a higher ηORC was generally located in the area with a higher Teva and lower , Tcd, and Tpp,eva. On the other hand, a higher was generally located in the area with the higher Teva and , but lower Tcd and Tpp,eva.
- (2)
- The operation boundaries changed according to the combinations of 4D variables. Under the same Teva, Tcd, and Tpp,eva combination, the feasible areas of both the ηORC and decreased as the increased due to the limitation of the Tpp,cd for successful heat transfer.
- (3)
- The functionality limitations were further predicted by the solution domains corresponding to the operation maps. The maximum ηORC was 9.42%, with a of 697.1 W. The maximum was 2251.5 W, with an ηORC of 8.04%. Similar or even identical performances were achieved by numerous combinations of the 4D variables.
- (4)
- The accuracy and reliability of the algorithm were validated by experimental results with an value of 0.049 kg and 0.12 kg/s, respectively. Agreement between the theoretical and experimental results was obtained, with a relative error for system performance below 7.64%.
- (5)
- The novel finding that a similar or even identical performance could be achieved under different variable combinations was proven by the experimental results with the regulation of the , , and values, respectively. When the was 0.049 kg/s, the corresponding ηORC,ER fluctuated around 3.08~3.56%, and the fluctuated from 211.7 to 274.1 W, even though the and were changed substantially.
The identification of identical and similar performance values in the solution domain indicated that alternative combinations of operation variables could be used to expand the control schemes in response to off-design working conditions. However, any concrete proposals should be further investigated to design dynamic control strategies for ORC operation. ORC functionality limitations as guides for control design should be evaluated in future work.
Author Contributions
Conceptualization, Q.Y.; methodology and software, M.L. (Mengxing Li); validation, Y.L.; writing—original draft preparation, Y.Z.; writing—review and editing, S.D.; supervision, M.L. (Ming Li); funding acquisition, L.Z. All authors have read and agreed to the published version of the manuscript.
Funding
This research was funded by the National Key Research and Development Plan, grant No. 2018YFB1501004, and the Science and Technology Planning Project of Yunnan Provincial Science and Technology Department, grant No. 202201AU070054.
Data Availability Statement
The data presented in this study are available on request from the corresponding author.
Conflicts of Interest
The authors declare no conflict of interest.
Nomenclature
| Acronyms | |
| 4D | four-dimensional |
| CS | cooling source |
| HS | heat source |
| HTF | heat transfer fluid |
| MPC | model predictive control |
| ORC | organic Rankine cycle |
| WF | working fluid |
| Symbols | |
| mass flow rate, kg/s | |
| T | temperature, °C |
| power output, kW | |
| x | vapor quality, - |
| Greek symbols | |
| thermal efficiency, % | |
| rotational speed, r/min | |
| Δ | difference |
| Subscripts | |
| cd | condenser |
| cs | cooling source |
| eva | evaporation |
| exp | expander |
| hs | heat source |
| pp | pinch point |
| p | pump |
| sh | superheating |
References
- REN21 REN21 Annual Report 2018–2019. REN21 2019, REN21 Secr. Available online: https://www.ren21.net/wp-content/uploads/2019/05/2018-2019-Annual-Report_FINAL_low-res.pdf (accessed on 1 September 2022).
- IEA. Renewables 2019; IEA: Paris, France, 2019. Available online: https://www.iea.org/reports/renewables-2019 (accessed on 1 September 2022).
- Masood, E.; Keshavarz, A. Combined Cooling, Heating and Power: Decision-Making, Design and Optimization; Elsevier: Amsterdam, The Netherlands, 2014; ISBN 0080999921. [Google Scholar]
- Murugan, S.; Horák, B. Tri and Polygeneration Systems-A Review. Renew. Sustain. Energy Rev. 2016, 60, 1032–1051. [Google Scholar] [CrossRef]
- Zhai, H.; An, Q.; Shi, L.; Lemort, V.; Quoilin, S. Categorization and Analysis of Heat Sources for Organic Rankine Cycle Systems. Renew. Sustain. Energy Rev. 2016, 64, 790–805. [Google Scholar] [CrossRef]
- Quoilin, S.; Aumann, R.; Grill, A.; Schuster, A.; Lemort, V.; Spliethoff, H. Dynamic Modeling and Optimal Control Strategy of Waste Heat Recovery Organic Rankine Cycles. Appl. Energy 2011, 88, 2183–2190. [Google Scholar] [CrossRef]
- Zhang, Y.; Narasimhan, A.K.; Bai, M.; Zhao, L.; Deng, S.; Goswami, D.Y. Dynamic Behavior and Off-Design Performance Analysis of Solar Driven ORC Using Scroll Expanders; Indian Inst Tech Madras: Chennai, India, 2019. [Google Scholar]
- Freeman, J.; Hellgardt, K.; Markides, C.N. Working Fluid Selection and Electrical Performance Optimisation of a Domestic Solar-ORC Combined Heat and Power System for Year-Round Operation in the UK. Appl. Energy 2017, 186, 291–303. [Google Scholar] [CrossRef]
- Song, J.; Gu, C.W.; Ren, X. Parametric Design and Off-Design Analysis of Organic Rankine Cycle (ORC) System. Energy Convers. Manag. 2016, 112, 157–165. [Google Scholar] [CrossRef]
- Zhao, L.; Zhang, Y.; Deng, S.; Ni, J.; Xu, W.; Ma, M.; Lin, S.; Yu, Z. Solar Driven ORC-Based CCHP: Comparative Performance Analysis between Sequential and Parallel System Configurations. Appl. Therm. Eng. 2018, 131, 696–706. [Google Scholar] [CrossRef]
- Wang, Y.; Song, J.; Chatzopoulou, M.A.; Sunny, N.; Simpson, M.C.; Wang, J.; Markides, C.N. A Holistic Thermoeconomic Assessment of Small-Scale, Distributed Solar Organic Rankine Cycle (ORC) Systems: Comprehensive Comparison of Configurations, Component and Working Fluid Selection. Energy Convers. Manag. 2021, 248, 114618. [Google Scholar] [CrossRef]
- Chatzopoulou, M.A.; Simpson, M.; Sapin, P.; Markides, C.N. Off-Design Optimisation of Organic Rankine Cycle (ORC) Engines with Piston Expanders for Medium-Scale Combined Heat and Power Applications. Appl. Energy 2019, 238, 1211–1236. [Google Scholar] [CrossRef]
- Wolff, C.; Schulz, P.; Knirr, M.; Priebe, K.-P.; Strumberg, J.V.J. Flexible and Controllable ORC Turbine for Smart Energy Systems. In Proceedings of the 2016 IEEE International Energy Conference (ENERGYCON), Leuven, Belgium, 4–8 April 2016. [Google Scholar]
- Hernandez, A.; Desideri, A.; Gusev, S.; Ionescu, C.M.; Van Den Broek, M.; Quoilin, S.; Lemort, V.; De Keyser, R. Design and Experimental Validation of an Adaptive Control Law to Maximize the Power Generation of a Small-Scale Waste Heat Recovery System. Appl. Energy 2017, 203, 549–559. [Google Scholar] [CrossRef]
- Pierobon, L.; Casati, E.; Casella, F.; Haglind, F.; Colonna, P. Design Methodology for Flexible Energy Conversion Systems Accounting for Dynamic Performance. Energy 2014, 68, 667–679. [Google Scholar] [CrossRef]
- Antonelli, M.; Baccioli, A.; Francesconi, M.; Desideri, U. Dynamic Modelling of a Low-Concentration Solar Power Plant: A Control Strategy to Improve Flexibility. Renew. Energy 2016, 95, 574–585. [Google Scholar] [CrossRef]
- Ireland Melissa, K.; Orosz Matthew, S.; Brisson, J.G.; Desideri Adriano, Q.S. Dynamic Modeling and Control System Definition for a Micro-CSP Plant Coupled with Thermal Storage Unit. In Proceedings of the ASME Turbo Expo 2014: Turbine Technical Conference and Exposition, GT2014, Dusseldorf, Germany, 16–20 June 2014. [Google Scholar]
- Manente, G.; Toffolo, A.; Lazzaretto, A.; Paci, M. An Organic Rankine Cycle Off-Design Model for the Search of the Optimal Control Strategy. Energy 2013, 58, 97–106. [Google Scholar] [CrossRef]
- Quoilin, S.; Desideri, A.; Wronski, J.; Bell, I.; Lemort, V. ThermoCycle: A Modelica Library for the Simulation of Thermodynamic Systems. In Proceedings of the 10th International Modelica Conference, Lund, Sweden, 10–12 March 2014; Volume 96, pp. 683–692. [Google Scholar] [CrossRef]
- Desideri, A.; Hernandez, A.; Gusev, S.; van den Broek, M.; Lemort, V.; Quoilin, S. Steady-State and Dynamic Validation of a Small-Scale Waste Heat Recovery System Using the ThermoCycle Modelica Library. Energy 2016, 115, 684–696. [Google Scholar] [CrossRef]
- Zhang, Y.; Deng, S.; Zhao, L.; Lin, S.; Ni, J.; Ma, M.; Xu, W. Optimization and Multi-Time Scale Modeling of Pilot Solar Driven Polygeneration System Based on Organic Rankine Cycle. Appl. Energy 2018, 222, 396–409. [Google Scholar] [CrossRef]
- Cao, S.; Xu, J.; Miao, Z.; Liu, X.; Zhang, M.; Xie, X.; Li, Z.; Zhao, X.; Tang, G. Steady and Transient Operation of an Organic Rankine Cycle Power System. Renew. Energy 2019, 133, 284–294. [Google Scholar] [CrossRef]
- Feng, Y.Q.; Hung, T.C.; Wu, S.L.; Lin, C.H.; Li, B.X.; Huang, K.C.; Qin, J. Operation Characteristic of a R123-Based Organic Rankine Cycle Depending on Working Fluid Mass Flow Rates and Heat Source Temperatures. Energy Convers. Manag. 2017, 131, 55–68. [Google Scholar] [CrossRef]
- Kim, I.S.; Kim, T.S.; Lee, J.J. Off-Design Performance Analysis of Organic Rankine Cycle Using Real Operation Data from a Heat Source Plant. Energy Convers. Manag. 2017, 133, 284–291. [Google Scholar] [CrossRef]
- Jang, Y.; Lee, J. Comprehensive Assessment of the Impact of Operating Parameters on Sub 1-KW Compact ORC Performance. Energy Convers. Manag. 2019, 182, 369–382. [Google Scholar] [CrossRef]
- Torregrosa, A.; Galindo, J.; Dolz, V.; Royo-Pascual, L.; Haller, R.; Melis, J. Dynamic Tests and Adaptive Control of a Bottoming Organic Rankine Cycle of IC Engine Using Swash-Plate Expander. Energy Convers. Manag. 2016, 126, 168–176. [Google Scholar] [CrossRef]
- Zhang, J.; Lin, M.; Fang, F.; Xu, J.; Li, K. Gain Scheduling Control of Waste Heat Energy Conversion Systems Based on an LPV (Linear Parameter Varying) Model. Energy 2016, 107, 773–783. [Google Scholar] [CrossRef]
- Seitz, D.; Gehring, O.; Bunz, C.; Brunschier, M.; Sawodny, O. Model-Based Control of Exhaust Heat Recovery in a Heavy-Duty Vehicle. Control Eng. Pract. 2018, 70, 15–28. [Google Scholar] [CrossRef]
- Rathod, D.; Xu, B.; Filipi, Z.; Hoffman, M. An Experimentally Validated, Energy Focused, Optimal Control Strategy for an Organic Rankine Cycle Waste Heat Recovery System. Appl. Energy 2019, 256, 113991. [Google Scholar] [CrossRef]
- Palagi, L.; Pesyridis, A.; Sciubba, E.; Tocci, L. Machine Learning for the Prediction of the Dynamic Behavior of a Small Scale ORC System. Energy 2019, 166, 72–82. [Google Scholar] [CrossRef]
- Feng, Y.Q.; Liu, Y.Z.; Wang, X.; He, Z.X.; Hung, T.C.; Wang, Q.; Xi, H. Performance Prediction and Optimization of an Organic Rankine Cycle (ORC) for Waste Heat Recovery Using Back Propagation Neural Network. Energy Convers. Manag. 2020, 226, 113552. [Google Scholar] [CrossRef]
- Zhang, J.; Lin, M.; Shi, F.; Meng, J.; Xu, J. Set Point Optimization of Controlled Organic Rankine Cycle Systems. Chin. Sci. Bull. 2014, 59, 4397–4404. [Google Scholar] [CrossRef]
- Narasimhan, A.K.; Wickramaratne, C.; Kamal, R.; Goswami, D.Y.; Singh, P. Mapping Scroll Expander Performance for Organic Working Fluids Using Dimensionless Parameters in Ns-Ds Diagram. Energy 2019, 182, 739–752. [Google Scholar] [CrossRef]
- Ma, Z.; Bao, H.; Roskilly, A.P. Dynamic Modelling and Experimental Validation of Scroll Expander for Small Scale Power Generation System. Appl. Energy 2017, 186, 262–281. [Google Scholar] [CrossRef]
- Wang, J.; Yan, Z.; Zhao, P.; Dai, Y. Off-Design Performance Analysis of a Solar-Powered Organic Rankine Cycle. Energy Convers. Manag. 2014, 80, 150–157. [Google Scholar] [CrossRef]
- Liu, L.; Zhu, T.; Gao, N.; Gan, Z. A Review of Modeling Approaches and Tools for the Off-Design Simulation of Organic Rankine Cycle. J. Therm. Sci. 2018, 27, 305–320. [Google Scholar] [CrossRef]
- Chatzopoulou, M.A.; Lecompte, S.; De Paepe, M.; Markides, C.N. Off-Design Optimisation of Organic Rankine Cycle (ORC) Engines with Different Heat Exchangers and Volumetric Expanders in Waste Heat Recovery Applications. Appl. Energy 2019, 253, 113442. [Google Scholar] [CrossRef]
- Lecompte, S.; Gusev, S.; Vanslambrouck, B.; De Paepe, M. Experimental Results of a Small-Scale Organic Rankine Cycle: Steady State Identification and Application to off-Design Model Validation. Appl. Energy 2018, 226, 82–106. [Google Scholar] [CrossRef]
- US Department of Commerce, N. NIST Standard Reference Database 23: Reference Fluid Thermodynamic and Transport Properties-REFPROP; Version 9.1; NIST NSRDS, National Institute of Standards and Technology: Boulder, Colorado, 2013.
- Zhao, L.; Zhu, Y.; Gao, P.; Zhang, L. Assumption and Criterion of Incomplete Condensation of Zeotropic Refrigerants. Huagong Xuebao/J. Chem. Ind. Eng. 2007, 58, 2727–2732. [Google Scholar]


Publisher’s Note: MDPI stays neutral with regard to jurisdictional claims in published maps and institutional affiliations. |
© 2022 by the authors. Licensee MDPI, Basel, Switzerland. This article is an open access article distributed under the terms and conditions of the Creative Commons Attribution (CC BY) license (https://creativecommons.org/licenses/by/4.0/).