Article

A Pilot Study of Electrical Vehicle Performance, Efficiency, and Limitation in Kuwait’s Harsh Weather and Environment

Kuwait Institute for Scientific Research (KISR), Safat 13109, Kuwait
*
Author to whom correspondence should be addressed.
Energies 2022, 15(20), 7466; https://doi.org/10.3390/en15207466
Submission received: 10 August 2022 / Revised: 18 September 2022 / Accepted: 10 October 2022 / Published: 11 October 2022

Abstract

:
Due to industrialization and an exponential increase in population, the demand for vehicles has increased in Kuwait. Utilizing fossil fuels to power vehicles that are in high demand has posed various environmental and medical implications. Considering the emission-free feature of electric vehicles (EVs), moving towards “EV readiness” is the need of the hour. This can be further enhanced by adopting alternative sustainable technologies such as photo voltaic (PV) charging of EVs, to potentially eliminate or significantly reduce the reliance on fossil fuel while simultaneously decreasing harmful emissions. As Kuwait does not manufacture cars, it imports all vehicles and their parts, including internal combustion engines (ICEs) and EVs. To find out the challenges to uplifting Kuwait’s “EV readiness” this study delved into the performance of a typical EV car in Kuwait’s weather conditions. This includes the investigation of parameters that influence the energy requirements in an electric vehicle, the change in the energy requirement in relation to several driving scenarios, and the efficiency of the EV battery. The results indicate that a significant amount of energy is being wasted for battery conditioning, which drastically reduces the distance covered during summer. The energy required for air-conditioning and battery conditioning are both positively correlated to the ambient temperature, while the time required to charge the battery has no relationship with the time of the day, traffic, or trip length. Additionally, the paper discusses some major challenges, such as lack of awareness, inadequate charging stations, and absence of policy. The paper recommends the most vital areas to be focused on for meeting the above challenges to make the transition to an “EV ready” state.

1. Introduction

The urban areas in the state of Kuwait (Figure 1) have experienced an “exponential growth in the number of motor vehicles” as a result of the “rapid economic evolution, and low prices of vehicles” [1]. Thus, recent studies have expounded that the main obstacle in the transport sector is that the supply of “transport facilities has not matched the increase in demand” [1]. Recent studies have also emphasized the importance of developing new strategies that aim to contain/reduce the impact of traffic congestion (visualized by an increased number of cars queuing on the road). This congestion is an “important issue in urban network due to the negative impacts such as delays, wasted fuel consumption, which causes atmospheric pollution” [1]. Subsequently, “traffic congestions and rush hours within city limits and along major highways (i.e., King Abdulaziz (Fahaheel), 5th and 6th ring roads) contribute mainly to the levels of CO, NO x and VOC in the air” [2]. According to these statistics, it is also critical to take into consideration the fact that for “every 33 residents in Kuwait, there are 100 cars registered” [3].
Moreover, there are inevitable environmental and health consequences for these emissions, which negatively contribute to the air quality in Kuwait. The United States Environmental Protection Agency (EPA) “established National Ambient Air Quality Standards” in order to “protect public health” [1]. Although the short-term standard of PM2.5 is 35 µg/m3, Kuwait has averaged 38.30 µg/m3, placing it in the “unhealthy for sensitive groups brackets.” This empirical data explicates the “negative health implications” especially for the individuals with compromised immune systems in Kuwait [1]. In reference to this, “air pollution in Kuwait is a major contributor to a number of health effects associated with many age groups” [3]. Subsequently, the local health reports stated that “40% of the patients in a hospital situated in Kuwait during the period of August to October 1991 suffered from respiratory issues, baring first Gulf War effects and oil fields fires by retreating Iraqi troops” [3]. Considering this, further studies were initiated to deduce the medical implications of harmful emissions. Therefore, numerous statistical analyses displayed the correlation between an increase in the “concentration of specific air pollutants and symptoms of reactive/nonreactive airway diseases” [3].
Moreover, the traditional method to combat traffic congestion in Kuwait was to increase the capacity of road networks by “adding new roads or lanes” [1]. However, this solution did not “reduce fuel consumption or decrease emissions” that were initially associated with traffic congestion [1]. Furthermore, the negative impacts associated with fossil-fuel exhaustion are a common concern worldwide. This environmental issue “increased worldwide motivation for deploying EV’s as ecological and clean means of transportation” [4].
In reference to this demand around the world, EV sales exponentially “grew from 320,000 in 2014 to 1.04 million in 2017” [4]. However, to inspire and encourage EV utilization in Kuwait, it is critical to synchronously accelerate the expansion of fast charging stations (FCS), where EVs can be charged for 15–20 min [4]. However, supplying FCS from the existing energy system imposes an extra burden on the electrical grid [4]. Moreover, stochastic connections to charge EVs can potentially cause overloading at peak demand, creating instability and ultimately blackouts [4]. Considering this, it is critical to explore additional resources for securing power to supply FCS [4]. Hence, this concentration primarily emphasizes and investigates alternative sustainable technologies (such as PVs) utilized to power the EVs to potentially eliminate or significantly reduce the reliance on internal combustion engine (ICE) vehicles, which are based on fossil-fuel while synchronously decreasing harmful emissions. Moreover, in reference to this, if the electricity is explicitly generated by predominantly utilizing fossil-fuel-based sources (petroleum, coal, and gas), the substantial growth in the energy demand to supply the predicted/anticipated large number of FCS will expedite fossil-fuel reserve exhaustion, which will inevitably have severe ecological impacts [4]. Additionally, deploying sustainable renewable energy sources (RES) can be utilized as alternative non-conventional and non-fossil-fuel-based solutions to fulfill the FCS power demand [4].
Therefore, as a means to reduce the reliance on fossil fuels and mitigate greenhouse gas emissions, EVs have gained significant attention in recent years [5]. Globally, the number of EVs on the road exceeded more than 10 million in the middle of 2021, and are expected to reach 120 million by 2030 [3,4]. This acceleration in sales is driven by many factors, including the breakthroughs in lithium-ion battery technology, cost reductions, and increase in range, stability, and lifetime. These milestones, coupled with the drive to net zero, allowed many traditionally manufactured vehicles to enter the market, resulting in cheaper and wider range of EVs to be commercially available [2]. In addition, such development reduced customers’ anxiety, resulting in a higher number of technology adopters globally.
In addition, 24% of Kuwait’s fossil fuel consumption is used by the transportation sector and to generate electricity; this consumption is expected to increase further due to the increase in population. The high dependency on fossil fuels has pushed Kuwait to the list of top ten countries with high per capita CO2 emissions [6].
Another analysis conducted by the International Energy Agency (IEA) showed that the CO2 emissions increased by 1.5% in 2017, led by China, India, and the European Union [7,8], whereas Middle Eastern countries recorded an extraordinary increase in CO2 emission in the last two decades. Based on the Energy Information Administration (EIA), the CO2 increased by over 200% in Middle Eastern countries. Road vehicles contribute around 75% of CO2 emissions of the transportation sector among the different modes of transportation [9]. Hence, moving to electrical vehicles and the electrification of all road transportation is a critical step in reducing direct CO2 emission [10]. Another study conducted by Al-Foraih et al. [11] predicted that the CO2 emissions from vehicles would increase by 77% from the base year of their research (2016). Assuming 3% of vehicles are replaced every year with EVs, the reduction in CO2 will be significant and will help reduce per-capita CO2 emissions. The following graph (Figure 2) summarizes our estimation based on the results of Al-Foraih et al., assuming a 3% replacement rate and using the estimation of the impact on CO2 emissions [11].
As EVs do not emit CO2, they would definitely help to reduce the air pollution in the city. Additionally, EVs can be charged by any electrical energy, preferably generated by renewable resources. Even when charged from electricity from the local grid, which mainly depends on fossil fuels in Kuwait, it is still a good solution in localizing air pollution as the power plant stations are located far from the city.
However, the harsh climate conditions in Kuwait will have implications for the energy consumption of EVs; its effect on the electrical grid and charging infrastructure need to be studied. While a number of relevant studies were found in a review of the literature, the real-world performance of EVs in such harsh environmental conditions, specifically in hot countries, remains sparsely studied.

2. Objective

Due to its lack of manufacturing facilities, Kuwait meets its vehicle demand by importing them from other countries. The demand is estimated to reach three million vehicles in Kuwait by 2027 [6]. In recent years, the import of EVs started picking up. According to the available information, around 250 EVs are available in the country. However, there is currently no proper policy available to ensure the smooth transition from ICEs to EVs.
By considering the aforementioned, as a first step towards making Kuwait “EV Ready”, this study was conducted to address the following inquiries:
  • Are EVs capable of delivering the same performance in Kuwait’s harsh weather as is mentioned in their specifications?
  • What are the parameters that influence the energy requirements?
  • Is there any change in the energy requirements with the change in the driving scenario?
  • Is there any relationship between the amount of charge in the battery and the energy consumption?

3. Methodology

To answer the aforementioned questions, a detailed research methodology was formulated. The methodology has the following steps:
  • Selection of a suitable EV
Since there are no vehicle manufacturing companies functioning in Kuwait, it meets all vehicle demand by importing from other countries. Even though most vehicle manufacturers are investing in manufacturing EVs, the technology has not been widely adopted and remains a niche market. A literature survey was conducted to identify the availability of various models in the market along with their energy requirement, and the results are presented in Table 1.
From contacting the local dealers, it was found that most of the models are unavailable in Kuwait. Accordingly, one of the available models was selected as a random sample to carry out the study while maintaining a low budget, to estimate wide market adoption. The specifications of the selected model (Chevrolet Chevy Bolt) are given in Table 1. In addition to the aforementioned information, the specification claims that it can be fully charged within one hour, if a three-phase AC charger is used.
2.
Data collection
Since the selected car was not equipped with a data logging facility, photographs of the dashboard were taken at the start and end of every trip. Some photographs are given in Figure 3. Data collection from vehicle use began in July 2019, and this paper analyses the data collected between 1 August 2019 and 31 October 2021. The period includes several months during which the government mandated restrictions on activities and movements of the population in order to address the COVID-19 pandemic via curfews of varying lengths. Partial lockdowns were generally applied during the evening and overnight hours were in operation from 22 March 2020 to 9 May 2020 and 31 May 2020 to 29 August 2020. A total lockdown was in operation between 10 May and 30 May 2020 and consisted of a 24-hour curfew.
Hence, Table 2 reflects the types of information collected as part of data-collection process.
3.
Validation of performance in Kuwait weather conditions
Considering that none of the EVs were specifically designed for Kuwait’s weather conditions, verification of their performance was a high priority. From the customer’s point of view, two major factors were validated: time required to charge fully and the distance travelled until the battery was fully depleted.
4.
Statistical Analysis
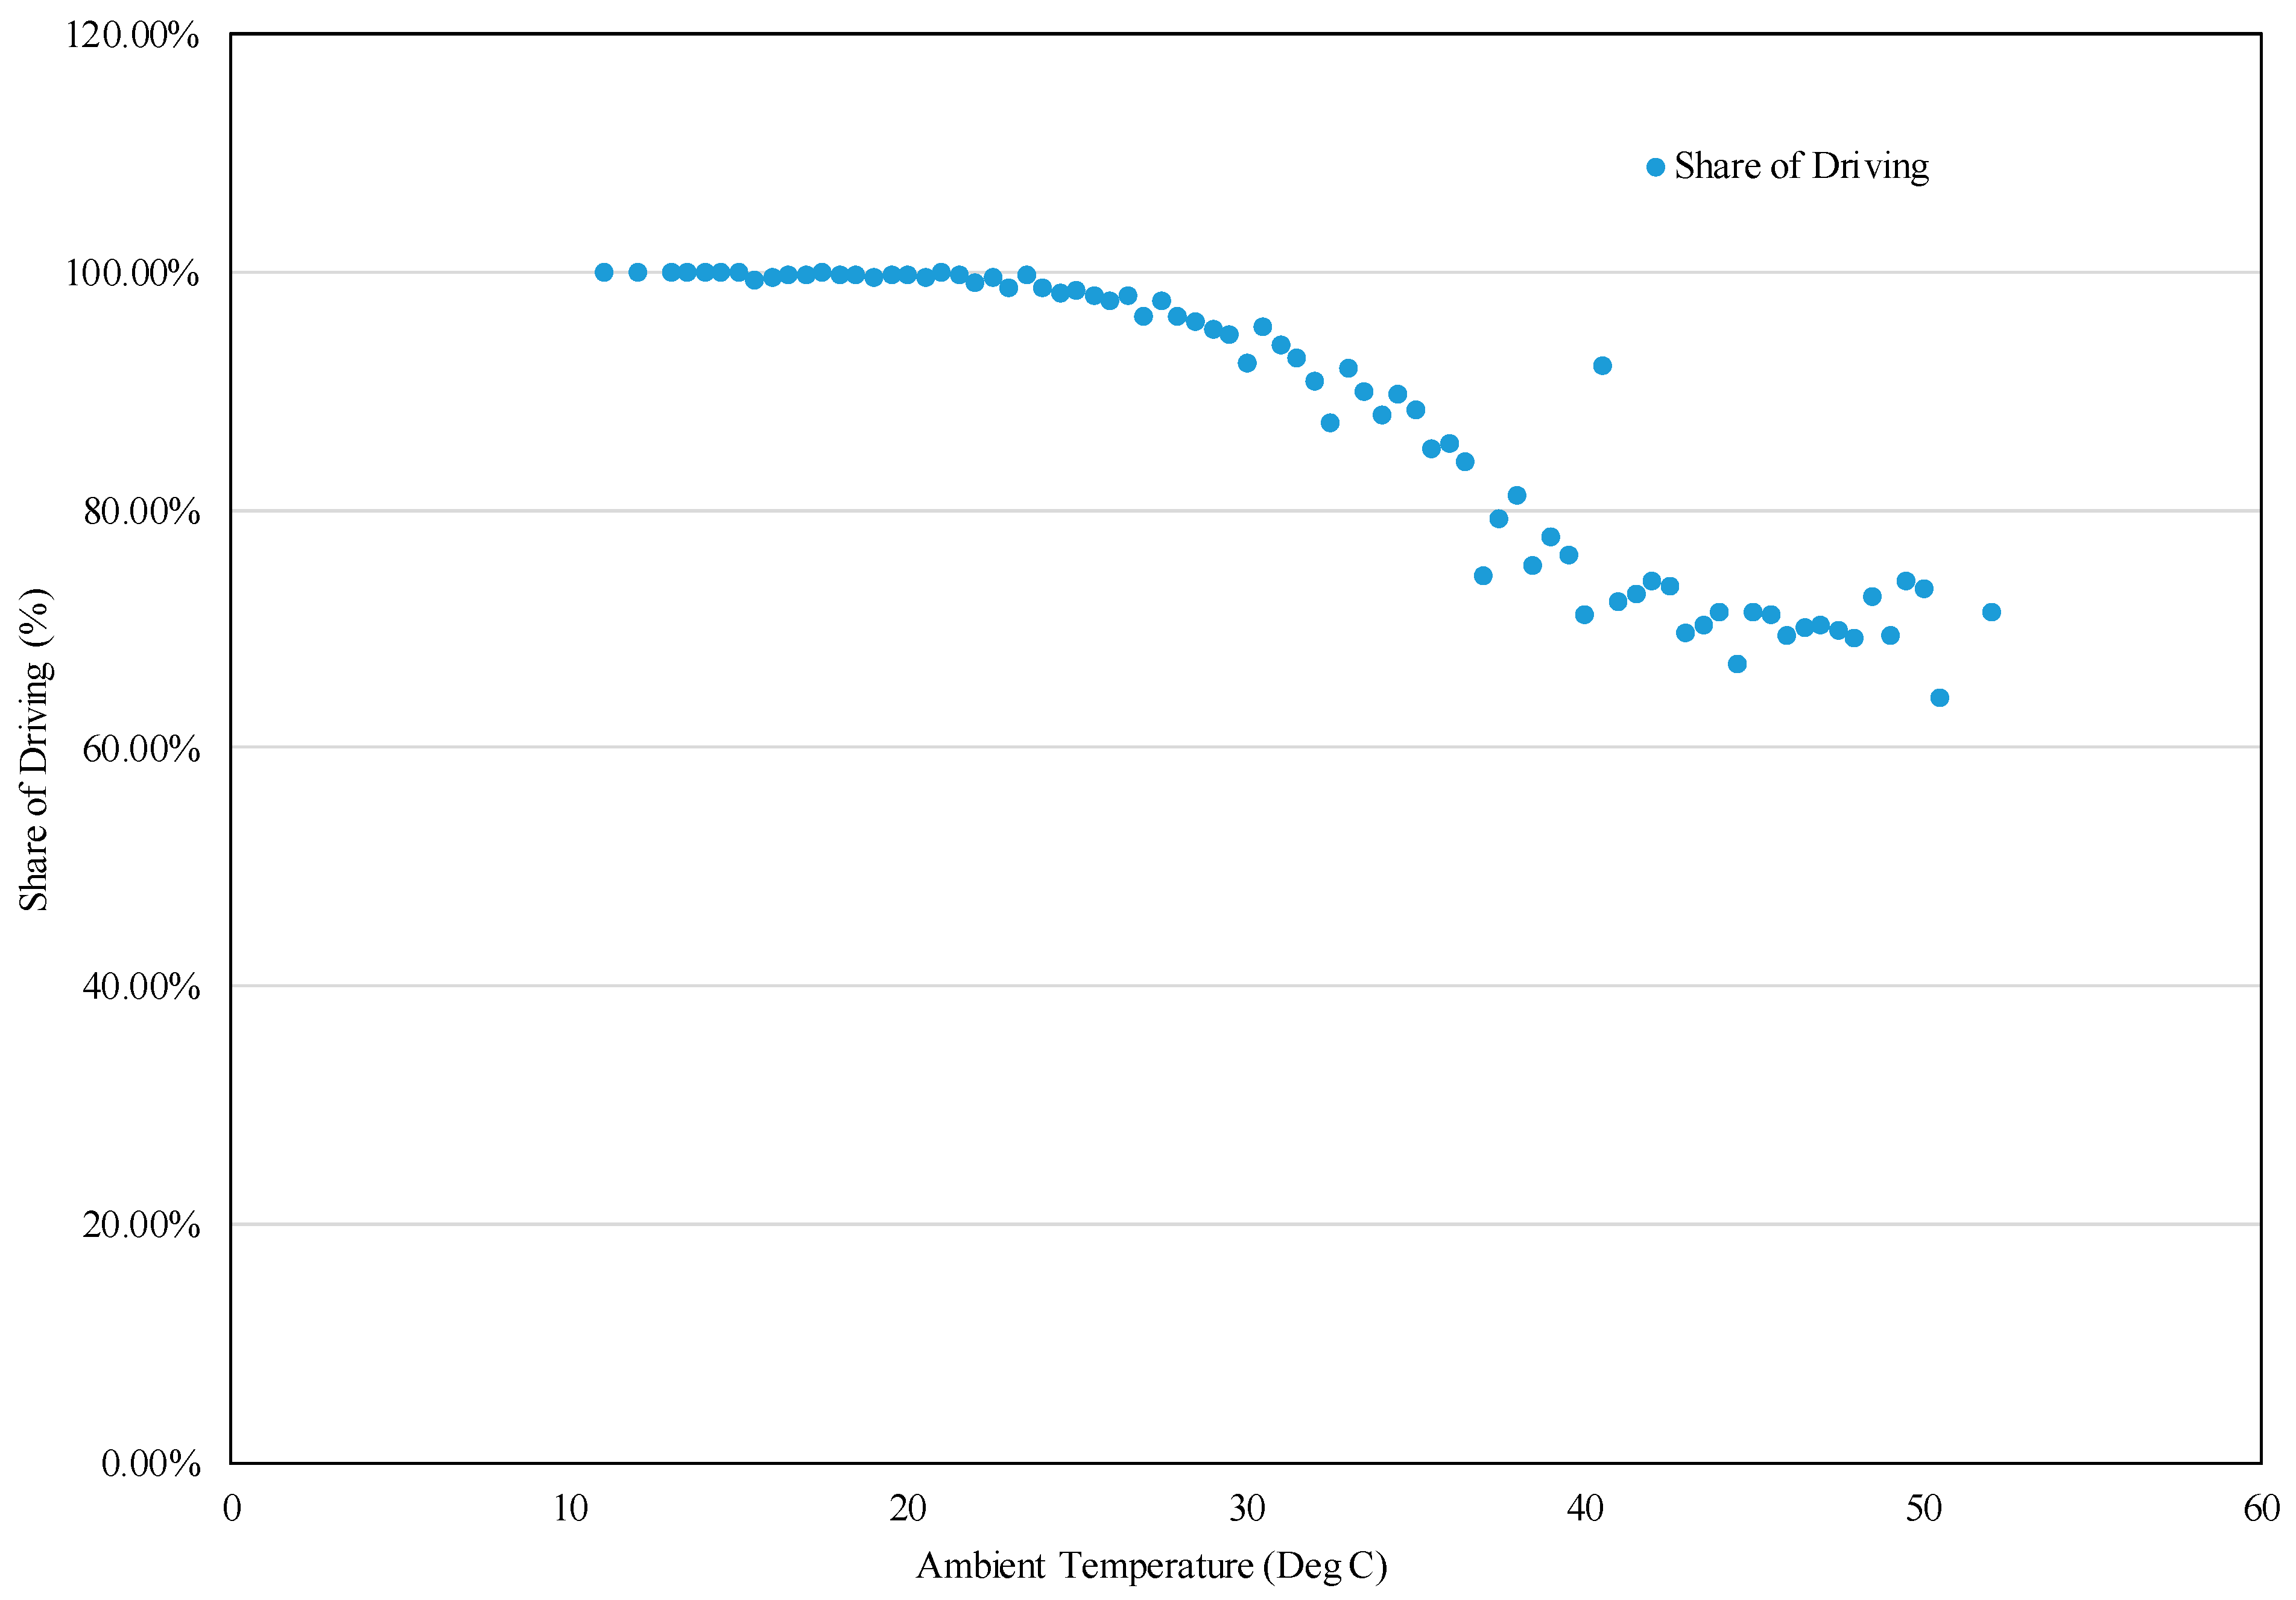
The statistical modelling presented in this study investigated the relationship between temperature and energy intensity or consumption per kilometre of driving (Figure 4). The EV’s performance was studied according to different scenarios and conditions. These scenarios included monitoring the EV’s technical performance by collecting data on distance travelled, electricity used, air temperature, and battery information. In addition, consumption levels of air conditioning and any electric usage within the car’s features were also considered, as shown in Table 3.

4. Results and Discussion

4.1. Ambient Temperature

Validation of the performance of the EV was carried out in high ambient conditions. As seen in Figure 4, the ambient temperature was in the range of 50 degrees. Battery charge dropped to 7.7% after travelling a distance of 225 km. A similar test in the winter season resulted in different results, which are tabulated in Table 3.
The data was extrapolated to 100% battery usage, and the maximum expected travel distance was only 244 km (152 mi) in summer and 321 km (200 mi) in winter. The winter data almost met the specifications of the car, but summer performance was around 25% lower than the winter. Upon further investigation, the reasons behind the high energy consumption in summer are the following:
Besides driving and air-conditioning requirements in ICE cars, in EVs energy is used for battery conditioning (BC) as well. The share of BC is insignificant in the lower ambient conditions, but starts building up along with ambient temperature. One year of data was used to understand the relationship between ambient temperature and BC, plotted in Figure 4.
While calculating the effective energy used for driving, the results did not match the manufacturer’s specifications during the summer. The utilization of energy matched the manufacturer’s specifications until the ambient temperature reached 30 °C (Figure 5). Once the ambient temperature crossed that threshold, the driving share started declining to as low as 64%. This could be one of the reasons behind the performance deviation between summer and winter data.
As residents are heavily dependent on driving rather than utilizing public transportation in the country, the collected data represents the activities of a typical household in Kuwait. Accordingly, we collected data repeatedly by driving the car in different scenarios.

4.2. The Scenarios Are the Following

4.2.1. Commute to and from Work (Morning and Afternoon)

Most of the residents in Kuwait use their own cars for commuting to and from workplaces. Since carpooling is not widely practiced, the collection of data in this scenario has high importance. A 40-km (25 mi) trip was selected for this purpose. Even though the distance from the office to home was slightly higher than the average, the selection was made in view of addressing a worst-case scenario. We selected a route from Egaila to Shuwaikh, where the traffic is moderate to severe. As well as considering the nature of traffic, the employees’ commitment to report to the office and back in time is also considered in this scenario. Data was planned to be collected during different months of the year to see the impact of the weather conditions, but due to unexpected lockdowns because of the COVID-19 pandemic, data could not be collected as scheduled. This scenario can be viewed as two separate scenarios, as the ambient conditions, distance travelled, and traffic conditions varied during the commute from home to the office, and vice versa.

4.2.2. Peak Hours (High Traffic)

Undoubtedly, all residents need to visit government offices to meet their various requirements. In Kuwait, these government offices are placed close to each other, to be convenient to the residents. Even though not all government offices are situated on these premises, the most important services such as the Public Authorities for Civil Information (PACI), Ministry of Electricity and Water (MEW), Ministry of Public Works (MPW), and the Public Authority for Industries (PAI) are located at this location (Ministries Zone). This place used to have heavy traffic during working hours. To see the impact of traffic on the performance of the vehicle, the car was driven in this closed circuit for a duration of two hours for two weeks (Sunday to Thursday).

4.2.3. Short Trips near Home (Late Evening and Night)

Due to the climate conditions, residents in Kuwait prefer to go out after sunset. This time is used for various activities such as shopping, dining out, walking on the beach or park, and gatherings. The driving pattern of this segment is entirely different from the previous scenarios, as it does not follow any particular daily route. Due to this, we have named this segment short trips near home, where kilometres travelled on each day are different. However, trips that are above 25 km (15.5 mi) were not considered in this scenario.

4.2.4. Long Trips

Similar to the previous scenario, this scenario also does not follow any particular pattern. Some of the long trips are for meeting parents, friends, family members, places of worship, etc. Here, all trips that are above 25 km (15.5 mi) in distance, and trips that do not fall under any of the aforementioned scenarios were included. To obtain solutions for the objectives of the study, the following data was collected at the beginning and end of each trip. Based on that, a few essential parameters were monitored, as specified in Table 4.
In addition to the aforementioned, information such as battery charge, ambient temperature, and percentage of energy used for air conditioning and battery conditioning were also collected.
The collected data was analysed using Statistical Package for the Social Sciences (SPSS) software 21 [13] to find the answers for all the aforementioned three questions. The results of the analysis are given below.

4.3. Parameters That Influence the Energy Requirement

The energy shares of parameters such as AC usage and energy for battery conditioning were correlated to ambient temperature. To check the correlation, a bivariate analysis was conducted using SPSS software. The results found are tabulated in Table 5. The correlation varied with each scenario as expected, where the driving share increases as the share for AC/BC decreases based on ambient temperature.
Since the results are not repetitive in nature, further data collection and analysis needed to be carried out.

4.4. Energy Requirement under Different Scenarios

The energy required to drive one kilometre of distance was calculated under all five scenarios. This was calculated by taking the average distance covered in a particular scenario and the corresponding average energy consumption. The number of samples varies depending upon the nature of the scenarios. There were 165 data points for “short trips near home” as it was the most frequently followed practice. Due to lockdown, there was significantly less data collected for most important scenarios, such as “home to office”, “office to home”, and “peak hour” compared to the other two. Data is tabulated in Table 6.
Table 6 indicates that 142 Wh to 188 Wh energy is required to travel 1 km (0.62 mi) of distance. More research needs to be conducted to explore the parameters that influence the variation in consumption. Parameters of interest include the number of passengers, usage pattern of air-conditioning, and other differences in personal habits while driving (acceleration rate, etc.). Due to lockdown, month-wise data analysis could not be conducted, which is considered a limitation of these findings.
Despite this, it was surprising to note that energy requirement in the afternoon, which used to be warmer than that of the morning time, is lower compared to morning time. This result made it necessary to explore whether the charge in the battery has any influence on the reduced energy consumption. Since the charging station is situated in the office premises, most of the time the car was charged during the day time. A separate correlation analysis was carried out to find out if there is any correlation between the charge (%) of the battery and the energy requirement. The details are given in the subsequent section.

4.5. Relationship between Battery Charge to the Energy Requirement

To verify the influence of the battery charge on energy consumption, the correlation between these parameters was tested. By running a bivariate analysis, it was found that the correlation was insignificant at the 0.01 level (2-tailed). The result was repeated for all five scenarios. Table 7 shows that the significance level is higher than 0.01 in all scenarios. Hence, it was established that there is no relationship between battery charge (%) and the energy requirement irrespective of time, traffic, and distance covered.

4.6. Challenges and Possible Solutions

The following challenges need to be addressed to make the journey towards “EV Readiness” feasible.

4.6.1. Awareness

Providing proper awareness to consumers by addressing their concerns is an important step for implementing any new technology or scheme in any market [14]. Spreading awareness about EVs in general to community members is important, and should consider different ages, educational levels, and other aspects. In addition, proper training should be provided from the manufacturers and suppliers to civil defense departments on proper emergency response procedures, including precautions on how to deal with electric vehicles in the event of emergencies such as traffic accidents, fires, electrolyte leakage from the battery, etc. Moreover, emergency responders, for example policemen and firemen, must be well-trained on safety requirement. They should learn how to evacuate the passengers from the vehicle, and how to deal with the vehicle while avoiding the high voltage area. Moreover, emergency responders should be provided with appropriate personal protective equipment that is required to deal with any EV. At least one workshop with all qualified and trained personnel should be contracted by the manufacturers or their suppliers for regular maintenance and repair of their vehicles. In addition, staff training is important to identify and prevent electrical hazards during an operation or when using an electric vehicle.

4.6.2. Lack of Charging Stations

Unlike petrol stations, EV charging stations are not common in Kuwait. It is obvious that no one likes to experience situations such as stopping their cars on the road in the middle of a trip. All EVs come with onboard chargers capable of converting the current before supplying it to the car’s battery. AC chargers are more common in the market as they are comparatively less expensive to produce, install, and operate. Furthermore, AC charging stations may be sub-categorized into slow charging stations and fast charging stations. Slow charging stations are similar to regular home sockets while fast charging stations are wall-box chargers explicitly designed for EVs. The larger the battery, the more time it takes to charge. AC chargers are suitable for overnight home charging, and charging in parking spaces for daily use.
On the other hand, DC chargers enable the conversion of current from AC to DC outside the vehicle. This transformation takes place inside the charger itself. DC is then directly fed into the EV, surpassing the need for onboard conversion. These chargers require a lot more current intensity from the grid, nearly 125 A, and are much more expensive to produce, install, and operate. As a result, charging time is significantly shortened using DC chargers.
There are only 23 charging stations for electric vehicles and they are distributed in 14 locations in Kuwait so far. All the installed charging stations are AC type except one DC type, which is installed in the main building of the Kuwait Institute for Scientific Research (KISR), in Shuwaikh. However, a map showing the distribution of EV charging stations should be available in a formal website. It is recommended to support solar power (photo voltaic)-based charging stations.
There are three main types of charging stations currently available in the market, as shown in Table 8.
The main difference is the voltage used for charging the vehicle; as a result of increasing the voltage applied, the duration of charging will decrease. However, increasing the voltage of the station will require additional components to the station, which will increase the cost dramatically. The time required for charging differs based on the capacity of the batteries and the electric vehicle itself. Level (I) charging offers 120 v of voltage, and it can provide the EV with around 2–4 miles of driving range per charging hour. However, Level (II) provides 240 v (which requires an outlet with the same wiring as a stove or clothes dryer), and provides the EV up to 25 miles per hour. Level (III), which is the fast charging, uses direct current (DC) to restore the vehicle’s battery to 80–100% power in as little as half an hour.
Level (I) and Level (II) charging are considered as slow charging, but they are the most convenient charging options, as they can be accessed using most standard wall outlets. Thereby, levels (I) and (II) charging can be installed in many places, even at homes. However, Level (III) chargers are available only at dedicated charging stations since they operate at a high voltage and current.

4.6.3. Lack of Policy and Regulations

The spread of EVs in a country like Kuwait will require that a program is developed and applied on a national level. Policy and regulations regarding importing and buying electric vehicles should be available. It is crucial to set an appropriate tariff for the electricity consumed to charge EVs. It must incentivize at the start to encourage wide adoption of the technology, and the tariff can be reconsidered based on the price of electricity once wide adoption has been ensured. In addition, it is recommended to have a list of electricity prices based on the time of the day in order to encourage consumers to avoid charging during peak time in Kuwait, to alleviate the load on the grid. However, it should be considered that in Kuwait, electricity use is heavily subsidized by the government, which might cause load issues on the grid if tariffs are not reconsidered for EV use.

5. Conclusions

It is critical to realize that the utilization of fossil fuels to power high vehicle demand has posed various environmental repercussions and medical implications. Thus, initiating interest in the deployment of EVs in the region is the need for the hour. This pilot study focused on the energy requirement of a typical EV in various scenarios and established its relationship with ambient temperature. Based on that relationship, extreme care needs to be taken while designing the vehicles for countries which have a high ambient temperature. As expected, the selected car was designed to work in mild ambient conditions; mere importing without considering the ambient conditions should not be encouraged. As demonstrated, the amount of energy utilized for BC is an area of concern. Manufacturers should take necessary steps to reduce this so that the saved energy can be utilized for covering more distance.
Kuwait should focus on developing a policy for EVs and their associated infrastructure. Since every house has more than one car, adding charging stations for all cars in every household may disturb the available electrical network. However, this can be taken care of with regulations for houses under design and construction.
The study should be extended by including all available models in the market. Another area of future study is identifying the locations for PV-based charging stations. The life of the battery under these harsh environmental conditions and possible safety threats also needs to explored further.

Author Contributions

Overall research concept, H.H.; conceptualization, H.H., R.A. And S.A.; methodology, H.H. and R.A.; software, S.A.; formal analysis, R.A. and S.A.; investigation, H.H. and S.A.; resources, R.A. and M.A.-K.; data curation, M.A.-K., R.A. and H.H.; writing—original draft preparation, H.H., R.A. and S.A.; writing—review and editing, H.H. and R.A.; visualization, R.A. and H.H.; supervision, H.H. and R.A.; project administration, H.H.; funding acquisition, H.H. All authors have read and agreed to the published version of the manuscript.

Funding

This research was funded by the Kuwait Foundation for the Advancement of Sciences (KFAS) under grant no. PP18-35EM-01, through a project number EA084C awarded to the Kuwait Institute for Scientific Research (KISR).

Acknowledgments

The authors acknowledge the Kuwait Institute for Scientific Research (KISR) for funding received to support this research. This project was part of the activities under the Renewable Energy Program (RE) in the Kuwait Institute for Scientific Research (KISR), Kuwait. KISR Project number is EA084C. In addition, this study was funded and supported by the Kuwait Foundation for Advancement of Science (KFAS) under grant no. PP18-35EM-01. In addition, a new electrical vehicle (EV) 2018-Chevrolet bolt was purchased and provided by KFAS to serve this study.

Conflicts of Interest

The authors declare no conflict of interest.

References

  1. AlRukaibi, F.; AlRukaibi, D.; AlBurait, A.; Al-Mutairi, A. The Impact of Congestion Charging Technique on Traffic Flow and Atmospheric Pollution in Kuwait City. J. Eng. Res. 2021, 9, 51–62. [Google Scholar] [CrossRef]
  2. Al Wahedi, A.; Bicer, Y. A Case Study in Qatar for Optimal Energy Management of an Autonomous Electric Vehicle Fast Charging Station with Multiple Renewable Energy and Storage Systems. Energies 2020, 13, 5095. [Google Scholar] [CrossRef]
  3. Al-Salem, S.M.; Khan, A.R. Monitoring and Modelling the Trends of Primary and Secondary Air Pollution Precursors: The Case of the State of Kuwait. Int. J. Chem. Eng. 2010, 2010, 879836. [Google Scholar] [CrossRef] [Green Version]
  4. Department of Health. Fine Particles (PM 2.5) Questions and Answers. Available online: www.health.ny.gov/environmental/indoors/air/pmq_a.htm (accessed on 13 March 2020).
  5. Al-Qassimi, M.; Al-Salem, S.M. Ozone (O3) ambient levels as a secondary airborne precursor in Fahaheel urban area, the State of Kuwait. Atmos. Sci. Lett. 2020, 21, 1–14. [Google Scholar] [CrossRef]
  6. Alasseri, R.; Tripathi, A.; Rao, T.J.; Sreekanth, K.J. A review on implementation strategies for demand side management (DSM) in Kuwait through incentive-based demand response programs. Renew. Sustain. Energy Rev. 2017, 77, 617–635. [Google Scholar] [CrossRef]
  7. International Energy Agency. CO2 Emissions from Fuel Combustion 2018 Highlights. IEA Publ 2018:166. Available online: https://www.academia.edu/38020558/CO2_Emissions_from_Fuel_Combustion_2018_Highlights (accessed on 12 August 2020).
  8. Al-Mulali, U. Factors affecting CO2 emission in the Middle East: A panel data analysis. Energy 2012, 44, 564–569. [Google Scholar] [CrossRef]
  9. Tracking Clean Energy Progress 2017. Int. Energy Agency, Paris, France. 2017. Available online: http://www.iea.org/reports/trackingclean-energy-progress-2017 (accessed on 22 April 2020).
  10. Weiss, M.; Dekker, P.; Moro, A.; Scholz, H.; Patel, M.K. On the electrification of road transportation—A review of the environmental, economic, and social performance of electric two-wheelers. Transp. Res. D Transp. Environ. 2015, 41, 348–366. [Google Scholar] [CrossRef] [PubMed]
  11. Al-Foraih, R.; Sreekanth, K.J.; Alasseri, R.; Al-Osaimi, S. A system dynamic energy economic assessment model for road transportation. Int. Energy J. 2020, 20, 497–507. [Google Scholar]
  12. Electrical Vehicle Database. Available online: https://ev-database.org/sort:path~type~order=.rank~number~desc|range-slider-range:prev~next=0~1200|range-slider-acceleration:prev~next=2~23| (accessed on 5 March 2020).
  13. Available online: https://www.techtarget.com/whatis/definition/SPSS-Statistical-Package-for-the-Social-Sciences (accessed on 2 February 2020).
  14. Alasseri, R.; Rao, T.J.; Sreekanth, K.J. Institution of incentive-based demand response programs and prospective policy assessments for a subsidized electricity market. Renew. Sustain. Energy Rev. 2020, 117, 109490. [Google Scholar] [CrossRef]
Figure 1. Urban Kuwait map showing main locations [3].
Energies 15 07466 g001
Figure 2. Impact of introducing 3% electric vehicles in a year on CO2 emissions.
Energies 15 07466 g002
Figure 3. (a) Photos of dashboard at the beginning and end of the trip. (b) Photos of dashboard at the beginning and end of the trip.
Energies 15 07466 g003
Figure 4. Effect of ambient temperature on the share of energy for battery conditioning.
Energies 15 07466 g004
Figure 5. Effect of ambient temperature on the share of energy for driving.
Energies 15 07466 g005
Table 1. Some of the electric vehicles available in the market [12].
EV Model No.Range (Km)Energy Consumption Wh/KmBattery (kWh)
Renault ZOE29973.522
Mitsubishi IMiEV159100.416
Citroen C-ZERO150106.916
Hyundai Ioniq Electric200140.328
Tesla 3 Dual All-wheel drive499150.375
Cheverlet Chevy Bolt383156.660
3P Dual all-wheel drive499161.480.5
Nissan Leaf S241165.740
KIA Soul EV179167.930
FIAT 500e135177.524
VW e-Golf201178.035.8
Tesla s 75 D all-wheel drive417179.975
BMW i3183181.033.2
Ford Focus185181.033.5
Tesla s 100D all-wheel drive539185.5100
BMW i3s172192.833.2
Tesla x 75D all wheel drive381196.675
Tesla s P100D507197.3100
Citroen E-Mehari146204.830
Tesla x 100D all wheel drive475210.6100
Tesla x P100D465215.0100
Table 2. Data collection from EV.
Recorded ParameterDescription
DateDate of the trip
Trip No.Number of trips (with “one” kept as the first trip of the day)
Total Number of tripsTotal number of trips in a day
TimeFromStarting time of the trip
ToEnding time of the trip
PlaceFromStarting place of the trip
ToEnding place of the trip
Odometer (km)StartingStarting time of the trip
ReachingEnding time of the trip
Battery information (before)Possible km to travel (average)The average distance that can be travelled with the available charge of battery
Possible km to travel (min)The minimum distance that can be travelled with the available charge of battery
Possible km to travel (max)The maximum distance that can be travelled with the available charge of battery
Charge (%)Available charge of the battery at the beginning of the trip
Battery information (after)Possible km to travel (average)The average distance that can be travelled with the available charge of battery
Possible km to travel (min)The minimum distance that can be travelled with the available charge of battery
Possible km to travel (max)The maximum distance that can be travelled with the available charge of battery
Charge (%)Available charge of the battery at the end of the trip
Expected time to become fully chargedStartingTime required to charge the battery fully while starting the trip
ReachingTime required to charge the battery fully while ending the trip
Energy used since last full charge (before)Energy (kWh)Cumulative energy used since the time of last full charge
Total distance traveled (Km)Total distance travelled since the time of last full charge
Driving (%)Percentage of energy used for driving since the time of last full charge
Air-conditioning (%)Percentage of energy used for air-conditioning since the time of last full charge
Battery conditioning (%)Percentage of energy used for battery conditioning since the time of last full charge
Energy used since last full charge (after)Energy (kWh)Cumulative energy used since the time of last full charge
Total distance traveled (Km)Total distance travelled since the time of last full charge
Driving (%)Percentage of energy used for driving since the time of last full charge
Air-Conditioning (%)Percentage of energy used for air-conditioning since the time of last full charge
Battery conditioning (%)Percentage of energy used for battery conditioning since the time of last full charge
Car Temperature (°C)StartingAmbient temperature recorded in the car at the starting of trip
ReachingAmbient temperature recorded in the car at the ending of trip
Table 3. The impact on ambient temperature on battery capacity.
Time PeriodDistance Travelled, KmEnergy Used, KWhBatter Used, %Temperature Range
MinAverageMax
15 June 2021 to 20 June 202122524192.33943.250
19 December 2020 to 23 December 202028830089.71517.620
Table 4. Parameters used for analysis.
Measured ParametersCalculated Data (per Trip)
TimeTrip duration
Odometer readingDistance traveled
Energy used since last full chargeEnergy required
Percentage of energy used
Table 5. Correlation between energy consumption and related parameters.
ScenarioShare for Air ConditioningShare for Battery ConditioningAverage Ambient Temperature
Home to office (morning)Negatively CorrelatedNegatively Correlated24.4 °C
Office to home (afternoon)Positively CorrelatedPositively Correlated34.4 °C
Peak Hours (High traffic)No CorrelationNo Correlation28.6 °C
Short trips near homeNo CorrelationNo Correlation28.2 °C
Long tripsPositively CorrelatedNo Correlation28.9 °C
Table 6. Energy requirement under different scenarios.
ScenarioNumber of Data PointsAverage Distance (km)Average Energy (kWh)Average Time (hh:mm)Energy per Distance (kWh/km)
Home to office (morning)4338.860:420.155
Office to home (afternoon)3444.56.30:540.142
Peak Hours (High traffic)1347.87.82:060.163
Short trips near home1656.41.20:100.188
Long trips9867.910.21:060.150
Table 7. Results of bivariate correlation analysis for energy requirement vs. battery charge.
ScenarioSignificance Level (2-Tailed)Assumption
Home to office (morning)0.162No relationship between the two parameters.
Office to home (afternoon)0.794
Peak hours (high traffic)0.358
Short trips near home0.101
Long trips0.142
Table 8. Types of Charging Stations’ Standards.
LevelVoltage (v)Maximum Output Current (A)Estimated Time to Charge
I120128–12 h
II208/240324–8 h
DC Fast (III)450–700200–5505–30 min
Publisher’s Note: MDPI stays neutral with regard to jurisdictional claims in published maps and institutional affiliations.

