

AC Loss Characteristics of HTS Novel Twisted Cables Composed of Soldered-Stacked-Square (3S) Wires


Abstract
:1. Introduction
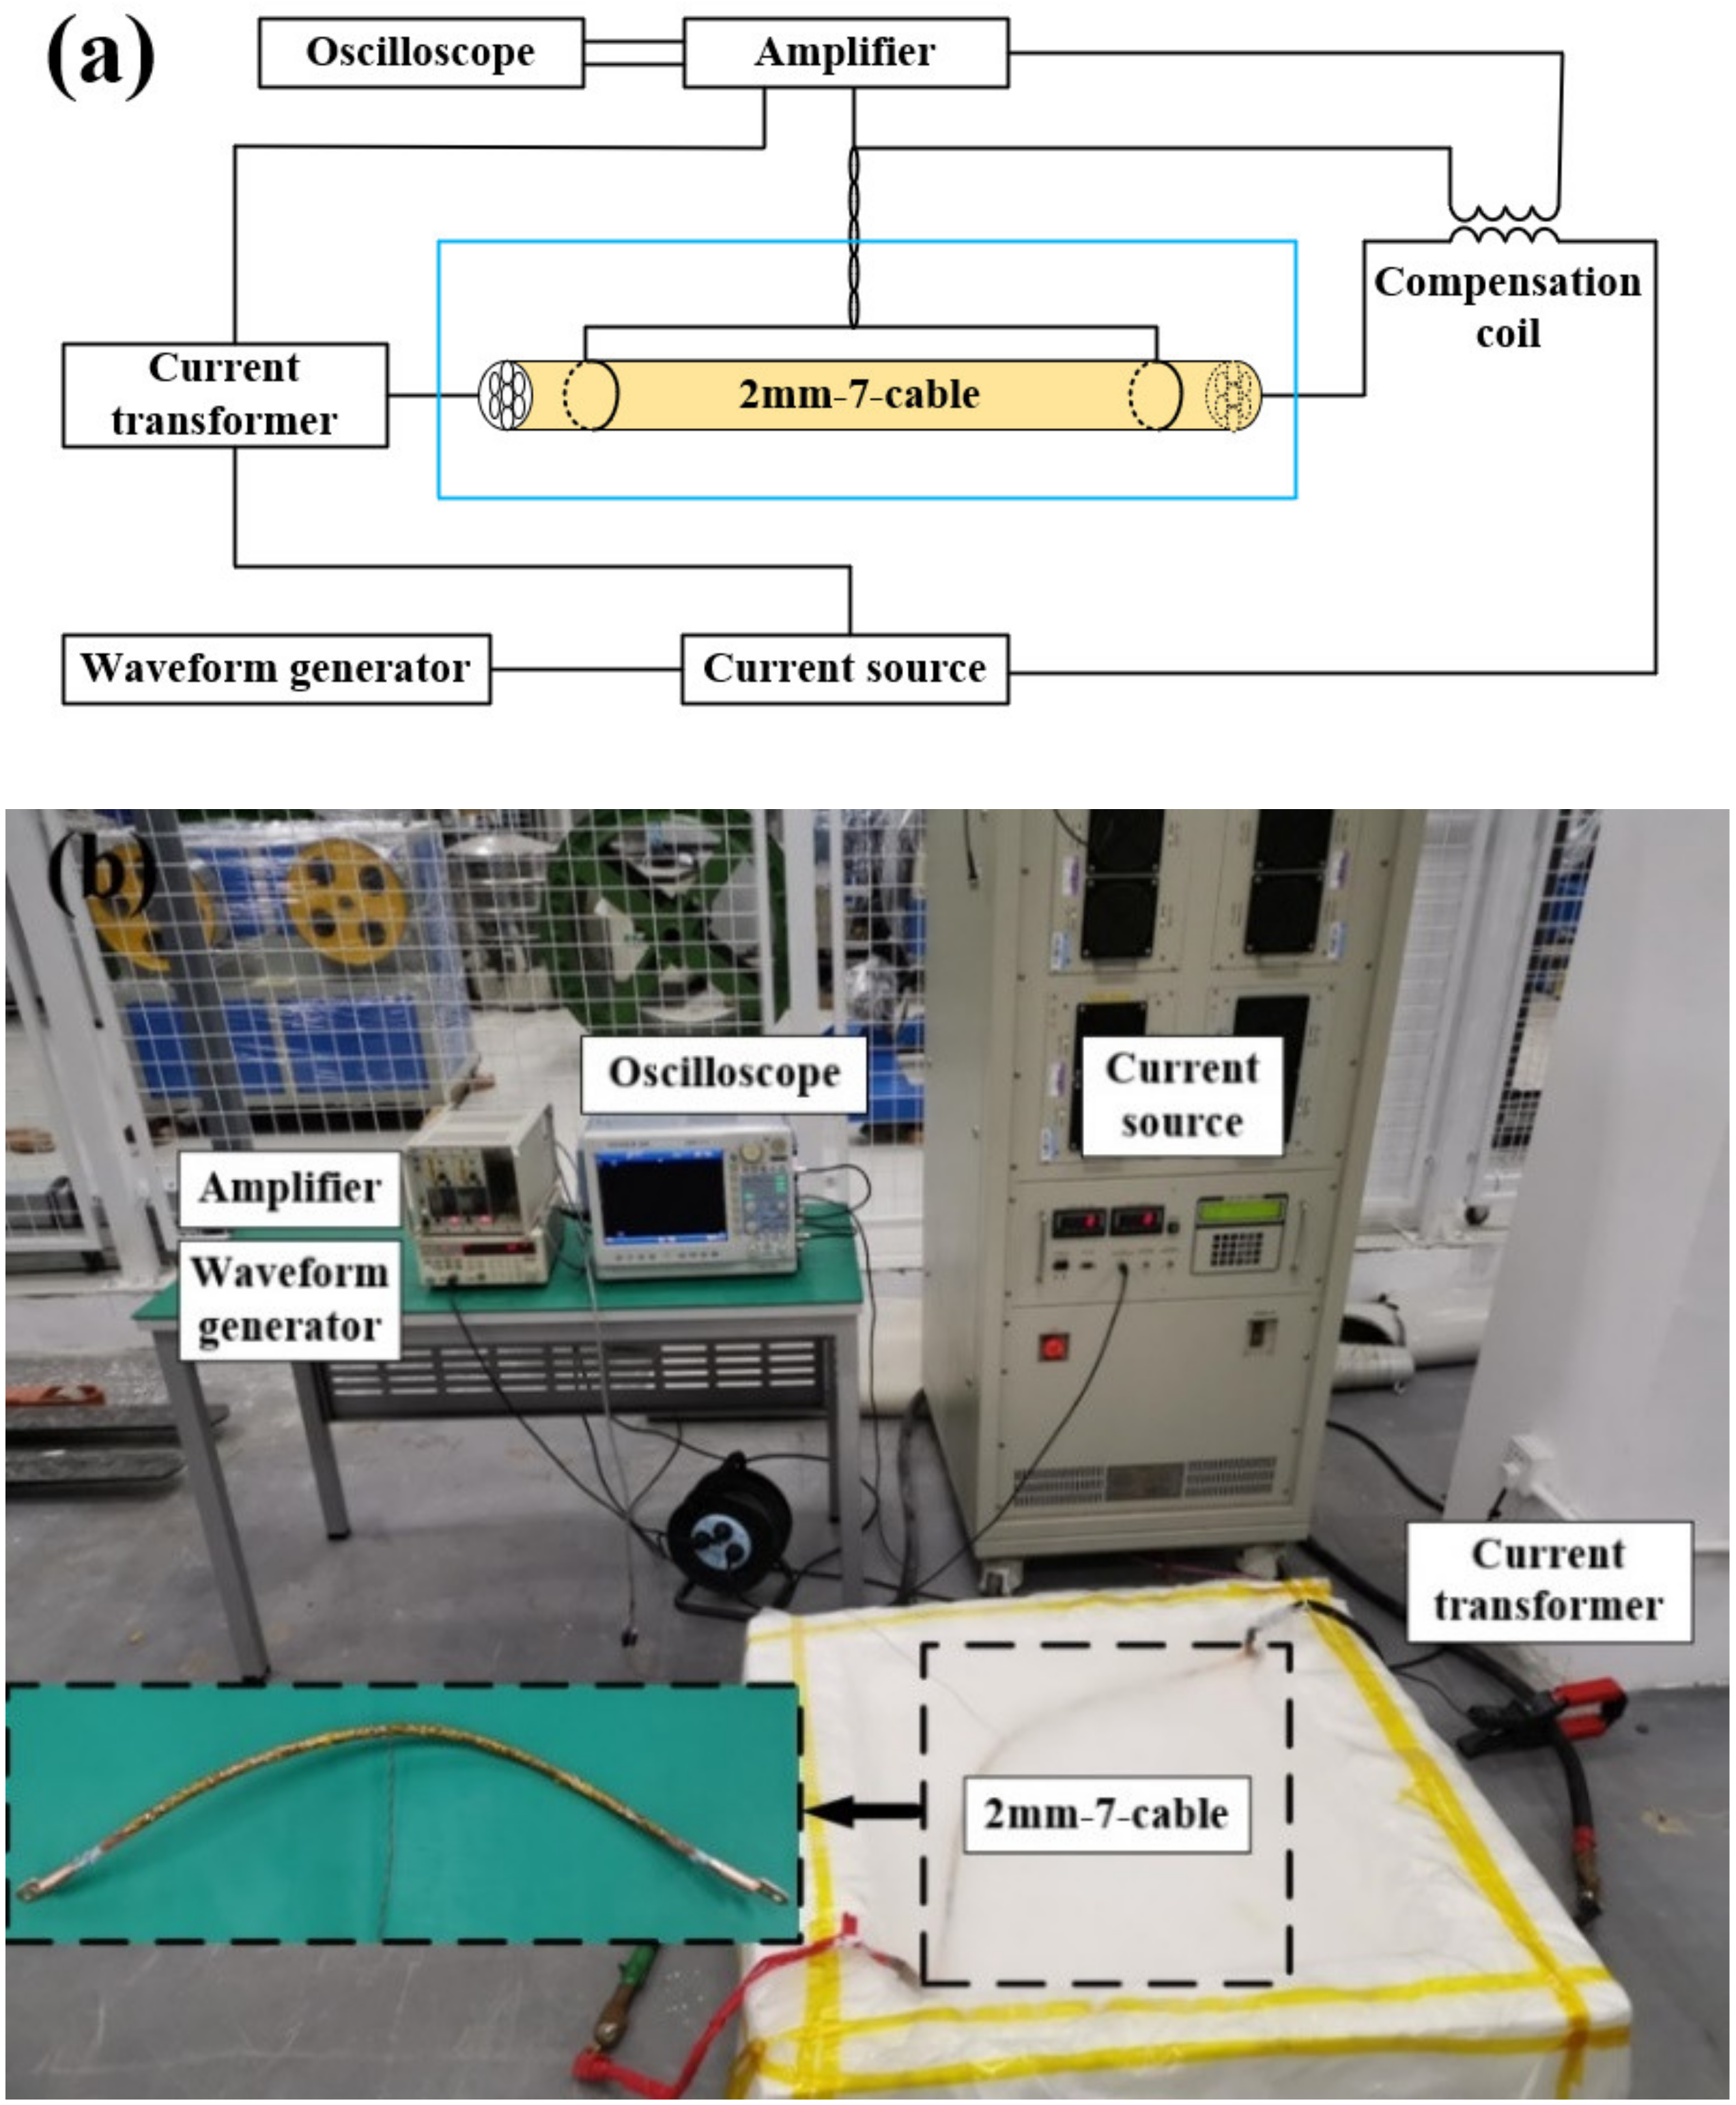
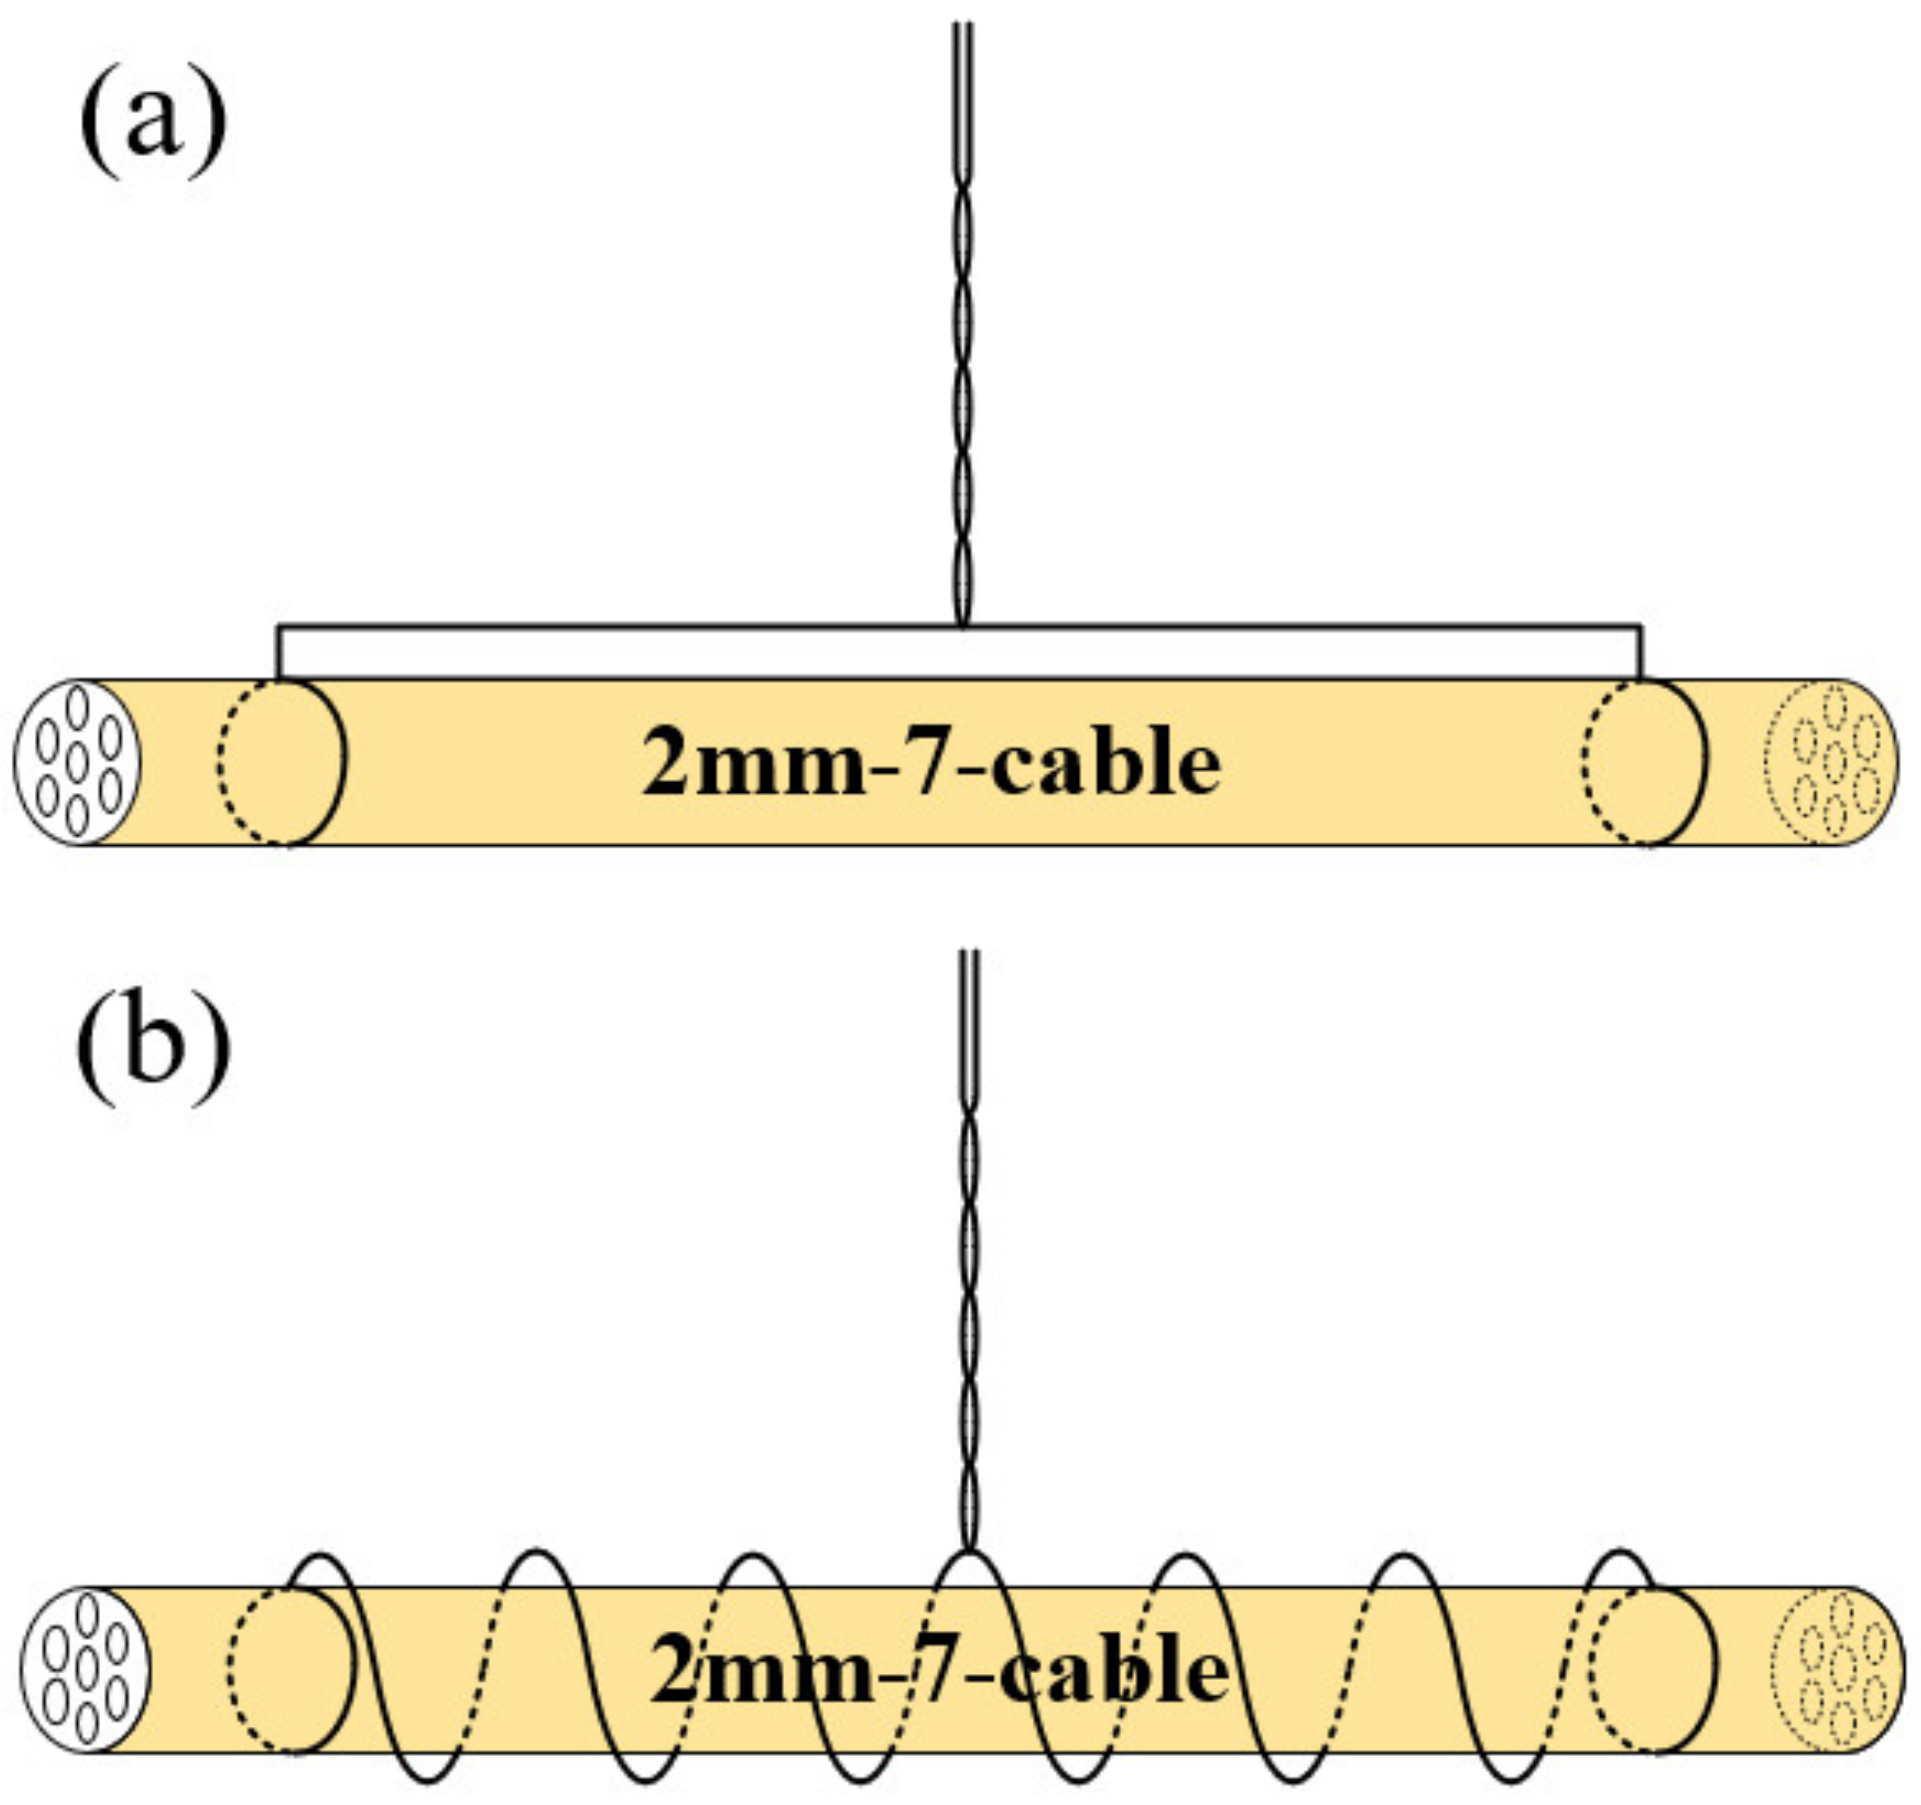
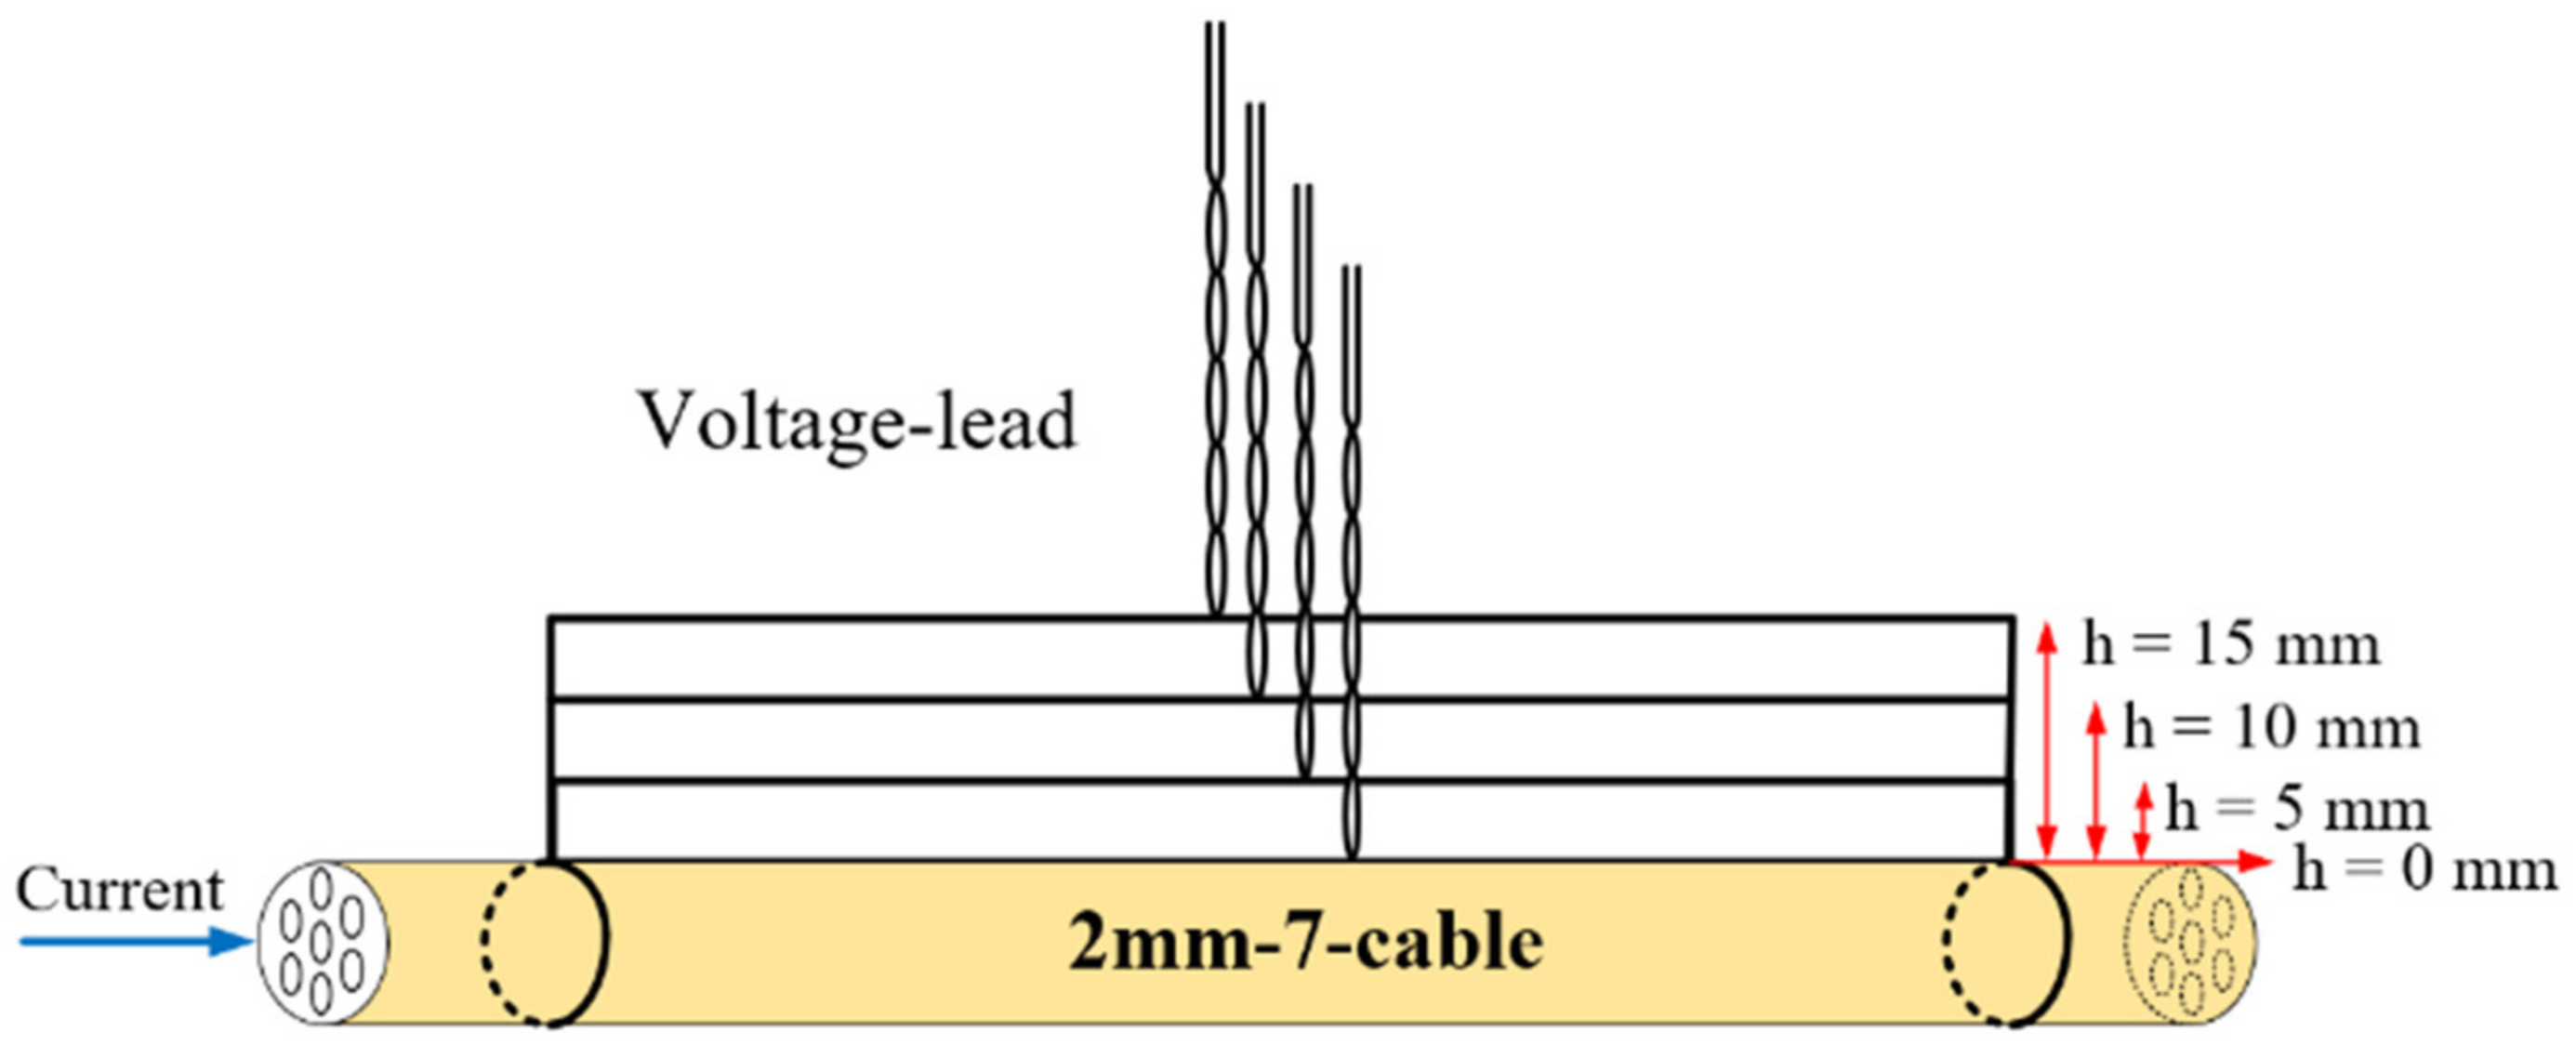
2. AC Loss Measurement
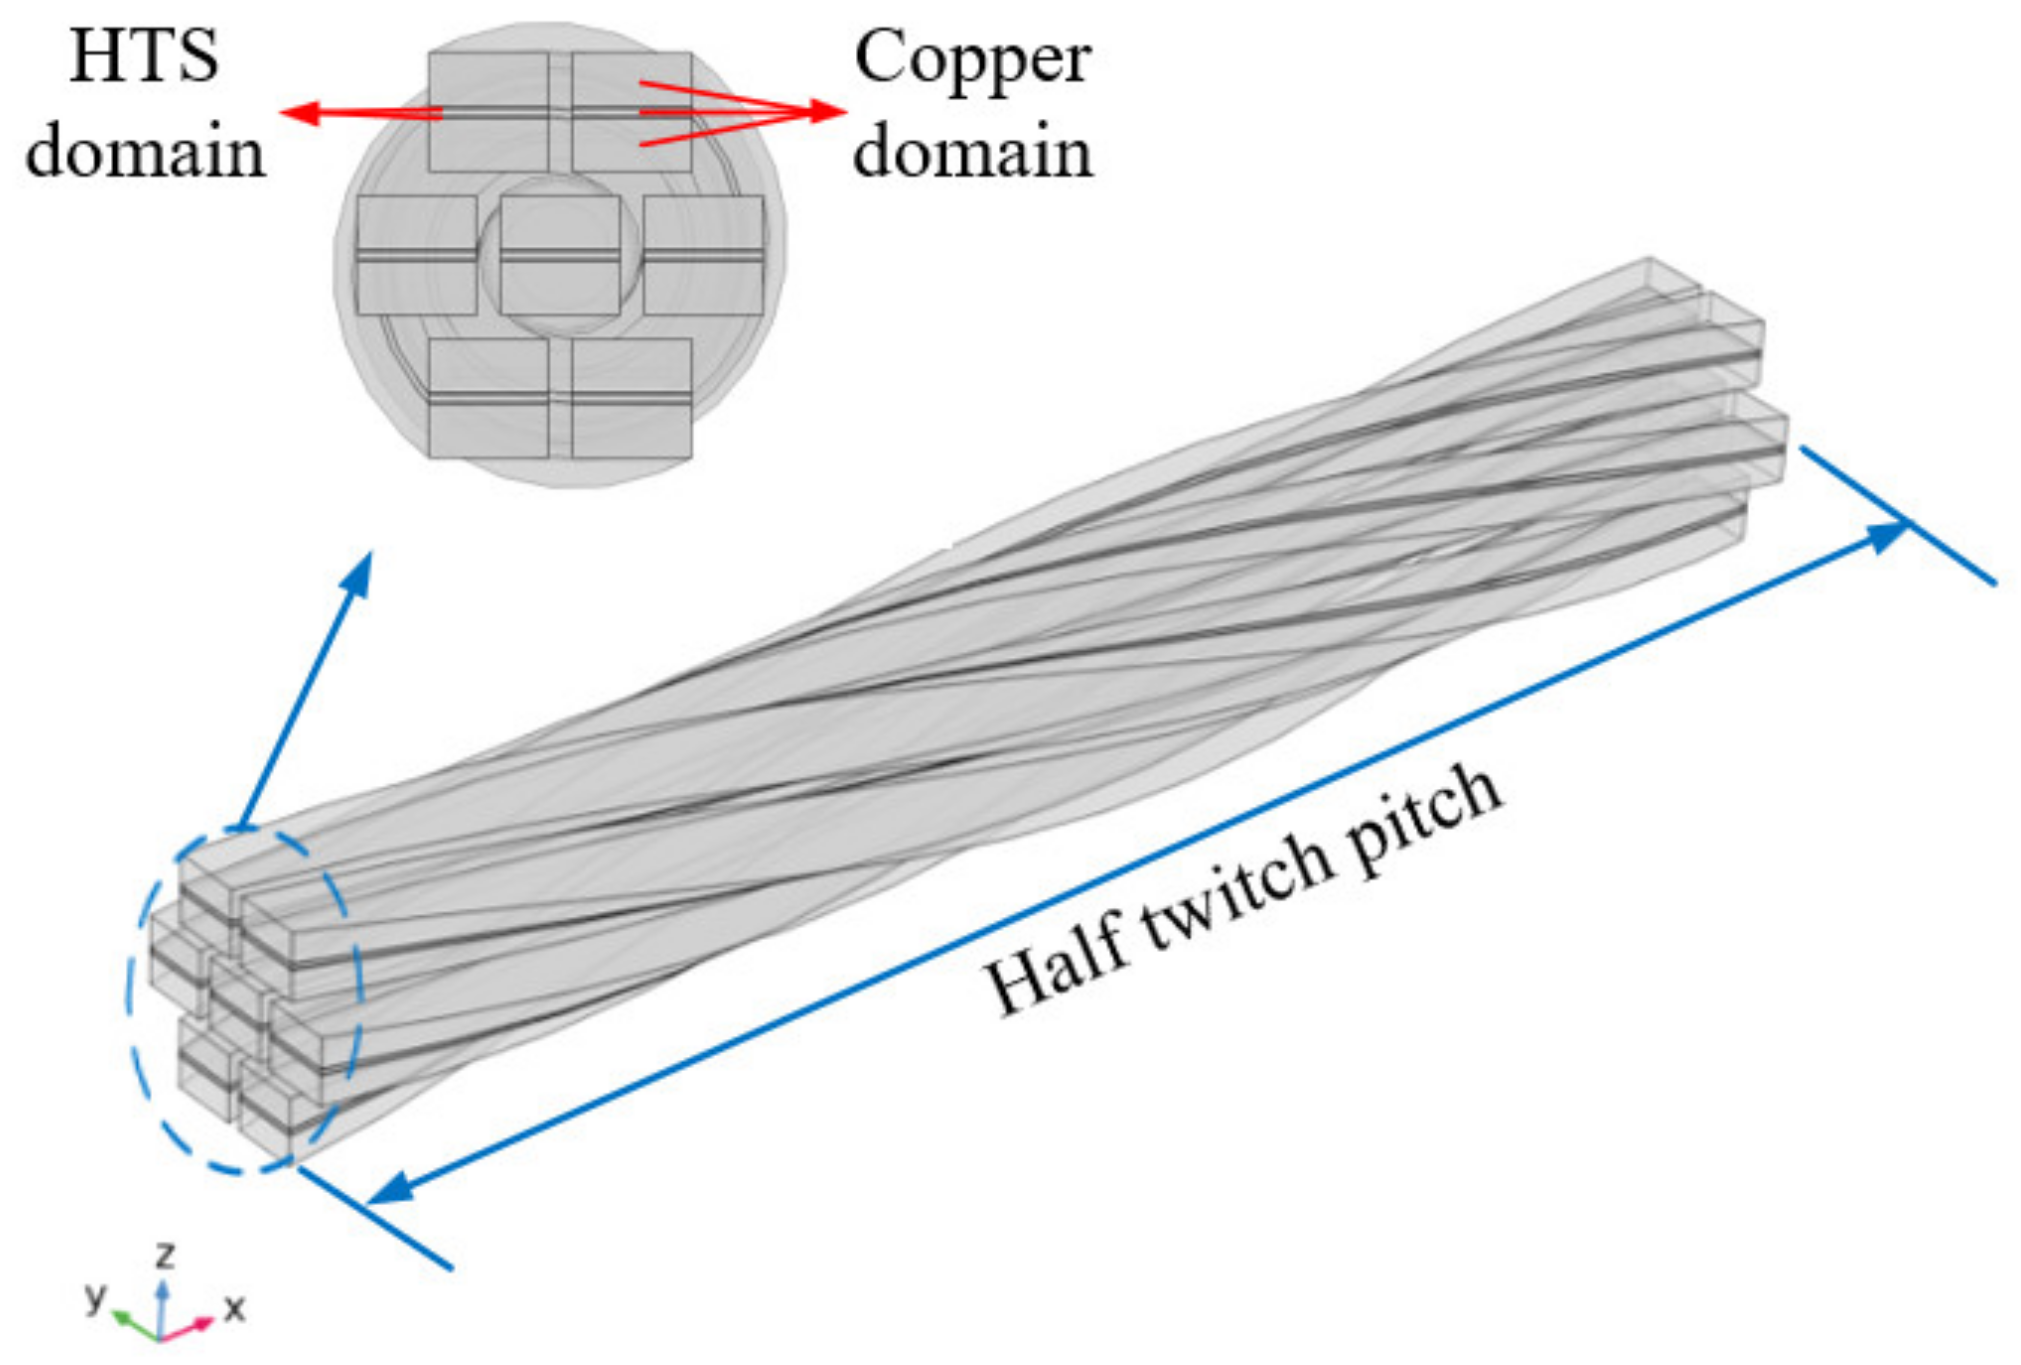
3. AC Loss Simulation
- (1)
- For the A-V formulation and the T-Ω formulation, four variables are required for5three-dimensional problems, while the H-formulation has only three variables, namely Hx, Hy, and Hz. Fewer variables and no second derivative make the H-formulation less computationally intensive and faster than the other two formulations.
- (2)
- In many scenarios, the model needs to consider both the transport current and the background field. The H-formulation is most used in integral boundary conditions. The background field can be achieved by setting the boundary conditions of the H-formulation, while the transport current can be injected into the model by Ampere’s law. Furthermore, there is no need to distinguish vector potentials that could lead to computational errors.
- (3)
- The A-V formulation uses the electric field E to calculate the current density J, a small change in E will cause a dramatic change in J, which makes the formulation very unstable. The H-formulation is just the opposite, using the current density J to calculate the electric field E, successfully avoiding the non-convergence problem that may occur in the A-V formulation.
4. Conclusions
Author Contributions
Funding
Data Availability Statement
Conflicts of Interest
References
- Martucciello, N.; Giubileo, F.; Grimaldi, G.; Corato, V. Introduction to the focus on superconductivity for energy. Supercond. Sci. Technol. 2015, 28, 070201. [Google Scholar] [CrossRef]
- Wu, Y.; Zhao, Y.; Han, X.; Jiang, G.; Shi, J.; Liu, P.; Khan, M.Z.; Huhtinen, H.; Zhu, J.; Jin, Z.; et al. Ultra-fast growth of cuprate superconducting films: Dual-phase liquid assisted epitaxy and strong flux pinning. Mater. Today Phys. 2015, 18, 100400. [Google Scholar] [CrossRef]
- Takayasu, M.; Chiesa, L.; Bromberg, L.; Minervini, J.V. HTS twisted stacked-tape cable conductor. Supercond. Sci. Technol. 2012, 25, 014011. [Google Scholar] [CrossRef]
- Van der Laan, D.C.; Lu, X.F.; Goodrich, L.F. Compact GdBa2Cu3O7−δ coated conductor cables for electric power transmission and magnet applications. Supercond. Sci. Technol. 2011, 24, 042001. [Google Scholar] [CrossRef]
- Goldacker, W.; Frank, A.; Heller, R.; Schlachter, S.I.; Ringsdorf, B.; Weiss, K.-P.; Schmidt, C.; Schuller, S. ROEBEL assembled coated conductors (RACC): Preparation, properties and progress. IEEE Trans. Appl. Supercond. 2007, 17, 3398–3401. [Google Scholar] [CrossRef]
- Wolf, M.J.; Fietz, W.H.; Bayer, C.M.; Schlachter, S.I.; Heller, R.; Weiss, K.-P. HTS CroCo: A stacked HTS conductor optimized for high currents and long-length production. IEEE Trans. Appl. Supecond. 2016, 26, 6400106. [Google Scholar] [CrossRef]
- Li, Y.; Wang, Y.; Miao, J.; Shi, C.; Ju, P.; Huang, P.; Xue, J.; Hasegawa, T. Investigation on critical current properties of quasi-isotropic strand made from coated conductor. IEEE Trans. Appl. Supercond. 2015, 25, 6600805. [Google Scholar] [CrossRef]
- Pi, W.; Ma, S.; Kang, Q.; Liu, Z.; Meng, Y.; Wang, Y. Study on Mechanical Properties of Quasi-Isotropic Superconducting Strand Stacked by 2-mm-Wide REBCO and Copper Tapes. IEEE Trans. Appl. Supecond. 2020, 30, 6600105. [Google Scholar] [CrossRef]
- Li, Z.; Hu, D.; Zhang, L.; Xie, Z.; Sun, L.; Liu, B.; Hong, Z.; Jin, Z.; Ryu, K. Development of a Novel Soldered-Stacked-Square (3S) HTS Wire Using 2G Narrow Tapes with 1 mm Width. IEEE Trans. Appl. Supercond. 2017, 27, 6600904. [Google Scholar] [CrossRef]
- Guo, Z.; Qin, J.; Lubkemann, R.; Wang, K.; Jin, H.; Xiao, G.; Li, J.; Zhou, C.; Nijhuis, A. AC loss and contact resistance in highly flexible rebco cable for fusion applications. Superconductivity 2022, 2, 100013. [Google Scholar] [CrossRef]
- Bruno, D.; Berger, K.; Ivanov, N. Characterization of High-Temperature Superconductor Bulks for Electrical Machine Application. Materials 2021, 14, 1636. [Google Scholar] [CrossRef]
- Xia, Y.; Song, Y.; Ma, T.; Zheng, J.; Liu, H.; Liu, F.; Song, M. Design and Performance Tests of a Fault Current-Limiting-Type Tri-Axial HTS Cable Prototype. Electronics 2022, 11, 1242. [Google Scholar] [CrossRef]
- Wang, M.; Qi, H.; She, M.; Zhang, L.; Ryu, K.; Li, Z.; Hong, Z.; Jin, Z. Fabrication and Critical Current Evaluation for HTS Twisted Cables Consisting of Soldered-Stacked-Square (3S) Wires. IEEE Trans. Appl. Supercond. 2021, 31, 4804004. [Google Scholar] [CrossRef]
- Ciszek, M.; Ashworth, S.P.; James, M.P.; Glowacki, B.A.; Campbell, A.M.; Garre, R.; Conti, S. Self-field AC losses and critical currents in multi-tube Ag-Bi-2223 conductors. Supercond. Sci. Technol. 1996, 9, 379–384. [Google Scholar] [CrossRef]
- Krzysztof, K.; Kampik, M.; Stȩpień, M. Characterization of high-temperature superconducting tapes. IEEE Trans. Instrum. Meas. 2019, 69, 2959–2965. [Google Scholar] [CrossRef]
- Zhang, M.; Coombs, T.A. 3D modeling of high-Tc superconductors by finite element software. Supercond. Sci. Technol. 2011, 25, 015009. [Google Scholar] [CrossRef]
- Patrick, P.; Sieger, M.; Ottolinger, R.; Lao, M.L.; Eisterer, M.; Meledin, A.; Van Tendeloo, G.; Haenisch, J.; Holzapfel, B.; Schultz, L.; et al. Influence of artificial pinning centers on structural and superconducting properties of thick YBCO films on ABAD-YSZ templates. Supercond. Sci. Technol. 2018, 31, 044007. [Google Scholar] [CrossRef]
- Krzysztof, K.; Grilli, F.; Kario, A.; Godfrin, A.; Zermeno, V.M.R.; Stepien, M.; Kampik, M. Length Uniformity of the Angular Dependences of I c and n of Commercial REBCO Tapes with Artificial Pinning at 77 K. IEEE Trans. Appl. Supercond. 2018, 29, 8000309. [Google Scholar] [CrossRef]
- Wang, M.; Li, Z.; Zhang, Y.; Sun, C.; Dong, F.; Pan, Y.; Yao, L.; Hong, Z.; Jin, Z. Three-Dimensional Numerical Study on Transport AC Loss of Soldered-Stacked-Square-Twisted (3S-T) Wire. IEEE Trans. Appl. Supercond. 2019, 29, 5900105. [Google Scholar] [CrossRef]


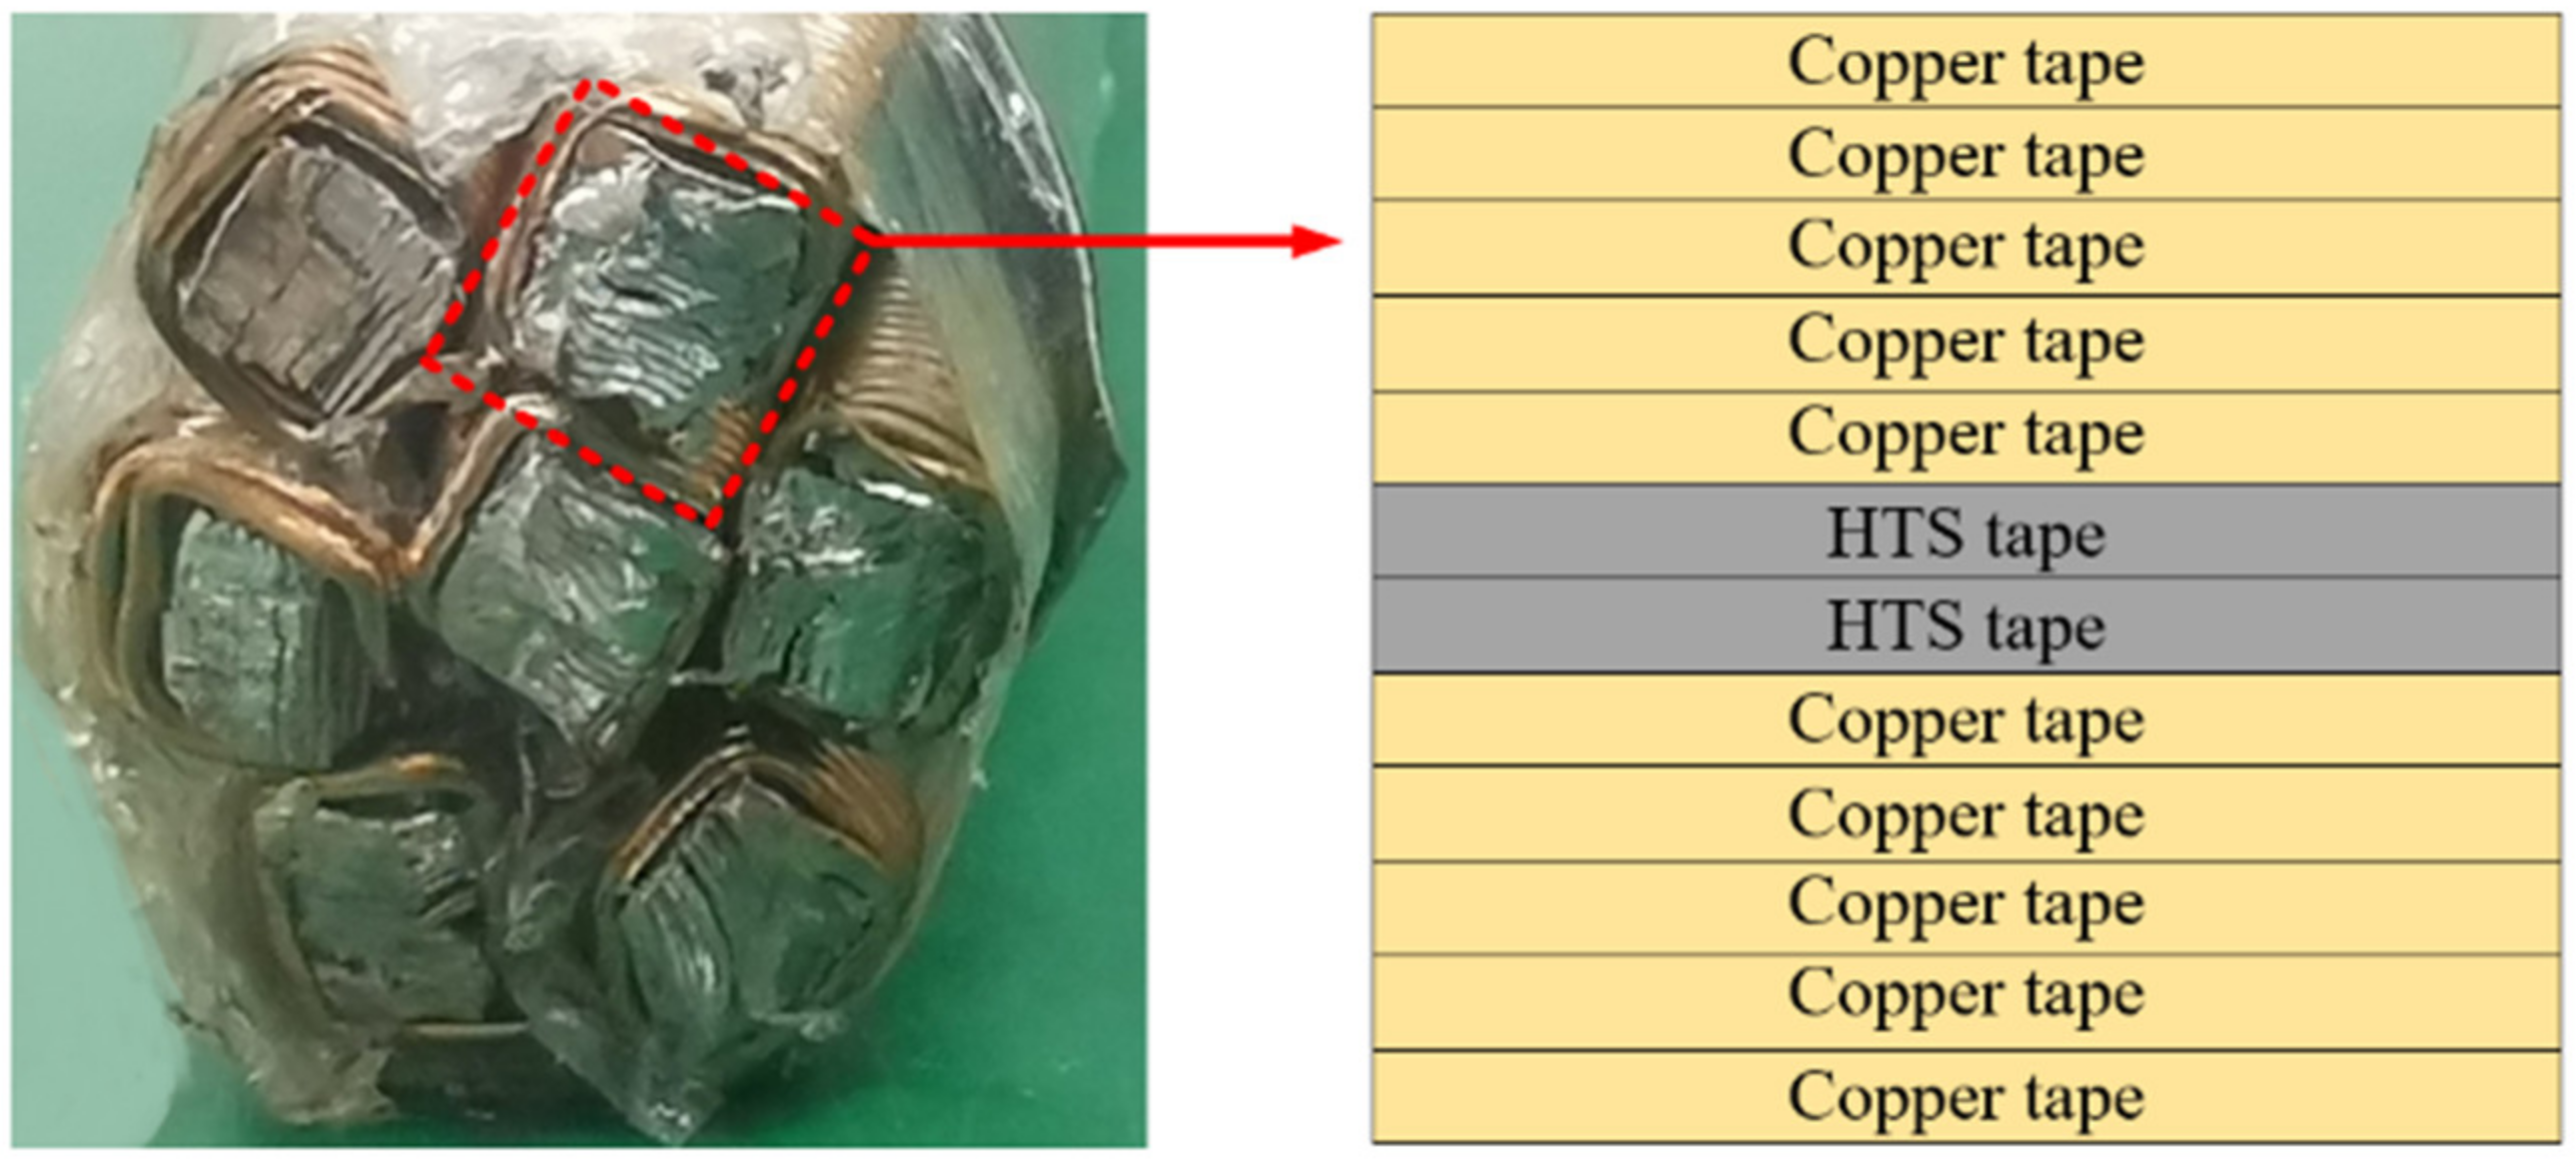
| HTS tape | Width and thickness | 2.0 mm × 70 μm |
| Thickness of superconducting layer | ~1.3 μm | |
| Thickness of silver layers | ~1 μm | |
| Thickness of substrate layer (plus buffer) | ~10 μm | |
| Thickness of copper plating layer, each side | 90 A @ 77 K | |
| Critical current of HTS tapes | 30 A ± 5 A | |
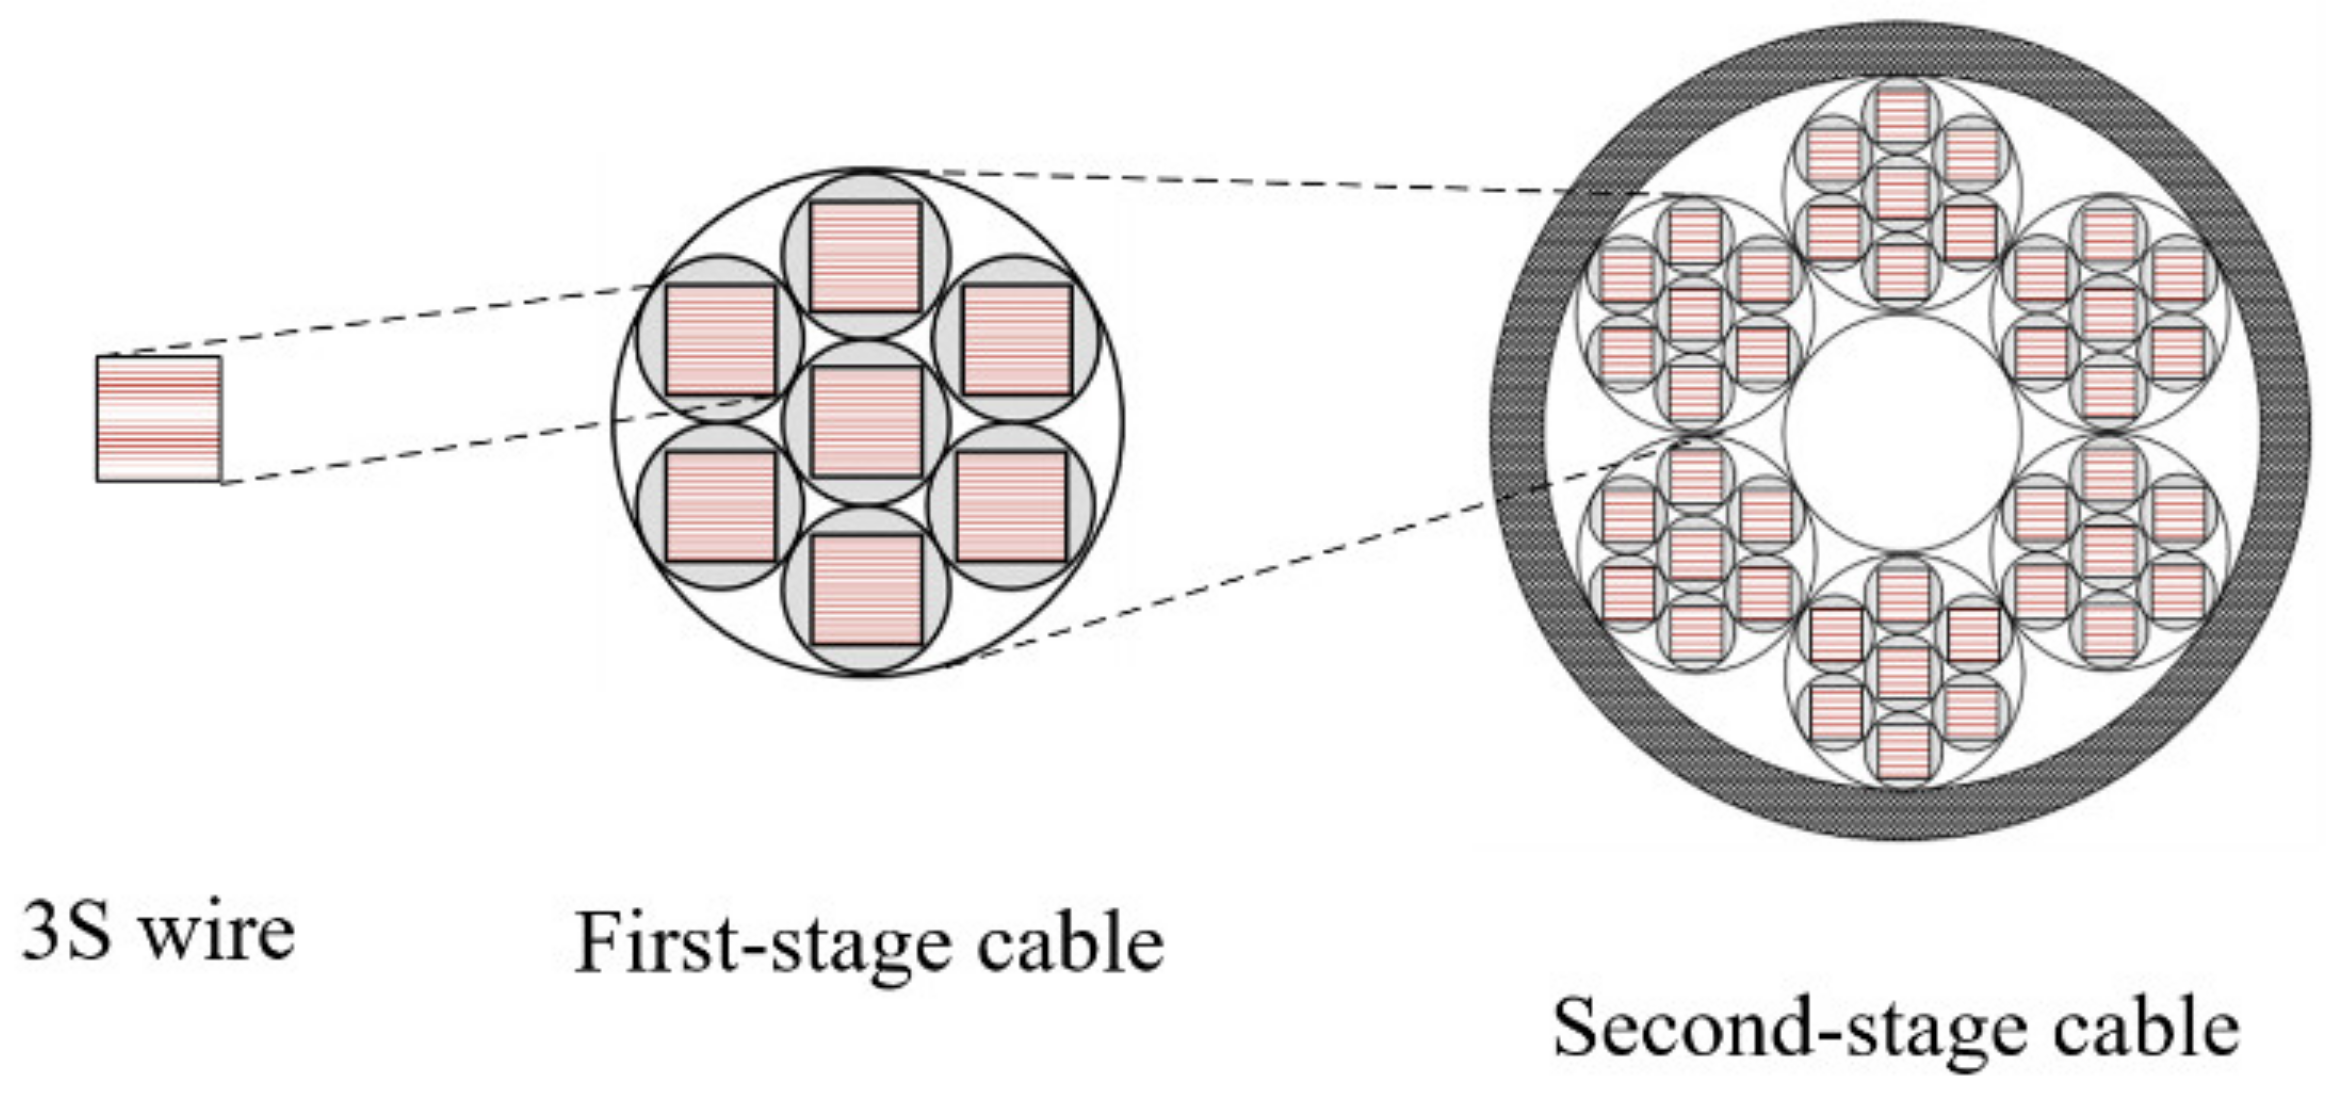
| 3S (2 + 10c)-wire | Width and thickness | 2.09 mm × 1.85 mm |
| Number of HTS tapes | 2 | |
| Number of copper tapes | 10 | |
| Width and thickness of copper tape | 2.00 mm × 150 μm | |
| 2mm-7-cable | Diameter | 9.7 mm |
| Critical current, self-field, average | 300 A @ 77 K | |
| Twist pitch | 100 mm | |
| Number of 3S wires | 7 |
Publisher’s Note: MDPI stays neutral with regard to jurisdictional claims in published maps and institutional affiliations. |
© 2022 by the authors. Licensee MDPI, Basel, Switzerland. This article is an open access article distributed under the terms and conditions of the Creative Commons Attribution (CC BY) license (https://creativecommons.org/licenses/by/4.0/).
Share and Cite
Li, Z.; Zhang, Z.; Wang, M.; Lv, Y.; Ryu, K. AC Loss Characteristics of HTS Novel Twisted Cables Composed of Soldered-Stacked-Square (3S) Wires. Energies 2022, 15, 7454. https://doi.org/10.3390/en15207454
Li Z, Zhang Z, Wang M, Lv Y, Ryu K. AC Loss Characteristics of HTS Novel Twisted Cables Composed of Soldered-Stacked-Square (3S) Wires. Energies. 2022; 15(20):7454. https://doi.org/10.3390/en15207454
Chicago/Turabian StyleLi, Zhuyong, Zhixuan Zhang, Mingshuo Wang, Yingying Lv, and Kyungwoo Ryu. 2022. "AC Loss Characteristics of HTS Novel Twisted Cables Composed of Soldered-Stacked-Square (3S) Wires" Energies 15, no. 20: 7454. https://doi.org/10.3390/en15207454
APA StyleLi, Z., Zhang, Z., Wang, M., Lv, Y., & Ryu, K. (2022). AC Loss Characteristics of HTS Novel Twisted Cables Composed of Soldered-Stacked-Square (3S) Wires. Energies, 15(20), 7454. https://doi.org/10.3390/en15207454