1. Introduction
Access to energy is a prerequisite for the development of countries, both economically and socially. Access to energy is essential [
1] for this development to take place in a sustainable manner. However, this energy must meet certain conditions. First, it must be produced in an environmentally friendly manner without a negative impact on the environment. Secondly, it must be available at the time, place, and the amount that is needed, at a price acceptable to the consumer. A sustainable energy system should be based on renewable energy sources and heat, as well as efficient use of energy, reduction in energy demand, and cogeneration in energy production [
2,
3].
The member states of the European Union have been faced with the need to review their energy systems to ensure that they are compatible with the goals of sustainable development [
4]. This also applies to Poland, for which its energy policy, in line with the policies of the European Union, has had a major impact on shaping the Polish energy mix [
5,
6]. Coal has had the largest share in Poland’s energy mix [
7]. This share was more than 40% in 2020 but is decreasing every year. In 2019–2020 alone, the share of coal in primary energy consumption decreased by nearly 11% [
8]. In addition to energy policy, the decrease in the share of coal has also been influenced by the prices of raw materials directly resulting from the high production costs in Polish mines [
9]. These costs are related to many factors, among others, and they result from difficult operating conditions [
10,
11]. At present, the substitute for Polish fuel is coal from Russia. This obviously has had a negative impact on Poland’s energy security [
12], the sustainable development of the country, and the natural environment. The authors believe that the solution in this case may be the use of Clean Coal Technologies (CCT), such as Carbon Capture and Storage (CCS) and Carbon Capture, Utilisation, and Storage (CCUS). CCTs are technological solutions that allow the level of efficiency to be increased in both the mining process, combustion, and coal processing. The authors are also working on a membrane technique to purify exhaust gases from the coal combustion process [
13]. The proposed solution eliminates disadvantages of other CCT technologies, such as high financial expenditures. It also has the advantage of easy application and use [
14,
15].
The other fossil fuels that make up the energy mix, namely oil and natural gas, do not offer the possibility of ensuring security based on them alone. This, in particular, refers to crude oil, which is imported in almost 100%. Therefore, Poland faces a very serious challenge of ensuring energy security for its citizens based on available and secure sources of energy, while at the same time having to take into account and implement climate change restrictions. This is important not only from a legal point of view, and it is artificially imposed by the Government or the European Union. It is a necessary condition from the point of view of the health of Polish citizens. One has to remember that Poland is the leader in the ranking of the Global Health Observatory published by the World Health Organization (WHO). In 2016, among the 50 most polluted cities in Europe, 33 cities were located in Poland. Currently, the situation has not been better, and the most polluted city in Europe is Orzesze (Silesian Voivodeship) [
16]. The purpose of this paper is to examine the impact of climate policy on the level of demand for domestic hard coal in Poland. Therefore, sustainable development indicators have been analysed, as well as indicators enabling verification of the impact of the power industry on the natural environment and their influence on the level of demand for hard coal in Poland. Factors that may have a significantly greater impact on the level of hard coal sales in Poland and worldwide in the near future were also identified. These factors may cause a change in the character of the development trend of the time series of demand for coal.
2. Materials and Methods
The set of indicators is based on data contained in the Eurostat database [
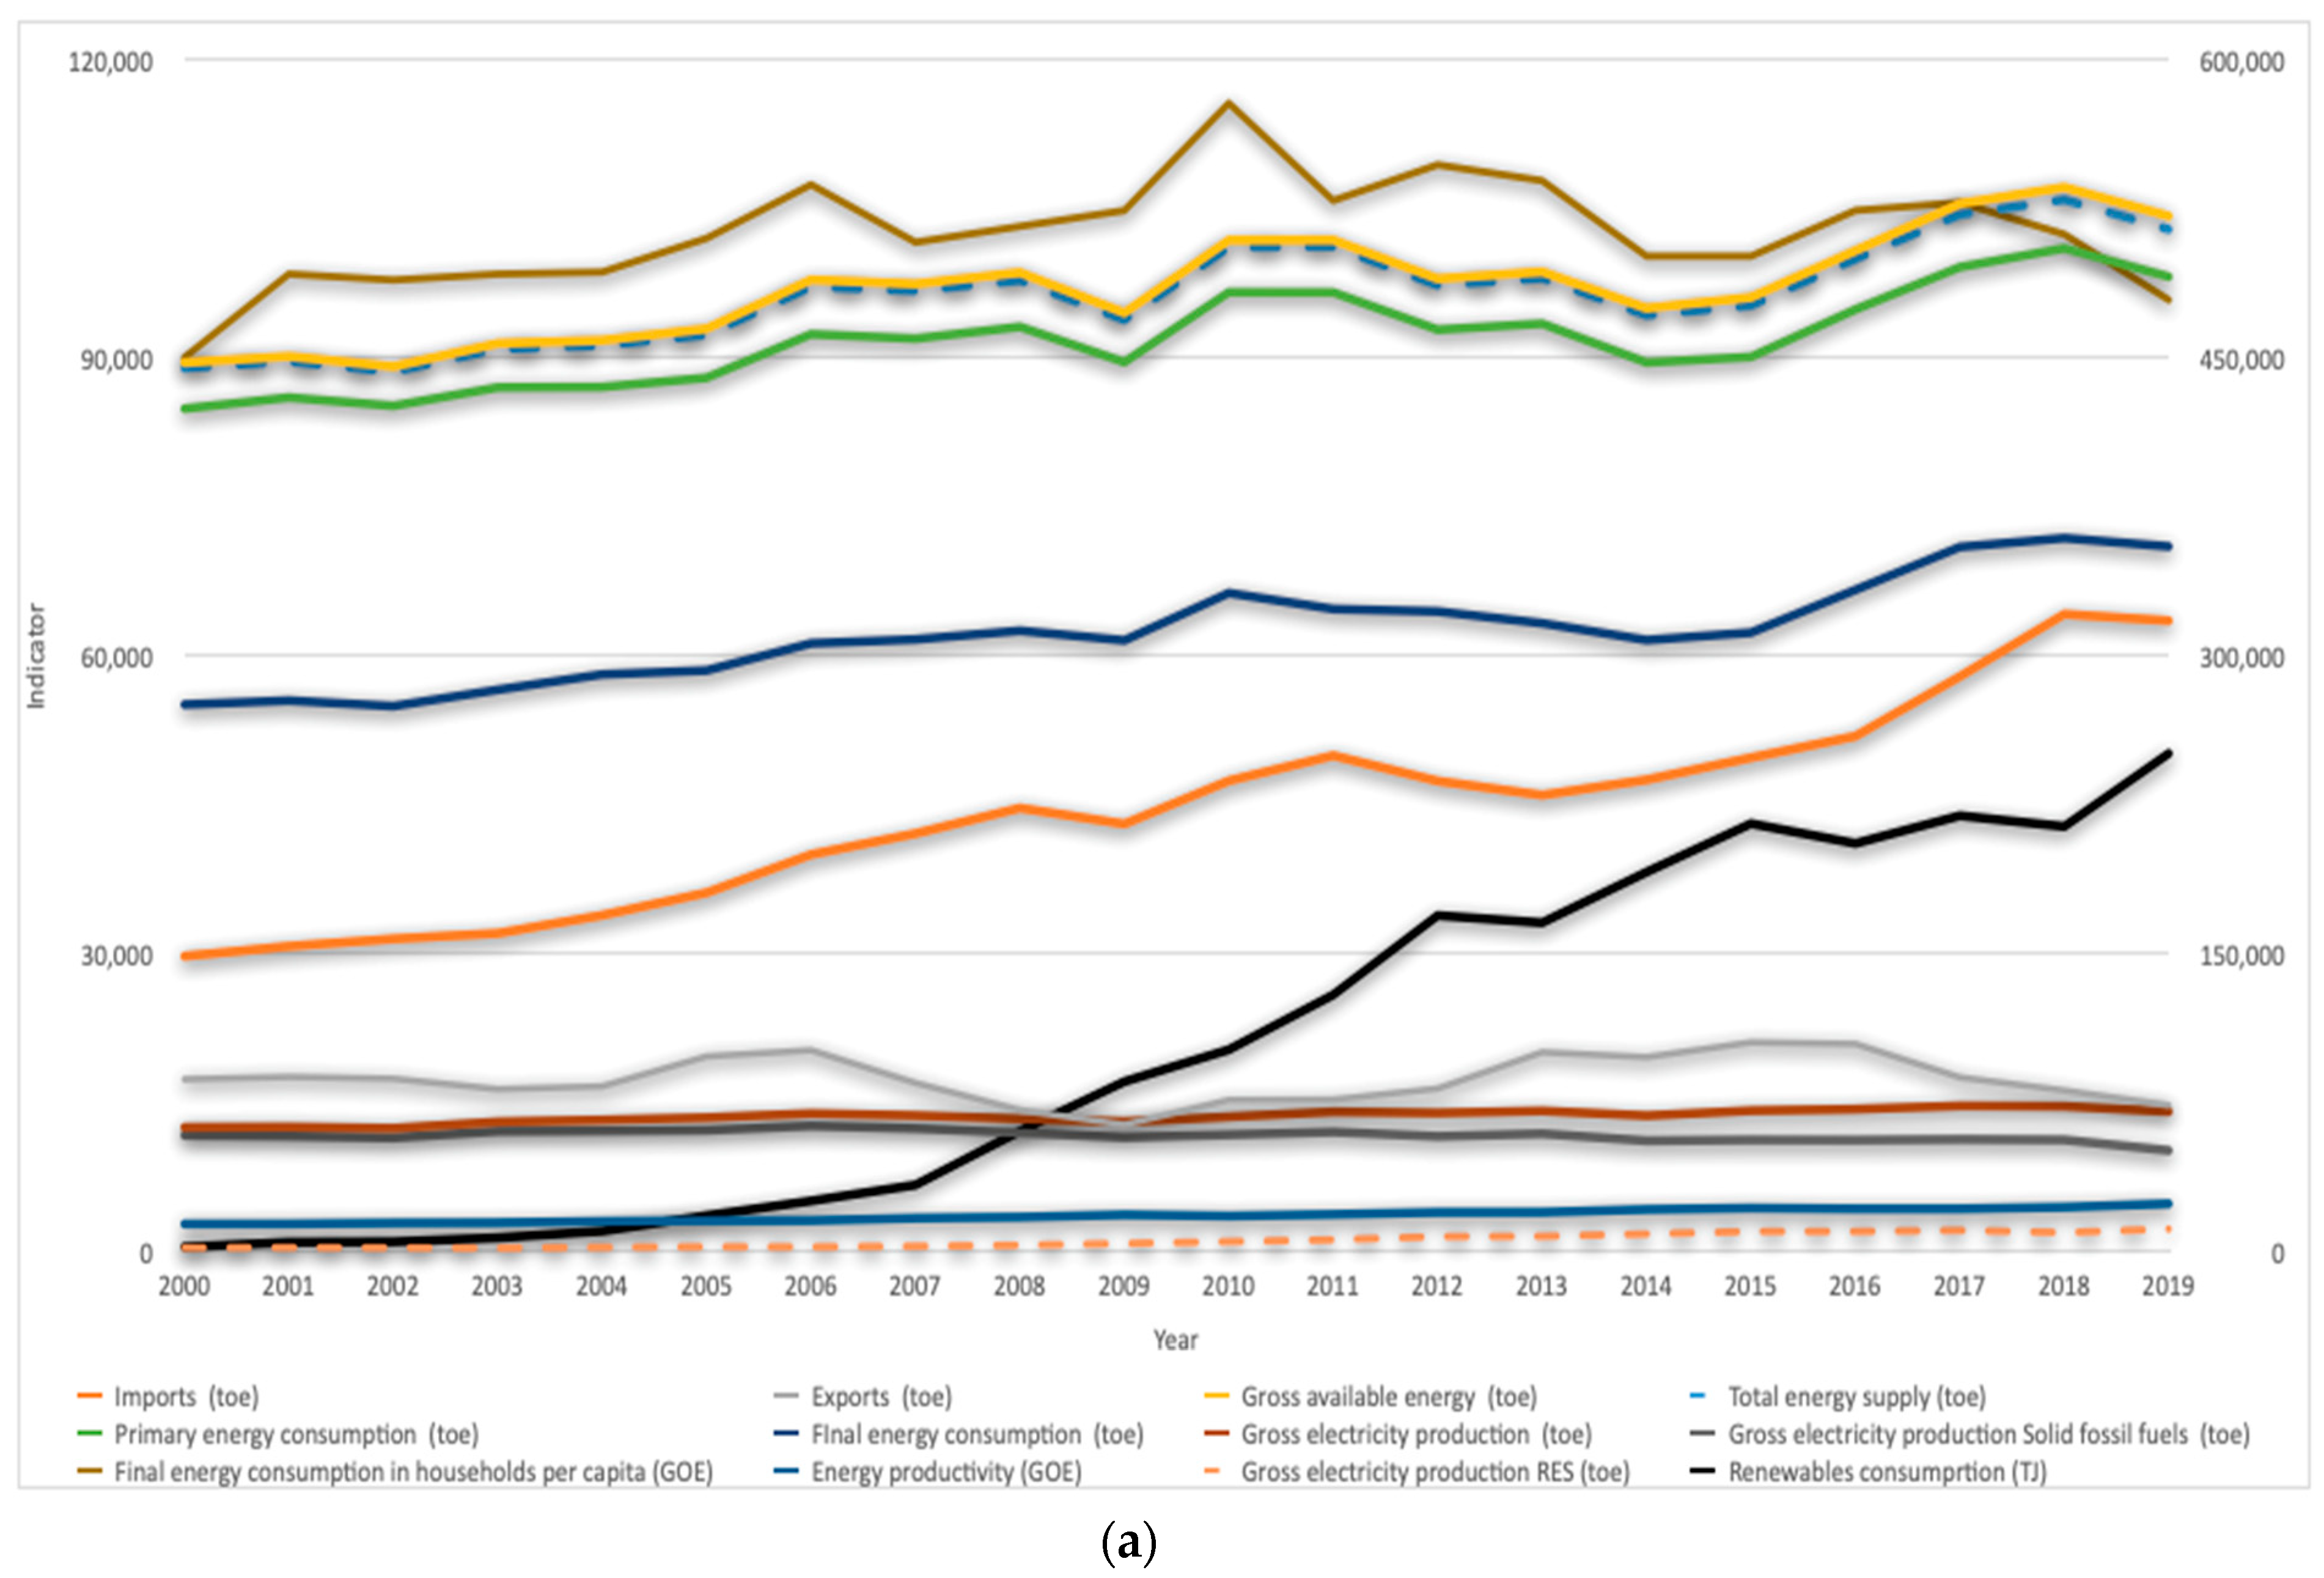
17]. Sets of indicators relating to energy, its impact on the environment, climate change, and sustainable development were adopted for analysis. Thus, figures included in the indicators for Sustainable Development Goal 7, factors from the section on climate change energy, and factors from the section on environment and energy were also used. Some indicators were rejected because they were used repeatedly in several datasets and because data were incomplete. The indicators that were taken into account are presented in
Figure 1. These include the following:
Imports (toe);
Exports (toe);
Gross available energy (toe);
Total energy supply (toe);
Primary energy consumption (toe);
Final energy consumption (toe);
Gross electricity production (toe);
Gross electricity production Solid fossil fuels (toe);
Final energy consumption in households per capita (KGOE);
Energy productivity (KGOE);
Greenhouse gas emissions intensity of energy consumption 2000 = 100;
Gross electricity production RES (toe);
Renewable consumption (Exajoules).
Figure 1b shows the intensity of greenhouse gas emissions of energy consumption 2000 = 100. The indicator was separated due to the percentage values that were not visible in relation to other indicators values. The indicator determines how many tonnes of CO
2 equivalent related to energy production are emitted in a given economy per unit of energy consumed. The year 2000 is the base year, accounting for 100% (2000 = 100).
In 2000–2019, imports of energy carriers in Poland increased by more than 100%. At the same time, exports decreased, mainly due to a reduction in hard coal production. The demand for coal in this period decreased in Poland by about 50%. The total energy supply for all activities in the country increased by 16%. A similar situation refers in this case to the total energy supply, which increased by about 15%.
Electricity production, in turn, increased by 12%. The supply of energy had to increase due to the growing demand from year to year. Final energy consumption increased in the considered period by just under 30% and primary energy by around 15%. However, a change should be observed in the composition of the energy mix. The share of solid fossil fuels in electricity production has decreased by less than 15%. The gap between demand and supply is covered by energy productivity, which has increased by more than 70%, and by renewable energy sources for which its consumption has increased by more than 100 times. The production of electricity from renewable sources has increased six times. There has also been a decrease in greenhouse gas emissions, which have decreased by 15%. The demand for coal has fallen in Poland during the period by around 50%.
The ARMAX model was used to analyse the impact of these factors on coal demand and on forecast demand.
2.1. The ARMAX Model and Its Validation
The ARMAX—Autoregressive Moving Average with Exogenous Input—model is a discrete input–output model used for stochastic processes [
18,
19,
20]. Model parameters are determined by minimising the mean square error.
The model can be characterised by the following equation:
where
y(t)—output signal sequence;
u(t)—input signal sequence;
—prediction coefficients;
n—order of predictor;
e(t)—white noise.
In addition, the model makes it possible to determine the character of the impact of explanatory variables on the explained variable. The following groups of factors can be distinguished here.
Stimulants—an increase in this type of variable has a positive effect on the dependent variable.
Destimulants—an increase in the variable adversely affects the dependent variable.
Nominants—the character of the variable depends on the nominal value [
21].
The ARMAX model consists of an autoregressive component and a moving average. It makes it possible to verify dependencies between a dependent variable and a number of explanatory variables.
The indicators presented above were entered into the ARMAX model as explanatory variables. The explained variable was the volume of hard coal sales.
In order to verify the reliability of the model, information criteria were applied: Akaike (1), Schwarz (2), and Hannnan-Quinn (3). The model with the minimum value of the information criterion should be selected [
22]:
where
—model credibility function corrected by the penalty function—K model parameter function;
n—number of observations.
Depending on the “penalty”, the following models are considered appropriate:
With a big penalty—a sparingly parameterised model should be chosen;
With a small penalty—a model with more parameters might be chosen.
In the choice of the model, there should also be prediction models taken into account [
23]. Since the use of a particular error measure may affect the quality of the model chosen, several indicators are usually used. For this purpose, the following can be used:
Mean Absolute Error (MAE) [
24]:
where
—forecast error.
Root Mean Square Error (RMSE) [
25,
26]:
Mean Absolute Percentage Error (MAPE) [
27,
28]:
where
—value of the explained variable in the t period.
Theil’s Inequality Coefficient [
29]:
where
—forecast of the explanatory variable in the t period.
2.2. ARIMA Model
The ARIMA model was used to forecast hard coal prices in the study [
30,
31]. ARIMA class models are models based on moving average and autoregression. The equation of the ARIMA model can be described as follows:
, —model parameters;
—the value of the forecast variable in the t period;
—the rest of the model in periods t,…t − q;
—the quantity of delay.
3. Results and Discussion
In order to identify indicators influencing the demand for hard coal, they were entered into the ARMAX model. Data for the analysis were obtained from the Industrial Development Agency [
32]. The table presents the parameters of the ARMAX (0,1,1) model. This is a moving average model. The time series was subjected to one-time differentiation in order to bring it to a stationary form. Out of dozens of models created, the model which had the lowest value of ex post errors and the lowest value of information criteria such as Hannan Qiunn Criterion (HQC), Akaike Criterion (AIC), and Bayesian Schwarz Criterion (BIC) was selected. The values of the information criterion indices and model errors are included in
Table 1.
Table 2 contains only the explanatory variables that were finally used to build the model. The variables were verified for statistical significance. Finally, out of a set of fourteen indicators, five were used. The remaining ones were not considered significant. This has been indicated by asterisks in the column “probability”. Additionally, the character of the explanatory variables was also determined. Where the value of a model parameter is positive, the variable should be considered as a stimulant. On the other hand, a negative value of the parameter means a destimulant. The indicators for which their growth will cause an increase in hard coal sales are Gross Available Energy, Gross electricity production, and Final energy consumption if households per capita are connected with the indicators above. On the other hand, indicators for which their increase will cause a decrease in the level of coal sales are energy imports and total energy supply.
When deciding whether a variable is statistically significant, attention should be paid to the value of the Student’s t-test statistic and the level of p. If , the null hypothesis of non-significance of the variable should be rejected, and the alternative hypothesis of significance of the variable should be accepted instead. If there is no reason to reject the null hypothesis of non-significance.
Since two similar indicators were indicated as statistically significant during the analysis (gross available energy and total energy supply), of which one was a stimulant and the other a destimulant, sensitivity analysis of the model was carried out in two variants:
Total energy supply is the main explanatory variable. On the other hand, entering the gross available energy into the model is optional and has no impact on the explanatory context.
Building an accurate and reliable forecast is the basis for effective planning of coal production tailored to fuel demand. It provides access to information on the necessary level of future production. The level of production factors required can, therefore, be planned in advance. This makes it possible to optimise employment, production capacity, and reduce production costs. The results of the forecast, as well as empirical data on the volume of hard coal sales in Poland, are presented in
Figure 2. The forecast indicates that if the trend of indicators that influence the level of demand for coal does not change, demand will fall. The forecast was made up to 2022. In this time horizon, compared to the last known observation, the sales volume will decrease by approximately 9%.
However, at present, this situation may change due to the growing demand for coal in the world markets. The opportunity for Polish coal companies may be provided mainly by the sale of fuel for export.
Price and Sales of Hard Coal
The decreasing demand for coal in Poland is in line with the policy of the country and also of the European Union. Additionally, high prices of domestic raw materials resulted in fuel being noncompetitive on foreign markets and even on the domestic market.
Ongoing restructuring of the mining industry resulted in a huge reduction in output and employment in the hard coal mining sector. This resulted in a situation where Poland became an importer of coal. However, since May 2020, coal prices on global markets have been steadily rising (
Figure 3). In October 2021, fuel reached a record price of USD 280/Mg. This development was affected primarily by the recovery of economies and industrial production after the lockdown caused by the SARS-CoV-2 pandemic. Additionally, coal prices increased due to fuel shortages, especially in China, where it is the basis of the energy system. This may represent an opportunity for Polish coal companies.
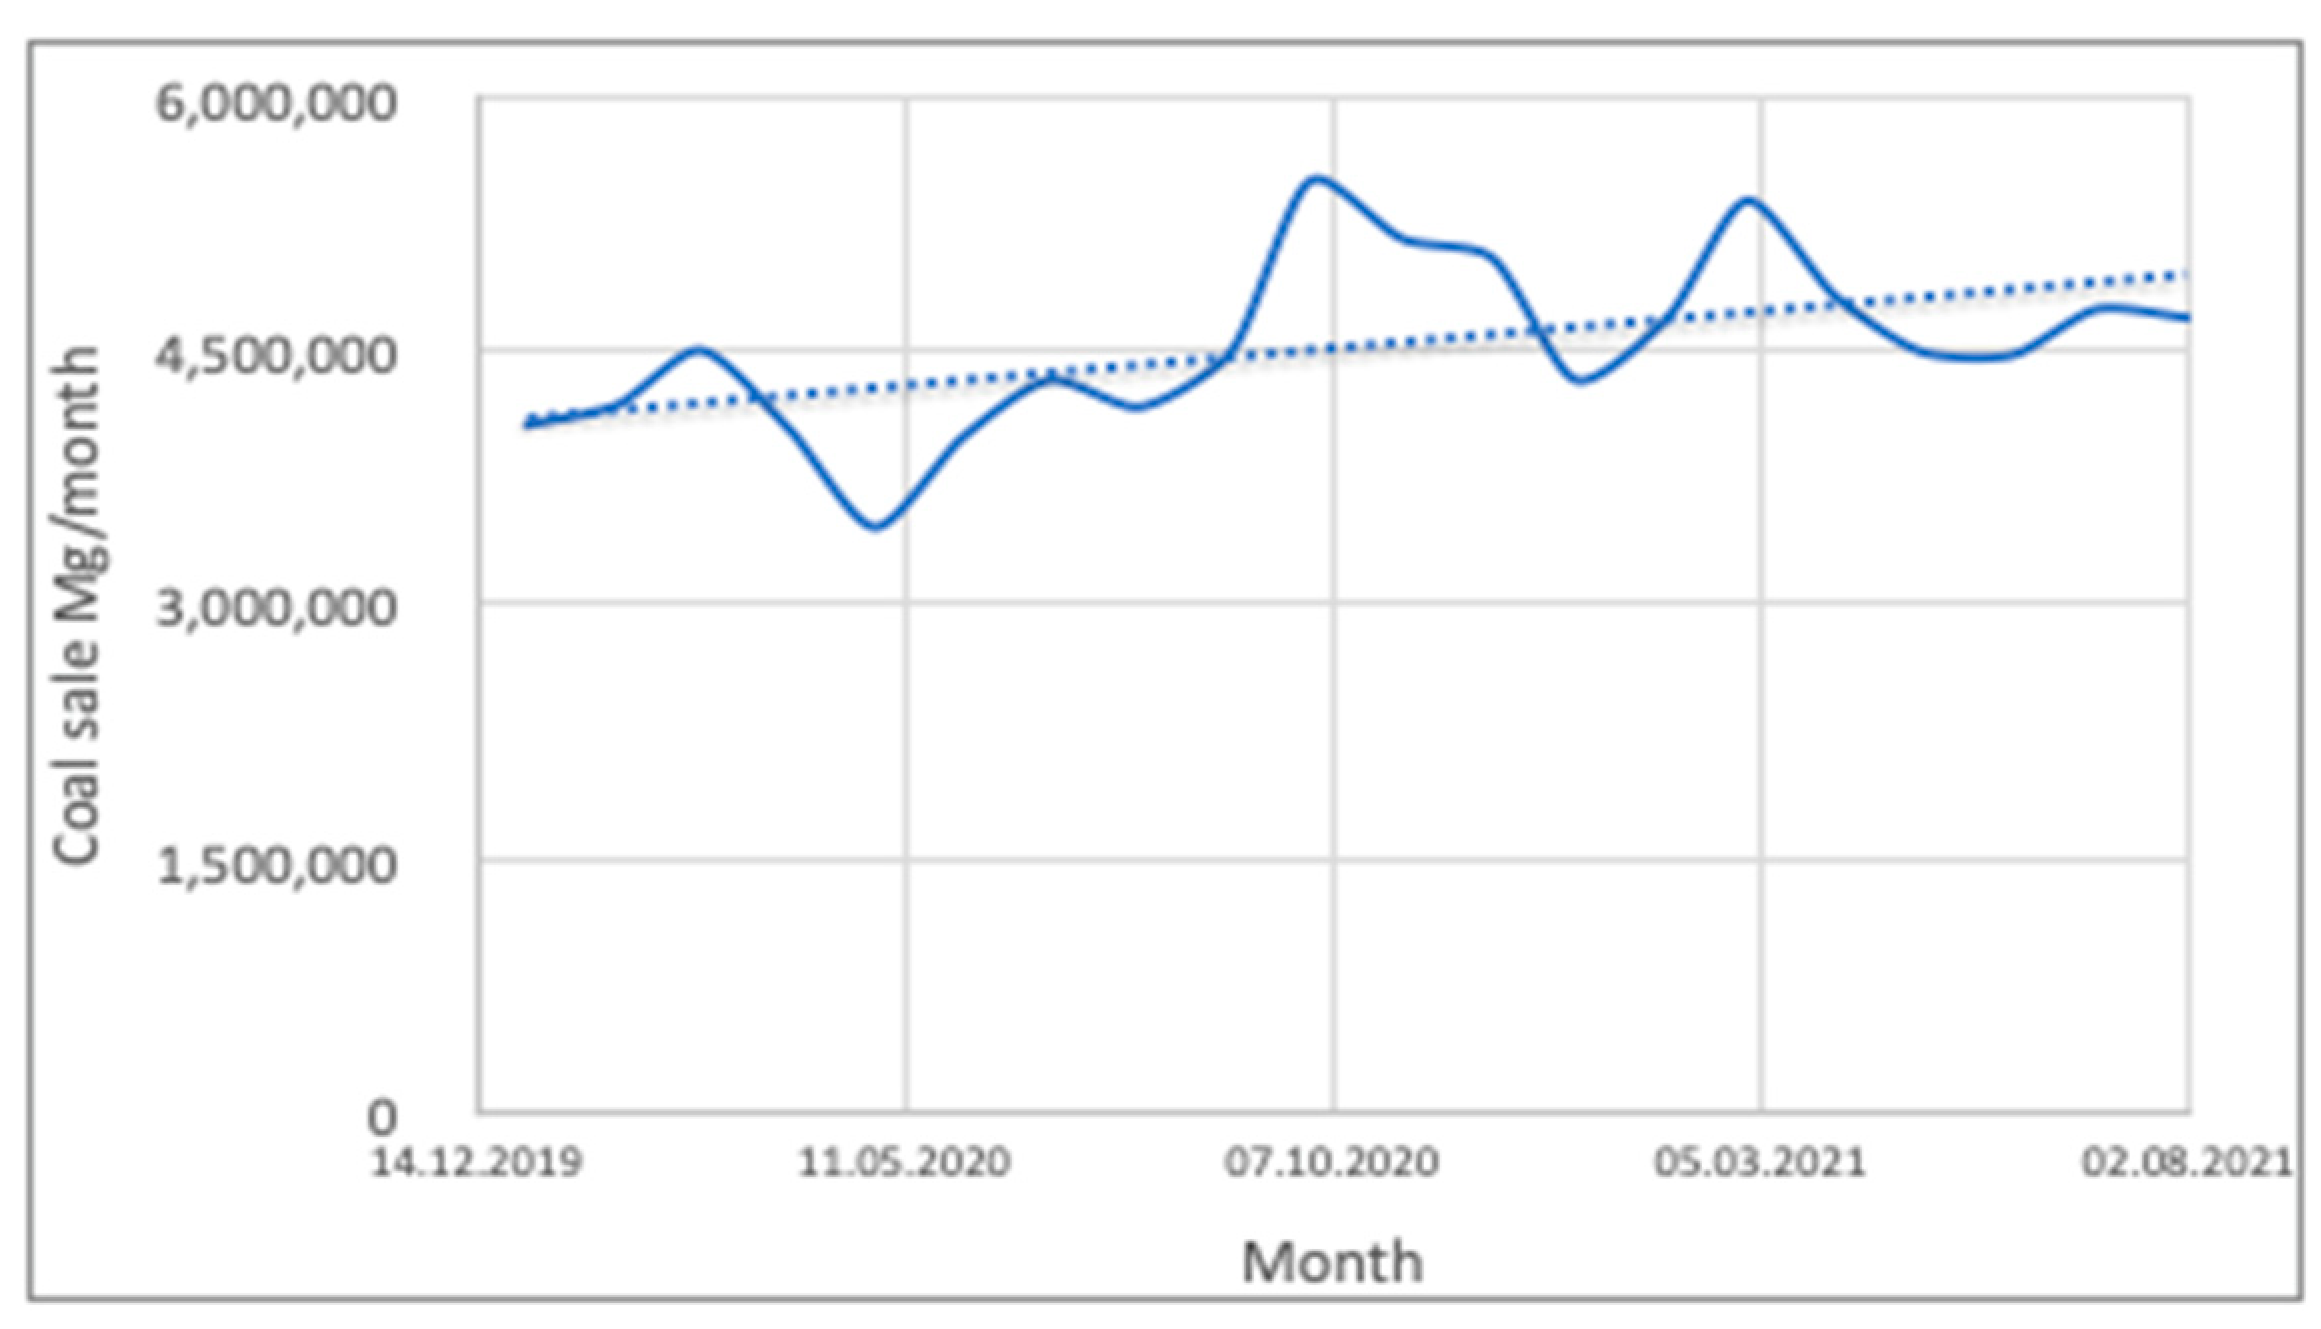
The Polish coal market, on the other hand, is significantly lagged and does not react dynamically to changes in fuel prices on foreign markets. This is caused by long-term fuel contracts concluded by coal companies with their strategic customers. Therefore, the demand for domestic coal is growing mainly due to domestic power plants and heating plants, which purchase Polish fuel before winter at currently favourable prices (
Figure 4).
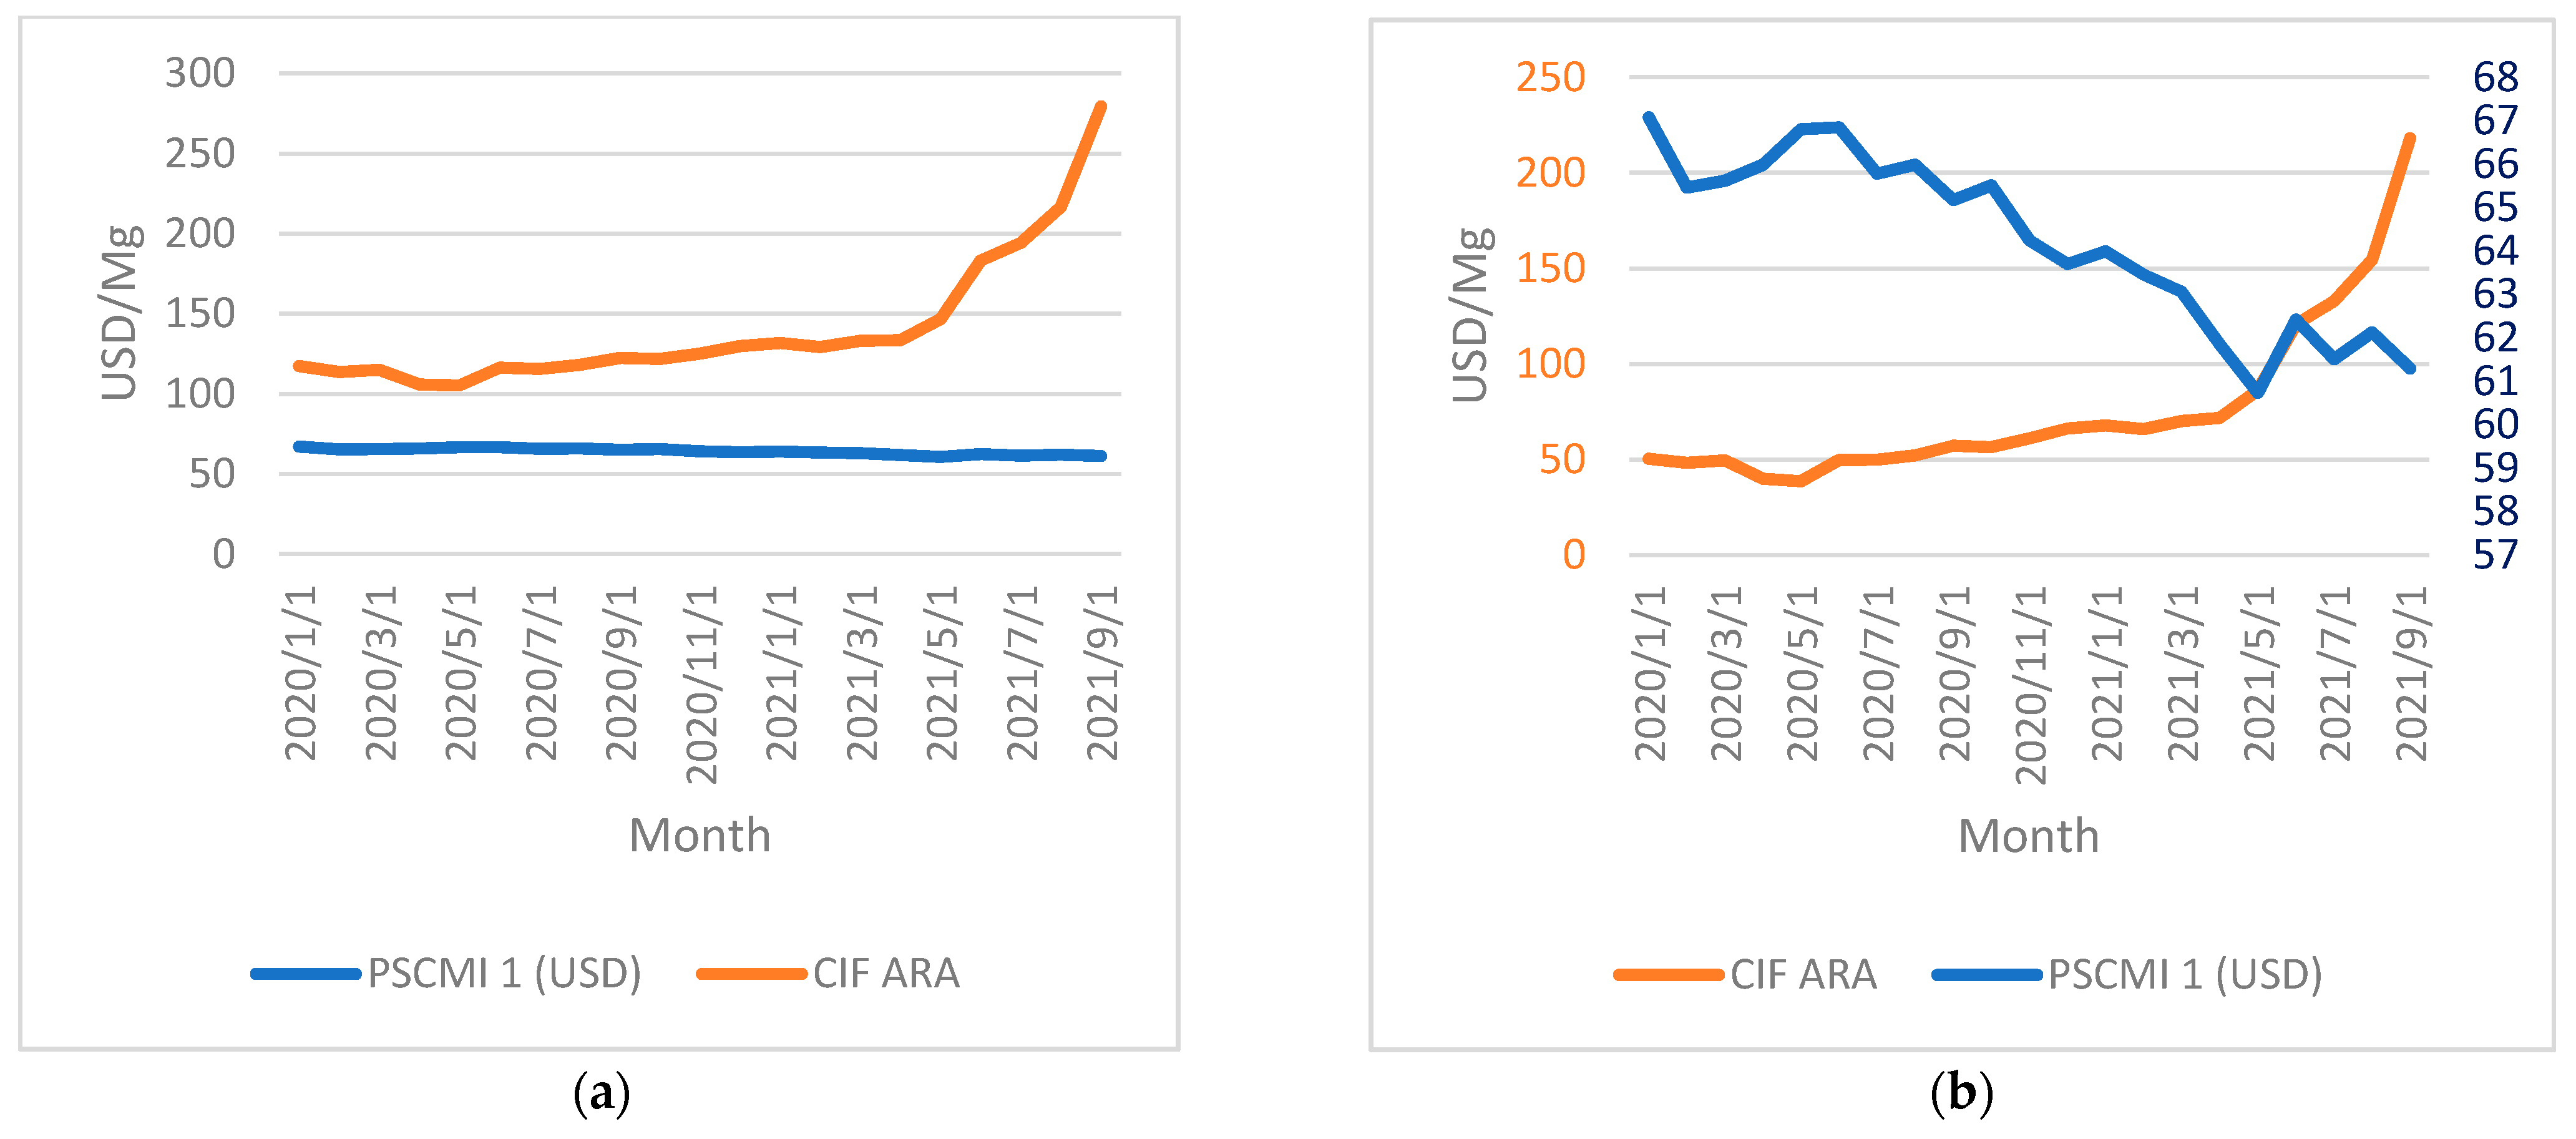
Figure 5 presents a comparison of the CIF ARA coal prices and the Polish PSCMI 1 index. The Polish Steam Coal Market Index (PSCMI 1) is a price index for benchmark steam coal mined by domestic producers and sold on the domestic energy market. The index is based on monthly data and expresses the price of hard coal sales in terms of quality optimized for the needs of customers [
34,
35].
The data presented cover the period January 2020–October 2021. Therefore, the PSCMI 1 index has not reacted to a change in the time series trend of coal prices (
Figure 5a). In order to clearly define the trend shaping the PSCMI 1 index in
Figure 5b, an auxiliary axis was used for this index. This tendency is not visible in
Figure 5a due to high values of CIF ARA prices. PSCMI 1 is falling due to its inflexibility. This, in turn, is caused by long-term contracts, in which prices are usually shaped in advance for the entire year. The lack of flexibility of the PSCMI 1 index on which the price formulas used in long-term contracts are based, on the one hand, allows fuel to be supplied to customers at a favourable price. On the other hand, it poses a threat to the profitability of coal companies. Rising energy and material prices (accounting for approximately 20% of total costs) translate into higher fuel production costs, but company revenue remains at the same level.
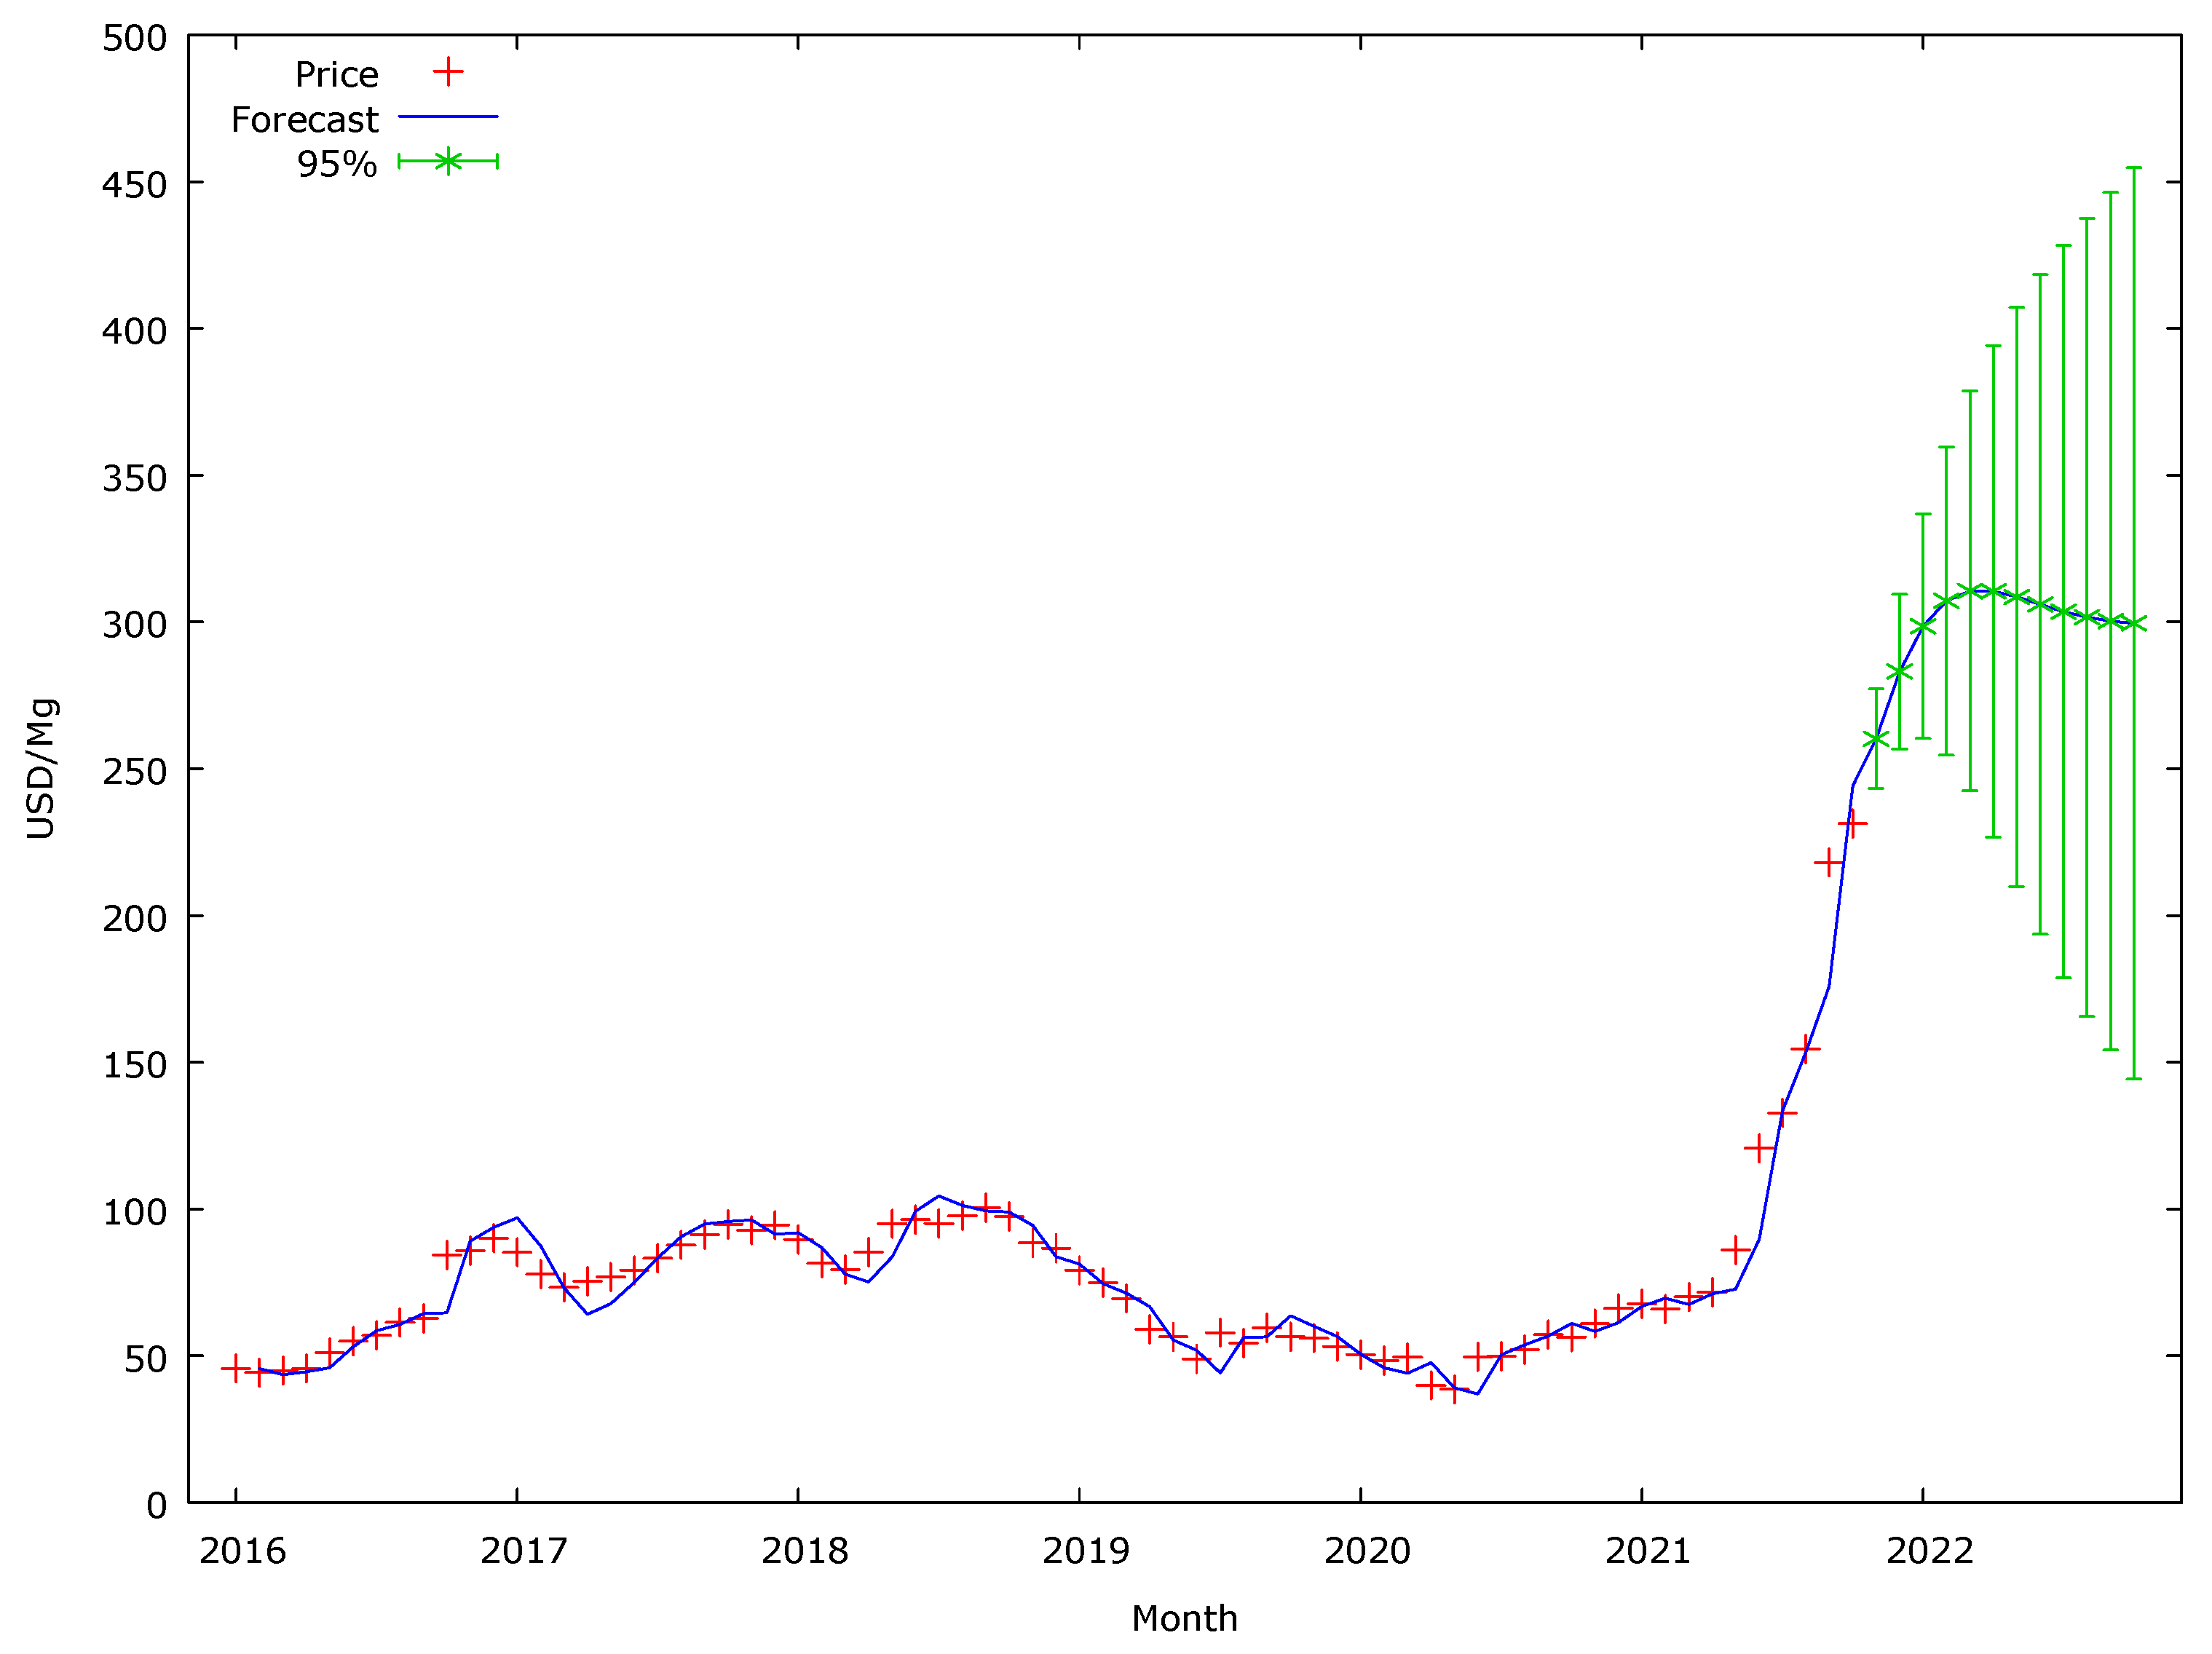
As the prices of other fossil fuels, namely oil and natural gas, have also been on the rise, coal has once again become an attractive alternative for many European power and heating plants. This, in turn, translated into a doubling of Russian coal prices in the last six months. It should be mentioned that it was Russian coal that competed with Polish coal on the domestic market, which was caused by the lower price of imported fuel. Therefore, the authors made a forecast of hard coal prices for the next 12 months. This made it possible to verify the level of coal prices in the near future, as well as to optimally plan the sources of fuel acquisition. The ARIMA model (2,1,2) was used to build the forecast.
The information criteria and model errors are presented in
Table 4. MAPE error is 6.5%, which means that the model might be considered reliable.
The forecast presented in
Figure 6 indicates that, over the next few months, the upward trend in coal prices will continue and then stabilise. The forecast was made to present the development trend of the analysed phenomenon. The confidence interval of the forecast widens (and this is a natural phenomenon) because the forecast was made for 12 months, and 12 steps forward is a distant time horizon. Therefore,
Figure 6 also presents the confidence interval (95%). It represents the range in which the price of coal may move. It can be applied in the case of scenario planning, which would be appropriate for forecasts used by coal companies.
Therefore, it would be beneficial for Polish mines to flexibly adjust their production levels to changes in fuel demand, as well as to make the system for setting fuel prices on the domestic market more flexible.
4. Conclusions
The article examines the impact of factors that will determine the future of hard coal in the energy mix of Poland. The conducted analysis and used models indicate that demand for this fossil fuel in Poland will be decreasing in the nearest future. It is obviously connected with the climate policy in Poland. However, it should be remembered that Polish fuel on the market has been replaced with imported coal, mainly from Russia. This makes Poland increasingly dependent in energy terms on a country that is not part of the European Union and is politically unstable. It should be remembered that most of the imported natural gas and crude oil used in Poland comes from the same source. Should the situation on the fuel market change, the abandonment of domestic fuel in favour of imported fuel will also generate additional problems. Rising coal prices from Russia have made consumers turn back to Polish fuel, which is, firstly, competitively priced and, secondly, available. This was possible due to coal reserves. However, further reductions in the capacity of mines in the future may result in an energy crisis—a shortage of fuel or the need to purchase it at high prices. It should be noted that, in times of economic prosperity for coal, coal companies can supply fuel to foreign customers, which will eliminate problems associated with its combustion in Poland. It should, however, be underlined that Poland, as a country which has significant deposits of hard coal and lignite and for which its energy system is based on coal, should concentrate its activities and investments on developing technology that would enable coal to be burned in an efficient, economical, and, most importantly, environmentally friendly manner. It is not the fuel that is the problem, but the imperfections of its combustion process. It is important to allocate funds obtained during the economic boom to investment. This will make it possible to modernise and properly plan the production process, thereby reducing extraction costs. This, in turn, will make it possible to achieve a profit in periods of economic downturn, which, due to the cyclical nature of this phenomenon, will certainly come. The said solutions are particularly important in terms of energy security, which is the basis for the stable economic development of the country. The energy sector is a strategic area determining the development and stability of the country, which should be modernised and developed because it will determine the further development of the Polish economy, as well as society.
Author Contributions
Conceptualization, A.R.; formal analysis, A.R.; methodology, A.R.; software A.R. and E.W.; writing—original draft preparation, A.R. and E.W.; supervision, A.R.; investigation, A.R. and E.W.; validation, A.R.; visualization, A.R. and E.W.; funding acquisition, E.W. All authors have read and agreed to the published version of the manuscript.
Funding
The work was elaborated in the frames of the statutory research 06/030/BK_22/0066.
Institutional Review Board Statement
Not applicable.
Informed Consent Statement
Not applicable.
Data Availability Statement
The data presented in this study are available on request from the corresponding author. The data are not publicly available due to the extremely large size.
Acknowledgments
This work was supported by the Faculty of Mining, Safety Engineering and Industrial Automation of the Silesian University of Technology, Gliwice, Poland.
Conflicts of Interest
The authors declare no conflict of interest. The funder had no role in the design of the study; in the collection, analyses, or interpretation of data; in the writing of the manuscript; or in the decision to publish the results.
References
- Barbier, E.B.; Burgess, J.C. The sustainable development goals and the systems approach to sustainability. Economics 2017, 11, 1–23. [Google Scholar] [CrossRef] [Green Version]
- Mitchell, C. The Political Economy of Sustainable Energy; Palgrave Macmillan: London, UK, 2008. [Google Scholar] [CrossRef] [Green Version]
- Graczyk, A. Wskaźniki zrównoważonego rozwoju energetyki. Optimum. Studia Ekon. 2017, 4, 53–68. [Google Scholar] [CrossRef] [Green Version]
- The European Green Deal COM/2019/640. Communication from the Commission to the European Parliament, the European Council, the Council, the European Economic and Social Committee and the Committee of the Regions. Available online: https://eur-lex.europa.eu/legal-content/EN/TXT/uriCOM3A20193A6403AFIN(COM(2019)640 (accessed on 10 November 2021).
- Energy Policy for Poland by 2040. Development Strategy for the Fuel and Energy Sector (PEP2040). Ministry of State Assets. Available online: https://www.gov.pl/web/aktywa-panstwowe/zaktualizowany-projekt-polityki-energetycznej-polski-do2040-r (accessed on 10 November 2021).
- The Council of Ministers. Poland’s Energy Policy until 2030. 10 November 2009. Available online: https://www.google.com/ search?client=firefox b&q=Poland%27s+energy+policy+until+2030.+November+10%2C+2009.+The+Council+of+Ministers (accessed on 24 October 2020).
- Rybak, A.; Manowska, A. The future of crude oil and hard coal in the aspect of Poland’s energy security. Polityka Energetyczna—Energy Policy J. 2018, 21, 141–154. [Google Scholar] [CrossRef]
- British Petroleum. Statistical Review of World Energy. 2021. Available online: https://www.bp.com/en/global/corporate/energy-economics/statistical-review-of-world-energy.html (accessed on 10 November 2021).
- Fałtyn, M.; Naczyński, D. The factors shaping the demand, supply, and prices on the hard coal market. Modelling of possible changes in the long-term horizon. Polityka Energetyczna—Energy Policy J. 2018, 21, 47–68. [Google Scholar] [CrossRef]
- Li, X.; Cao, Z.; Xu, Y. Characteristics and trends of coal mine safety development. Energy Sources Part A Recover. Util. Environ. Eff. 2020, 1–19. [Google Scholar] [CrossRef]
- Li, X.L.; Chen, S.J.; Zhang, Q.M.; Gao, X.; Feng, F. Research on theory, simulation and measurement of stress be-havior under regenerated roof condition. Geomech. Eng. 2021, 26, 49–61. [Google Scholar] [CrossRef]
- Rybak, A. Rola i Przyszłość Węgla w Zapewnieniu Bezpieczeństwa Energetycznego Polski, Monografia nr 865; Wydawnictwo Politechniki Śląskiej: Gliwice, Poland, 2020. [Google Scholar]
- Rybak, A.; Rybak, A.; Sysel, P. Modeling of Gas Permeation through Mixed-Matrix Membranes Using Novel Computer Application MOT. Appl. Sci. 2018, 8, 1166. [Google Scholar] [CrossRef] [Green Version]
- Minko, E.; Sysel, P.; Hauf, M.; Brus, J.; Kobera, L. Synthesis and properties of hyperbranched polyimides combined with silica. Macromol. Symp. 2010, 295, 88–93. [Google Scholar] [CrossRef]
- Fang, J.; Kita, A.H.; Okamoto, K.-I. Hyperbranched Polyimides for Gas Separation Applications. 1. Synthesis and Characterization. Macromolecules 2000, 33, 4639–4646. [Google Scholar] [CrossRef]
- World Health Organization Database. Available online: https://www.who.int/ (accessed on 5 November 2021).
- Eurostat. Database 2019. Available online: https://ec.europa.eu/eurostat/data/database (accessed on 7 October 2021).
- Hickey, E.; Loomis, D.G.; Mohammadi, H. Forecasting hourly electricity prices using ARMAX–GARCH models: An applica-tion to MISO hubs. Energy Econ. 2012, 34, 307–315. [Google Scholar] [CrossRef]
- Lim, C.; McAleer, M.; Min, J.C. ARMAX modelling of international tourism demand. Math. Comput. Simul. 2009, 79, 2879–2888. [Google Scholar] [CrossRef] [PubMed]
- Darbellay, G.A.; Slama, M. Forecasting the short-term demand for electricity: Do neural networks stand a better chance? Int. J. Forecast. 2000, 16, 71–83. [Google Scholar] [CrossRef]
- Schader, M.; Gaul, W.A.; Vichi, M. Between Data Science and Applied Data Analysis. In Proceedings of the 26th Annual Conference of the Gesellschaft für Klassifikation, Mannheim, Germany, 22–24 July 2002. [Google Scholar]
- Piłatowska, M. Kryteria informacyjne w wyborze modelu ekonometrycznego. Studia Prace Uniw. Ekon. Krakowie 2010, 210, 25–37. [Google Scholar]
- Willmott, C.J.; Matsuura, K. Advantages of the Mean Absolute Error (MAE) over the Root Mean Square Error (RMSE) in As-sessing Average Model Performance. Clim. Res. 2005, 30, 79–82. [Google Scholar] [CrossRef]
- Chai, T.; Draxler, R.R. Root mean square error (RMSE) or mean absolute error (MAE)?—Arguments against avoiding RMSE in the literature. Geosci. Model Dev. 2014, 7, 1247–1250. [Google Scholar] [CrossRef] [Green Version]
- Almorox, J.; Benito, M.; Hontoria, C. Estimation of monthly Angström–Prescott equation coefficients from measured daily data in Toledo, Spain. Renew. Energy 2005, 30, 931–936. [Google Scholar] [CrossRef]
- Safi, S.; Zeroual, A.; Hassani, M. Prediction of global daily solar radiation using higher order statistics. Renew. Energy 2002, 27, 647–666. [Google Scholar] [CrossRef]
- Bliemel, F. Theil’s Forecast Accuracy Coefficient: A Clarification. J. Mark. Res. 1973, 10, 444. [Google Scholar] [CrossRef]
- Farnum, N.R.; Stanton, W. Quantitative Forecasting Methods; PWS-Kent Publishing Company: Boston, MA, USA, 1989. [Google Scholar]
- Kufel, T. Ekonometria. Rozwiązywanie Problemów z Wykorzystaniem Programu Gretl; PWN Warszawa: Warszawa, Poland, 2004. [Google Scholar]
- Kot, S.; Jakubowski, J.; Sokołowski, A. Statystyka; Difin Warszawa: Warszawa, Poland, 2007. [Google Scholar]
- MarketWatch. Available online: https://www.marketwatch.com/investing/future/mtfc00/download-data?startDate=1/1/2019&endDate=11/05/2021 (accessed on 5 September 2021).
- Polski Rynek Węgla. Available online: https://polskirynekwegla.pl/raport-dynamiczny/sprzedaz-wegla-kamiennego-ogolem-miesiace (accessed on 7 October 2021).
- Investing Coal Prices Database. Available online: https://pl.investing.com/commodities/coal-(api2)-cif-ara-futures-historical-data (accessed on 5 January 2021).
- Paszcza, H.; Olejniczak, M. Węglowy Indeks Cenowy: Metodologia, Rola, Wykorzystanie, Korzyści, Rynkowe Obowiązki Informacyjne. In Proceedings of the Materiały XXVIII Konferencji z cyklu Zagadnienia Surowców Energetycznych i Energii w Gospodarce Krajowej, Zakopane, Poland, 12–15 October 2014. [Google Scholar]
- Polski Rynek Węgla. Available online: https://polskirynekwegla.pl/o-indeksie (accessed on 8 October 2021).
| Publisher’s Note: MDPI stays neutral with regard to jurisdictional claims in published maps and institutional affiliations. |
© 2022 by the authors. Licensee MDPI, Basel, Switzerland. This article is an open access article distributed under the terms and conditions of the Creative Commons Attribution (CC BY) license (https://creativecommons.org/licenses/by/4.0/).


