Abstract
The increase in the share of renewable energy in the power generation mix plays a pivotal role in the decarbonisation of power systems, thus facilitating the achievement of international and national targets for reducing greenhouse gas emissions and addressing climate change. Due to the intermittent nature of variable renewable energy, the integration of these sources in power systems requires investments in additional solutions and setting strategies to ensure grid stability and reliability. For that purpose, a prospective modelling was applied to the relatively isolated island named Procida, located in the gulf of Naples in Italy, through the bottom-up optimization model TIMES-Procida for a long-term energy plan where technical solutions, i.e., deployment of photovoltaics on rooftops and storage, and policy scenarios, i.e., energy efficiency, were used to analyse the evolution of the energy system. The introduction of renewable energy could be much more relevant when dealing with islands; they appear as decisive territories for experimentation and analysis of the transformation of all power systems. At year 2050, our results address decarbonisation and energy autonomy. They show that only with high shares of renewable energy will the territory see a noticeable decarbonisation of its economic sectors (up to 24%) and a decreasing dependency on imports (−16.6% compared to low renewable integration). By comparing the results of scenarios including or lacking storage solutions, we showcased how this reflected on the investments in PV and on grid congestion relief.
1. Introduction
Climate change mitigation measures include the reduction of greenhouse gas emissions [1], which translates into the decarbonisation of energy systems. The increase in the share of renewable energy sources in the production mix appears to be a valid solution. First and foremost, these technologies can ensure energy production at low (or null) carbon emissions. Second, in terms of electric power generation, they represent fast-paced growing resources and finally, in many cases, have already become cost-competitive with fossil-fuel-based generation [2]. The European Commission offers a favourable framework for the development of renewable energy through the policy support of the European Green Deal (EGD) which aims to achieve a 55% reduction in greenhouse gas emissions by 2030 with respect to 1990. In this context, the Renewable Energy Directive 2018/2001 was amended by increasing the renewable energy target for 2030 to 40% [3] and possibly to 45% with the latest proposals of the REPowerEU plan with the EU Solar Strategy to double existing solar photovoltaic capacity by 2025 and achieve capacity of 600 GW by 2030 [4]. This last proposal underlines the role of renewables in reducing dependency on imports while being the “cheapest and cleanest energy available”. Moreover, the NextGenerationEU plan in response to the COVID−19 pandemic reaffirms the role of using renewable energy for energy security. However, the introduction of renewable technologies comes with important challenges, especially when dealing with electricity supply. In fact, the electric grid should assure at all times a balance between production and demand. Meanwhile, the electricity generated from some of the most commonly used renewable sources, namely solar photovoltaics (PV) and wind turbines, is dependent on external parameters such as weather conditions, and thus is strongly variable. Therefore, as the share of variable renewable energy (VRE) sources increases, the necessity to ensure a reliable power system for the satisfaction of electricity demand becomes more crucial, especially with the stochastic nature of VREs, which explains the growing need for power system flexibility.
Power system flexibility does not have one specific definition [5], but rather concerns many aspects of the system: the ability to maintain the system’s stability, managing the variability and uncertainty of renewable energy, deal with the operation of the energy system with instantaneous stability and long-term security of supply, and ensure the balance between supply and demand [6,7,8].
Introducing renewable energy on islands could provide numerous opportunities on these territories, which are often characterised by an over-dependency on energy imports [9]. This is mainly due to the additional geographical constraints presented by these territories, which imply a limited or non-existent mainland grid connection, limited space availability for power production installations, and/or a lack of access to road infrastructure. Hence, islands would naturally consider investing in sustainable energy solutions such as developing domestic renewable energy within their territory. These actions would fit in a long-term strategy to ensure their autonomy and enhance their resilience, hence going beyond the achievement of the decarbonisation goal, however inexorably accelerated by the exploitation of renewable energy on these territories. Moreover, energy autonomy of islands—defined as the ability of the energy system to function fully without the need for external support such as imports [10]—has been linked to the potential of reducing the cost of energy and the ability to significantly reduce the carbon emissions associated with a community or region [10,11].
Nonetheless, the transition to systems that solely rely on exploitation of renewable energy requires additional investments. In fact, this transition often depends on the coupling of renewable energy technologies with storage technologies, demand-side management, and development of smart microgrids [12] found in [13,14]. This relates back to dealing with the flexibility of the power system. Supply- and demand-side flexibility measures to enhance the flexibility of the traditional energy system can be present on the policy level, on the demand side by adapting the operation methods and the power production mix, and on technological level with the inclusion of storage, load management and flexible generation systems. As the variability of VREs occurs at different timescales (seconds to years), different flexibility requirements should be addressed to ensure the reliability of supply. This would be done with the introduction of adequate solutions to the energy system ([12] based on [8]).
The impact of these solutions can be studied according to their use in the system. To be more explicit, we consider the case of electricity storage technologies. They refer to technologies that store electrical energy and release it on demand when it is most needed through the conversion of electricity to other forms of energy and back again ([12] based on [15]). Given their valuable potential contribution to grid management, these technologies are considered a prominent solution to integrate large amounts of VREs into power systems. The electricity storage can be installed at any level of the energy system: at the transmission or distribution grid, coupled with other generation facilities or used in behind-the-meter applications (i.e., used by final consumers). According to its location and operational mode, the regulatory framework and the market, it can provide several different services to the grid [15]. For example, if used at transmission or distribution level, it can provide grid services (such as ancillary services or distribution network support), whereas if coupled with supply technologies, it can provide bulk energy services (it can, for example, shift the electricity production of VRE to no production times, supporting the integration of these sources into the electricity grid). It can also be used by final consumers for energy management services (i.e., self-consumption, which improves bill management, power quality and reliability, other than supporting the deployment of VREs at distribution level). Electric batteries can also be used for electric vehicles in the transportation sector.
Another important factor for assessing the impact of the integration of VREs and other technologies into the power system is the time scale of study. It extends from the seconds, for example, when a cloud passes over a PV plant to the years, for instance, in deciding on the investments in new transmission lines. Hence, planning is a critical activity to ensure that the power system presents sufficient flexibility to accommodate the integration and growth of variable renewable energy, especially with the increasing concern for climate change and optimal earmarking of limited energy resources [6,16]. The intermittent nature of renewable energy, combined with increasing demand, requires that grid operators make important and challenging operational and investment choices. Thus, in addition to the profitability and reliability of the system, they must also account for non-techno-economic issues such as environmental, social, and political constraints.
Energy planning is an effective method used to address the opportunities and challenges presented by alternative energy sources, since it opts for choosing least-cost solutions while considering the environment and the sustainability of energy services ([12] based on [17]). We distinguish two types of planning: the short-term planning corresponding to the satisfaction of daily demand, and long-term planning concentrating on investments in new capacities and/or technologies while minimizing the cost of the energy system. In general, this corresponds to determining the optimal energy mix that satisfies future demand under technological developments and environmental, political, and social constraints. In the end, long-term planning would allow choosing the type of energy technologies, the capacity to be installed, the timeline of installing new capacities or dismantling old ones, and finally their location ([12] based on [17]).
This paper describes the integration of high shares of renewable energy into the power system of a relatively isolated European island called Procida, located in Italy. The main objective is to decarbonise the electricity system of this territory. This comes with additional aspects that require evaluation to grasp the challenges but also opportunities for VRE integration, which in some cases are specific to these territories and more generally to the power system. Hence, we intend in our long-term modelling and discussion to address the following topics:
- The intermittency challenges, which are here handled through implementation of power system flexibility solutions. In this case, special attention is given to storage technologies, i.e., batteries.
- The additional opportunities offered by these solutions for the island’s electricity system by reducing congestion during peak demand and enhancing its energy autonomy. This sets an example not only for relatively isolated islands but also for interconnected regions dependent on imports.
- This case study reflects the integration of solar photovoltaics under four scenarios representing policies of LOW, HIGH, and HIGH_STG integration of different levels of PV, coupled in the latter with storage, to discuss the possibilities of their deployment under geographical constraints. This could be relevant to the criticism that these technologies face in view of the pressure on land. Moreover, this limitation could reduce the possibilities for decarbonisation; hence, a HIGH_STG_EFF scenario is also investigated to see what role energy efficiency could play in the decarbonisation pathway.
- Decarbonisation of end-use sectors through self-consumption, which demonstrates the role of the involvement of consumers. Furthermore, investing in these solutions would decrease the total system costs over the long-term.
With the attempt to discuss all of these ideas, the paper proceeds as follows. Section 2 describes the territory aspects of the island and the adopted methodology of the TIMES model for Procida. Section 3 presents the main assumptions including technical and policy scenarios, whereas Section 4 derives the prospective analysis of the aforementioned methodology and is followed by concluding remarks in Section 5.
2. Methodology: The TIMES-Procida Model
2.1. Background
Procida is the smallest of the three islands composing the Gulf of Naples, after Capri and Ischia. It has an area of 4.26 km2 and is located 3.4 km from the mainland. The municipality of Procida covers the entire island as well as the small neighbouring island of Vivara (0.4 km2) which is a nature reserve. The island’s population in October 2019 was estimated to comprise 10,428 inhabitants [18] with a density of 2449.1 inhabitants per km².
Concerning the electricity supply, Procida is connected to Ischia, another island of the Gulf, by means of a 30 kV submarine electric cable. The island is strongly dependent on electricity imports, as the possibilities for local energy production are limited. Only a few distributed photovoltaic generation units are present on the island, and the coast is a protected marine area. The city hall is currently the only public building equipped with solar panels, presenting a power of 20 kW (soon to be increased to 60 kW). Procida is also a popular touristic location, especially during summer. This results in intensive seasonal loads that sometimes lead to grid congestion issues. This constitutes a significant challenge in the transformation of the territory’s electrical system, as it impacts the island’s economy.
To study the decarbonisation of the energy system of this island, energy system modelling is used. In fact, it plays an important role in the energy sector, as it provides energy system operators and decision makers with insights on the future development of the grid. Since investments in this sector are expensive [19], strategic planning of energy systems is one way to consider the possible upcoming challenges facing their expansion and operation. Moreover, these challenges are exacerbated with the growth of intermittent renewable energy. There are two distinguished approaches to the planning of energy systems: the first one is operational planning, which involves determining the schedule of operation in the short-term to meet the forecasted load, while meeting technical limits such as stability and reliability. The second method is expansion planning, which is the method used here; it determines over the long-term the future investment decisions and capacities at the least possible cost while complying with techno-economic and environmental constraints [20]. It can also provide insight into the scope of future energy policy for countries and regions. The solution is obtained through the resolution of a mathematical problem that adopts an optimization technique such as the linear programming (LP) optimization method [21]. It identifies the optimal annual output of the energy system and the capacity expansion investments. Most of the energy system models, such as MARKAL-TIMES used here, OSeMOSYS [22], and MESSAGE [23], adopt this optimization method. TIMES also can solve the optimization challenge using mixed integer linear programming (MILP), which is an extension of the LP method. TIMES, described subsequently, provides many features for modelling such as multi-node geographical coverage; inclusion of all sectors, which allows sector coupling, for instance, to study renewable energy integration in end-use sectors; and convenient time resolution according to the complexity of the energy system in question and the granularity of the obtained data.
The possible evolutions of the energy system of the island are investigated through the implementation of energy-planning models based on the Market Allocation (MARKAL-TIMES) model, a methodological corpus developed within the Energy Technology Systems Analysis Program (ETSAP). TIMES (TIMES is an acronym for The Integrated MARKAL-EFOM System) is an economic model generator that can be applied to systems of any dimension, which provides a technology-rich basis for representing energy dynamics over a multi-period time horizon and multi-regions [24]. It uses a linear-programming approach in which the technical optimum is computed by minimizing the discounted global system cost. Then, the model aims to supply energy services at minimum global cost by simultaneously making decisions on equipment investment and operation and primary energy supply. It minimizes the total discounted cost of modelled power systems over a long time period under a number of environmental, technical and demand constraints that are considered as scenarios; hence, a TIMES model is scenario-driven [25].
In a TIMES model, the outputs of each technology are linear functions of its inputs and represent a set of decision variables for determining the energy mix, the investments, and trades between regions. Furthermore, the corpus assumes perfect competition between market actors and thus determines the supply–demand equilibrium, which is translated into maximising the net total surplus over the time horizon. TIMES adopts a perfect foresight approach where decisions are made in each period with full knowledge of future events [24]. Several energy system models have been elaborated with the TIMES model generator for a wide range of objectives, including integrating renewable energy at various levels of geographical scale such as local, national and global. At the global scale, TIMES was used to explore different climate policy impacts on world energy systems in the context of international commitments, such as modelling Nationally Determined Contributions (NDC) pathways [26,27]. On the local level, for example, the analysis with TIMES-PACA did not only demonstrate the role and feasibility of power-to-gas technologies (P2G) in integrating intermittent renewable energy, but also extended the application of policies from the national objective, i.e., France’s carbon neutrality target, to the local level of Provence-Alpes Cote d’Azur (PACA), a southern region in the French metropole. Islands also had their share of analysis. With TIMES-Reunion, which models the energy system of Reunion island, an electrically isolated island of the French territory, a wide range of renewable energy sources were integrated (solar and wind power, biomass, marine and ocean energy, and geothermal energy). Energy autonomy and the challenge that the island has set to achieve a 100% renewables target by 2030 were tested with reliability and stability requirements implemented in the model [28,29].
The TIMES-Procida model is used to analyse the evolution of the energy system of the island with the integration of high shares of renewable energy for the decarbonisation of the system. The model offers a detailed description of the energy system at the reference year (2018), which defines the supply and demand sides. The characterization of the Reference Energy System (RES) includes, on the demand side, the representation of industry, agriculture, residential and commercial sectors, transportation with electric bikes, and public sector with public buildings, lighting, sewer and traffic lights. The supply side specifically represents photovoltaic investments on public, tertiary and residential buildings. The RES is based on the information provided by the Italian Distribution System Operator (DSO), E-Distribuzione, for the island’s data relevant to electricity consumption and production units (defined as an annual value for each of the users) and those provided by the Municipality of Procida relevant to public electricity consumption.
2.2. Time Horizon and Time Definition
The time horizon of the model starts at 2018 and ends in 2050. The 32-year period is divided into sub-periods of one year up to 2035, and then into wider sub-periods. Each subperiod is split into seasons (winter, summer, and intermediate seasons), and split once again into periods of the day (night, morning, midday, afternoon, evening). The latter are determined by comparison between the annual average load curve of the residential sector (provided by [30]), which represents the most energy-intensive sector in Procida, and the annual average global clear-sky irradiance curve for Procida, both of them defined on a daily basis (Figure 1). The final structure is graphically shown in Figure 2.
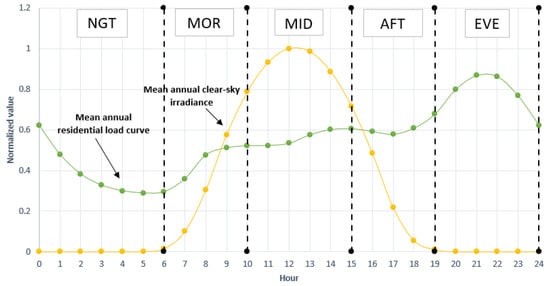
Figure 1.
Comparison between the annual average clear-sky solar irradiance and the residential load curve on a daily basis, both normalized. (The residential curve was normalized with respect to the peak demand; the mean annual global clear-sky irradiance was normalized with respect to the peak irradiance value.)
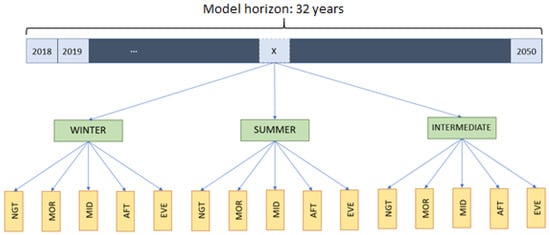
Figure 2.
Time structure used for the model.
2.3. Demand Side
The calibration of the model is performed for the reference year 2018, where the electricity demand accounts for 19,915,668 kWh. For its repartition for each end-use sector, as the data provided were not refined enough, the estimation is based on the information provided in the Piano d’Azione dell’Energia Sostenibile or PAES (The action plans proposed by the Municipality of Procida in 2015 within the European program of the Covenant of Mayors) of Procida. Hence, as previously indicated, the demand side is divided into six sectors: agriculture, industry, tertiary, public, residential, and transportation (Figure 3).
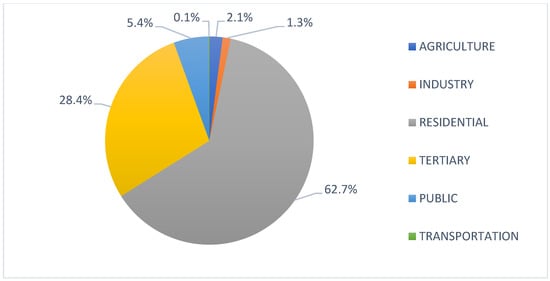
Figure 3.
Procida’s electricity consumption share by sector in 2018.
Load profiles are developed for all of the sectors, and a share of the total annual load is defined for each of the time-slices in the model. The definition of the load fraction at each time-slice is then based on assumptions, mostly based on the analogy with statistically significant load curves. The methodology for obtaining these load curves is explained in Appendix A.
The electricity load fraction of the entire system per time-slice at daily level and distinguished by season is shown in Figure 4. As can be seen, the peak of demand occurs in all seasons during the evening, when electricity production by photovoltaics is not available. However, at the seasonal level, the profile obtained is probably not representative of the island context because, as stated by the Municipality, grid congestion problems were faced during summer. This suggests that a greater load occurs in that season with respect to the other ones. This limits the analysis but also sheds light on the importance of data measurement and sharing.
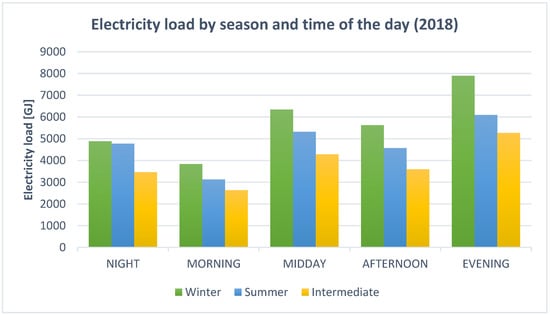
Figure 4.
Estimated electricity load fraction per time-slice at daily level in 2018.
As regards the evolution of the electricity load in time, it is based on the hypothesis that the driver of electricity consumption is the Italian gross domestic product (GDP), as found in [31].
Based on this observation, it is assumed that the correlation between electricity consumption and GDP trends is valid in future years, too. The GDP value in Procida is assumed to grow by 0.5% per year, based on the choice made by [31] for moderate development scenarios in Italy.
The electricity demand for a given sector in a given year t, , is thus calculated as:
where:
- -
- is the electricity demand at t − 1
- -
- is the GDP value at year t and t − 1
It is assumed that the electricity consumption by all sectors is proportional to the GDP value.
An exception is made only for public lighting consumption, which is modelled as constant in time, because in the period between 2015 and 2018, Procida’s Municipality replaced the old light bulbs with light emitting diode (LED) types, reducing electricity consumption by about 70% with respect to the comparable level in 2010 (reported in [32]).
2.4. Supply Side
As regards the supply side, the island is strongly dependent on imports from the mainland (i.e., nearby island Ischia) for about 99% of its electricity demand. The only alternative electricity sources are the photovoltaics, with a total installed capacity of 268 kW in 2018, the largest share (85%) of which is consumed in the residential sector.
The photovoltaics are separately modelled for the residential, tertiary and public sectors in order to better evaluate the contribution of this technology to the supply of electricity to each. As no information on the date of installation is available, it is assumed that they have a lifespan of 20 years and that the operation of the technology linearly decreases with time. The data provided by E-Distribuzione only concern the annual energy output (in kWh) of each installation and their rated power.
For the purposes of the model, the capacity factor of each PV should be defined at each time-slice. This is achieved by starting from the definition of this quantity (based on US NRC definition: https://www.nrc.gov/reading-rm/basic-ref/glossary/capacity-factor-net.html, accessed on 11 September 2022):
with the net electricity generated by the system and the energy that could have been generated at continuous full-power operation considering the same period of time.
- ■
- E calculation
The quantification of the energy output of the system at each time-slice assumes an optimally oriented crystalline silicon PV installation with unitary rated power () and a system loss of 14%.
First, the monthly average energy output (in kWh) in Procida is obtained using the PVGIS tool (Figure 5). This datum is then aggregated for all of the seasons considered in the model by summing up the energy output of each month constituting the season, (it is assumed that the energy output on each day of a month is constant).
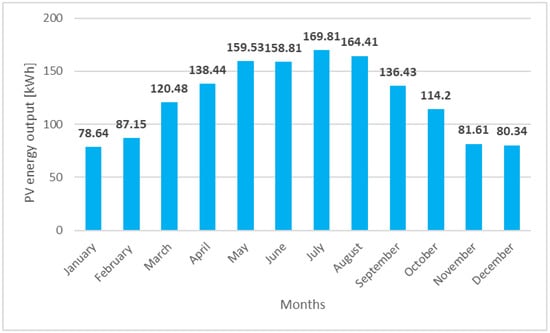
Figure 5.
Monthly energy output from a fixed-angle PV system in Procida [33].
The estimation of the energy output in each time-slice is then made considering the direct irradiance, , again obtained using PVGIS for a fixed plane. This value is firstly obtained for each considered season and for each hour of the day by aggregating the values provided by PVGIS for each month of the year.
Assuming that the energy output is proportional to the direct irradiance, the fraction of energy production in a specific time-slice t and season j, , is estimated as:
with the direct irradiance at the hour i, and n the number of hours constituting the considered time-slice.
The energy output in each time-slice and for each season is then obtained by multiplying the total energy output estimated with PVGIS in each season j, , for the fraction of energy production, :
- ■
- calculation
is calculated for each time-slice t as the product of the number of hours constituting the time-slice, , and the rated power of the installation:
2.5. Electricity Price
The price of imported electricity is given as exogenous to the model, while the export of electricity is not considered. For the imports, no variations in the electricity price during the day are considered. This choice is made to avoid bias in the results due to economic advantages in specific hours of the day. The price is fixed at EUR 184.7/MWh, resulting from the average between the mean final electricity price for residential (EUR 216.9/MWh) and non-residential users (EUR 152.5/MWh) in 2018, the base year of our model, as provided by ARERA [34].
There is a possibility to reinject the excess of photovoltaics generation into the low-voltage electricity grid, as can be seen in the Figure 2. However, a price is assigned to this operation and is defined as:
where is the price of electricity imports and is the average spot price of electricity in Italy in 2018 (EUR 61.31/MWh [31]). (Electricity prices in the past 18 months have seen unprecedented surges, explained by the post-COVID demand recovery and the geopolitical tensions that inflated prices, as they follow gas prices in the EU based on the Agency for the Cooperation of Energy Regulators (ACER) report [35]. Since our work considers a long-term analysis, we do not incorporate the short-term changes. Such events do not have the same weight as when they are modelled on the short-term with direct impact on the electricity market. The technical focus that is applied here is less directly modified when considering the period, or at least the impact is more absorbed. Moreover, due to the small size of the island and its touristic nature, possible large variations in energy demand would be limited due to this context). It is assumed that this price remains constant over the time horizon of the model.
3. Assumptions
3.1. Renewable Energy Sources
New photovoltaic panels are considered as a possible technology to install on building roofs starting from 2019. We chose to make a distinction between the PVs installed on residential, public and tertiary (private) buildings, in order to better analyse the contribution of the installation to the electricity supply of the sector it is referred to. It is relevant to mention that a lower investment cost is set for tertiary and public applications, due to economies of scale.
Due to limitations of surface area, a hypothesis was made regarding the installation of PV panels, limiting their deployment to building roof surface areas. The maximum installable PV capacity is calculated for the residential, tertiary, and public sectors, accordingly.
3.1.1. Residential PV Installations
Starting from the aforementioned hypothesis, the PVWatts Calculator (https://pvwatts.nrel.gov/pvwatts.php, accessed on 11 September 2022), a tool developed by the National Renewable Energy Laboratory (NREL), is used to obtain the maximum potential for PV capacities (Figure 6).
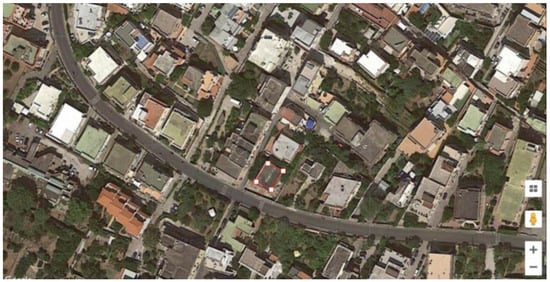
Figure 6.
Example of roof surface estimation with PVWatts Calculator tool.
It was observed that in Procida, there are different sizes of buildings, according to the zone. This led to dividing buildings into two types, small and large ones, and an average roof dimension was assigned for each type based on observations (see Table 1).

Table 1.
Types of buildings with associated PV rated power.
Assuming that the number of buildings is equally divided into large and small ones, the average maximum capacity for a residential building in Procida, , is estimated to be:
where and are the equivalent capacity for large and small buildings, respectively.
The number of residential buildings was provided by ISTAT (the Italian National Institute of Statistics), , and is used to obtain the maximum installable capacity on residential roofs, , through Equation (8):
However, as it is not realistic that all of the roofs are covered by PVs, it is assumed that at most only 2/3 of the roofs are used for PVs:
This value is compared to the one obtained with a gross estimation of the capacity potential, which can be made knowing that in Italy the average capacity for residential users is 4.8 kWp (kilowatt peak) [36]:
The two values being quite close, the estimation is assumed to be valid.
3.1.2. Public PV Installations
PVWatts Calculator is also used to estimate the total installable capacity on public buildings’ roofs. In this case, the estimation is made by summing up the installable capacity of the buildings whose addresses are known.
The maximum amount of installable capacity is estimated as:
3.1.3. Tertiary PV Installations
In Procida, several tertiary buildings (and several shops and restaurants) are integrated into residential ones, which requires attention when acquiring data from ISTAT related to the number of building roofs on which to install tertiary PV systems. These data also inform us on the type of enterprises present in Procida in 2017, i.e., industrial and tertiary. Consequently, a classification is made to distinguish between the shops that are considered as integrated into residential buildings and the ones that are self-contained. As the aim of the evaluation is to estimate the installable capacity on tertiary buildings, the industrial ones are excluded from the analysis.
In total, it was found that 78 tertiary buildings are available for PV installations, and the maximum capacity is estimated based on assumptions on the available surface for each service category type. The values are summarized in Table 2. The equivalent installable capacity per type of building is again estimated with PVWatts Calculator.
Table 2.
Summary of the values used for the estimation of the total installable PV capacity in the tertiary sector.
3.2. Energy Storage Solutions
In this model, only storage systems that can be coupled with photovoltaic panels have been considered, as they are the only renewable source of energy available on Procida. As determined in [12] and based on [37], the most appropriate types of batteries for behind-the-meter and short-term storage applications are lithium-ion (Li-ion), sodium-sulfur, redox flow, lead-acid, and hydrogen batteries. According to [38], sodium-sulfur batteries would operate at high temperatures and lead-acid ones have been superseded by Li-ion batteries. Hence, Li-ion batteries are considered for our case and are implemented in the model.
They are coupled to photovoltaics to better manage the energy potential of the solar installation. Li-ion batteries are considered for residential, tertiary, and public applications to store electricity on a daily basis. The characteristics of Li-ion battery technologies differ for each of the sectors where the photovoltaics are installed on buildings. For instance, the investment costs are lower for public and tertiary applications, due to economies of scale. Furthermore, the technological advancement of batteries [39] is reflected in the model: lifespan of batteries in 2020 is set to 10 years, ([12] as in [40]), and the lifetime of the system is increased to 15 years in 2030 ([12,41]).
The investments costs are separately defined for residential applications and public and tertiary ones. Moreover, they are expected to decrease in the near future, which is reflected in the model. Costs and their evolution up to 2040 are taken from [39], where values from a moderate deployment scenario of these systems are used [12]. The choice of batteries and their characteristics is based on the C-rate representing the discharge rate of a battery. For instance, a 1 C capacity of a battery means that a fully charged battery will be completely discharged in 1 h. A 2 C rate means that the battery can be fully discharged in half an hour, and a 0.5 C rate means that the battery can be fully discharged in 2 h ([12] based on [29]). Consequently, for residential applications, the batteries with a C-rate equal to 0.35 are chosen; for the tertiary and public applications, instead the C-rate is 0.25 with respective cost trajectories up to 2040. From 2050, a hypothesis had to be made on the investment costs (about EUR 288/kWh for residential applications, EUR 180/kWh for tertiary and public ones). No fixed operation and maintenance costs are considered for batteries, with no consideration for additional costs that usually exist but are system-specific ([12] based on [39]).
Additionally, the Smart Energy Hub (SEH) [42] is integrated into the model. (The Smart Energy Hub is created by Sylfen (www.sylfen.com, accessed on 11 September 2022) and tested in the context of the Geographical Islands FlexibiliTy (GIFT) project (https://www.gift-h2020.eu/, accessed on 11 September 2022)). This technology is a hybrid storage solution consisting of a Li-ion battery coupled with a reversible solid oxide cell (rSOC). The rSOC component is made of an electrolyser, hydrogen (H2) tank and a fuel cell, and has the ability to operate on a seasonal basis due to the presence of the H2 tank. More information on the operation and modelling of the SEH can be found in [12]. As for the remaining choice of storage solution, redox flow batteries are excluded since they present similarities with hydrogen storage in terms of application and maturity of the technology ([12] based on [38]).
3.3. Scenarios
Two energy supply technologies are included in the TIMES-Procida model: electricity imports and photovoltaics; in an optimal solution, the use of the cheapest one, which is the latter in this case, is maximised. Hence, the focus is placed on the maximum capacity of new annual photovoltaic installations for the determination of the solution [12]. This translates into two different scenarios for future photovoltaics development on the island: a case of modest PV deployment over the long-term (scenario LOW) and a case of large deployment (scenario HIGH), which allows an analysis of the effect of different local policies for the penetration of photovoltaics on the island (which is assumed to take place from 2020). In practice, the definition of the scenarios is made by imposing a constraint on the maximum number of annual investments in photovoltaics in each year of the horizon.
This constraint is set on the maximum amount of PV installations in each year t of the horizon according to the following equation:
where is the integer value defining the maximum amount of new photovoltaic installations in year t.
For the values in 2018–2020, a trend was derived in accordance with observations of the trend in Italian capacities, which increased quite linearly between 2013 and 2018 (see Figure 7), taking into consideration that 97.5% of the installations are connected to the low voltage grid [36,43]. The reference values used to build this trend were the installed capacities in 2013 (57.6 kW) and 2018 (268 kW), provided by the municipality of Procida. Hence, the scenarios were built subsequently using the information obtained through these communications on the possible future maximum installed PV capacities (see Figure 8) and considering the geographical constraints modelled in Section 3.1.
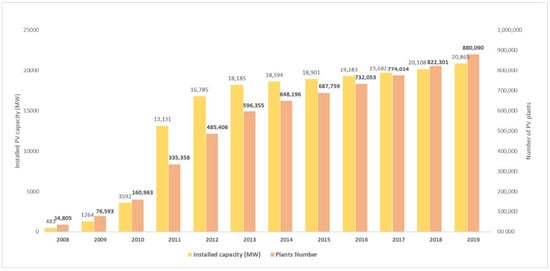
Figure 7.
Evolution of photovoltaic installations in Italy [36].
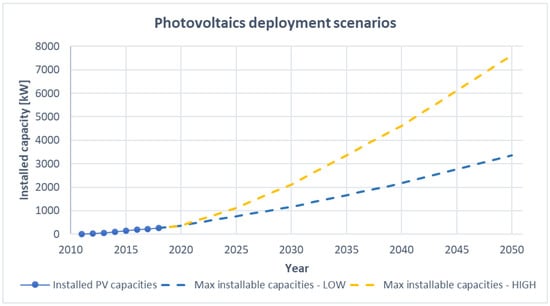
Figure 8.
Max installable capacities constraint used to define the LOW and HIGH scenarios.
For the LOW and HIGH scenarios, photovoltaic installations and electric vehicles (however not analysed in the present paper) are included in the model as new technologies. Another scenario that includes all of the storage technologies is separately defined, with the objective to better evaluate the storage effects on the energy system evolution (scenario HIGH_STG). The comparison is made with respect to the high photovoltaics development scenario, as storage technologies are more meaningful with high shares of variable renewable sources.
Finally, an additional scenario regarding electricity efficiency policies for the residential and tertiary sectors, the most energy-intensive ones, is considered (scenario HIGH_STG_EFF). The aim is to evaluate the advantages of such policies on the decarbonisation of the energy system of the island. However, In terms of modelling, this scenario consists of decreasing the electricity demand of the residential and tertiary sectors over time by a fraction with respect to a reference year in which the policy is applied. We assumed a consumption decrease of 0.25% with respect to the one in 2020 for 10 years and a decrease of 0.10% with respect to the one in 2030 for 20 years onward. The first target coincides with the EU directive on energy efficiency and annual energy savings for Cyprus and Malta. This value was chosen for these territories due to their insular and peripheral situation, whereas for the continent, the value was 0.8% in 2018 and amended to 1.5% (p. 3, [44,45]. From 2030, the value decreases with the assumption that electricity devices already have quite high efficiencies; it is assumed that the improvement is quite modest, and is achieved, for example, by promoting the use of heat pumps instead of other types of air conditioning systems.
A summary of the scenarios considered for analysis is presented in Table 3.
Table 3.
Summary of the scenarios considered for analysis.
4. Results
4.1. Pathways to Decarbonisation and Energy Autonomy
The introduction of renewable energy sources comes with the decarbonisation of the energy mix of the island. As the only possible supply solutions are the photovoltaics and imports through the submarine cable, there are no carbon dioxide (CO2) emissions related to power production and supply on the island. However, an important perspective for decarbonisation concerns the demand side. Therefore, we evaluate the possible decarbonisation levels that can be reached with the different photovoltaics deployment scenarios considered for the analysis.
To do so, the renewables share in total end-use electricity consumption is quantified and compared among all of the scenarios. The results are shown in Figure 9. The high photovoltaics penetration scenarios result in the largest share in end-use electricity consumption, allowing for decarbonisation of about 22.3% in about 20 years. We distinguish between two phases of the time horizon, showing that the decarbonisation with PV is limited by the annual electricity demand, which increases significantly towards the end of the horizon. In fact, during the first two decades of the horizon, important improvements in terms of decarbonisation are possible, even with the low PV penetration scenario where the renewables share, which is less than 1% in 2018, becomes 10-fold higher in 2040. In the last years of the horizon, the increase is stagnant, with increasing annual electricity demand. Moreover, we notice no difference between the HIGH scenario and the HIGH_STG one, since the same amount of total PV investments is made over time. Finally, as expected, the scenario with efficiency policies allows increasing the share of renewables in end-use electricity consumption.
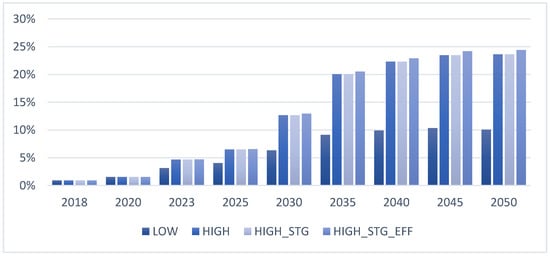
Figure 9.
Renewables share in end-use electricity consumption for different scenarios.
However, this evaluation is made with respect to the total electricity consumption of the island. A more refined analysis can be made by focusing on the decarbonisation of the sectors in which photovoltaics are installed (for the renewables share in residential sector consumption, the demand in the transportation sector is also included, since it was assumed that EVs are used by residential users and mostly recharged in the evening at home). The results of this study for the HIGH scenario are shown in Figure 10. The results are the same for the HIGH_STG scenario, as the electricity produced by photovoltaics is used entirely to cover the load of the sector of production (there is no excess electricity that can be reinjected into the main grid). This suggests that a larger share of photovoltaics is required to appreciate the use of storage systems in terms of decarbonisation.
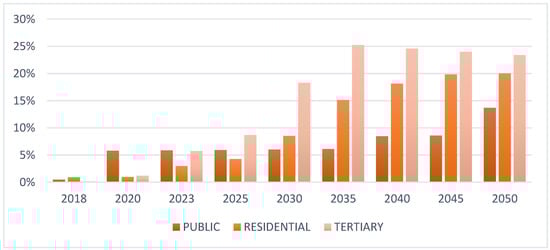
Figure 10.
Renewables share in end-use electricity consumption for supply sectors (HIGH scenario).
The results show that in the optimal solution, the tertiary sector is the one that reaches the largest decarbonisation level over the time horizon. The peak is reached in 2035, when the maximum installable capacity is attained; the share decreases thereafter, mainly due to the increase in electricity demand. This could suggest that for this sector, if a larger share of renewables in final consumption is to be attained, additional solutions, such as energy efficiency policies, should be pursued.
The evolution of electricity imports over time is examined in the four different scenarios (Figure 11).
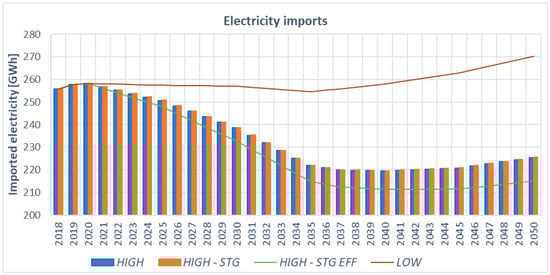
Figure 11.
Evolution of electricity imports for the four different scenarios.
All of the scenarios with high renewables deployment allow a large decrease until about 2035. Later, as the total electricity demand increases, the photovoltaics do not manage anymore to decrease the dependency on imports despite the installed capacity increases over time. Therefore, the results suggest that the photovoltaics alone cannot guarantee the decarbonisation of the island over the long-term. Energy efficiency policies could contribute to limit the imports, even if the policies considered for the scenario seem insufficient to prevent an increase in imports in the last years of the horizon. No import reductions can be detected in the scenario with storage deployment.
At first sight, the results obtained for the renewables share in final consumption and imports seem to suggest that the use of storage technologies will not significantly foster an increase in renewables. However, a closer look at the results can show other benefits of these devices for the energy system of the island.
At a system level, one of the main advantages is the relief in grid congestion during peak hours. Indeed, the results show that the use of batteries allows decreasing electricity imports in peak hours when the grid is more subject to congestion problems. The comparison between the scenarios with high renewables development with and without storage technologies in terms of imports during peak hours in Procida is shown in Figure 12. In this case, the decrease is quite low (−0.61% at most), since the investments in batteries obtained with the optimal solution are not significant. However, the results could probably be more significant if requirements related to grid congestion relief are integrated into the model or in case of larger renewables penetration, leading to a larger amount of energy produced by photovoltaics that could be shifted from high production hours (midday) to no production hours (especially in the evening, when the peak of demand occurs). Moreover, it should be noted that a better estimation of seasonal consumption share that considers the load increase in summer could result in a higher deployment of storage technologies, as higher electricity production is possible during this season.
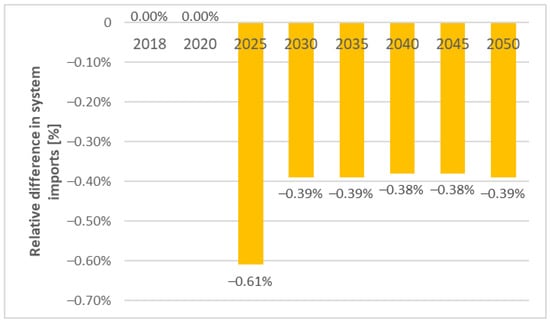
Figure 12.
Effect of storage on electricity imports during peak hours.
Another advantage is related to the possibilities of self-consumption. Considering public buildings, where the investments in batteries are concentrated, the results show that the use of batteries enables decreases in electricity imports of up to about 55% (in 2035, see Figure 13). This implies important economic advantages for the users, as well as advantages for grid congestion relief and grid flexibility, especially during peak hours, as the grid must manage lower flows of electricity. Hence, it is deduced that the improvements shown in Figure 13 are probably mostly due to the public sector.
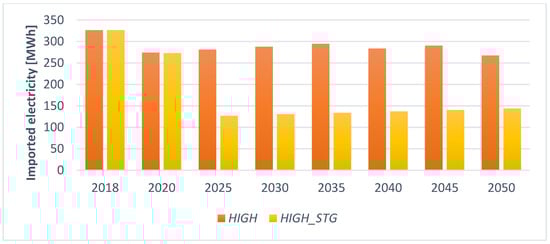
Figure 13.
Effect of storage on public sector electricity imports.
4.2. Economic Impact: Investments in New Technologies
According to the exogenous inputs of the estimated demand and technical, economic, political and local constraints, the linear optimization model of TIMES-Procida minimized the total discounted cost of the energy system over the considered time horizon. As a result, the investments in new supply technologies maximised the use of photovoltaics in all of the scenarios with the maximum in installed capacity per year always attained (see Figure 14). Moreover, public, and tertiary installations are preferred in the first years of the horizon since their investment costs are lower with respect to residential installations due to economies of scale.
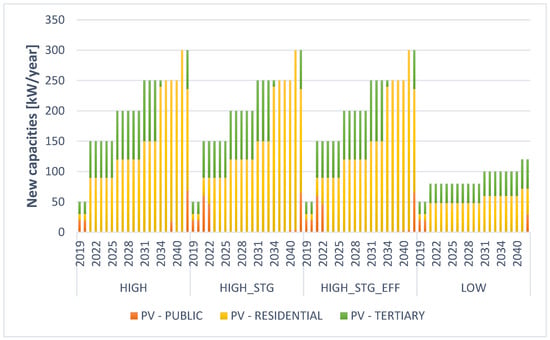
Figure 14.
Optimal investments in supply technologies in the four investigated scenarios.
However, when storage technologies are allowed, the optimal choice for PV investments changes, with a larger amount installed in the first years of the horizon.
The resulting optimal total installed capacities evolution is shown in Figure 15. As can be noticed, the model maximises the photovoltaics for tertiary applications, reaching the maximum capacity (1.05 MW) in about 15 years in the high renewables development scenarios.
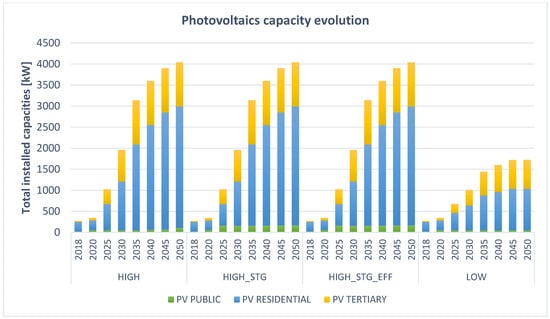
Figure 15.
Optimal photovoltaics capacities evolution in the four investigated scenarios.
For the storage part of the system, the investments are mainly in batteries and particularly the ones for public and residential applications. Long-term storage technologies are not chosen by the model despite their lower price per unit of energy. This is probably due to the large conversion losses related to these processes (the efficiency of a charge/discharge cycle is only 37.5%), which makes these technologies energetically not convenient in a context in which local source electricity production is already quite limited.
The investments in photovoltaics are both HIGH_STG and HIGH_STG_EFF scenarios. The installed capacity evolution over time, shown in Figure 16, denotes the fact that in the case of public buildings, batteries are installed from the first year in which the technology is available, with investments made mostly in the first 10 years of the horizon. Conversely, in the residential sector, batteries only appear at the end of the horizon. This difference would be related to the cost of public batteries, which are cheaper than residential ones (again due to economies of scale), but also to photovoltaics production with respect to the total load. Indeed, in the case of public buildings, there is an overproduction with respect to the load during peak photovoltaics production hours, i.e., midday. This was noticed when no storage technologies were included in the model; the electricity in that case was injected into the system grid. In general, despite the considerations of the high photovoltaics penetration scenario, storage deployment is not intensive, with the installed capacities much lower than the maximum allowed amount, as set by the constraint. In fact, about 16.5% of the maximum capacity at most is installed in public buildings versus 1% in residential ones.
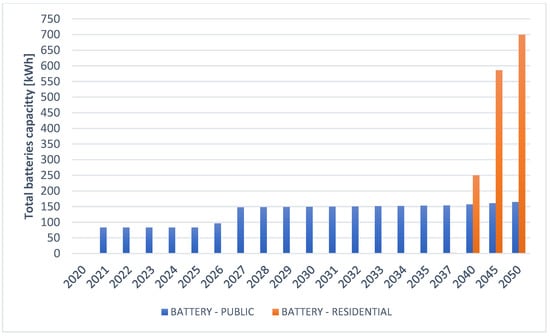
Figure 16.
Battery capacity evolution over the time horizon (HIGH_STG and HIGH_STG_EFF scenarios).
The total cost of the system normalized with respect to the nominal value of the system cost under the LOW scenario is shown in Figure 17. It is the highest in the LOW scenario, as in this case the island is more dependent on imports from the mainland, the most expensive electricity supply alternative. Comparing between the remaining scenarios, the difference is less significant with the introduction of storage technologies and efficiency policies (−0.09% and −1.9%, respectively). These results suggest that it could be economically convenient to promote self-consumption on the island.
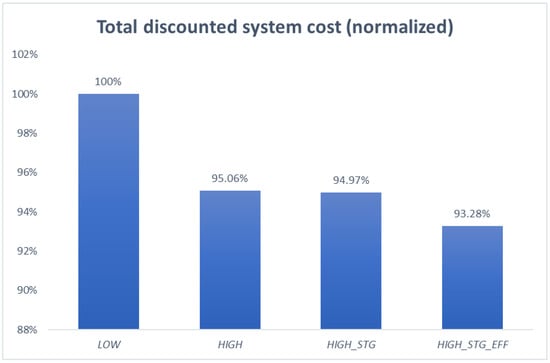
Figure 17.
Total discounted system cost normalized with respect to the LOW scenario.
5. Discussion
The results of this study are based on the linear least cost model assuming perfect competition and foresight, as the TIMES model generator considers partial equilibrium. Human behaviour is also not covered by the model, while the implementation of measures such as energy efficiency, which turned out to be a profitable way to reduce energy consumption and effective in reducing energy imports, can be greatly impacted by public willingness. In addition, from the obtained results, consideration of the different realistic renewables integration scenarios showed that promoting the use of photovoltaics on the island could lead to important improvements in terms of costs, energy autonomy of the users (and thus of the island itself) and grid congestion relief. Improvements could be detected even in cases of low renewables deployment, suggesting that the energy system could benefit from policies supporting local energy production. However, the results also showed that in the long-term, the use of photovoltaics alone will not be enough to cope with the increase in electricity consumption. Additional solutions should then be considered, such as policies supporting energy efficiency as mentioned earlier.
The potential benefits of the flexibility solutions integrated into the model concerned storage solutions. Relying on these technologies is related to the share of renewable energy integrated into the energy system. This was noticed with the increasing investment in batteries as the shares of photovoltaics integration were higher. For the case of low renewables integration into the system, this technology is absent from the model solution, suggesting that there exists a lower limit over which this technology becomes competitive. Two types of storage were considered here: electric batteries and seasonal storage. It appeared that the latter’s deployment is inconvenient: batteries present high energy losses in an energy system with scarce possibilities for local production. Nevertheless, storage technologies provide a valid solution when considering the energy system as a whole. With only limited investments in these solutions, improvements in grid congestion relief and self-consumption are observed.
The main recommendations from this case study can be summarized as follows:
- Assessing the context of the territory as well as the energy system of the island helps in understanding the flexibility needs and identifying the suitable solutions
- Flexibility solutions are linked to investment costs, which would decrease the total energy system cost as obtained from the techno-economic optimization. They are also a way to ensure energy autonomy. In this context, this territory, being a tourist destination, will harness the benefits of integrating solar photovoltaics and storage for its economic resilience and demonstrate its commitments to achieving the EU’s energy and climate targets.
- It also implies the involvement of consumers that become “prosumers”, thus participating in the energy transition.
- Studying islands allows us to reflect also on the interconnected systems that will see further integration of renewables in the future.
- Data availability remains crucial to have a clear representation of the variability of demand and thus study flexibility.
6. Conclusions
In conclusion, the analysis showed that ensuring the decarbonisation of the island is possible through renewable energy, but for this achievement, additional solutions are required that can be addressed on the technical level and/or from the support of policy makers (e.g., energy efficiency, storage technologies, or other flexibility solutions when high shares of renewables are included in the power system). Indeed, the scenarios that involve storage and energy efficiency show higher renewable shares in end-use electricity consumption, reaching 24.4% with storage and energy efficiency compared to 23% with intensive deployment of PV and storage only. In addition, as the power system transformation tends towards integrating higher shares of renewable energy sources, studying energy systems becomes essential. It is even more relevant in the case of islands where attention needs to be given to the physical and economic aspects. These territories are constrained by geographical limitations that reduce the variety of solutions available in the market to the few that are adequate to the island’s situation. Procida in Italy is limited by energy sources to imports from a nearby island and to solar photovoltaics placed on buildings, given its small surface area and the presence of a protected marine area. The marginality of islands and the consequent challenges—such as harsh weather conditions, space availability, economic development—also tend to increase the cost of investments in new solutions, as they need to be specific to the context. Furthermore, the challenges faced by islands could represent a valuable example for interconnected energy systems, which will have to tackle the challenges of integrating high shares of variable renewables in the coming decades.
Author Contributions
Conceptualization, G.G., S.C., S.S. and N.M.; methodology, G.G., S.C. and S.S.; formal analysis, G.G. and S.C.; investigation, G.G. and S.C.; resources, G.G., S.C., S.S. and N.M.; data curation, S.C. and S.S.; writing—original draft preparation, G.G. and S.C.; writing—review and editing, G.G., S.C. and S.S.; visualization, G.G. and S.C.; supervision, S.S. and N.M.; project administration, S.S. and N.M.; funding acquisition, N.M. All authors have read and agreed to the published version of the manuscript.
Funding
This research was supported in the framework of Geographical Islands FlexibiliTy (GIFT) project, part of the H2020 research and innovation program of the European Union, under grant agreement No 824410.
Institutional Review Board Statement
Not applicable.
Informed Consent Statement
Not applicable.
Data Availability Statement
Not applicable.
Acknowledgments
The authors want to thank the partners in the GIFT project for their collaboration in terms of input data and insights.
Conflicts of Interest
The authors declare no conflict of interest.
Appendix A
For modelling purposes, it is necessary to allocate a share of the total annual load to each of the time-slices defined in the model. The definition of the load fraction at each time-slice is then based on assumptions, mostly based on the analogy with statistically significant load curves.
Residential sector: The load curve for the residential sector is obtained considering an average daily load curve defined for each of the seasons of the model. For the definition of the load curve, reference is made to statistically based electricity load curves estimated for the residential sector in Italy in 2012 [30]. In this study, the load curves are defined based on the day of the week (weekdays, Saturdays, Sundays, and holidays) and the season of the year. As an example, the load curve for a weekday in different seasons is shown in Figure A1.
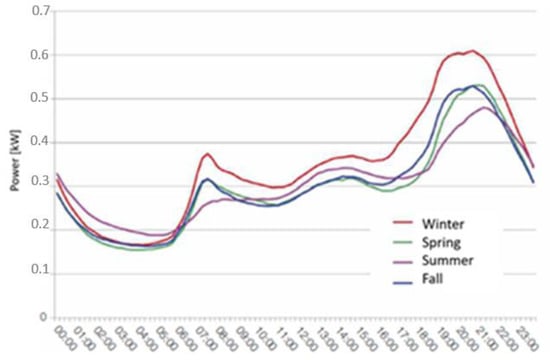
Figure A1.
Italian typical residential load curve for a weekday and for different seasons (source: RSE [30]).
For the purposes of the analysis, the load curve data are extracted and normalized with respect to the peak value. Then, the data are aggregated within the modelled seasons by considering an approximate number of weekdays, Saturdays, Sundays, and holidays in one year. The final load curve defined for each season of the model is shown in Figure A2.
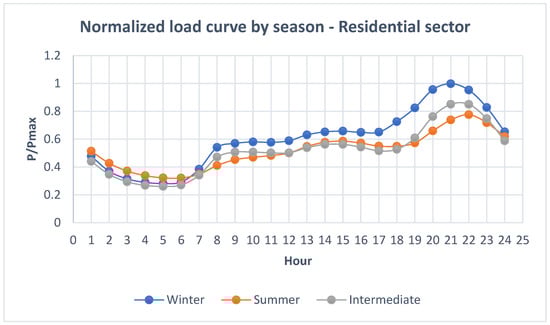
Figure A2.
Residential load curve for different model seasons.
As the load curve represents a daily power load, the energy consumption at each time-slice t, , is proportional to the integral of the load curve, that is:
where a and b are the integration boundaries (that correspond to the first and last hour defining the time-slice), is the electricity load curve in season j.
In practice, the curve was approximated to a piecewise linear function between all of the hours of the day to estimate the energy quantity corresponding to each 1 h timestep. This is equivalent to calculating the area of a trapezoid. Then, the energy consumption was summed up over all of the hours constituting the time-slice at each season. In mathematical terms:
The fraction of energy consumption at each time-slice, , could then be estimated as:
with the number of days in season j.
Tertiary sector: A similar methodology is used to estimate the consumption fraction for the tertiary sector. In this case, for the evaluation of the electricity load curve trend, reference is made to [36] for the seasonal variation and to [46] for the daily variation. In particular, for the seasonal variation, reference is made to an average statistically based monthly electricity load curve in Italy. The graph, based on [36], is represented in Figure A3.
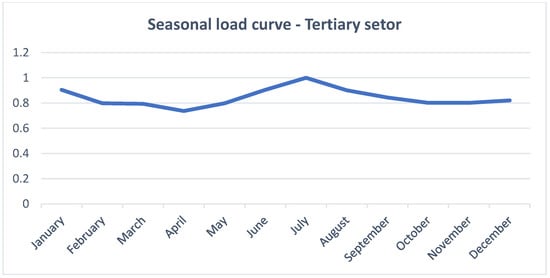
Figure A3.
Seasonal load curve used for the tertiary sector (based on [36]).
The monthly consumption given by this load curve is then aggregated to evaluate the total electricity consumption in each season j defined in the model as follows:
where is the normalized electricity consumption in month i, m is the total number of months that are included in the season (ex., Winter includes the months from November to March), is the fraction of days that are included in the season definition for each specific month (ex. Winter only includes 16 days in November, so ).
The fraction of consumption in each season is then calculated with respect to the total annual consumption:
To define the time-slices at the daily level instead, reference is made to a statistically based annual electricity load curve in England provided by [46] on a daily basis (no information was found for the Italian daily trend). The normalized daily trend is shown in Figure A4.
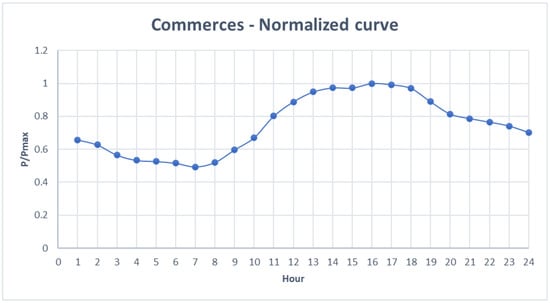
Figure A4.
Annual load curve on daily basis used for the tertiary sector (based on Hayes [46]).
The daily energy consumed in each time-slice t, , is calculated by summing up all the 1 h timesteps and electricity consumptions by approximation of the load curve to a piecewise linear function, as made in the case of the residential sector. The fraction of consumption in each daily time-slice is then evaluated with respect to the total consumption during the day:
The fraction of consumption in each time-slice is then given by the product of the fraction of consumption at the seasonal level and the one evaluated on a daily level:
Public sector: For the public sector, data concerning the electricity consumption of public buildings, public lighting, sewers and traffic lights are available. However, the consumption data are available on an hourly basis only for some public buildings and sewers; for others, data are expressed according to specific daily time slots defined on the basis of different electricity tariffs (named F1, F2, F3 and corresponding to peak and off-peak electricity demand hours, as established in the ARERA deliberation, Deliberazione 9 maggio 2008-ARG/elt 56/08). For the first ones, the consumption fraction in each time-slice is calculated as a percentage of the total annual consumption. When hourly data are missing, the consumption is proportional to the length of the time-slice and evenly assigned to each season. For the city hall building, which has a PV installation on the roof, the total consumption is evaluated as the sum of the measured consumption and the PV electricity production.
Agricultural and industrial sectors: The agricultural and industrial sector loads are only defined on the annual level by setting the total consumption for the year, whereas no variations in the load are considered on a daily or seasonal level. The electricity consumption in each time-slice is then proportional to the length of the time-slice itself.
References
- UN Environment. “Mitigation,” UNEP-UN Environment Programme. 14 September 2017. Available online: http://www.unep.org/explore-topics/climate-action/what-we-do/mitigation (accessed on 24 June 2021).
- International Renewable Energy Agency (IRENA). Renewable Power Generation Costs in 2019; International Renewable Energy Agency: Abu Dhabi, United Arab Emirates, 2020; Available online: https://www.irena.org/publications/2020/Jun/Renewable-Power-Costs-in-2019 (accessed on 11 June 2020).
- Delivering the European Green Deal. 2019. Available online: https://ec.europa.eu/info/strategy/priorities-2019-2024/european-green-deal/delivering-european-green-deal_en (accessed on 11 June 2022).
- European Commission-European Commission. REPowerEU: Affordable, Secure and Sustainable Energy for Europe. Available online: https://ec.europa.eu/info/strategy/priorities-2019-2024/european-green-deal/repowereu-affordable-secure-and-sustainable-energy-europe_en (accessed on 30 August 2022).
- European Commission; Joint Research Centre; Institute for Energy and Transport. Addressing Flexibility in Energy System Models. LU: Publications Office. 2015. Available online: https://data.europa.eu/doi/10.2790/9333 (accessed on 19 February 2021).
- Cochran, J.; Miller, M.; Zinaman, O.; Milligan, M.; Arent, D.; Palmintier, B.; O’Malley, M.; Mueller, S.; Lannoye, E.; Tuohy, A.; et al. Flexibility in 21st Century Power Systems; National Renewable Energy Lab. (NREL): Golden, CO, USA, 2014. [Google Scholar] [CrossRef]
- IEA. Status of Power System Transformation 2019; IEA: Paris, France, 2019; p. 32. [Google Scholar]
- IRENA. Power System Flexibility for the Energy Transition. Available online: https://publications/2018/Nov/Power-system-flexibility-for-the-energy-transition (accessed on 21 January 2021).
- European Commission. Clean Energy for Islands Initiative. 2018. Available online: https://ec.europa.eu/energy/topics/renewable-energy/initiatives-and-events/clean-energy-eu-islands_en?redir=1 (accessed on 11 September 2022).
- Ray, C.; Bradley, F. Energy Autonomy in Sustainable Communities—A Review of Key Issues. 2012. Available online: https://reader.elsevier.com/reader/sd/pii/S1364032112004716?token=1876C4B2092D6C1E53BF7EBD3C380353BE3194989C96404986600BBA40524D0FADF6EEE4CC7A21FFEE5D5B14C4F11248 (accessed on 13 March 2021).
- Drouineau, M.; Assoumou, E.; Mazauric, V.; Maïzi, N. Increasing shares of intermittent sources in Reunion Island: Impacts on the future reliability of power supply. Renew. Sustain. Energy Rev. 2015, 46, 120–128. [Google Scholar] [CrossRef]
- Chlela, S.; Grazioli, G.; Marchal, F.; Selosse, S.; Maizi, N. Technological Scenarios and Recommendations (GIFT Deliverable 2.4). 2021. Available online: https://www.gift-h2020.eu/wp-content/uploads/2021/07/GIFT_Deliverable-2_4_v5.pdf (accessed on 26 August 2021).
- Katsaprakakis, D.A.; Thomsen, B.; Dakanali, I.; Tzirakis, K. Faroe Islands: Towards 100% R.E.S. penetration. Renew. Energy 2019, 135, 473–484. [Google Scholar] [CrossRef]
- Marczinkowski, H.; Østergaard, P.A.; Djørup, S.R. Transitioning Island Energy Systems—Local Conditions, Development Phases, and Renewable Energy Integration. Energies 2019, 12, 3484. [Google Scholar] [CrossRef]
- IRENA. Electricity Storage Valuation Framework. Available online: https://publications/2020/Mar/Electricity-Storage-Valuation-Framework-2020 (accessed on 24 March 2021).
- Gaur, A.S.; Das, P.; Jain, A.; Bhakar, R.; Mathur, J. Long-term energy system planning considering short-term operational constraints. Energy Strat. Rev. 2019, 26, 100383. [Google Scholar] [CrossRef]
- Stoll, H.G. Least-Cost Electric Utility Planning; Wiley: New York, NY, USA, 1989; Available online: http://books.google.com/books?id=PrhtAAAAIAAJ (accessed on 5 July 2021).
- Italian National Institute of Statistics. Istat Statistics. 2019. Available online: http://dati.istat.it/?lang=en (accessed on 24 August 2021).
- Babrowski, S.; Heffels, T.; Jochem, P.; Fichtner, W. Reducing computing time of energy system models by a myopic approach. Energy Syst. 2014, 5, 65–83. [Google Scholar] [CrossRef]
- IRENA. Transforming Small-Island Power Systems; IRENA: Abu Dhabi, United Arab Emirates, 2018; p. 150. [Google Scholar]
- Prina, M.G.; Manzolini, G.; Moser, D.; Nastasi, B.; Sparber, W. Classification and challenges of bottom-up energy system models-A review. Renew. Sustain. Energy Rev. 2020, 129, 109917. [Google Scholar] [CrossRef]
- OSeMOSYS. Available online: http://www.osemosys.org/ (accessed on 19 January 2022).
- MESSAGE-IIASA. Available online: https://previous.iiasa.ac.at/web/home/research/researchPrograms/Energy/MESSAGE.en.html (accessed on 19 January 2022).
- Loulou, R.; Goldstein, G.; Kanudia, A.; Lettila, A.; Remme, U. Documentation for the TIMES Model-Part I; Energy Technology Systems Analysis Programme. 2016. Available online: https://iea-etsap.org/index.php/documentation (accessed on 11 September 2022).
- Selosse, S.; Garabedian, S.; Ricci, O.; Maïzi, N. The renewable energy revolution of reunion island. Renew. Sustain. Energy Rev. 2018, 89, 99–105. [Google Scholar] [CrossRef]
- Winning, M.; Pye, S.; Glynn, J.; Scamman, D.; Welsby, D. How Low Can We Go? The Implications of Delayed Ratcheting and Negative Emissions Technologies on Achieving Well Below 2 °C. In Limiting Global Warming to Well Below 2 °C: Energy System Modelling and Policy Development; Giannakidis, G., Karlsson, K., Labriet, M., Gallachó, B.Ó., Eds.; Springer: Cham, Switzerland, 2018; pp. 51–65. [Google Scholar] [CrossRef]
- Kang, S.; Selosse, S.; Maïzi, N. Contribution of global GHG reduction pledges to bioenergy expansion. Biomass-Bioenergy 2018, 111, 142–153. [Google Scholar] [CrossRef]
- Selosse, S.; Ricci, O.; Garabedian, S.; Maïzi, N. Exploring sustainable energy future in Reunion Island. Util. Policy 2018, 55, 158–166. [Google Scholar] [CrossRef]
- Bouckaert, S.; Mazauric, V.; Assoumou, E.; Maïzi, N. Smart grids and power supply reliability: The impact of demand response on future power mixes. In Proceedings of the 2013 IEEE Grenoble Conference, Grenoble, France, 16–20 June 2013; pp. 1–5. [Google Scholar] [CrossRef]
- Maggiore, S.; Gallanti, M.; Grattieri, W.; Marino, A. Analisi ed Evoluzione Negli anni delle Curve di Carico dei Clienti Domestici. Energia Elettrica. Available online: https://www.researchgate.net/publication/273119076_Analisi_ed_evoluzione_negli_anni_delle_curve_di_carico_dei_clienti_domestici (accessed on 11 September 2022).
- Terna. Documento di Descrizione Degli Scenari 2019. 2019. Available online: https://www.terna.it/it/sistema-elettrico/rete/piano-sviluppo-rete/scenari (accessed on 20 July 2021).
- Commune di Procida, Piano d’Azione per l’Energia Sostenibile (PAES)-Procida. 2015. Available online: http://www.comune.procida.na.it/index.php?action=index&p=597 (accessed on 11 September 2022).
- JRC. PVGIS. 2020. Available online: http://re.jrc.ec.europa.eu/pvg_tools/en/tools.html (accessed on 1 June 2020).
- ARERA. Relazione Annuale Sullo Stato dei Servizi e Sull’attività Svolta-Volume 1. Available online: https://www.arera.it/it/relaz_ann/19/19.htm (accessed on 11 September 2022).
- ACER PUBLISHES ITS FINAL Assessment of the EU Wholesale Electricity Market Design. Available online: https://www.acer.europa.eu/events-and-engagement/news/press-release-acer-publishes-its-final-assessment-eu-wholesale (accessed on 7 September 2022).
- GSE. Rapporto Statistico-Solare Fotovoltaico. 2019. Available online: https://www.gse.it/documenti_site/Documenti%20GSE/Rapporti%20statistici/Solare%20Fotovoltaico%20-%20Rapporto%20Statistico%202019.pdf (accessed on 11 September 2022).
- Schmidt, O.; Melchior, S.; Hawkes, A.; Staffell, I. Projecting the Future Levelized Cost of Electricity Storage Technologies. Joule 2019, 3, 81–100. [Google Scholar] [CrossRef]
- Zinaman, O.R.; Bowen, T.; Aznar, A.Y. An Overview of Behind-the-Meter Solar-Plus-Storage Regulatory Design: Approaches and Case Studies to Inform International Applications; National Renewable Energy Lab. (NREL): Golden, CO, USA, 2020. [Google Scholar] [CrossRef]
- Tsiropoulos, I.; Tarvydas, D.; Lebedeva, N. Li-ion Batteries for Mobility and Stationary Storage Applications–Scenarios for Costs and Market Growth; Publications Office of the European Union: Luxembourg, 2018. [Google Scholar]
- EASE. Storage Technologies Description. 2020. Available online: https://ease-storage.eu/energy-storage/technologies/ (accessed on 11 September 2022).
- IRENA. Electricity Storage and Renewables: Costs and Markets to 2030; International Renewable Energy Agency: Abu Dhabi, United Arab Emirates, 2017. [Google Scholar]
- Sylfen. At the Heart of Sylfen’s Innovation Is a Reversible Electrolyzer. Available online: https://sylfen.com/en/technology/ (accessed on 23 July 2021).
- Luca, G.D. “Il Fotovoltaico in Italia: Dal GSE il Rapporto Statistico 2019,” BibLus-net, 25 June 2020. Available online: https://biblus.acca.it/rapporto-gse-del-solare-fotovoltaico-2019/ (accessed on 2 September 2022).
- Energy Efficiency Directive. Available online: https://energy.ec.europa.eu/topics/energy-efficiency/energy-efficiency-targets-directive-and-rules/energy-efficiency-directive_en (accessed on 30 August 2022).
- Directive 2012/27/EU of the European Parliament and of the Council of 25 October 2012 on Energy Efficiency, Amending Directives 2009/125/EC and 2010/30/EU and Repealing Directives 2004/8/EC and 2006/32/EC Text with EEA Relevance, vol. 315. 2012. Available online: http://data.europa.eu/eli/dir/2012/27/oj/eng (accessed on 30 August 2022).
- Hayes, B.P. Distributed Generation and Demand Side Management: Applications to Transmission System Operation; University of Edinburgh: Edinburgh, Scotland, 2013. [Google Scholar]
Publisher’s Note: MDPI stays neutral with regard to jurisdictional claims in published maps and institutional affiliations. |
© 2022 by the authors. Licensee MDPI, Basel, Switzerland. This article is an open access article distributed under the terms and conditions of the Creative Commons Attribution (CC BY) license (https://creativecommons.org/licenses/by/4.0/).