Article

Research on Vehicle Aerodynamics and Thermal Management Based on 1D and 3D Coupling Simulation

State Key Laboratory of Automotive Simulation and Control, Jilin University, Changchun 130022, China
*
Author to whom correspondence should be addressed.
Energies 2022, 15(18), 6783; https://doi.org/10.3390/en15186783
Submission received: 17 August 2022 / Revised: 4 September 2022 / Accepted: 8 September 2022 / Published: 16 September 2022

Abstract

:
In order to ensure the full heat dissipation of heat exchangers, the opening of the grille should be large, which increases the wind drag of the whole vehicle. Most of the research on the grille only focuses on its impact on the heat dissipation of the engine compartment; there is little research on its influence on the performance of the thermal management system, because it is difficult to solve the real-time data interaction of different dimensional models. So we established the 1D and 3D strong coupling model. The biggest difference from other 1D and 3D coupling models is that we can use the interfaces reserved by the two kinds of software to realize real-time data interaction, and simultaneously analyze the 1D thermal management performance and 3D flow field and temperature field of the engine components. The coupling model is used to study three heat balance conditions. The results show that the heat-sinking capability of the cooling system is the worst under the climbing condition; and the refrigeration capacity of the air-conditioning system is the worst under the idling condition. According to the heat balance results and evaluation index priorities, we determine the simulation process. In this article, first the upper grille is gradually closed; then the flow field, temperature field and evaluation indexes are studied through the strong coupling model to obtain the analysis results of the upper grille; then based on the results, the lower grille is gradually closed, and the analysis results of the lower grille are obtained in the same way. The final simulation results show that on the premise of ensuring the performances of engine cooling system and air conditioning refrigeration system, the air drag coefficient is reduced by 17.5 counts compared with the original vehicle.

1. Introduction

1.1. Research Background and Significance

With the rapid development of China’s automobile industry and improvement in automobile ownership, people are paying more attention to the problems of energy and environmental pollution caused by cars. Automobile thermal management is considered one of the key technologies for automobile development in the 21st century, and it is an important means to realize energy conservation and emission reductions in automobiles [1]. At the same time, the improvement of the vehicle aerodynamic performance is also one of the effective ways to improve the fuel economy of the vehicle. Aerodynamic resistance occupies a large part of vehicle resistance when the vehicle is running at high speed, which greatly increases the energy consumption of the vehicle [2]. The internal flow resistance, which is a part of the aerodynamic resistance, is generated by the air flow in the engine compartment and ventilation of the passenger compartment, which is closely related to the thermal management of the engine compartment. Sufficient air inflow of the heat exchanger is required to meet the heat exchange demand of the thermal system, which is bound to increase the internal flow resistance. In order to solve the contradiction between the heat dissipation of the engine compartment and air resistance of the whole vehicle, the grille of the vehicle plays a key role in balancing the air resistance and vehicle thermal management performance.

1.2. Research on Thermal Management Simulation Methods

One-dimensional and 3D simulations are important technical methods in automobile thermal management, but their research emphases are different. One-dimensional simulation is effective for evaluating thermal system integration. Whereas 3D simulation is good at showing the influence of component position and structure on performance. As the mainstream method of thermal management research, 1D and 3D co-simulation combines their respective advantages, which can not only reflect the impact of component location and structure on performance, but also be used to study system-level-related performance [3]. Galindo compared the computational cost of a full 3D calculation of a research object with that of 1D and 3D coupling, and the results showed that the calculation resources of the full 3D calculation were almost 20 times that of the 1D and 3D coupling calculation [4]. Zhang established a flow field model of a 3D engine compartment and 1D cooling system model by using KULI and STAR-CCM+. The flow field of the engine compartment was obtained by the STAR-CCM+; then, the velocity distribution on the radiator surface was taken as the boundary condition of the 1D simulation [5]. Wang built a co-simulation model of MATLAB and Fluent, and a 1D model through MATLAB to realize the dynamic interaction of 1D model and 3D model data [6]. Lu proposed a characterization method of the coupling factor that could reduce the dimension of the 3D model to realize a 1D and 3D coupling simulation, and then analyzed and optimized the thermal management performance of the whole vehicle [7]. He et al. studied the influence of grille opening and closing on system aerodynamic resistance and the engine cooling system by 1D and 3D software weak coupling [8]. In order to solve the problems of engine outlet water high temperature at rated power conditions, 1D and 3D co-simulation tools were used to analyze the characteristics of heat dissipation in the engine compartment and performance of the cooling system, respectively. At the same time, appropriate measures for improvement to avoid the thermal reflow phenomenon in a commercial vehicle engine compartment were proposed [9]. Considering the attractive appearance and reduction of aerodynamic drag, an increasing number of electric vehicles adopt the closed front grille, which causes insufficient intake air by the condenser and weakens the heat exchange performance of the condenser. By identifying a new intake air passage between the front cabin and condenser, the heat exchange performance of the condenser was improved [10]. Lu connected the system control model to the underhood computational fluid dynamics (CFD) model by the coupling thermal transmission equation. The research results indicated that this integrated control analysis model showed excellent capability, which contributed to solving the design, analysis and optimization problems for vehicle thermal management [11]. 3D CFD technology takes a long time to solve the problem. At present, many research studies are being conducted on the meshless approach [12,13] and 1D and 3D co-simulation. There are two ways to express the category of co-simulation. First, the degree of co-simulation: a strong degree of co-simulation means that the two kinds of software can transfer data to each other, and a more accurate result can be obtained through the continuous iteration of the data; weak co-simulation often means that the data transmission is one-way or manual two-way. The second is the master and slave division of one-dimensional and three-dimensional software; the standard for distinguishing them is usually based on the thermal management problems to be solved; 1D is dominant in that it takes the 1D system as the main object to study the corresponding system matching and control strategies; generally, 3D results are input into the 1D system by a weak co-simulation; 3D is dominant and the strong or weak combination method is adopted to make the 3D boundary conditions more accurate so as to achieve a more accurate heat flow field. In this study, a 1D engine cooling model and air conditioning model are built and calculated using the Amesim simulation platform, and the 3D engine compartment model is simulated with STAR-CCM+ simulation software. Amesim and STAR-CCM + are both simulation software of Siemens. The former is a 1D modeling and simulation platform for multiple systems, and the latter is a 3D fluid analysis and simulation software. Because they belong to the same company, they have a specialized module for the interactive transfer of data between them. We use the method of “Libcosim” to define the corresponding variables to carry out the co-simulation between 1D and 3D.

1.3. Research on the Influence of the Grille on Aerodynamic and Thermal Management Performance

The design and development of automobile front-end styling needs to strike a balance between multiple performance and styling objectives [14]. It not only needs to ensure sufficient air intake to meet the heat dissipation demand of the system, but also needs to minimize the impact on air resistance and meet the modeling requirements, which has attracted a large number of scholars at home and abroad carrying out corresponding research [15]. Charnesky et al. took the aerodynamic characteristics of the vehicle as the breakthrough point; through simulation analysis and experimental research, the influence of the two states of a fully open and fully closed grille on aerodynamic characteristics was obtained, and the research of the influence of the grille opening control on thermal management was also introduced [16]. Juan presented the use of CFD as a simulation tool to investigate and assess various factors that affect the underhood cooling airflow. Specifically, the impact of the front-end cooling module configuration (fan, fan shroud, heat exchangers) on cooling airflow and fan torque was closely examined [17]. Liu et al. studied the effects of the closing of the grille and position of the upper and lower grille on the aerodynamic drag and heat rejection of the engine compartment [18]. Wang et al. studied the influence of the bus side wall grille on the thermal environment of the engine compartment [19]. Xia aimed at the lack of flow at the bottom and both sides of the condenser; by optimizing the grille, the air intake was increased and the lack of flow was reduced [20]. Ding et al. built a CFD simulation model for the automobile front-end design. The model supported styling replacement and fine adjustment of the grille texture, which provided the basis for the design of front-end styling [21]. Heinzelmann and Chang studied the effects of grille opening and closing and different grille styling on the aerodynamic characteristics and heat rejection performance of the cooling module [22,23]. Jilin University carried out CFD simulations on the specific parameters and forms of the grille, and summarized the influence of specific grille parameters on the vehicle drag coefficient and mass flow [24]. Kim et al. used the parametric research method to numerically design the grille opening shape of small passenger cars, and analyzed the effects of these key parameters on aerodynamic resistance and the inlet mass flow of the grille [25]. Liu et al. used the CFD method to analyze the separation of air flow at the bottom of the heat exchanger and near the air inlet grille and found it was not conducive to heat rejection. They installed a deflector at the front end of the grille. Through the test, it was proven that the air inlet volume of the heat exchanger was significantly increased and the water outlet temperature of the engine was reduced [26]. A 3D computational model was proposed to investigate the flow and heat transfer characteristics of the intake grilles of two different fuel cell vehicles [27].
With the development of automobile electrification, active air intake grille technology came into being. Wang et al. established the demand model of vehicle heat dissipation and multi-opening control model of the active grille air shutter (AGS) to realize its multi-opening control [28]. Guy Larose et al. studied different types of vehicles equipped with an active grille, and the results showed that the aerodynamic revenue index of different vehicles was different. When there was a crosswind impact, the aerodynamic revenue was affected; and when there was no crosswind impact, the aerodynamic revenue reached the maximum [29]. Cho et al. studied a certain type of SUV equipped with an active grille, analyzed the influence of the active grille on the air flow at the rear and bottom of the vehicle, studied the aerodynamic and heat dissipation characteristics of the whole vehicle under different grille opening conditions, comprehensively considered the driving state of the vehicle, and formulated the active grille control logic and verified it [30]. Kong et al. mainly studied the opening and closing state of the intake grille and its influence on the main aerodynamic characteristics of automobiles in complex conditions such as meeting and overtaking [31]. Dang’s research showed that with the same grille opening, the volume of front-end airflow could be increased by changing the vane angle. In addition, the airflow for different vane angles were compared and the reason for the change in airflow was analyzed [32]. The active grille shutter control strategies and its matching control strategies with the fan speed are widely studied. The active grille can achieve different opening and closing degrees under different working conditions, so as to maximize the heat rejection performance of the cooling system, reduce wind resistance and improve fuel economy [33,34,35,36]. In many studies, a multi-step active grille shutter (AGS) was evaluated since it offered advantages such as a reduction in the vehicle drag coefficient and a quicker engine warm-up thanks to the reduction in air flow through the front end of the vehicle toward the engine compartment [37,38,39,40].
By analyzing the research status around the world in recent years, it can be concluded that most of the research on the grille only focuses on its impact on aerodynamic characteristics and engine compartment heat dissipation, and rarely combines it with the performance of the thermal management system. Based on the above analysis, the research methods and contents of this paper are as follows:
  • Firstly, the Amesim is used to model the 1D cooling system and air conditioning system, and then STAR-CCM++ is used to build the 3D vehicle simulation model. Based on the joint module and data interface between the two kinds of software, the 1D and 3D joint simulation model is built.
  • According to the national standards GB/T12534 and GB/T12542-2009, three heat balance simulation conditions are determined, and the evaluation indexes of the cooling system, air conditioning system, and vehicle aerodynamic performance are given. The corresponding priority regulations of the evaluation indexes are put forward. Then, the three heat balance conditions are simulated and analyzed in combination with the evaluation indexes. The results obtained will be used for subsequent simulations.
  • Different sealing methods for the grille are proposed to study the balance between vehicle aerodynamic performance and thermal management performance. First, according to the aerodynamic performance improvement potential of the upper grille and lower grille and the results of the previous heat balance conditions, the simulation analysis process of the grille schemes is established. Then according to the evaluation indexes priority, the grille schemes are analyzed and evaluated. Finally, the grille scheme with comprehensive aerodynamic performance and thermal management performance is obtained.

2. Model Introduction

The co-simulation model that we built includes the 1D system part and 3D vehicle part. The two models, which are of different dimensions, transmit data interactively in real time through the interface to realize strong coupling. The combined model can describe the 3D flow field, temperature field and 1D system parameters under different working conditions.

2.1. 1D Model

The 1D simulation model is built by the Amesim simulation platform. The 1D model includes the engine cooling system and air conditioning system. For 1D aspects, we focus on the average temperature of the passenger compartment; therefore, we attach importance to the modeling of the passenger compartment.
The passenger compartment model is simplified, and only the influential factors such as the vehicle speed, convection heat exchange of the inside and outside of the cabin and solar radiation intensity are considered. The Amesim can calculate the average temperature of the passenger compartment model based on the following assumptions:
(1)
All the walls of the passenger compartment are represented by equivalent wall surfaces. Instead of considering the actual temperature distribution of each wall, the lumped average parameters are adopted;
(2)
Except for the outlet of the passenger compartment, there is no air leakage in other forms in the whole vehicle.
The following heat balance equation is established for the passenger compartment:
d T w d t = Q s Q ext Q int m c p ,
where, T w represents the wall temperature of the passenger compartment (K); m c p represents the heat capacity of the passenger compartment (J/K); Q s represents the solar radiation heat load (W); Q ext represents the convective heat transfer outside the passenger compartment (W); Q int represents the convective heat transfer (W) inside the passenger compartment.

2.2. 3D Model

We used STAR-CCM+ to establish the 3D thermal management model of the whole vehicle, including a radiator, a condenser and a fan. The selection of the turbulence model is very important for 3D modeling. The k - ε two-equation turbulence model has good robustness, economy and produces reasonable predictions of large-scale turbulence, so it is very popular in flow and heat transfer simulation. It is a semi-empirical model. In the derivation of the model, it is assumed that the flow is completely turbulent and the influence of molecular viscosity can be ignored. Therefore, the k - ε model is more suitable for complete turbulence. As the advantages and disadvantages of the k - ε model are gradually known, some measures have been made to improve its performance. So the realizable k-ε model was selected in this study. We used the model for automotive CFD simulation, and compared it with the k-ε model; it can better simulate the complex airflow in the engine compartment by considering factors such as rotation and curvature.
During the numerical simulation of CFD, it is necessary to set appropriate boundary conditions to obtain the solution of the problem. Therefore, we describe the boundary conditions involved in the CFD simulation, mainly including external boundary conditions and internal boundary conditions. The specific settings are shown in Table 1.
The volume mesh was completed by STAR-CCM+. Here, the trimmed mesher was used to divide the flow field as a whole. Different prismatic grids were used to simulate the movement of airflow near the autobody surface and internal parts of the engine compartment. The number of the volume mesh was adjusted by changing the basic size of it. For example, the basic size of the radiator is 3 mm, and the basic size of the air domain is 0.1 m. According to a large number of volume mesh quantity tests, it is found that when the total number of volume meshes exceeds 16 million, the residual error of the simulation results is less than 10−4. So the final total number of the volume mesh was about 16.24 million. Figure 1 and Figure 2, respectively, show the volume mesh division of the whole vehicle computing domain in the y = 0 m section and the volume mesh division in the engine compartment. Figure 2b is the enlarged part in the red box of Figure 2a. In Figure 1 and Figure 2, the blank space represents the components, and the mesh part represents the fluid computing domain.

2.3. 1D and 3D Co-Simulation

During the co-simulation, two kinds of software were used to carry out the simulation calculation at the same time. At each sampling time, the results calculated by the two kinds of software in the previous time step interacted with each other to update the initial state of the two models in the next time step, so as to realize the iterative process of the data.
In Figure 3, we show the data interaction process of the co-simulation. It is mainly composed of three parts, the 1D part, 3D part, and transfer variables between 1D and 3D; and the broken lines with arrows indicate the module and direction of the variables transfer.

3. Evaluation of the Vehicle Thermal Management System and Thermal Balance Performances Analysis

3.1. Basic Vehicle Information

Table 2 introduces the basic vehicle information, including vehicle size and mass, engine characteristics, tire size, cooling and refrigeration medium and other relevant parameters.

3.2. Working Condition Definition

Refer to the GB/T 12534-90 Motor vehicles-general rules of the road test method and the GB/T12542-2009 thermal balance capacity on-road test methods for motor vehicles. We selected three working conditions as the simulation evaluation conditions, which are the idling condition, climbing condition and high-speed condition. The specific parameters of the heat balance working conditions are shown in Table 3.

3.3. Evaluation Indexes and Priority

For the engine cooling system, we used the allowable ambient temperature for the evaluation.
T = T e n v + ( T L T w _ o u t ) ,
where, T env —the ambient temperature (°C); T L —the boiling point of the coolant (°C), according to the property of the coolant, T L = 115   ° C ; T w _ o u t —coolant temperature of the radiator inlet during the vehicle heat balance (°C).
The cooling system needs to work at an ambient temperature lower than the allowable ambient temperature. Since the ambient temperature is 35 °C, the allowable ambient temperature should be higher than 35 °C to ensure that the cooling system does not fail. The higher the allowable ambient temperature, the higher the ambient temperature that the cooling system can withstand, that is, the better the cooling capacity of the cooling system.
For the air conditioning system, we took the mean temperature of the passenger compartment as the index to evaluate its refrigeration capacity, and the refrigeration coefficient, namely COP as the corresponding economic evaluation index. The definition of the refrigeration coefficient is shown in Formula (3).
ε = q c W
where, ε —the refrigeration coefficient COP; q c —the refrigerating capacity of the evaporator (kW), W —the power consumption of the compressor (kW).
The aerodynamic performance of the whole vehicle is mainly evaluated according to the air drag coefficient C D .
With reference to QC/T658-2000 and the relevant refrigeration capacity design requirements of the air conditioning system of the enterprise, in this study, the average temperature of the passenger compartment was used as the evaluation index of the temperature characteristics of the passenger compartment.
In order to better analyze, evaluate and compare each scheme by evaluation indexes, the priority of the evaluation indexes were specified. The specific contents are as follows:
  • Give priority to ensure that the vehicle cooling system and air conditioning system do not fail, that is, the allowable ambient temperature is higher than the ambient temperature, and the average temperature of the passenger cabin is lower than the ambient temperature.
  • The priority of the engine cooling system is higher than that of the air conditioning refrigeration system, that is, the margin requirements for the allowable ambient temperature should be bigger than the margin requirements of the average temperature of the passenger compartment.
  • In the premise of ensuring the above requirements, pursue better aerodynamic performance of the whole vehicle.
  • Under the requirements of the above premise, pursue better economy of the air conditioning system.

3.4. Analysis of the Results of Thermal Balance Conditions

3.4.1. Results Analysis of the Cooling System

Figure 4 shows the comparisons of coolant of the temperature of the radiator inlet and the corresponding allowable ambient temperature under different driving conditions. According to the coolant temperature of the radiator inlet shown in Figure 4 and Formula (2), the allowable ambient temperature under corresponding working conditions can be calculated. The allowable ambient temperature under the climbing condition was the lowest, which was 43.14 °C, and the allowable ambient temperature under the climbing condition was 50.17 °C, while the allowable ambient temperature under the idle condition was the highest, which was 61.59 °C. So the heat dissipation condition of the vehicle cooling system was the worst under the climbing condition.

3.4.2. Results Analysis of the Air Conditioning System

Figure 5 shows the comparisons of the average temperature of the passenger compartment, power consumption of the compressor and refrigeration capacity of the evaporator under different driving conditions. As shown, under idling, climbing and high-speed conditions, the average temperature of the passenger compartment is 32, 22.8 and 22.3 °C, respectively, which indicates that the cooling capacity of the air conditioning system was the worst under the idling condition; the power consumption of the compressor was 0.88, 2.32 and 2.57 kW, respectively; the refrigerating capacity of the evaporator was 2.52, 5.645 and 5.46 kW, respectively. According to the evaporation capacity of the evaporator, the power consumption of the compressor and Formula (3), the COP of idling, climbing and high speed were 2.87, 2.43 and 2.57, respectively.

3.4.3. Comparative Analysis of Coupling Simulation Value and Experimental Value

This section verifies the simulation results of the heat balance experiments. The difference rate refers to the relative error between the simulation value and experimental value. See Table 4 for details.
By comparing the experiment data with the simulation results, certain differences between the two results can be found. For the differences between the simulation and experiment results, they were mainly caused by the following two reasons:
  • For 1D models, the wall surface of the passenger compartment is regarded as a whole, and the material properties of each wall surface and the air leakage in the passenger compartment are not considered. Therefore, there are certain errors in the simulation calculation results.
  • The 3D simulation model is simplified for the interior of the engine room, neglecting the harness, pipes and other small components, which is different from the actual engine room structure.

4. Simulation Results Analysis of Grille Closure Schemes

The simulation analysis flow of the grille closure schemes is shown in Figure 6.
The grille of this vehicle is shown in Figure 7. As shown, it is divided into upper grille and lower grille, and the area of the upper grille is smaller.

4.1. Simulation Analysis of the Upper Grille Schemes

4.1.1. Determination of the Upper Grille Closure Schemes

As can be seen in Figure 7, the shape of the upper grille is symmetrically distributed left and right. In view of its shape characteristics and referring to its relative position with the heat exchanger, we determined the closed mode of traveling from both sides to the middle. The closure schemes of the upper grille are shown in Figure 8. In scheme 1, the outer side of the upper grille is closed; in scheme 2, the upper grille is completely closed.

4.1.2. Analysis of the Upper Grille Schemes under Climbing Condition

Table 5 shows the difference rate of the allowable ambient temperature of the cooling system between each scheme and the original vehicle. The difference rate is the relative error reference to the original scheme. The data show that the allowable ambient temperature of scheme 1 was 43.09 °C. For scheme 2, the allowable ambient temperature was 40.77 °C. Compared with scheme 1, scheme 2 produced a lower allowable ambient temperature of the vehicle and weakened the performance of the vehicle’s cooling system.
Figure 9 shows the comparisons of the radiator inlet mass flow under different schemes. As shown, the mass flow of scheme 1 and scheme 2 was slightly higher and lower than that of the original vehicle, respectively. Further, Figure 10a shows that the air flow from the outside of the upper grille into the engine compartment deviated from the heat exchanger and basically does not flow to the heat exchanger. In addition, from Figure 11, closing the outside of the upper grille increases the pressure in front of the inlet of inner side for the upper grille, and the pressure difference between the inlet and outlet of the air flow inside for the upper grille increases. Therefore, the mass flow of scheme 1 has increased. According to Figure 12b, most of the air flow introduced from the inside of the upper grille is guided by the upper washing air introduced by the lower grille to bypass the radiator, so the reduction inlet flow of the radiator is not obvious in scheme 2.
Figure 13 shows the inlet temperature of the radiator under different grille closure schemes. As shown, the intake air temperature of scheme 1 is basically the same as that of the original vehicle, while the temperature of scheme 2 increased by 2.03 °C. In Figure 14, for scheme 1, because the inside of the upper grille is not closed, the fresh air introduced through it is enough to maintain the temperature in front of the radiator consistent with the original vehicle, while in scheme 2, the fresh air cannot enter the engine compartment through the upper grille; the fan sucks the hot air in the engine compartment through the radiator, causing the inlet temperature of the radiator to rise. The inlet air flow of the upper grill is subjected to the upwashing effect of the inlet air flow of the lower grill, so that it does not efficiently participate in the heat exchange process of the condenser and the radiator, but overflows from the top with the upwashing air flow of the lower grill in the original scheme, so the inlet air temperature of the radiator in scheme 2 does not increase significantly compared with the original scheme.
It can be concluded that for scheme 2, the intake air temperature of the radiator was high, resulting in the decrease of the cooling capacity of the cooling system and the low allowable ambient temperature.

4.1.3. Analysis of the Upper Grille Schemes under Idle Condition

The air conditioning performance parameters of the passenger compartment between the schemes and the original vehicle are shown in Table 6. The data show that the average temperature of the passenger compartment increased slightly compared with the original vehicle in scheme 1 and scheme 2, and they only increased by 0.1 °C and 0.38 °C, respectively. The differences are very small, indicating that the two schemes of the upper grille closure had little impact on the average temperature of the passenger compartment. In addition, the refrigeration coefficient of the two schemes decreased to a certain extent compared with the original vehicle. The refrigeration coefficient of Scheme 1 was 2.75 and scheme 2 was 2.49. Both schemes caused the economic deterioration of the air-conditioning system. Scheme 2 has a deeper impact on the air conditioning system economy.
Figure 15 shows the comparisons of the condenser inlet flow under different upper grille closure schemes. The inlet flow of the upper grille was 0.32 kg/s and 0.319 kg/s, respectively in scheme 1 and scheme 2, which is very small compared with the original vehicle. From Figure 16, we observed that in scheme 1, after the outside of the upper grille is closed, the low-speed vortex appeared on one side in front of the heat exchanger, and the other side changed little, while the flow rate in the middle part increased, and the hot gas back-flow phenomenon on both sides intensified; in scheme 2, all the upper grilles were closed, and the airflow velocity in front of the heat exchanger was relatively uniform; under the idling condition, the airflow in the engine compartment was mainly sucked by the cooling fan; when the upper grilles were closed, the fan no longer introduced fresh air from the outside of the grilles, but drew air from the inside of the engine compartment, which led to further aggravation of the hot gas backflow; therefore, the intake air flow of the condenser does not change greatly.
Figure 17 shows the comparisons of the condenser inlet temperature under different upper grille schemes. The data show that the condenser inlet temperature of scheme 1 and scheme 2 showed a rising trend compared with the original vehicle. The temperature difference between scheme 1 and scheme 2 was 1.87 °C and 6.21 °C, respectively. As shown from the temperature field of section z = 0.44 m in Figure 18, in scheme 1, due to the closure of the outside of the upper grille, the external cooling air flow could enter the engine compartment through it, resulting in a rise in the temperature. In scheme 2, because the upper grille is completely closed, the external fresh air could not enter the engine compartment through the upper grille, and the heat accumulated continuously in the engine compartment, which caused its temperature to rise significantly. Moreover, when the upper grille was closed, the fan did not introduce fresh air from the upper grille, but extracted high-temperature air from the engine compartment, which led to a further increase in the inlet temperature of the condenser.
Figure 19 shows the comparisons of evaporator cooling capacity and compressor power consumption under different schemes. The refrigerating capacity of schemes 1 and 2 was lower than that of the original vehicle, and the power consumption of the compressor was higher than that of the original vehicle. The degree of change in scheme 2 was higher than that of scheme 1.

4.1.4. Summary and Analysis

This section summarizes the performance changes of the vehicle cooling system under the climbing condition and air conditioning under idling condition, as well as the air resistance coefficient. The specific results are shown in Table 7. For scheme 2, the drag coefficient was only 1.5 counts lower than that of scheme 1, but the allowable ambient temperature was reduced by 5.4%, that is, the cooling capacity was greatly affected in scheme 2. To sum up, on the basis of scheme 1, the lower grille continues to be improved.

4.2. Simulation Analysis of the Lower Grille Schemes

4.2.1. Determination of Closure Schemes of Lower Grille

The position of the heat exchanger is to the right, to minimize the impact on the thermal management system. We started plugging the lower grille from the left side, and then plugged the lower grille from both sides to the middle. The lower grille closure schemes are shown in Figure 20: in scheme 1, a part of the left side are closed; (b) in scheme 2, partially of both sides are closed; in scheme 3, based on scheme 2, the right side are further closed.

4.2.2. Analysis of Lower Grille Schemes under Climbing Condition

Table 8 introduces the comparisons of the allowable ambient temperature under the climbing condition when the lower grille closure schemes are different. The data show that the allowable ambient temperature of the cooling system in scheme 1 was 42.66 °C, with the smallest decline; and in scheme 3, the cooling system was the most seriously affected, with the allowable ambient temperature of 35.79 °C, only 0.79 °C higher than the ambient temperature.
The comparisons of the radiator inlet mass flow under different grille closure schemes is shown in Figure 21. The mass flow of scheme 1, scheme 2 and scheme 3 was slightly higher than that of the original vehicle by 0.012, 0.013 and 0.002 kg/s, respectively. The velocity fields of the 0.08 m section are shown in Figure 22. In scheme 1, the closure grille does not hinder the airflow on the windward surface of the radiator; moreover, due to the reduction of the opening of the grille, the velocity of air flow into the engine compartment increased, resulting in the increase of the inlet mass flow of the radiator. Scheme 2 also reflects the increase in air velocity, which leads to the increase mass flow on the air side of the radiator. In scheme 3, the closure of the grille caused the air flow contraction; when the air flow reached the windward surface of the radiator, it did not completely cover the windward surface of the radiator; in addition, under the positive influence of the increase in the velocity of air flow, the change of mass flow on the air side of the radiator was not obvious compared with that of the original vehicle.
Figure 23 reflects the inlet temperature of the radiator under different lower grille closure schemes. The data show that the air inlet temperature of the radiator was 53.44 °C in scheme 1, and the temperature of schemes 2 and 3 increased in varying degrees and the inlet temperature was 55.56 and 58.68 °C, respectively. From Figure 23, it can be concluded that with the continuous increase of the closure degree of the lower grille, the overall temperature of the engine compartment rose to varying degrees in different schemes. As can be seen from Figure 24, for schemes 2 and 3, due to the shielding of the closed grille on the windward surface of the radiator, the hot air flow in the engine compartment was introduced into the radiator, resulting in the rise of the inlet temperature of the radiator.

4.2.3. Analysis of Lower Grille Schemes under Idle Condition

Table 9 shows the temperature difference rate between the schemes and original vehicle. The data show that the average temperature of the passenger compartment increased to varying degrees in each scheme compared with the original vehicle. The temperature was 32.73 °C in scheme 1, which was 2.25% higher than that of the original vehicle, while the average temperature of the passenger compartment had reached 35.32 °C in scheme 3, which exceeded the ambient temperature of 35 °C. These results indicate that the air conditioning system had failed in scheme 3. In addition, compared with the original vehicle, the COP of the air conditioning system showed a step-by-step decline in the three lower grille closure schemes. Among them, the COP of scheme 3 was the lowest, which has been as low as 1.20, and the reduction rate was high at 57.99% compared with the original vehicle, which has the most serious impact on the economy of the air conditioning system.
Figure 25 shows the comparisons of the condenser inlet mass flow under different grille closure schemes. The inlet mass flow of each scheme increased to a certain extent, but the difference from the original vehicle was no more than 0.005 kg/s. As shown in Figure 26, the air flow was mainly drawn by the fan under the idle condition. In schemes 1 and 2, with the continuous increase of the closed area of the grille, the air flow at the grille accelerates due to the reduction of the interval, and the engine compartment upper airflow was continuously supplemented to the radiator due to the suction effect of the fan, resulting in the increase of the overall intake flow. In scheme 3, the excessive blocking of the lower grille, and the weak air supplement phenomenon resulting in the lower intake flow in scheme 3 than schemes 1 and 2.
The comparisons of the condenser inlet temperature under different lower grille closure schemes is shown in Figure 27. The data show that the inlet air temperature of the condenser in the three schemes was higher than that in the original vehicle. The temperature differences between each scheme and the original vehicle were 11.09, 18.44 and 26.07 °C, respectively. As shown in Figure 28, with the continuous closure of the lower grille, the overall temperature of the engine compartment increased. Because there is only the suction effect of the fan under the idle condition, the temperature of the engine compartment was more sensitive to the change in the grille under the idle condition. In addition, the high temperature air flow in the engine compartment driven by the fan can flow into the condenser, resulting in a further increase in the inlet temperature of the condenser.
In different schemes, the change of condenser inlet air mass flow was not obvious compared with the original vehicle, but the change of inlet air temperature was very significant. When the inlet temperature of the condenser rose, the refrigerating capacity of the evaporator and the power consumption of the compressor under different schemes changed accordingly. The results are shown in Figure 29.

4.2.4. Summary and Analysis

The evaluation indexes were integrated and analyzed in detail. The results of each index are shown in Table 10. The average temperature of the passenger compartment reached 35.32 °C in scheme 3, which exceeds the ambient temperature by 0.32 °C. Therefore, scheme 3 is no longer involved in the subsequent analysis, but the comparative analysis of scheme 1 and scheme 2.
According to the priority order of evaluation indexes proposed above, scheme 1 and scheme 2 were analyzed. Based on the above analysis, it can be concluded that for scheme 2, although the allowable ambient temperature was high, it still meets the performance requirements of the automobile cooling system and leaves a certain margin. However, the automobile aerodynamic performance of scheme 2 was significantly improved compared with scheme 1, and had little impact on the performance of the air conditioning system. To sum up, we chose scheme 2 as the improvement scheme of the lower grille.

5. Summary and Prospect

5.1. Summary

In this paper, three kinds of thermal balance conditions and system performance indexes were determined firstly based on the 1D and 3D co-simulation model of vehicle thermal management. Then simulation analysis on the three working conditions was carried out. Based on the analysis results, the thermal management system was studied from the structural side. On the structural side, the balance between the aerodynamic and thermal management performance of the vehicle was studied with the grille as the object. The main work content and conclusions are summarized as follows:
(1)
Based on the joint module between STAR-CCM + and Amesim, a 1D and 3D co-simulation model of the whole vehicle was built with the heat exchanger as the joint objective, which solved the problem of unclear boundary conditions of the heat exchanger in the previous 1D and 3D co-simulation, and provided a simulation basis for the subsequent analysis.
(2)
Refer to the GB/T 12534-90 Motor vehicles-general rules of road test method and the GB/T12542-2009 thermal balance capacity on-road test methods for motor vehicles. We selected three working conditions as the simulation evaluation conditions. After simulating three heat balance conditions, the cooling and air conditioning system of 1D part was analyzed and evaluated. The results show that the cooling system performance was the worst under the climbing condition; the average temperature of the passenger compartment was the highest under the idle condition and the performance of the air conditioning system was the worst under this condition. The simulation results provided a working condition basis for subsequent analysis and evaluation.
(3)
In the upper grille schemes, the air drag coefficient of scheme 1 decreased by 4.6 counts, and the allowable ambient temperature and average temperature of the passenger compartment did not change significantly. Compared with scheme 1, scheme 2 showed little improvement in aerodynamic performance, but the allowable ambient temperature decreased significantly. According to the evaluation index, scheme 1 was determined as the basic scheme for the improvement of the lower grille.
(4)
In the lower grille schemes, scheme 3 did not meet the performance requirements of the automobile cooling system or the air conditioning system, while scheme 2 had a more obvious improvement in aerodynamic performance on the premise of ensuring the cooling performance and air conditioning performance compared with scheme 1. The air drag coefficient of scheme 2 is 17.5 counts lower than that of the original vehicle, which greatly improved the aerodynamic performance of the vehicle.

5.2. Prospect

We comprehensively analyzed, evaluated and optimized the thermal management and aerodynamic performances of the whole vehicle through 1D and 3D co-simulation, which provided a reference for the early design of the vehicle. However, due to the limited research resources and time, there were still several shortcomings that needed to be explored and improved upon in the follow-up:
  • In order to save computational resources, we ignored the harness, nut and other small components inside the engine room. In the future, we should further improve the modeling accuracy.
  • The 1D model only builds a complete engine cooling system and automobile air conditioning system, and does not model and analyze the supercharged intercooling system. In the future, the thermal management system can be improved, so as to more comprehensively evaluate the performance of the whole vehicle.
  • In this paper, the radiation heat exchange with the surrounding environment was not considered in the 3D simulation, and the thermal characteristics of the solid should subsequently be taken into account to evaluate the thermal damage of the internal parts of the engine compartment.

Author Contributions

Y.Z. improved the experimental ideas and analyzed the experimental results; J.J. improved the experimental ideas, carried out theoretical analysis and experimental simulations, and wrote this paper; G.W. put forward ideas and provided theoretical guidance. J.Z. and Y.J. provided a lot of the software technical support. All authors have read and agreed to the published version of the manuscript.

Funding

This research was funded by The National Key Research and Development Program of China (2018YFA0703300) and National Natural Science Foundation of China (11702109).

Institutional Review Board Statement

Not applicable.

Informed Consent Statement

Not applicable.

Data Availability Statement

Not applicable.

Conflicts of Interest

The authors declare no conflict of interest.

References

  1. Garimella, S.V.; Fleischer, A.S.; Murthy, J.Y. Thermal Challenges in Next-Generation Electronic Systems. IEEE Trans. Compon. Packag. Technol. 2008, 31, 801–815. [Google Scholar] [CrossRef]
  2. Hunt, S.W.; Odhams, A.; Roebuck, R.L. Parameter measurement for heavy-vehicle fuel consumption modelling. Proc. Inst. Mech. Eng. Part D 2011, 225, 567–589. [Google Scholar] [CrossRef]
  3. Gao, Q.; Qian, Y. Methodology for Thermal Analysis of Multi-system in Engine Underhood. Chin. J. Automot. Eng. 2012, 2, 8–15. [Google Scholar]
  4. Galindo, J.; Tiseira, A.; Fajardo, P. Coupling methodology of 1D finite difference and 3D finite volume CFD codes based on the Method of Characteristics. Math. Comput. Model. 2011, 54, 1738–1746. [Google Scholar] [CrossRef]
  5. Zhang, J.; Chen, Y.; Sun, Y. Analysis on Flow Field and Cooling System Performance of SUV Engine Room. Tract. Fram. Transp. 2015, 3, 46–49. [Google Scholar]
  6. Wang, G.; Gao, Q.; Zhang, T. A Simulation Approach of Under-hood Thermal Management. Adv. Eng. Softw. 2016, 100, 43–52. [Google Scholar] [CrossRef]
  7. Lu, P.; Gao, Q. The simulation methods based on 1D/3D collaborative computing for the vehicle integrated thermal management. Appl. Therm. Eng. 2016, 104, 42–53. [Google Scholar] [CrossRef]
  8. Chang, H.; Yu, X.; Lv, J.H. Investigation on the Effects of Intake Grill in the Performance of Cooling Module Under Vehicle Working Conditions. Open Mech. Eng. J. 2014, 8, 121–124. [Google Scholar] [CrossRef]
  9. Chang, J. Study on Aerodynamic Characteristics of Passenger Car based on Shape of Front Grille. Master’s Thesis, Jilin University, Changchun, China, 2015. [Google Scholar]
  10. Kim, J.M.; Kim, K.M.; Ha, S.J. Grille Design for Passenger Car to Improve Aerodynamic and Cooling Performance Using CFD Technique. Int. J. Automot. Technol. 2016, 17, 967–976. [Google Scholar] [CrossRef]
  11. Lu, P.; Gao, Q. Numerical Calculation Method of Model Predictive Control for Integrated Vehicle Thermal Management Based on Underhood Coupling Thermal Transmission. Energies 2019, 12, 259. [Google Scholar] [CrossRef]
  12. Rakhsha, M.; Kees, C.E.; Negrut, D. Lagrangian vs. Eulerian: An Analysis of Two Solution Methods for Free-Surface Flows and Fluid Solid Interaction Problems. Fluids 2021, 6, 460. [Google Scholar] [CrossRef]
  13. Moraes, P.G.; Alcântara Pereira, L.A. Surface Roughness Effects on Flows Past Two Circular Cylinders in Tandem Arrangement at Co-Shedding Regime. Energies 2021, 14, 8237. [Google Scholar] [CrossRef]
  14. Singh, R.; Shen, F. CFD-based Robust Optimization of Front-end Cooling Airflow. SAE Trans. 2007, 116, 33–39. [Google Scholar]
  15. Kim, J.; Cho, H.; Kim, T. A Numerical Study of the Effect of Small Passenger Car’s Grille Shape on the Aerodynamic Performance. Trans. Korean Soc. Automot. Eng. 2015, 23, 74–87. [Google Scholar] [CrossRef]
  16. Charnesky, S.; Fadler, G. Variable and Fixed Airflow for Vehicle Cooling. SAE Int. J. Mater. Manuf. 2011, 4, 1286–1296. [Google Scholar] [CrossRef]
  17. Juan, T. Investigation, and Assessment of Factors Affecting the Underhood Cooling Air Flow Using CFD; SAE Technical Papers; SAE International: Rosemont, IL, USA, 2008. [Google Scholar]
  18. Liu, C. Research on the Aerodynamic Characteristics of Passenger Car Based on Air-Inlet Grille. Master’s Thesis, Wuhan University of Technology, Wuhan, China, 2017. [Google Scholar]
  19. Wang, J.; Zhang, C.; Zhang, C. Effect of bus side grill on engine underhood thermal environment. J. Jilin Univ. Eng. Technol. Ed. 2012, 42, 563–568. [Google Scholar]
  20. Xia, G.; Tao, Q.; Xue, Z. The Effect Front Grille for Engine Room Thermal Analysis; China SAE: Beijing, China, 2011. [Google Scholar]
  21. Ding, W.; Williams, J.; Karanth, D. CFD application in automotive front-end design. SAE Trans. 2006, 115, 244–252. [Google Scholar]
  22. Heinzelmann, B.; Indinger, T.; Adams, N. Experimental and Numerical Investigation of the Under Hood Flow with Heat Transfer for A Scaled Tractor-Trailer. SAE Int. J. Commer. Veh. 2012, 5, 42–56. [Google Scholar] [CrossRef]
  23. Liu, C.; Duan, M.; Mo, Y. Influence and Optimization of Intake Air in Engine Front Compartment Based on a Certain Vehicle Model. J. Wuhan Univ. Technol. Transp. Sci. Eng. 2018, 42, 757–760. [Google Scholar]
  24. Gong, C.; Shen, J.; Yu, Y. Heat dissipation characteristic in the intake grille and radiator of a fuel cell vehicle. Int. J. Green Energy 2020, 12, 591–601. [Google Scholar] [CrossRef]
  25. He, D.; Liao, B.; Yang, Y. Effect of AGS Based on CFD-Kuli Coupling Method on Vehicle Aerodynamic Resistance and Heat Dissipation. J. Chongqing Inst. Technol. Nat. Sci. Ed. 2017, 12, 53–57. [Google Scholar]
  26. Guo, J.; Luo, R.; Wang, Z. Test and 1D /3D Co-simulation of Thermal Management for a Commercial Vehicle Engine Compartment. Chin. J. Constr. Mach. 2016, 4, 526–530. [Google Scholar]
  27. Ding, L.; Zheng, Y. Study on Air-Conditioning Refrigeration Performance of Electric Vehicle Based on Flow Field Optimization. In Lecture Notes in Electrical Engineering; Springer: Singapore, 2021; Volume 646, pp. 1–12. [Google Scholar]
  28. Wang, W. Modeling of Multi-opening Control for Active Induction Grille Based on Central Composite Design. Automot. Eng. 2015, 11, 1240–1245. [Google Scholar]
  29. Larose, G.; Belluz, L.; Whittal, I.; Belzile, M.; Klomp, R.; Schmitt, A. Evaluation of the Aerodynamics of Drag Reduction Technologies for Light-duty Vehicles: A Comprehensive Wind Tunnel Study. SAE Int. J. Passeng. Cars-Mech. Syst. 2016, 9, 772–784. [Google Scholar] [CrossRef]
  30. Cho, Y.-C.; Chang, C.-W.; Shestopalov, A.; Tate, E. Optimization of Active Grille Shutters Operation for Improved Fuel Economy. SAE Int. J. Passeng. Cars-Mech. Syst. 2017, 10, 563–572. [Google Scholar] [CrossRef]
  31. Kong, D. Effect of Active Grille Shutter on Dynamic Characteristics of Hybrid Vehicle. Master’s Thesis, Shandong University, Jinan, China, 2019. [Google Scholar]
  32. Dang, Y.; Qin, P. Numerical Study on Influence of Active Shutter Vane Angle on Vehicle Front-End Airflow. Chin. J. Automot. Eng. 2021, 11, 313–319. [Google Scholar]
  33. Liu, C.; Zhang, R.; Duan, M. A Study on the Matching of Air Inlet Grille Angle and Cooling Fan Speed in a Car. Automot. Eng. 2019, 41, 388–394. [Google Scholar]
  34. Liu, C.; Wang, Z.; Fan, C. A Joint Control Strategy for Automobile Active Grille Shutter and Cooling Fan. Int. J. Automot. Technol. 2021, 22, 1675–1682. [Google Scholar] [CrossRef]
  35. Li, J.C.; Deng, Y.D.; Wang, Y.P. CFD-Based research on control strategy of the opening of Active Grille Shutter on automobile. Case Stud. Therm. Eng. 2018, 12, 390–395. [Google Scholar] [CrossRef]
  36. Lafossas, F.; Wissen, R.V.; Mohammadi, A. Evaluation of Fuel Economy Potential of an Active Grille Shutter by the Means of Model Based Development Including Vehicle Heat Management. SAE Int. J. Engines 2015, 8, 2394–2401. [Google Scholar]
  37. Shigarkanthi, V.; Damodaran, V.; Soundararaju, D.; Kanniah, K. Application of Design of Experiments and Physics Based Approach in the Development of Aero Shutter Control Algorithm; SAE Technical Paper; SAE International: Rosemont, IL, USA, 2011. [Google Scholar]
  38. El-Sharkawy, A.E.; Kamrad, J.C.; Lounsberry, T.H. Evaluation of impact of active grille shutter on vehicle thermal management. SAE Int. J. Mater. Manuf. 2011, 4, 1244–1254. [Google Scholar] [CrossRef]
  39. Mustafa, R.; Schulze, M.; Eilts, P. Improved energy management using engine compartment encapsulation and grille shutter control. SAE Int. J. Fuels Lubr. 2012, 5, 803–812. [Google Scholar] [CrossRef]
  40. Pfeifer, C. Evolution of Active Grille Shutters; SAE Technical Paper; SAE International: Rosemont, IL, USA, 2014. [Google Scholar]
Figure 1. Volume mesh division of the overall computing domain at the y = 0 m section.
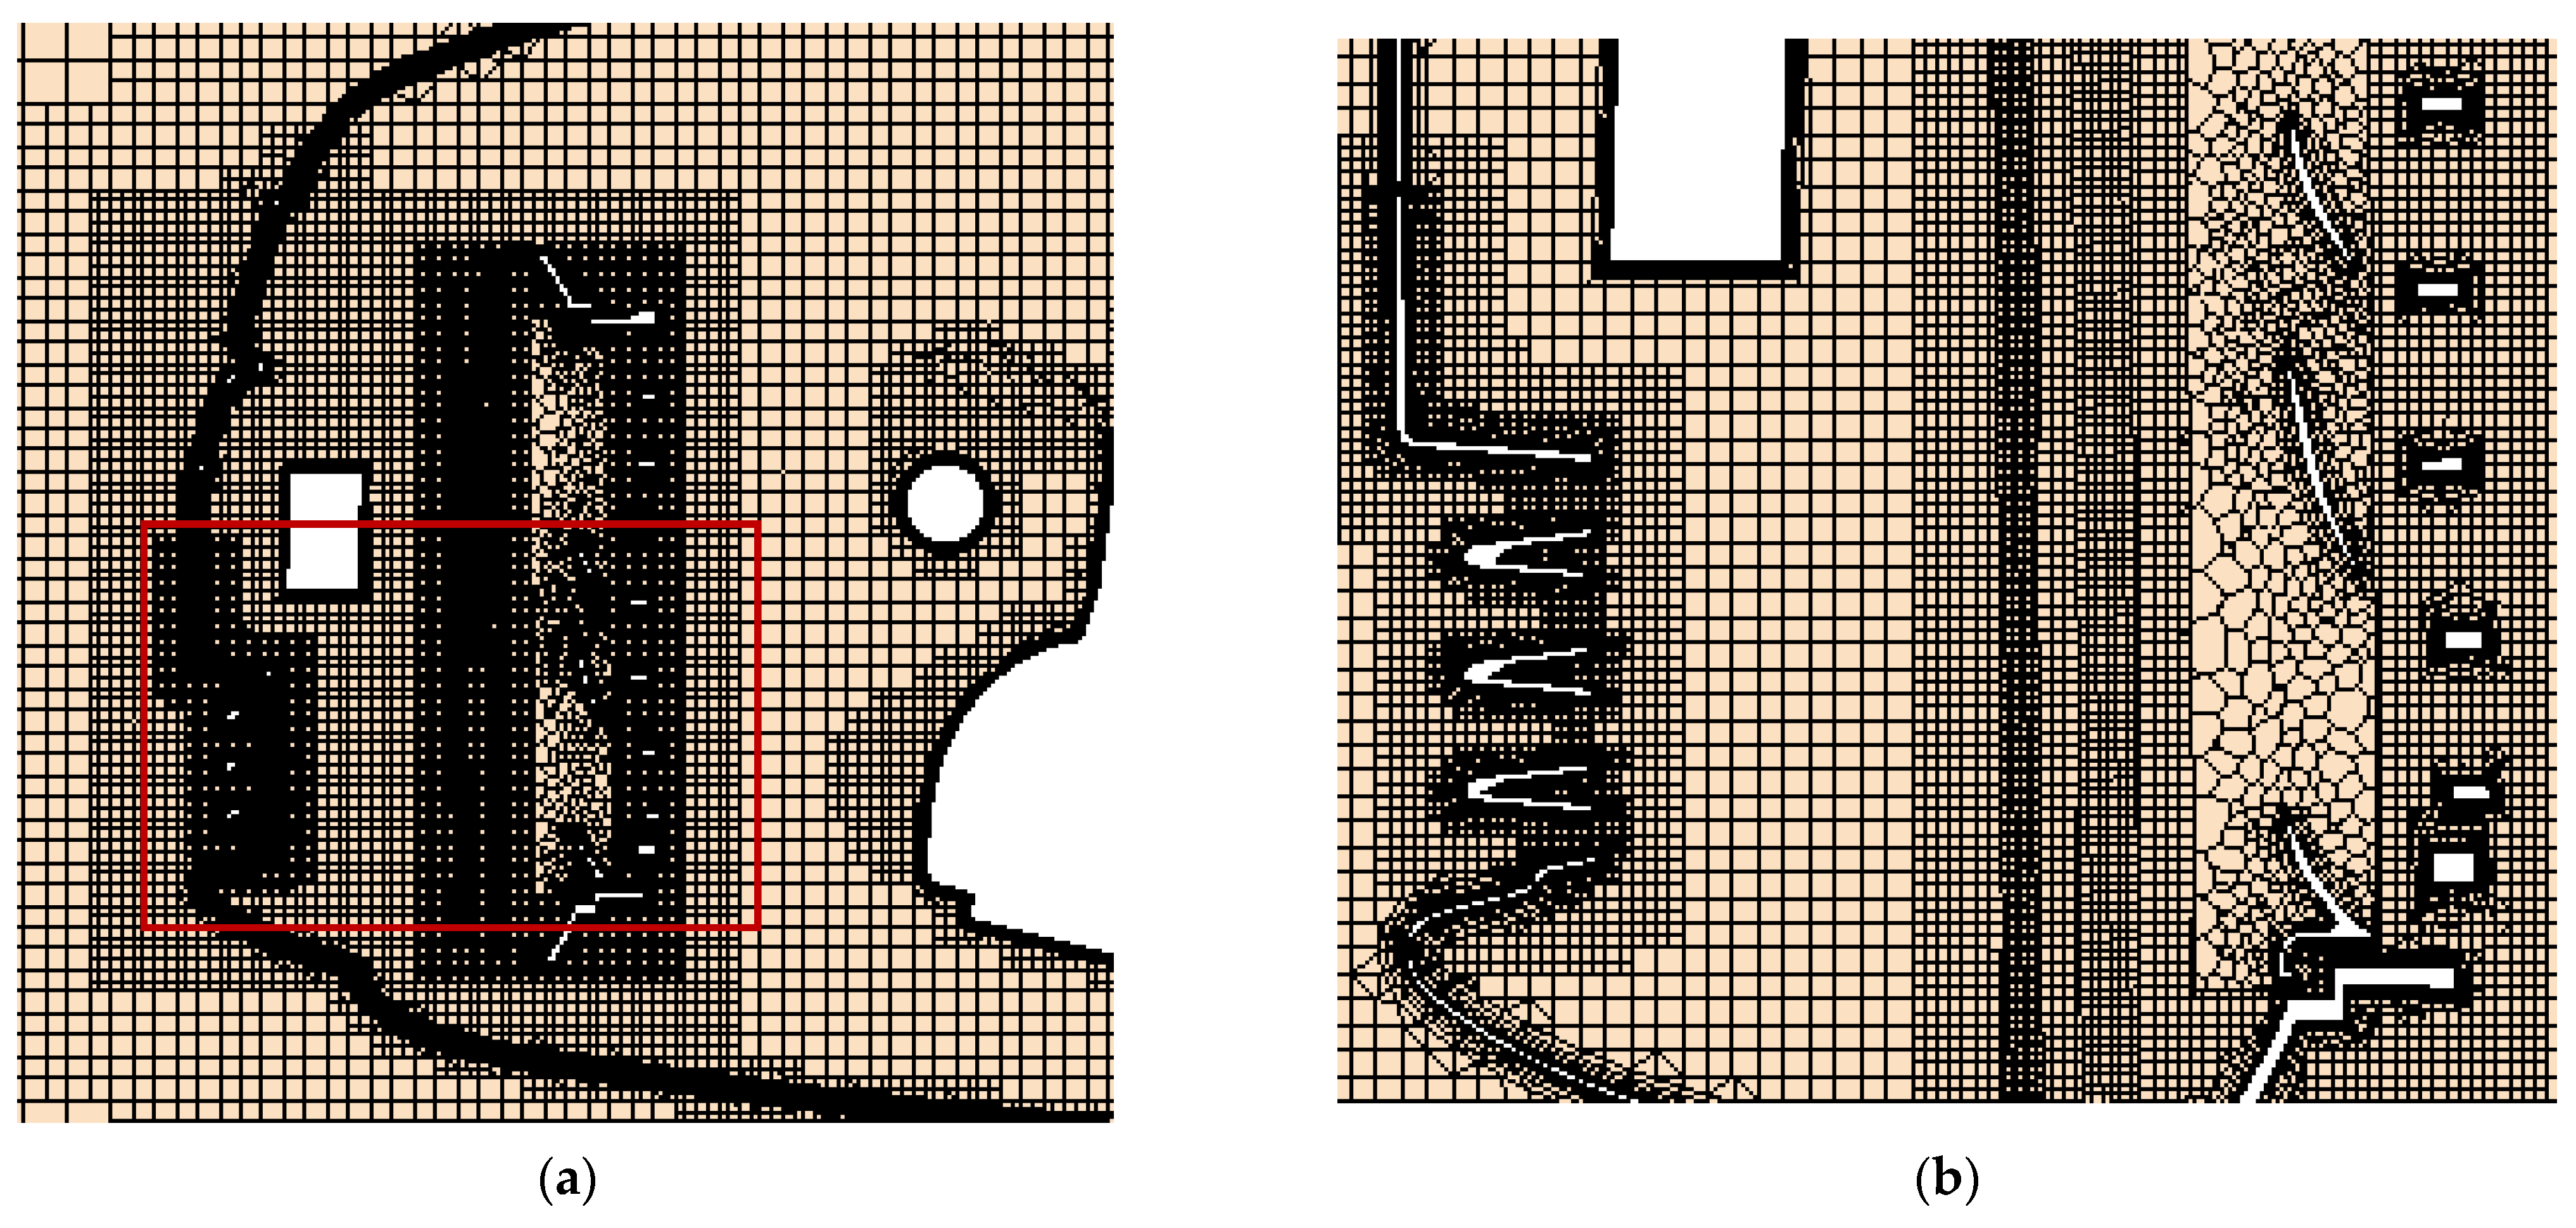
Energies 15 06783 g001
Figure 2. Volume mesh division of the engine compartment: (a) engine compartment at the y = 0 m section; (b) the enlarged part in the red box.
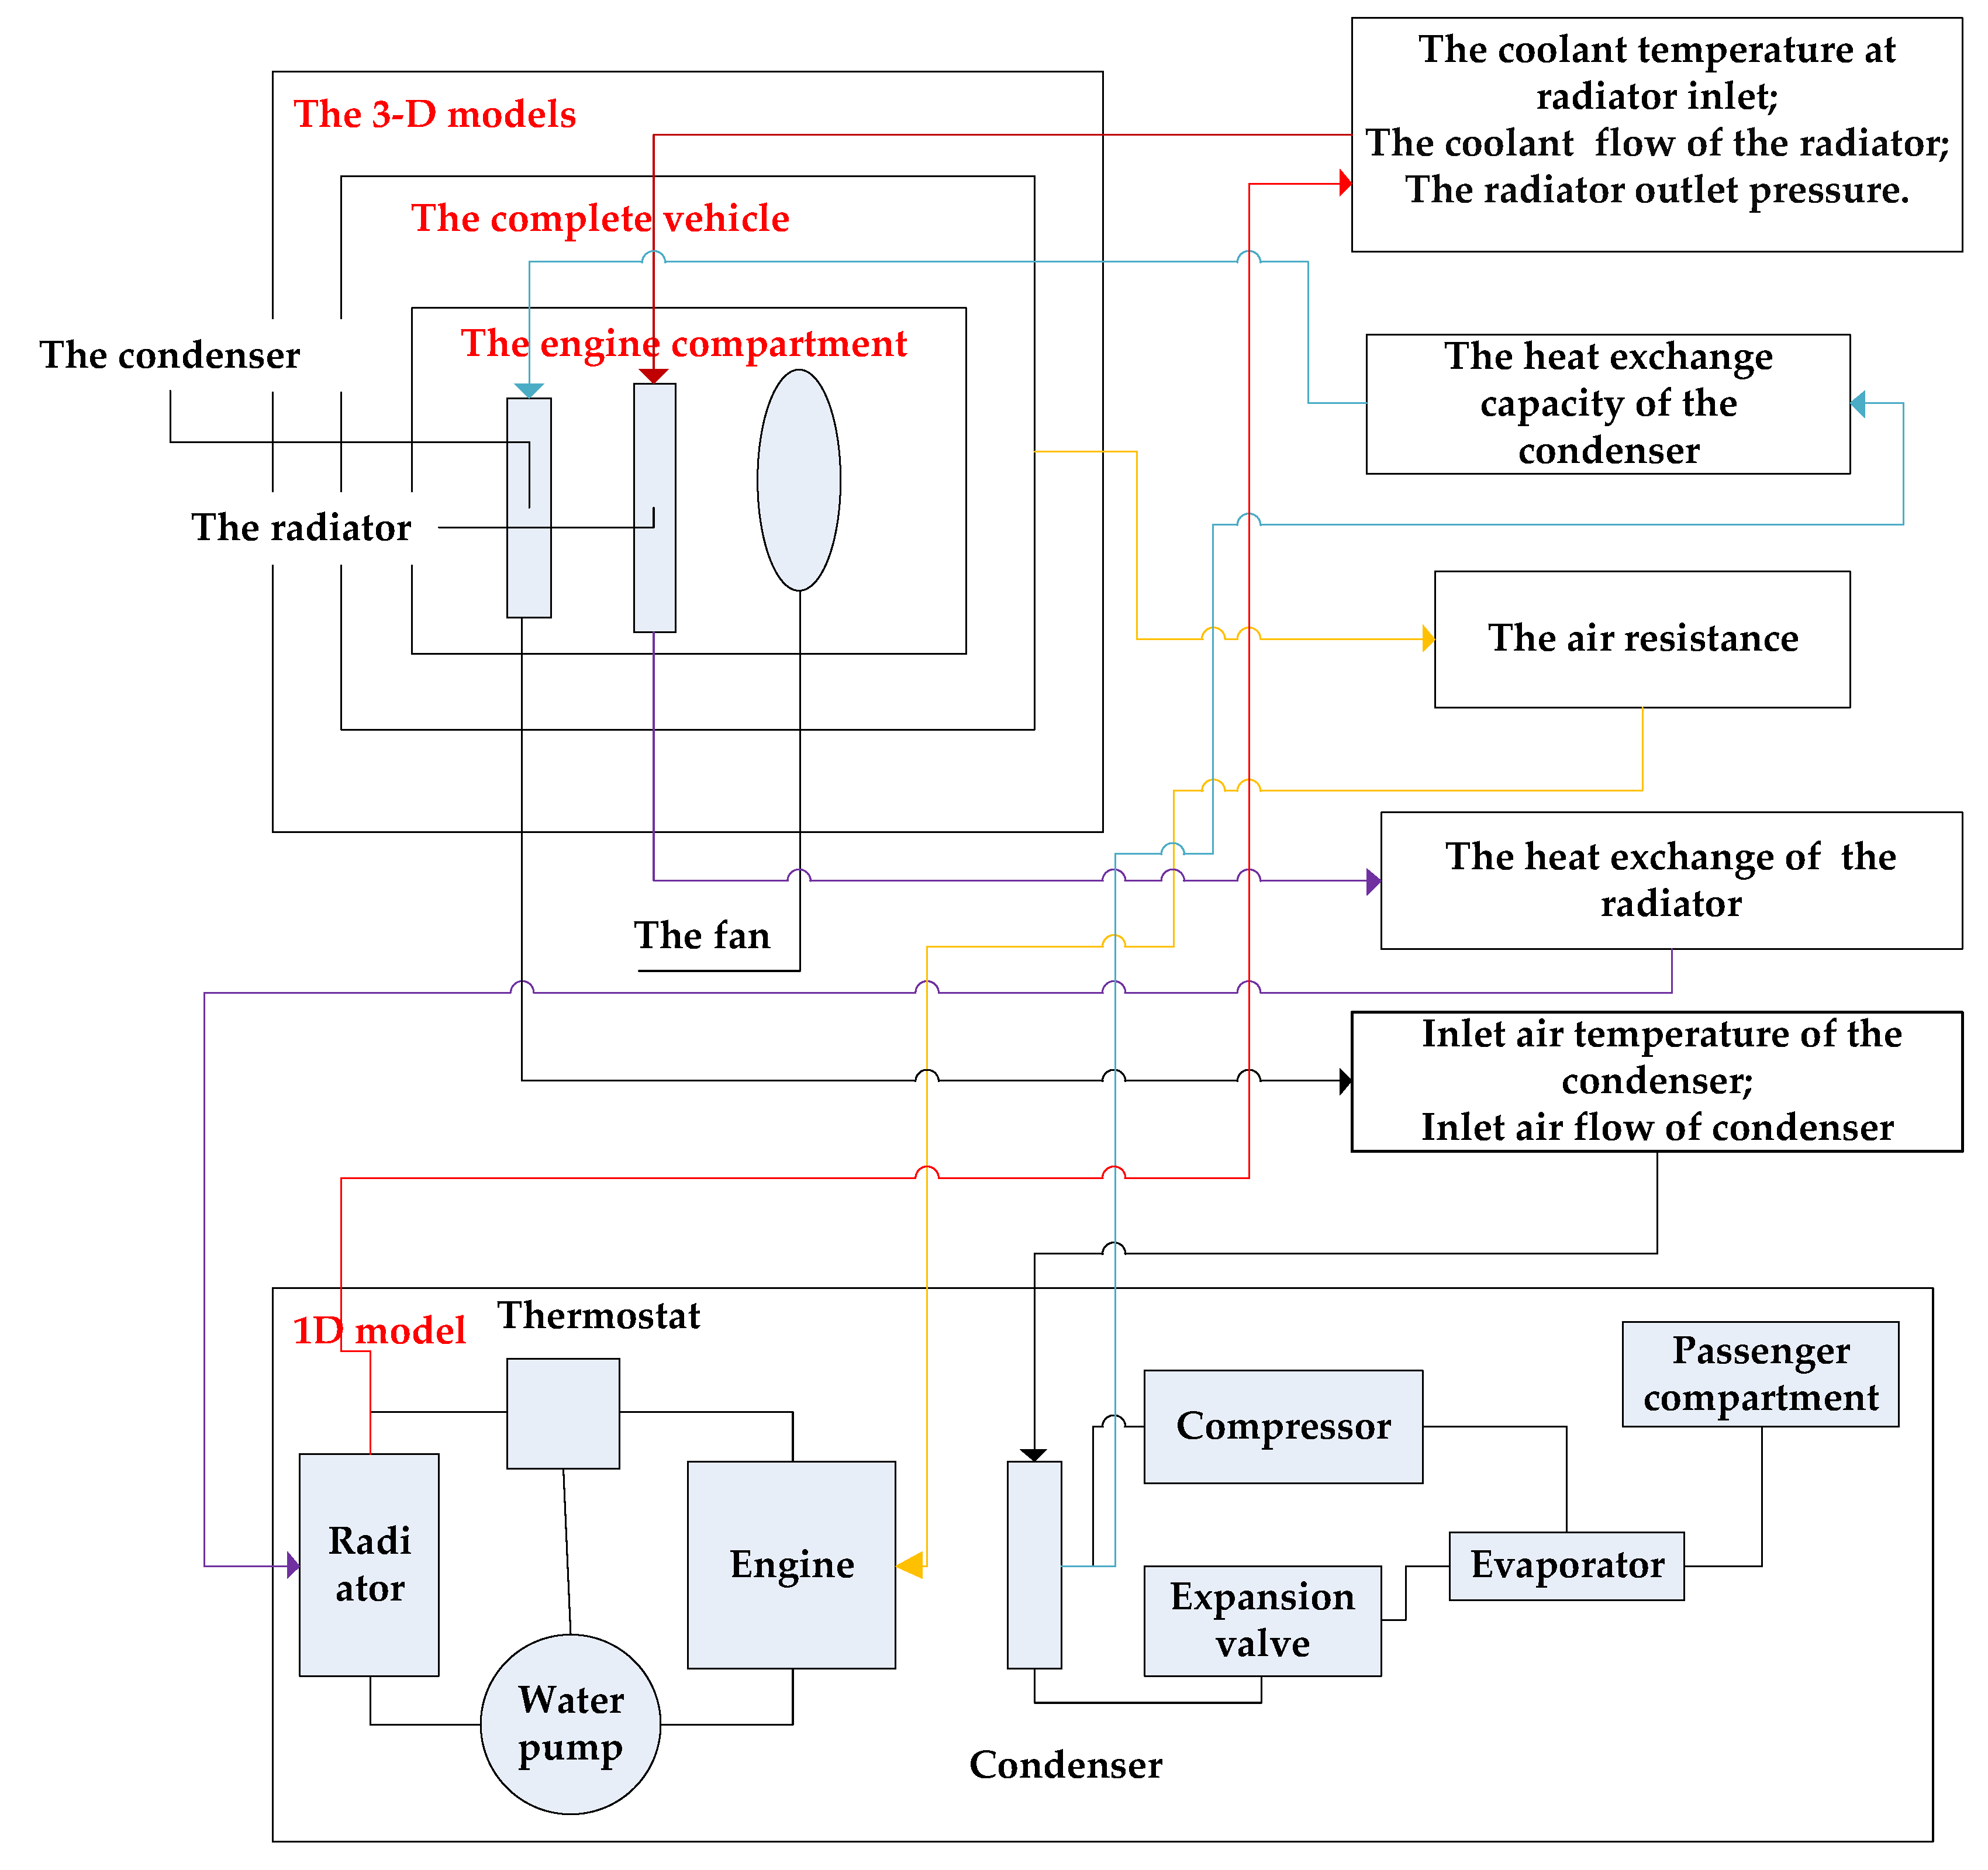
Energies 15 06783 g002
Figure 3. Schematic diagram of data transmission.
Energies 15 06783 g003
Figure 4. Comparisons of coolant temperature of radiator inlet and allowable ambient temperature under different working conditions.
Energies 15 06783 g004
Figure 5. Comparisons of the refrigerating capacity of evaporator, power consumption of compressor and average temperature of passenger compartment under different working conditions.
Energies 15 06783 g005
Figure 6. Simulation analysis flow of grille schemes.
Energies 15 06783 g006
Figure 7. The front view of vehicle.
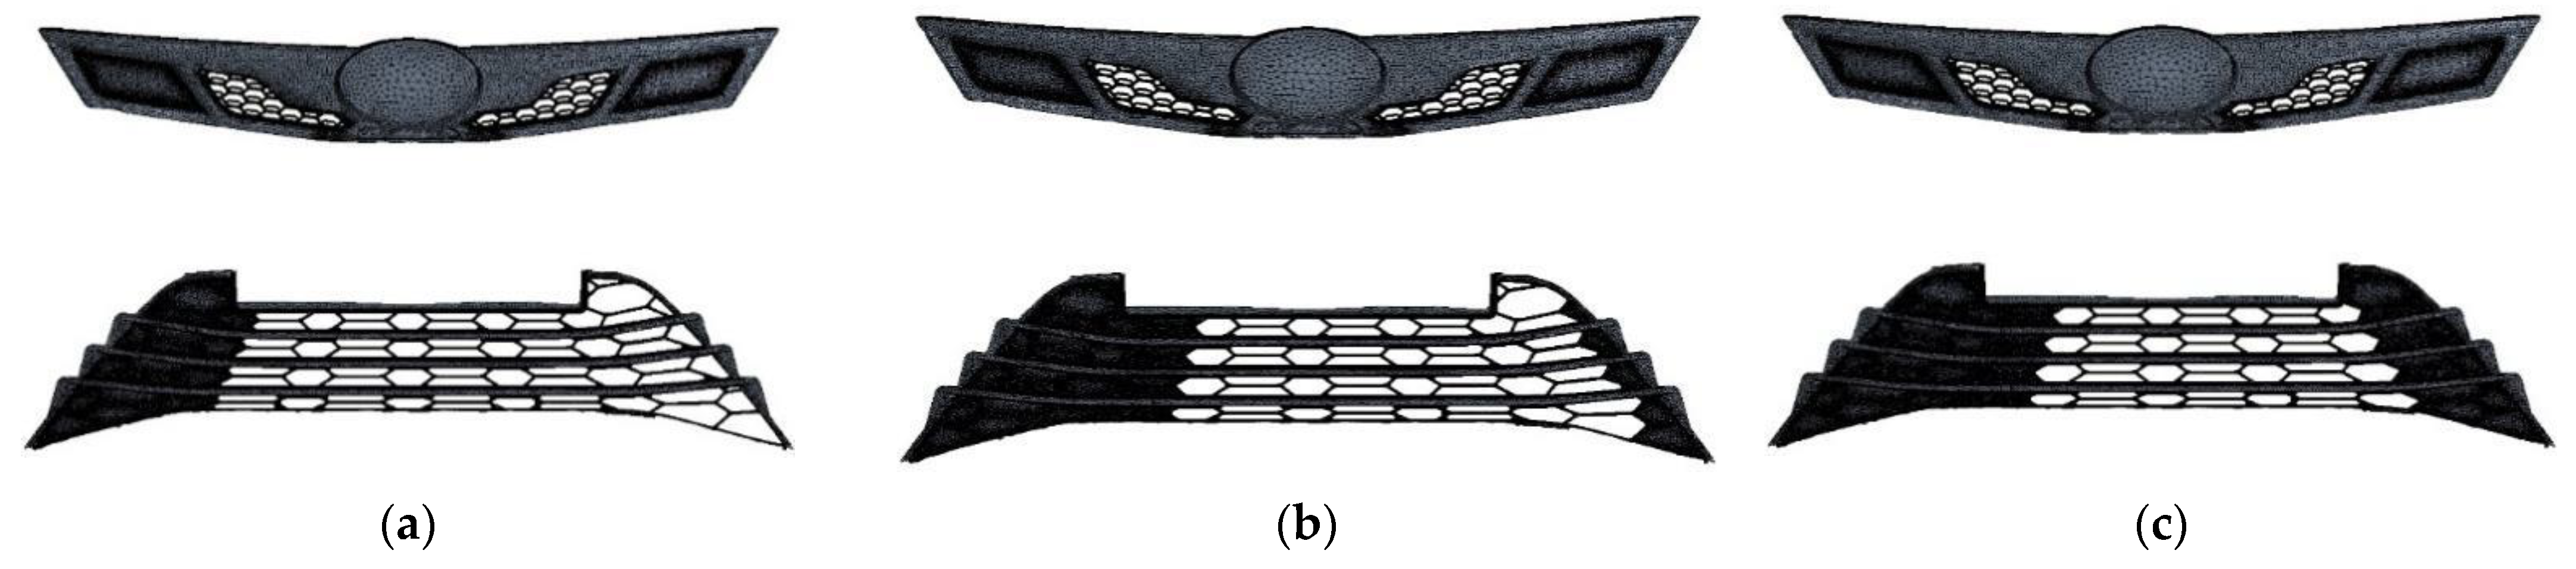
Energies 15 06783 g007
Figure 8. Closure schemes of the upper grille: (a) scheme 1; (b) scheme 2.
Energies 15 06783 g008
Figure 9. Comparisons of intake air mass flow of radiator under different upper grille schemes.
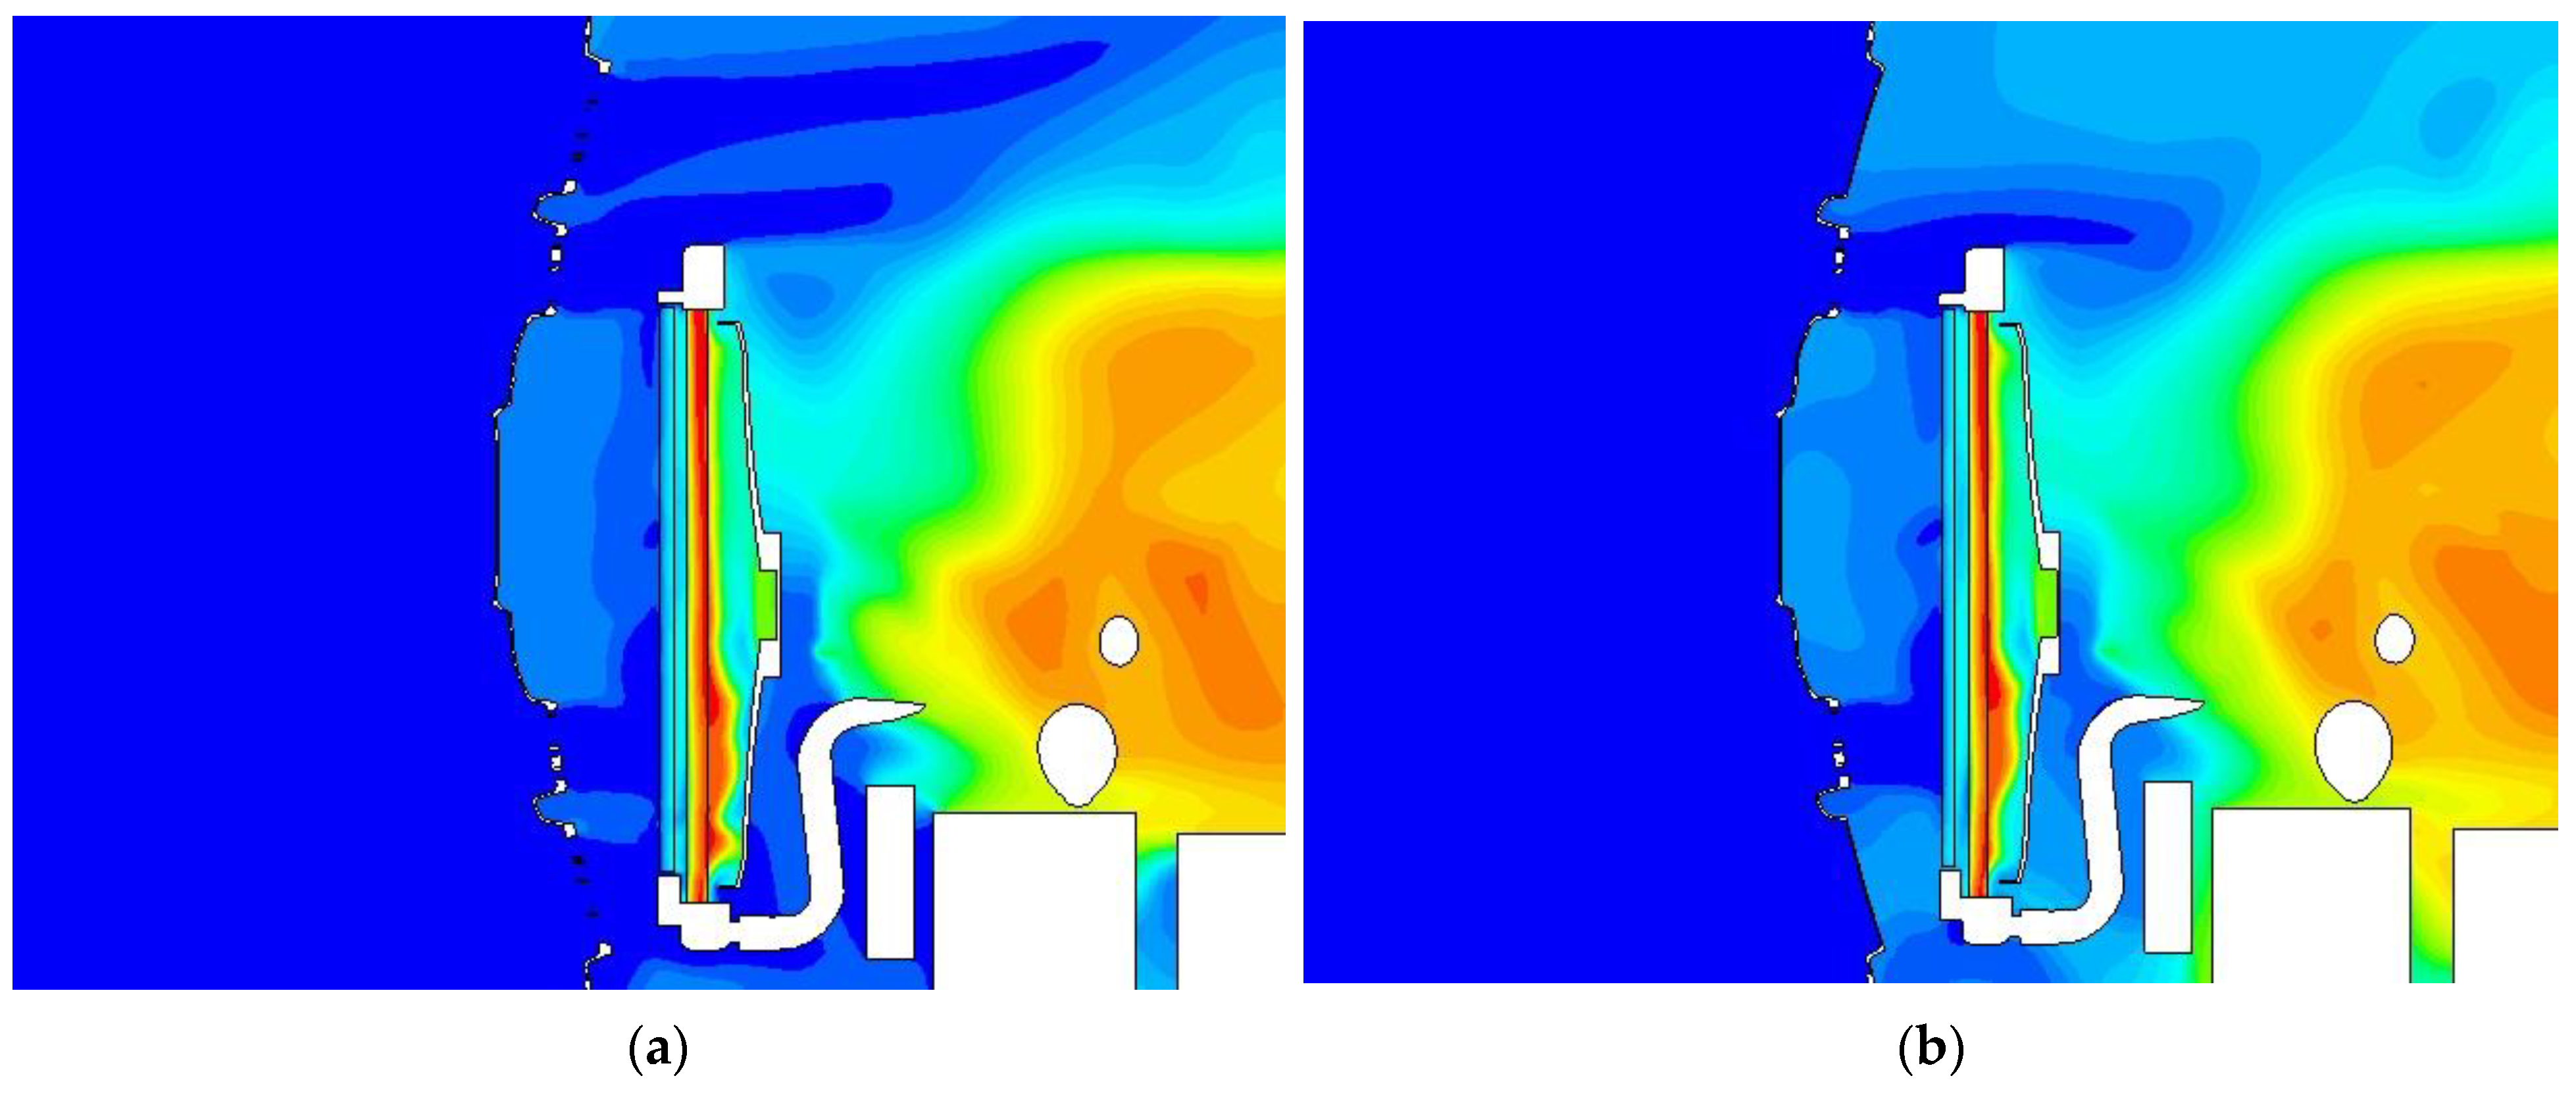
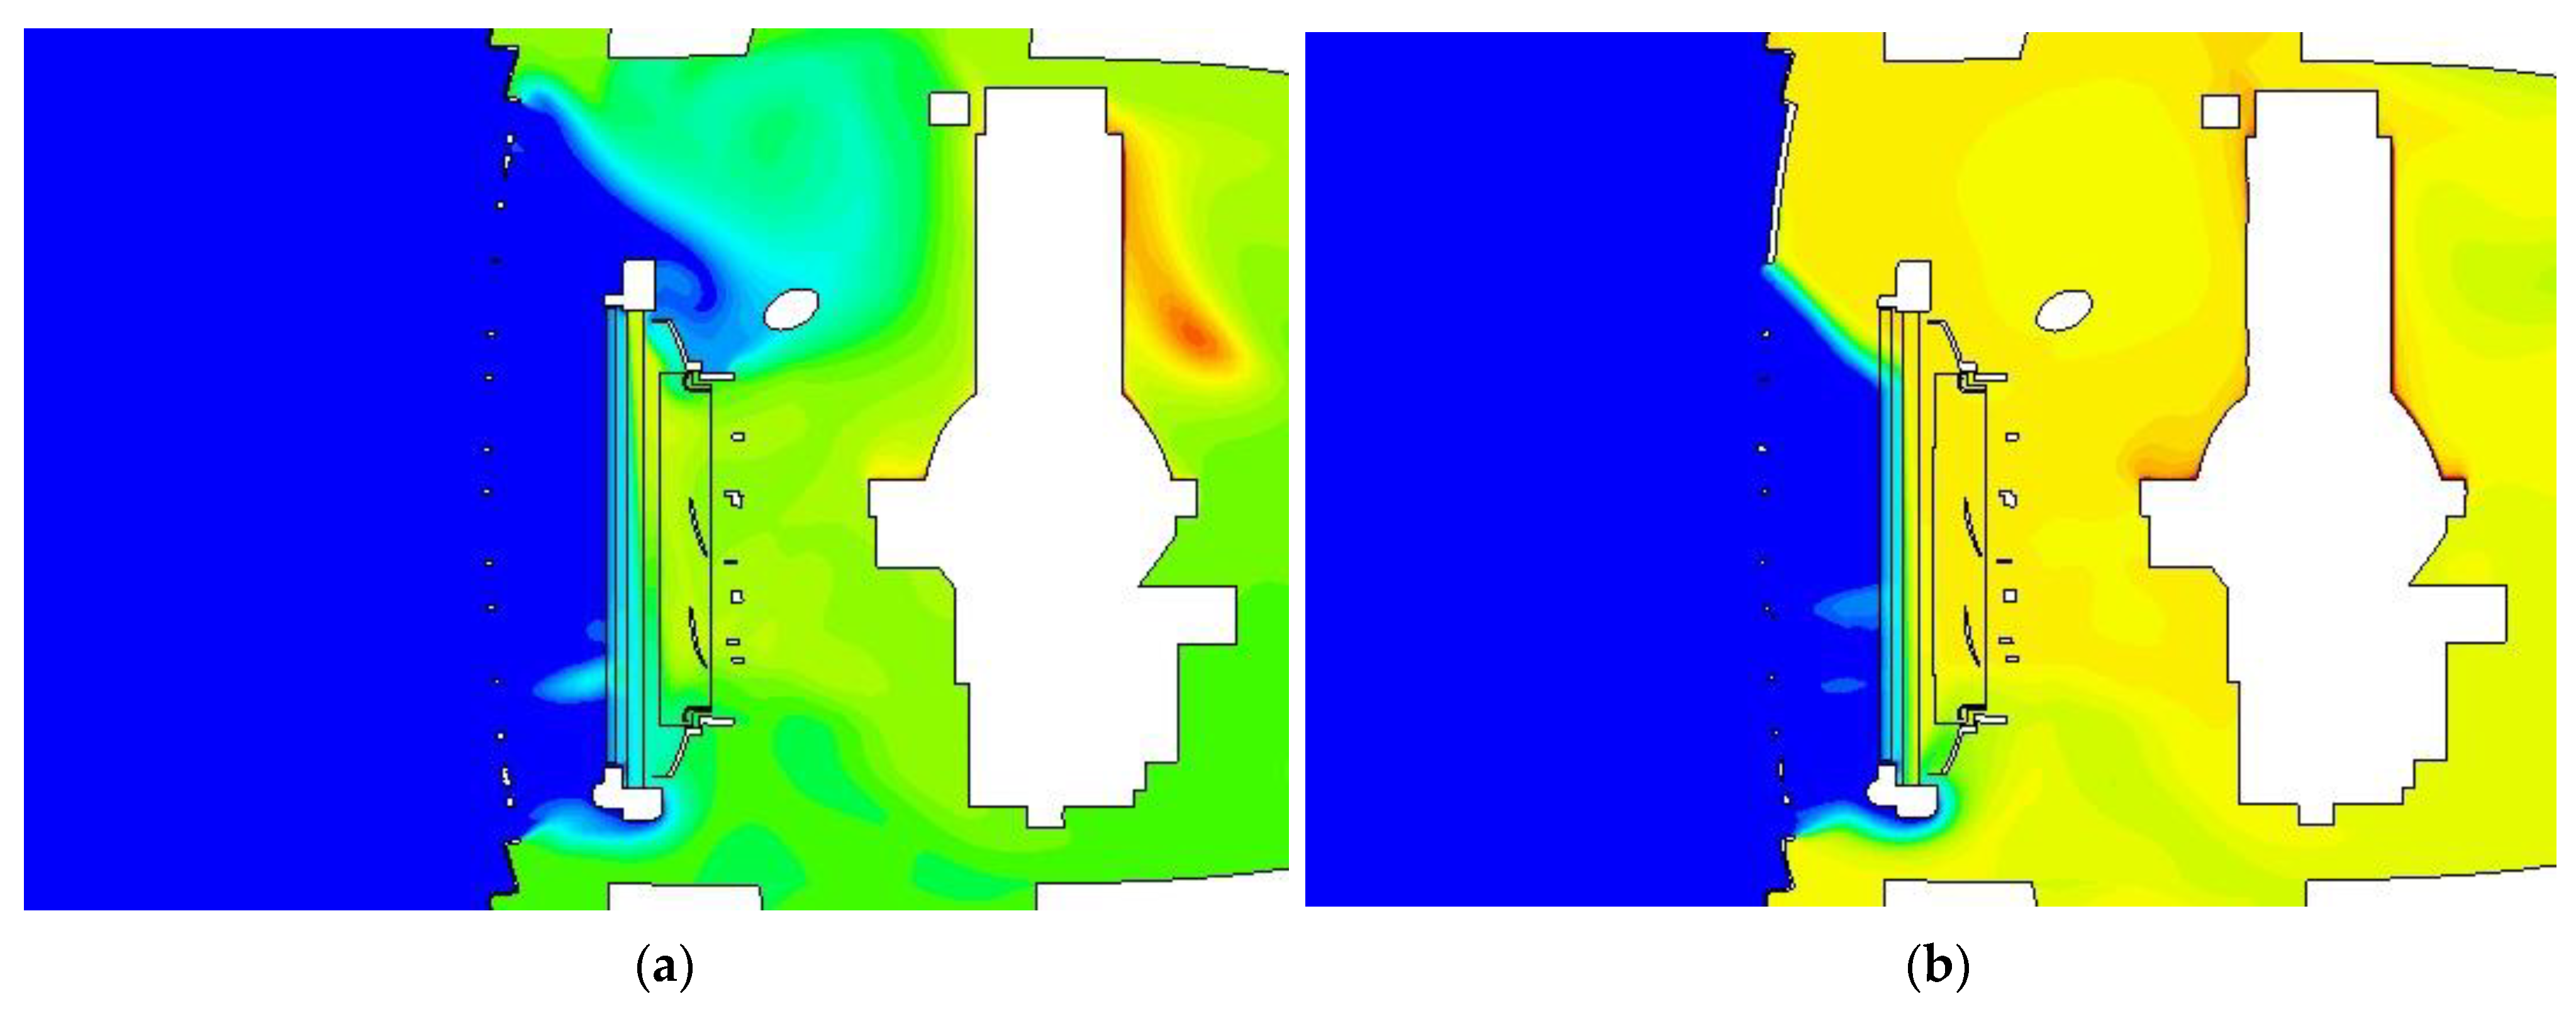
Energies 15 06783 g009
Figure 10. Comparisons of velocity fields for z = 0.44 m section between scheme 1 and original vehicle: (a) original vehicle; (b) scheme 1.
Energies 15 06783 g010
Figure 11. Comparisons of z = 0.44 m section pressure nephogram between scheme 1 and original vehicle: (a) original vehicle; (b) scheme 1.
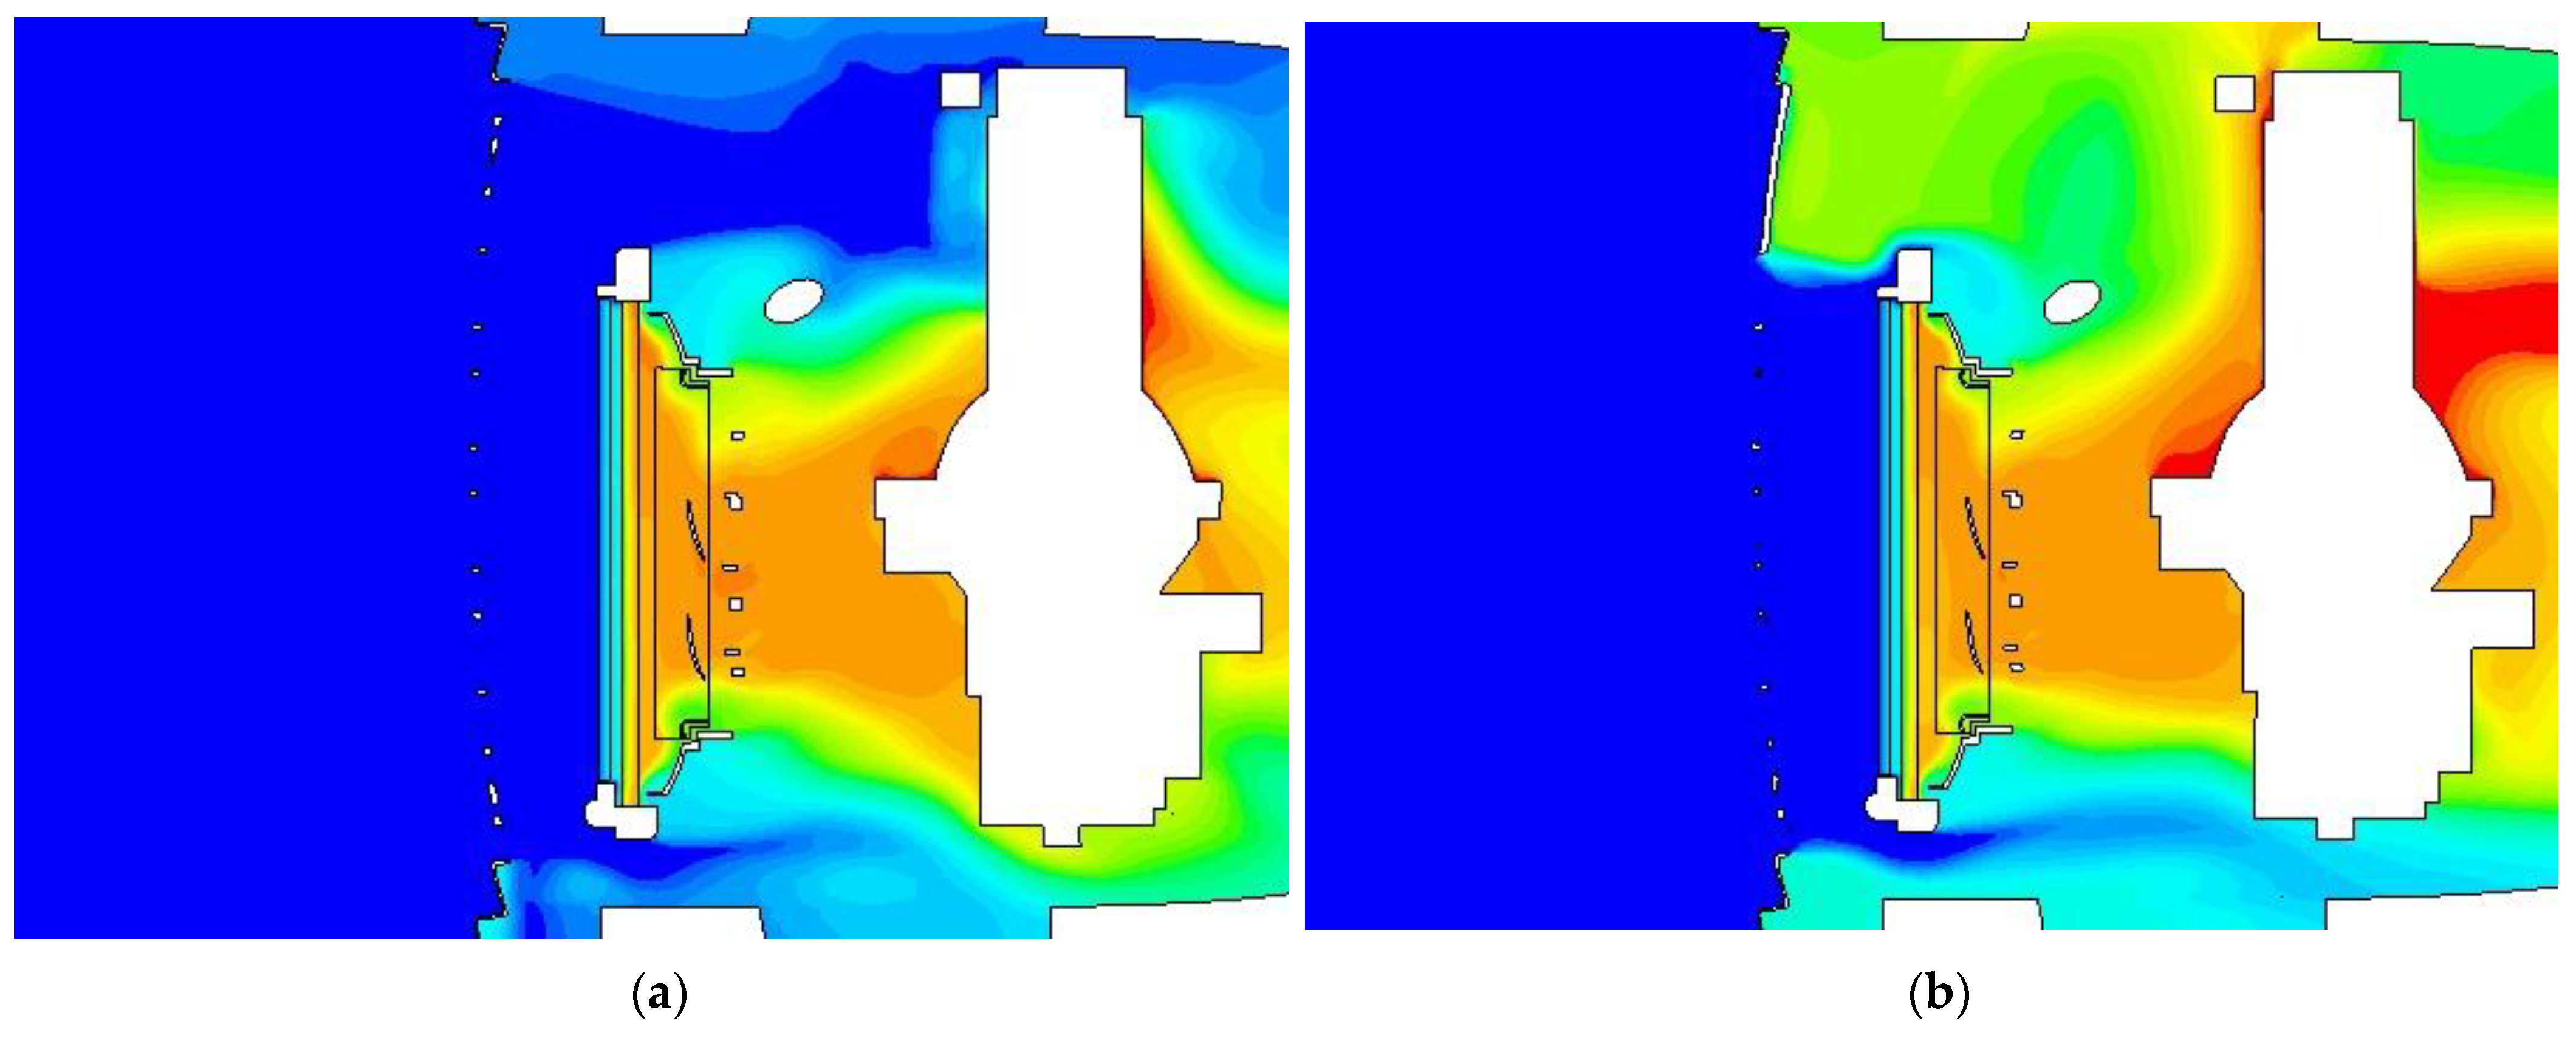
Energies 15 06783 g011
Figure 12. Comparisons of y = −0.17 m section velocity fields between scheme 1 and original vehicle: (a) original vehicle; (b) scheme 2.
Energies 15 06783 g012
Figure 13. Comparisons of the radiator intake air temperature under different schemes.
Energies 15 06783 g013
Figure 14. Temperature fields of z = 0.44 m section under different upper grille closure schemes: (a) original vehicle; (b) scheme 1; (c) scheme 2.
Energies 15 06783 g014aEnergies 15 06783 g014b
Figure 15. Comparisons of air side flow of the condenser under different upper grille schemes.
Energies 15 06783 g015
Figure 16. Velocity fields of z = 0.44 m section under different upper grille closure schemes: (a) original vehicle; (b) scheme 1; (c) scheme 2.
Energies 15 06783 g016
Figure 17. Comparisons of the condenser inlet temperature under different upper grille schemes.
Energies 15 06783 g017
Figure 18. The temperature fields of z = 0.44 m section under different upper grille closure schemes: (a) original vehicle; (b) scheme 1; (c) scheme 2.
Energies 15 06783 g018aEnergies 15 06783 g018b
Figure 19. Comparisons of cooling capacity and power consumption of the air conditioning system under different schemes: (a) comparison of refrigerating capacity; (b) comparison of power consumption.
Energies 15 06783 g019
Figure 20. Closure schemes of lower grille: (a) scheme 1; (b) scheme 2; (c) scheme 3.
Energies 15 06783 g020
Figure 21. Comparisons of the air mass flow of the radiator under different schemes.
Energies 15 06783 g021
Figure 22. Velocity fields of z = 0.08 m section under different lower grille closure schemes: (a) original vehicle; (b) scheme 1; (c) scheme 2; (d) scheme 3.
Energies 15 06783 g022
Figure 23. Comparisons of the radiator air inlet temperature under different schemes.
Energies 15 06783 g023
Figure 24. Temperature fields of z = 0.08 m section under different grille closure schemes: (a) original vehicle; (b) scheme 1; (c) scheme 2; (d) scheme 3.
Energies 15 06783 g024aEnergies 15 06783 g024b
Figure 25. Comparisons of air side mass flow of condenser under different closure schemes of lower grille.
Energies 15 06783 g025
Figure 26. Velocity fields of z = 0.08 m section under different lower grille closure schemes: (a) original vehicle; (b) scheme 1; (c) scheme 2; (d) scheme 3.
Energies 15 06783 g026
Figure 27. Comparisons of condenser inlet temperature under different lower grille schemes.
Energies 15 06783 g027
Figure 28. Temperature fields of z = 0.08 m section under different lower grilles closure schemes: (a) original vehicle; (b) scheme 1; (c) scheme 2; (d) scheme 3.
Energies 15 06783 g028aEnergies 15 06783 g028b
Figure 29. Comparisons of cooling capacity and power consumption of air conditioning system under different lower grille closure schemes: (a) comparison of refrigerating capacity; (b) comparison of power consumption.
Energies 15 06783 g029
Table 1. Setting of boundary conditions.
Boundary NameBoundary Settings
External boundary conditionsInlet of the computational domainVelocity inlet
Outlet of the computational domainPressure outlet
Ground of the computational domainSliding wall
Top and side of the computational domainSymmetrical wall
Wall surface of all parts of vehicle bodyAdiabatic wall
Internal boundary conditionsHeat exchangerPorous medium model
FanMRF model
Heat source components in engine roomTemperature wall
Table 2. Basic vehicle information.
Information NameSpecific Parameters
Vehicle size (mm)4354 × 1840 × 1654
Unladen mass (kg)1300
Maximum laden mass (kg)1707
Maximum engine power (kW)88
Maximum engine torque (N∙m)142
Engine displacement (L)1.5
Number of engine cylinders4
Transmission types5-gear manual
Tire size215/65R17
Water pump/engine speed ratio1.5
Compressor/engine speed ratio1.3
Coolant categoryGlycol/Water (50/50)
Refrigerant categoryR134a
Table 3. Parameter requirements of the vehicle heat balance working condition.
Parameter TypeIdle ConditionClimbing ConditionHigh Speed Condition
Driving speed (km/h)040120
Slope (%)0100
Ambient temperature (°C)353535
Ambient humidity (%)404040
Solar radiation (W/m2)800800800
Gear-25
Table 4. Comparison of simulation results and experimental results.
IndexesSimulationExperimentDifference Rate/%
IdlingClimbingHigh SpeedIdlingClimbingHigh SpeedIdlingClimbingHigh Speed
Outlet water temperature of engine (°C)88.41106.8699.8389.17110.9297.35−0.8−3.72.5
Average temperature of passenger compartment (°C)3222.822.330.1822.2720.563.92.38.4
Table 5. The difference rate of the allowable ambient temperature under different schemes compared with the original vehicle.
Upper Grille SchemesAllowable Ambient Temperature/°CDifference Rate/%
Original vehicle43.14-
Scheme 143.09−0.1
Scheme 240.77−5.5
Table 6. Comparisons of air conditioning performance parameters and difference rate under different schemes.
Upper Grille SchemeAverage Temperature of Passenger Compartment/°CDifference Rate/%COPDifference Rate/%
Original vehicle32.01-2.87-
Scheme 132.110.312.75−4.18
Scheme 232.390.872.49−13.24
Table 7. Changes of the evaluation indexes under different upper grille schemes.
Evaluating IndexesOriginal VehicleScheme 1Scheme 2
Numerical ValueDifference RateNumerical ValueDifference Rate
Allowable ambient temperature/°C43.1443.09−0.1%40.77−5.5%
Air drag coefficient0.37110.3664−1.27%0.3650−1.63%
Average temperature of passenger compartment/°C32.0132.110.31%32.390.87%
COP2.872.75−4.18%2.49−13.24%
Table 8. Difference rate of allowable ambient temperature under different closure schemes of lower grille compared with the original vehicle.
Lower Grille SchemesAllowable Ambient Temperature/°CDifference Rate/%
Original vehicle43.14-
Scheme 142.66−1.11
Scheme 239.95−7.39
Scheme 335.79−17.03
Table 9. Difference rate of the allowable ambient temperature under different schemes compared with the original vehicle.
Lower Grille SchemeAverage Temperature of Passenger Compartment/°CDifference Rate/%COPDifference Rate/%
Original vehicle32.01-2.87-
Scheme 132.732.252.24−22.07
Scheme 233.344.151.87−34.85
Scheme 335.3210.341.20−57.99
Table 10. Changes of evaluation indexes under different grille schemes.
Evaluating IndexesOriginal VehicleScheme 1Scheme 2Scheme 3
Numerical ValueDifference RateNumerical ValueDifference RateNumerical ValueDifference Rate
Allowable ambient temperature/°C;43.1442.66−1.11%39.95−7.39%35.79−17.03%
Air drag coefficient0.37110.3593−3.16%0.3536−4.69%0.3488−6.01%
Average temperature of passenger compartment/°C32.0132.732.25%33.344.15%35.3210.34%
COP2.872.24−22.07%1.87−34.85%1.20−57.99%
Publisher’s Note: MDPI stays neutral with regard to jurisdictional claims in published maps and institutional affiliations.

