You are currently viewing a new version of our website. To view the old version click .
Energies
  • Review
  • Open Access

9 September 2022

Carbon Capture and Utilization: A Bibliometric Analysis from 2007–2021

,
and
1
Department of Chemical Engineering, Universiti Teknologi PETRONAS, Bandar Seri Iskandar 32610, Perak, Malaysia
2
School of Computing, Engineering and Digital Technologies, Teesside University, Middlesbrough TS1 3BX, UK
3
Centre of Contaminant Control & Utilization (CenCoU), Universiti Teknologi PETRONAS, Bandar Seri Iskandar 32610, Perak, Malaysia
*
Author to whom correspondence should be addressed.
This article belongs to the Special Issue Carbon Capture, Utilisation and Storage

Abstract

It is widely accepted that carbon capture and utilization technologies are an effective way of lowering the amount of greenhouse gases released into the atmosphere. A bibliometric analysis is presented in this article to investigate the development of carbon capture and utilization. The study was conducted to identify the trends in publishing, dominant contributing authors, institutions, countries, potential publishing sources, and the most cited publications in this research area. A total of 4204 articles published between 2007 and 2021 were analyzed, covering 13,272 authors, 727 journals, and 88 countries. The findings indicate that the most productive and influential authors have British and American affiliations. The United States, the United Kingdom, and China have conducted most studies on the aforementioned topic. Imperial College London, United Kingdom, has the highest number of publications in this field of research. Furthermore, the collaborative analysis was developed by creating links between the keywords, published information, authors, institutions, and countries. In addition, the discussion highlights the tremendous development in the research area of carbon capture and utilization, especially with a focus on the exponential rise in the number of yearly publications.

1. Introduction

Carbon dioxide (CO2) is regarded as the most significant anthropogenic contributor to global warming [1]. Its voluminous emissions to the atmosphere have raised the average atmospheric temperature by nearly 1.0 °C [2] and the CO2 concentration in the atmosphere resides at nearly 421 ppm, a 50% increase since the advent of the modern industrial revolution in the late eighteenth century [3].
The Paris Agreement of 2015 stipulates that the rise in global temperature must ideally be kept below 1.5 °C, or at best up to 2 °C [4]. As a result, worldwide CO2 emissions must be mitigated, and methodologies should be developed to reduce new emissions and lower atmospheric CO2 levels. Despite efforts such as process change (e.g., renewables-based electrification) and efficient energy use (such as process intensification), a significant portion of CO2 emissions come from fossil fuels and the process industry [5], which sometimes have inherent CO2 emissions, such as lime production and steel manufacture. These emissions usually originate at stationary points and in large quantities [6].
Carbon capture and utilization is a promising technology concept to capture and use the CO2 being released by fossil fuel power stations and the process industry in an efficient cyclic economy that makes them either zero waste industries or use CO2 for the production of intermediates and end-user products. It is a mix of two different technology paradigms that work in tandem to reduce CO2 emissions from significant point sources. Carbon capture involves technologies that separate CO2 from other gases, either pre-combustion (such as sweetening of natural gas) or post-combustion (e.g., cleaning of flue gas). Carbon utilization is a separate set of newly evolving technologies that convert the captured CO2 into valuable chemicals, value added products and/or its direct use as a process commodity [7]. The use of carbon capture and utilization can be traced back to the 1920s. Initially developed to improve natural gas quality and recovery from depleted oil reserves, the process is now one of the frontline solutions for reducing CO2 emissions from large stationary sources [8]. In technical terms, carbon capture in carbon capture and utilization methodology is more mature in technological terms than its counterpart [9].
Nevertheless, both technology concepts require rapid technological improvements and face many economic and technical issues in commercialization and wide-scale implementation to achieve sustainable decarbonization [10]. The CO2 storage in depleted reservoirs and underground aquifers is an alternative to utilization technology. CO2 injection is considered a suitable solution for mitigating excess CO2 emissions and partially shares its application in the CO2 utilization concept, as gas can be used to extract oil and gas from unconventional and shale reservoirs and coal bed methane. Jia et al. provided a detailed account of the use of carbon dioxide injection for storage and enhanced oil recovery [11].
Many research studies and pilot projects have been conducted to improve the scientific understanding of carbon capture and utilization [12]. The research-cum-academic work can be traced back to the study carried out by the Massachusetts Institute of Technology, United States. Their carbon capture and sequestration technologies program started in 1989, studied the capture and use of CO2 from large point sources, and spanned multiple sectorial disciplines focusing on technical, economic, and socio-political facets. Several research works have been presented and published since then, focusing on various factors and technological parameters related to carbon capture and utilization, which form a part of the motivation for this research work.
Carbon separation technologies are roughly divided into four sub-areas: absorption, adsorption, membranes, and cryogenics [6,7]. Absorption is the most advanced form of technology in the field. It uses physical and chemical solvents to absorb carbon dioxide from a mixture of gases. Research in the field has focused on the reduction in energy consumption, solvent loss, and degradation. However, many types of chemical solvents have been studied and have found limited applications. Examples include inorganic solvents, such as potassium carbonate and ammonia, and organic solvents, such as alkanolamines and amino acids [8]. Some physical solvents, such as Selexol and Rectisol, have also been used for the selective separation of acid gases [13]. Membranes are a substantially low-cost carbon capture technology. Much research has been conducted, but a limited commercial application for CO2 capture has been registered in the last two decades [14,15]. Membrane systems operate independently of solvents, offering ease of handling and development. However, the membrane’s operational life and effectiveness over time still require more research. Adsorption for CO2 capture presents significant energy savings and relevant costs compared to the aforementioned technology options. Adsorptive carbon capture uses advanced or functionalized zeolites and activated carbon materials [16]. Recent developments have focused on capturing carbon dioxide from the air, and many alkali/alkaline-minerals are being investigated [17].
Moreover, new materials, such as metal organic frameworks, are being studied [18]. Two more recent technological developments for carbon capture are calcium looping and cryogenics. Calcium looping, also sometimes known as the regenerative calcium cycle, is a further development of the carbonate looping concept. The technology uses calcium oxide (CaO) that reacts directly with CO2 capturing it from a gaseous mixture. The formed product is then calcined in another plant section to retrieve the reacted CO2. Since the process requires a high temperature (550–1150 °C), it can find suitable applications in cement and blue hydrogen production [19]. Cryogenic separation of CO2, although enticing for monetizing high CO2 containing natural gas, finds limited application for carbon capture due to high energy costs. Moreover, the presence of water and heavier hydrocarbons poses greater issues, such as hydrate formation. However, developments have focused on energy optimization and using a cheap (but strong) class of materials for process design.
A careful analysis of the published literature shows that most research has been conducted on the technical side of these technologies, such as the works of Chai et al., [20] and Tcetkov et al., [21]. However, the research works also cover more than one aspect (technology, environmental, economic, socio-political) of carbon capture and utilization. They can be regarded as a multi-sectorial publication, for example, the contributions by Jones et al., [22], Cuéllar-Franca and Azapagic [23], Thonemann [24], and Lamberts-Van Assche and Compernolle [25]. The major motivation for this paper emerges from the absence of a credible and consolidated bibliometric analysis for the said field, as more than twenty thousand publications are available in the open literature.
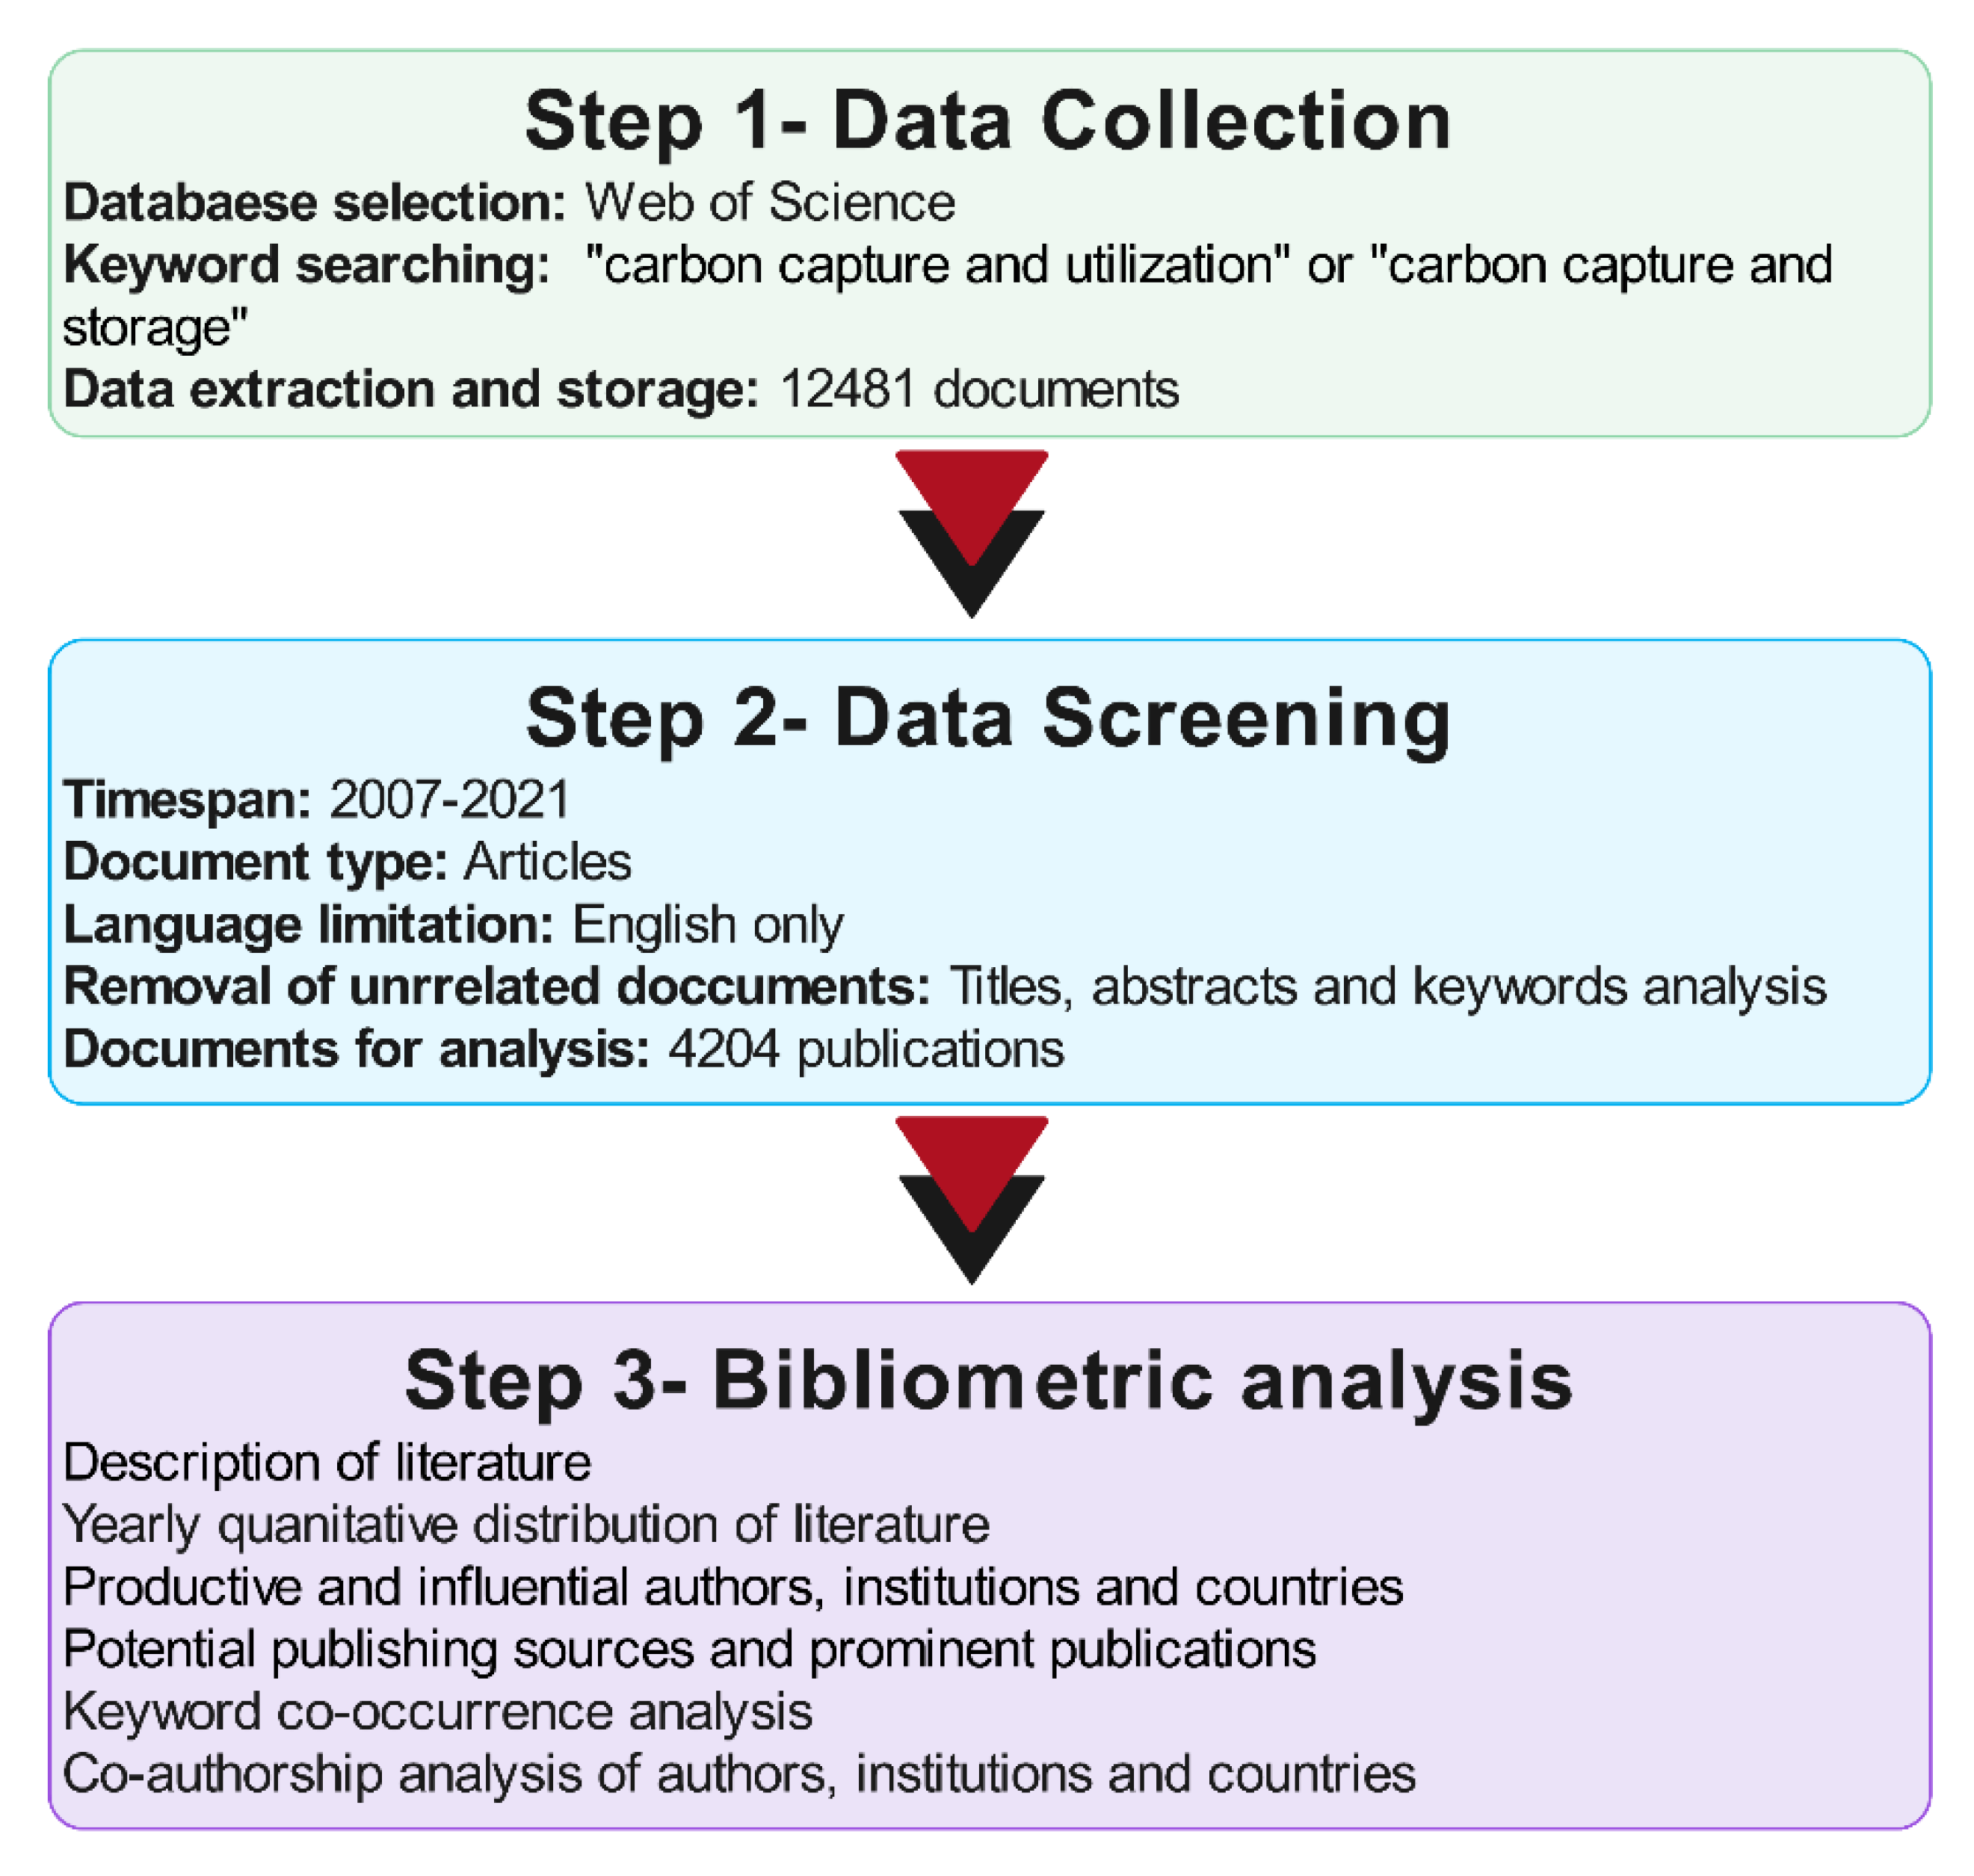
The study’s main purpose is to investigate existing research on carbon capture and utilization and to analyze current research trends. A bibliometric analysis was used because it is a reliable way to count and evaluate scientific publications [26]. This paper presents a bibliometric analysis of the available literature on carbon capture and utilization. In bibliometric analysis, statistical techniques are employed to analyze books, papers, and other publications. This analysis helps conceptualize current knowledge status, features, evolution, and emerging trends, which can aid interested researchers in those areas in gaining a comprehensive grasp [27]. Bibliometrics can aid a significant amount of academic research from the micro to the macro levels. In recent years, some researchers have applied VOSviewer and other statistical methods to analyze data in various fields, such as anaerobic digestion of methane research [28], data-driven methods for process systems [29], process safety and risk analysis [30], inherent assessment for sustainable process design [31], enhanced oil recovery [32], biomass and bioenergy [33], hydrogen energy from food waste [34]. A comprehensive and systematic analysis of capture and utilization using the maps and tables generated by VOSviewer and other statistical methods is conducted in this paper. This analysis is intended as a guideline for selecting carbon capture and utilization procedures. As a result, those interested in developing carbon capture and utilization methodologies for industrial processes can find this work extremely useful.

2. Methodology of Literature Investigation

Figure 1 describes the data investigation method for carbon capture and utilization research. This three-step methodology includes data collection, screening, and bibliometric analysis.
Figure 1. Description of the literature investigation step involving methodology.

2.1. Data Collection

The selection of a suitable database for data collection is the first stage of the data collection phase. Since the Web of Science (WoS) database is considered the most credible source within the scientific community, the WoS database was chosen to retrieve the data for this article. The second stage was to choose the search string, which consisted of any publications with a title, abstract, or keywords that included “carbon capture and utilization” or “carbon capture and storage.” These two primary keywords are sufficiently representative of what must be done. In the first run, 12,481 documents related to carbon capture and utilization were found in the WoS database, and the process was completed on 17 June 2022.

2.2. Data Screening

There was the possibility of duplicate publications because the search was carried out separately with titles, abstracts, and keywords. Thus, duplicate publications were eliminated from the data. Only English-language publications from 2007 to 2021 (15 years) were included in the analysis. Only research and review articles published in journals were considered for this study; all other documents, such as proceeding papers, editorial materials, books, and book chapters, were excluded. After that, the publications unrelated to the topic were eliminated by giving the titles, keywords, and abstracts of the publications careful consideration.

2.3. Bibliometric Analysis

After screening retrieved data to eliminate duplicates and other irrelevant documents, a total of 4204 articles were identified for bibliometric analysis. VOSviewer software and Microsoft Excel were used to construct and visualize the bibliometric network and to produce a descriptive analysis of the retrieved data.

3. Descriptive Analysis

Carbon capture and utilization articles published between 2007 and 2021 are included in the analysis. Only journal articles are included in this research; all other non-journal publications, including review papers, conference papers, editorials, and other documents, are excluded for a more thorough analysis. In the end, 4204 articles were retrieved for the study. The articles were cited 105,152 times, an average of 2926 times a year and 25.01 times per paper.

3.1. Keyword Analysis

An analysis of the authors’ keywords used for indexing purposes might help identify the most important topics and trends in any field of study. The co-occurrence keywords in the retrieved data were analyzed using VOSviewer. The authors configured a total of 8821 keywords, 120 of which appeared more than fifteen times. Figure 2 shows a visual network map of keyword co-occurrence. Nodes in different colors represented different types of clusters, node size represented the occurrence of keywords, and a thick connection line showed a close relationship between the two items. All three clusters seem to be related to climate change. For example, researchers have used “carbon capture and storage” as the most common keyword. It links with other keywords, including ccs, climate change, carbon dioxide, CO2 capture and bioenergy.
Figure 2. Map of clusters based on keyword analysis using VOSviewer.
Climate change was identified as a hot topic from the keyword analysis. Keywords related to climate change include carbon capture and storage, ccs, carbon capture, CO2 capture, carbon dioxide, carbon capture and utilization, and carbon sequestration. Recently, bioenergy with carbon capture and storage technologies has been actively used to capture and store carbon.

3.2. Publication Trends

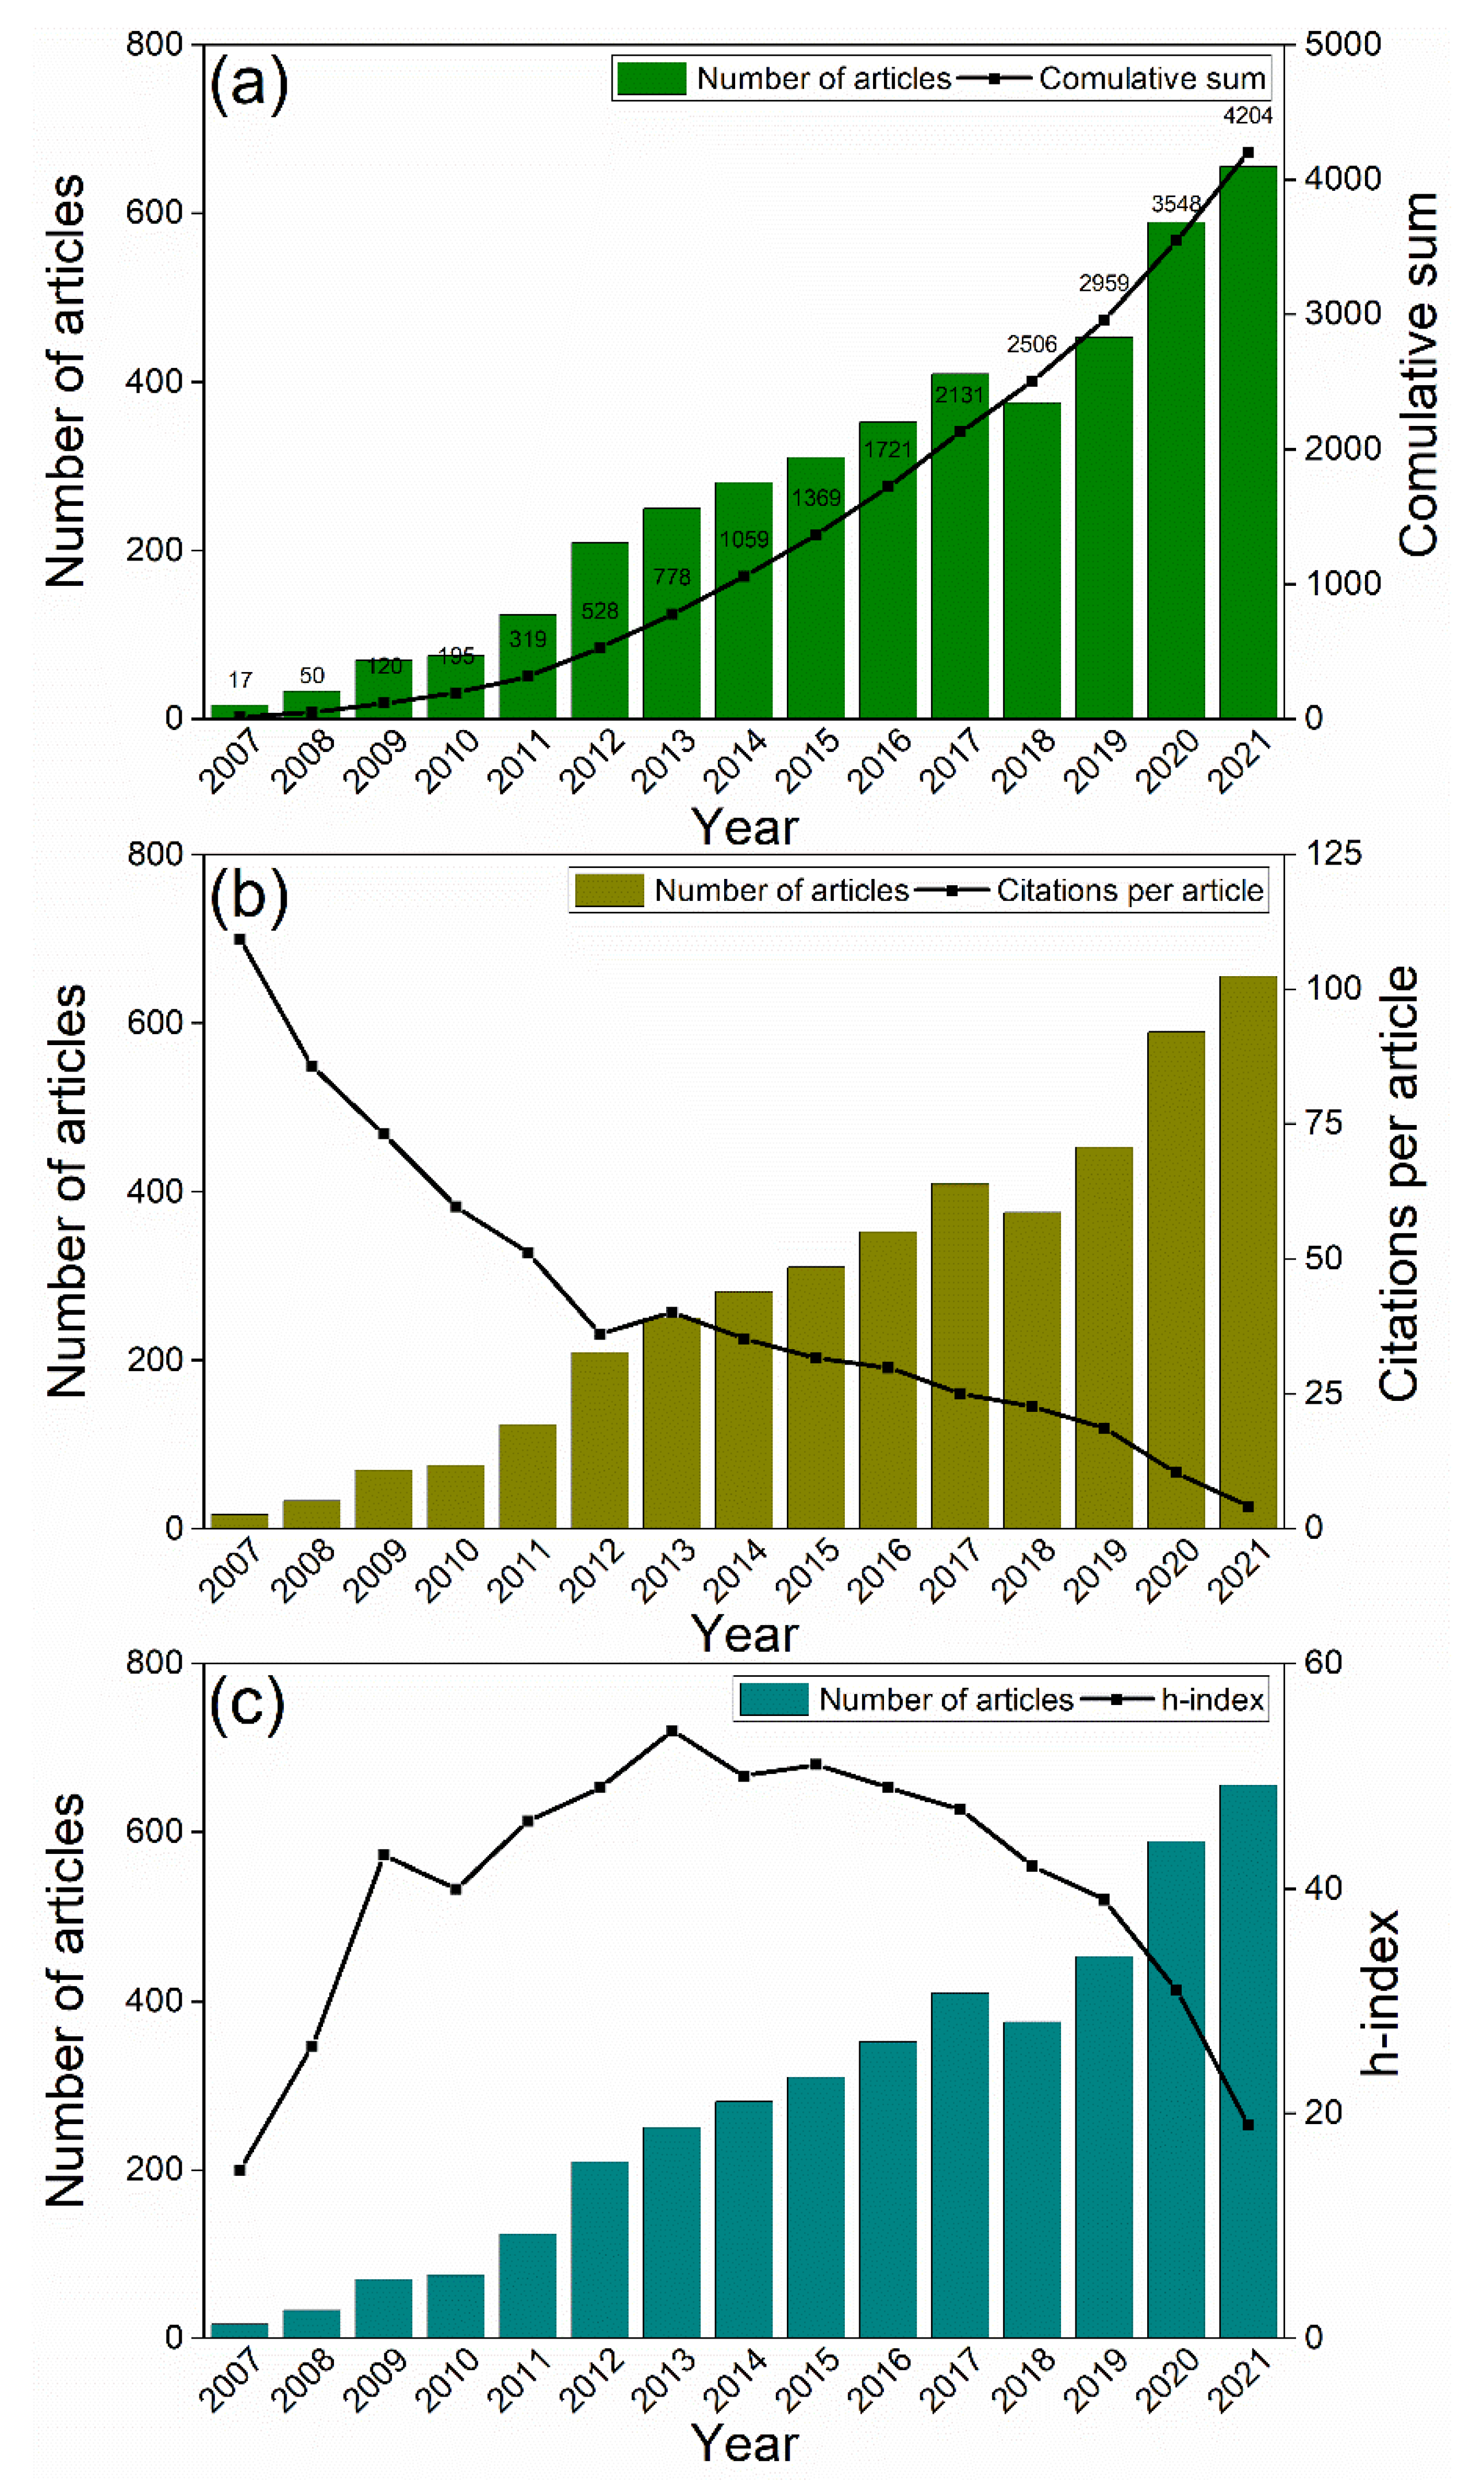
Figure 3 shows the trend in publishing, the average number of citations received by each publication, and the h-index. As seen in Figure 3a, the amount of work done in carbon capture and utilization research has steadily increased over the years. There was not much research in the first five years, from 2007 to 2011, and only 319 (7.59%) articles were published. From 2012 to 2016, 1402 (33.35%) articles were published, increasing almost five times. Over the last five years, there has been a discernible acceleration in the rise of published works, with 2483 (59.06%) articles. The number continued to rise until 2021, before seeing a slight decline in 2018, and 2021 was the most prolific year, with 656 articles being produced.
Figure 3. Publication growth over the year, (a) total publications and cumulative sum, (b) total publications and citations by year, (c) total publications and h-index.
Over time, there has been a rise in the aggregate number of citations. Because of this, there is projected to be a reduced number of citations for the most recent publications, affecting the average number of citations obtained by each publication in the most recent years. According to Figure 3b, the publications that were published in 2007 had the highest average number of citations for each publication (C/P = 109.29).
If an article has a high h-index, this suggests that it has a strong cumulative influence when measured by both the amount and quality of citations it has received. As can be seen in Figure 3c, the year 2013 had the highest h-index with a value of 54, followed by 2015 with a value of 51, and then 2014 with a value of 50.

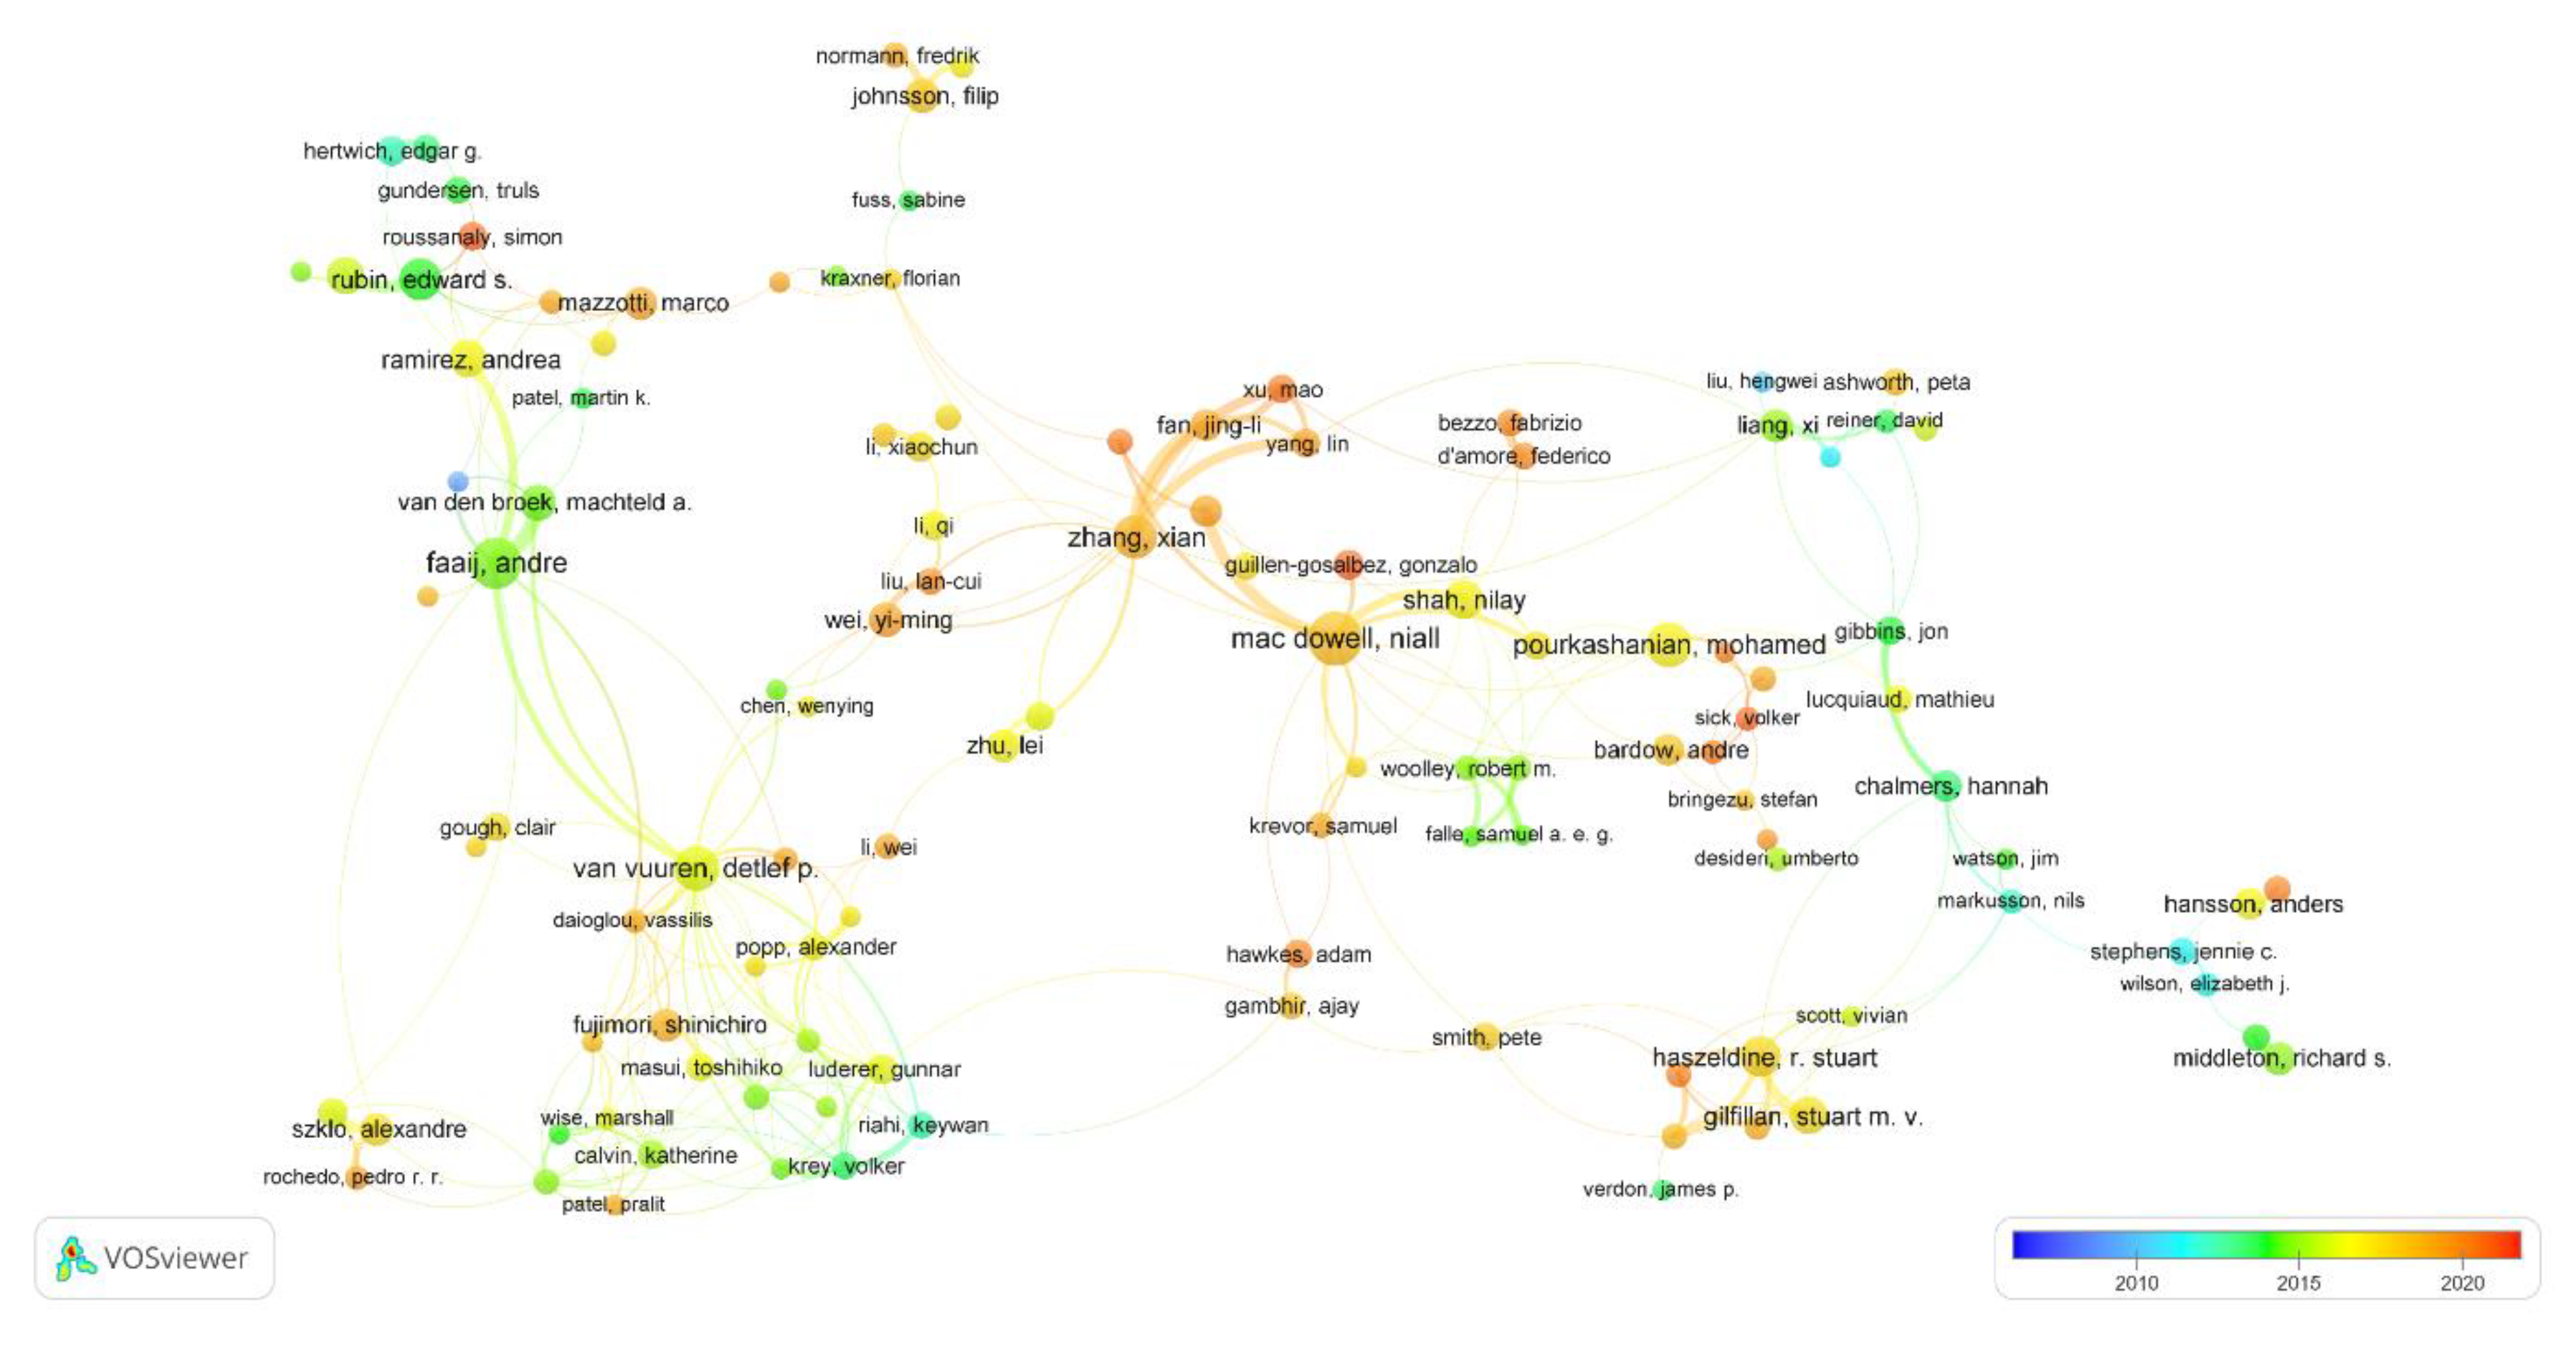
3.3. Productive and Influential Authors

The field of carbon capture and utilization is expanding rapidly, and as a result, it has continually piqued the attention of researchers. Through an investigation of a total of 4204 publications, it was found that 13,272 different authors had made contributions to this area. 322 of these authors have five publications or more, and 43 of these authors have at least ten articles each. The top ten prolific authors in this field were analyzed based on the total number of articles, citations, and citations per year. The top ten productive authors based on the total number of articles are shown in Table 1. Niall Mac Dowell (from Imperial College London, UK) was top ranked with 36 articles, followed by Cormos, Calin-Cristian (from Babeș-Bolyai University, Cluj-Napoca, Romania), and Andre Faaij (University of Groningen, Groningen, The Netherlands) with 34 and 31 articles, respectively. The h-index for these top authors was also higher than the others and more than 20. Mac Dowell, Niall (from Imperial College London, London, UK), published more than 90% of the articles in the last five years (from 2017 to 2021).
Table 1. Top ten most productive authors based on published articles.
The most prolific authors based on total citations are shown in Table 2. Edward S. Rubin (Carnegie Mellon University, Pittsburgh, PA, USA) was ranked first with 2273 citations, followed by Andre Faaij (University of Groningen, The Netherlands) and Detlef P. Van Vuuren (Utrecht University, Utrecht, The Netherlands) with 1692 and 1648 citations, respectively. Edward S. Rubin (Carnegie Mellon University, USA) was also the most productive author, as his eight articles had more than one hundred citations.
Table 2. Top ten most productive authors based on total citations.
The top ten most prolific authors based on citations per article are shown in Table 3. Hani M. El-Kaderi (Virginia Commonwealth University, Richmond, VA, USA), was at the top spot, with 143.20 citations per article. He was followed by Gunnar Luderer (Potsdam Institute for Climate Impact Research, Potsdam, Germany) and Elmar Kriegler (Potsdam Institute for Climate Impact Research, Germany), with 120.00 and 114.17 citations per article. Both authors were from the same institution.
Table 3. Top ten most productive authors based on citations per article.
Overall, only one author, Edward S. Rubin (Carnegie Mellon University, USA) was present in all three categories. He was ranked 8th based on the total number of articles, 1st based on total citations, and 4th based on citations per article. Three authors, Dominic C. Y. Foo (University of Nottingham Malaysia, Semenyih, Malaysia), Vasilije Manovic (Cranfield University, Bedford, UK), and Edward S. Rubin (Carnegie Mellon University, USA), had the same number of articles. They were ranked 8th based on the total number of articles. In the category of ten authors based on citations per article, only two authors had more than ten articles.

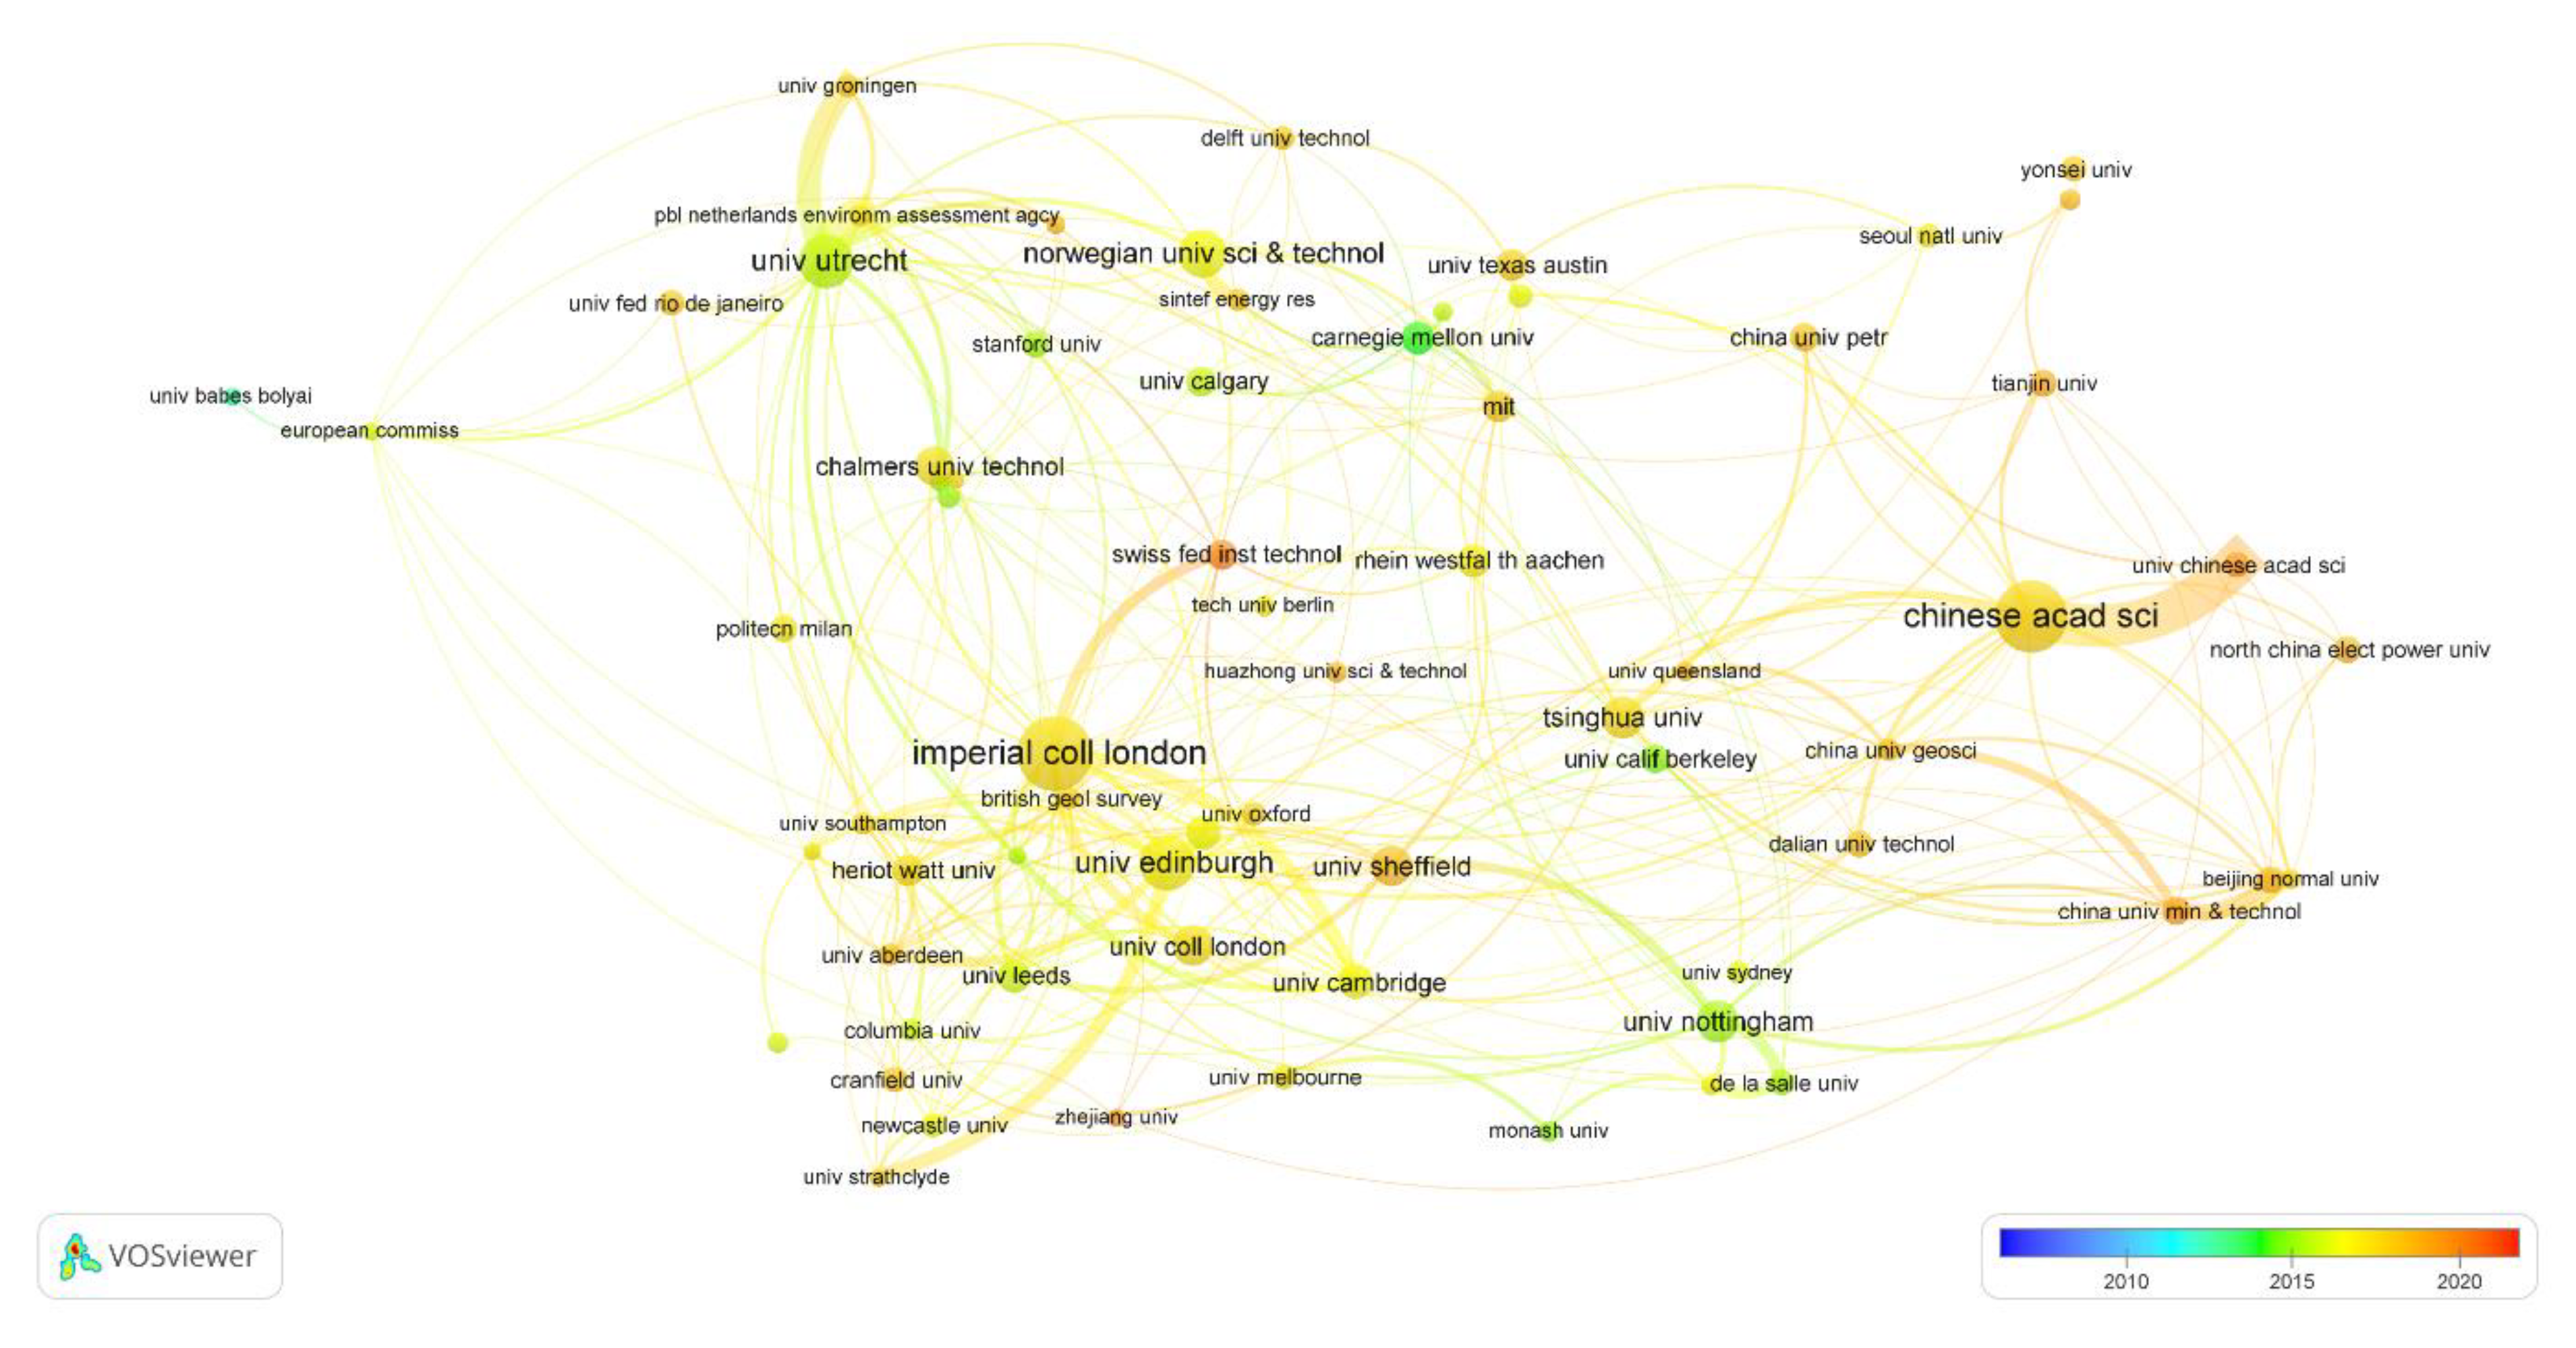
3.4. Most Productive and Influential Institutions

There are 3020 different organizations involved in carbon capture and utilization research. Only around 14% of organizations are involved in more than five publications. Table 4 shows the top ten organizations in terms of the total number of articles, the total number of citations, the average number of citations per article, and the h-index. Imperial College London (UK) came in the first spot in the total published articles 121, first place in terms of total citations of 4300, second place in terms of citations per article of 35.54 and first place in terms of h-index. The Chinese Academy of Sciences (Beijing, China) and the University of Edinburgh (Edinburgh, UK) came in 2nd and 3rd place, respectively, considering the total number of publications published by each institution. Despite Utrecht University (Utrecht, The Netherlands) being placed fourth based on the total number of articles, it was ranked 1st based on the citations per article, with 48.92 and 2nd based on the h-index.
Table 4. Top ten most influential institutions in carbon capture and utilization research.

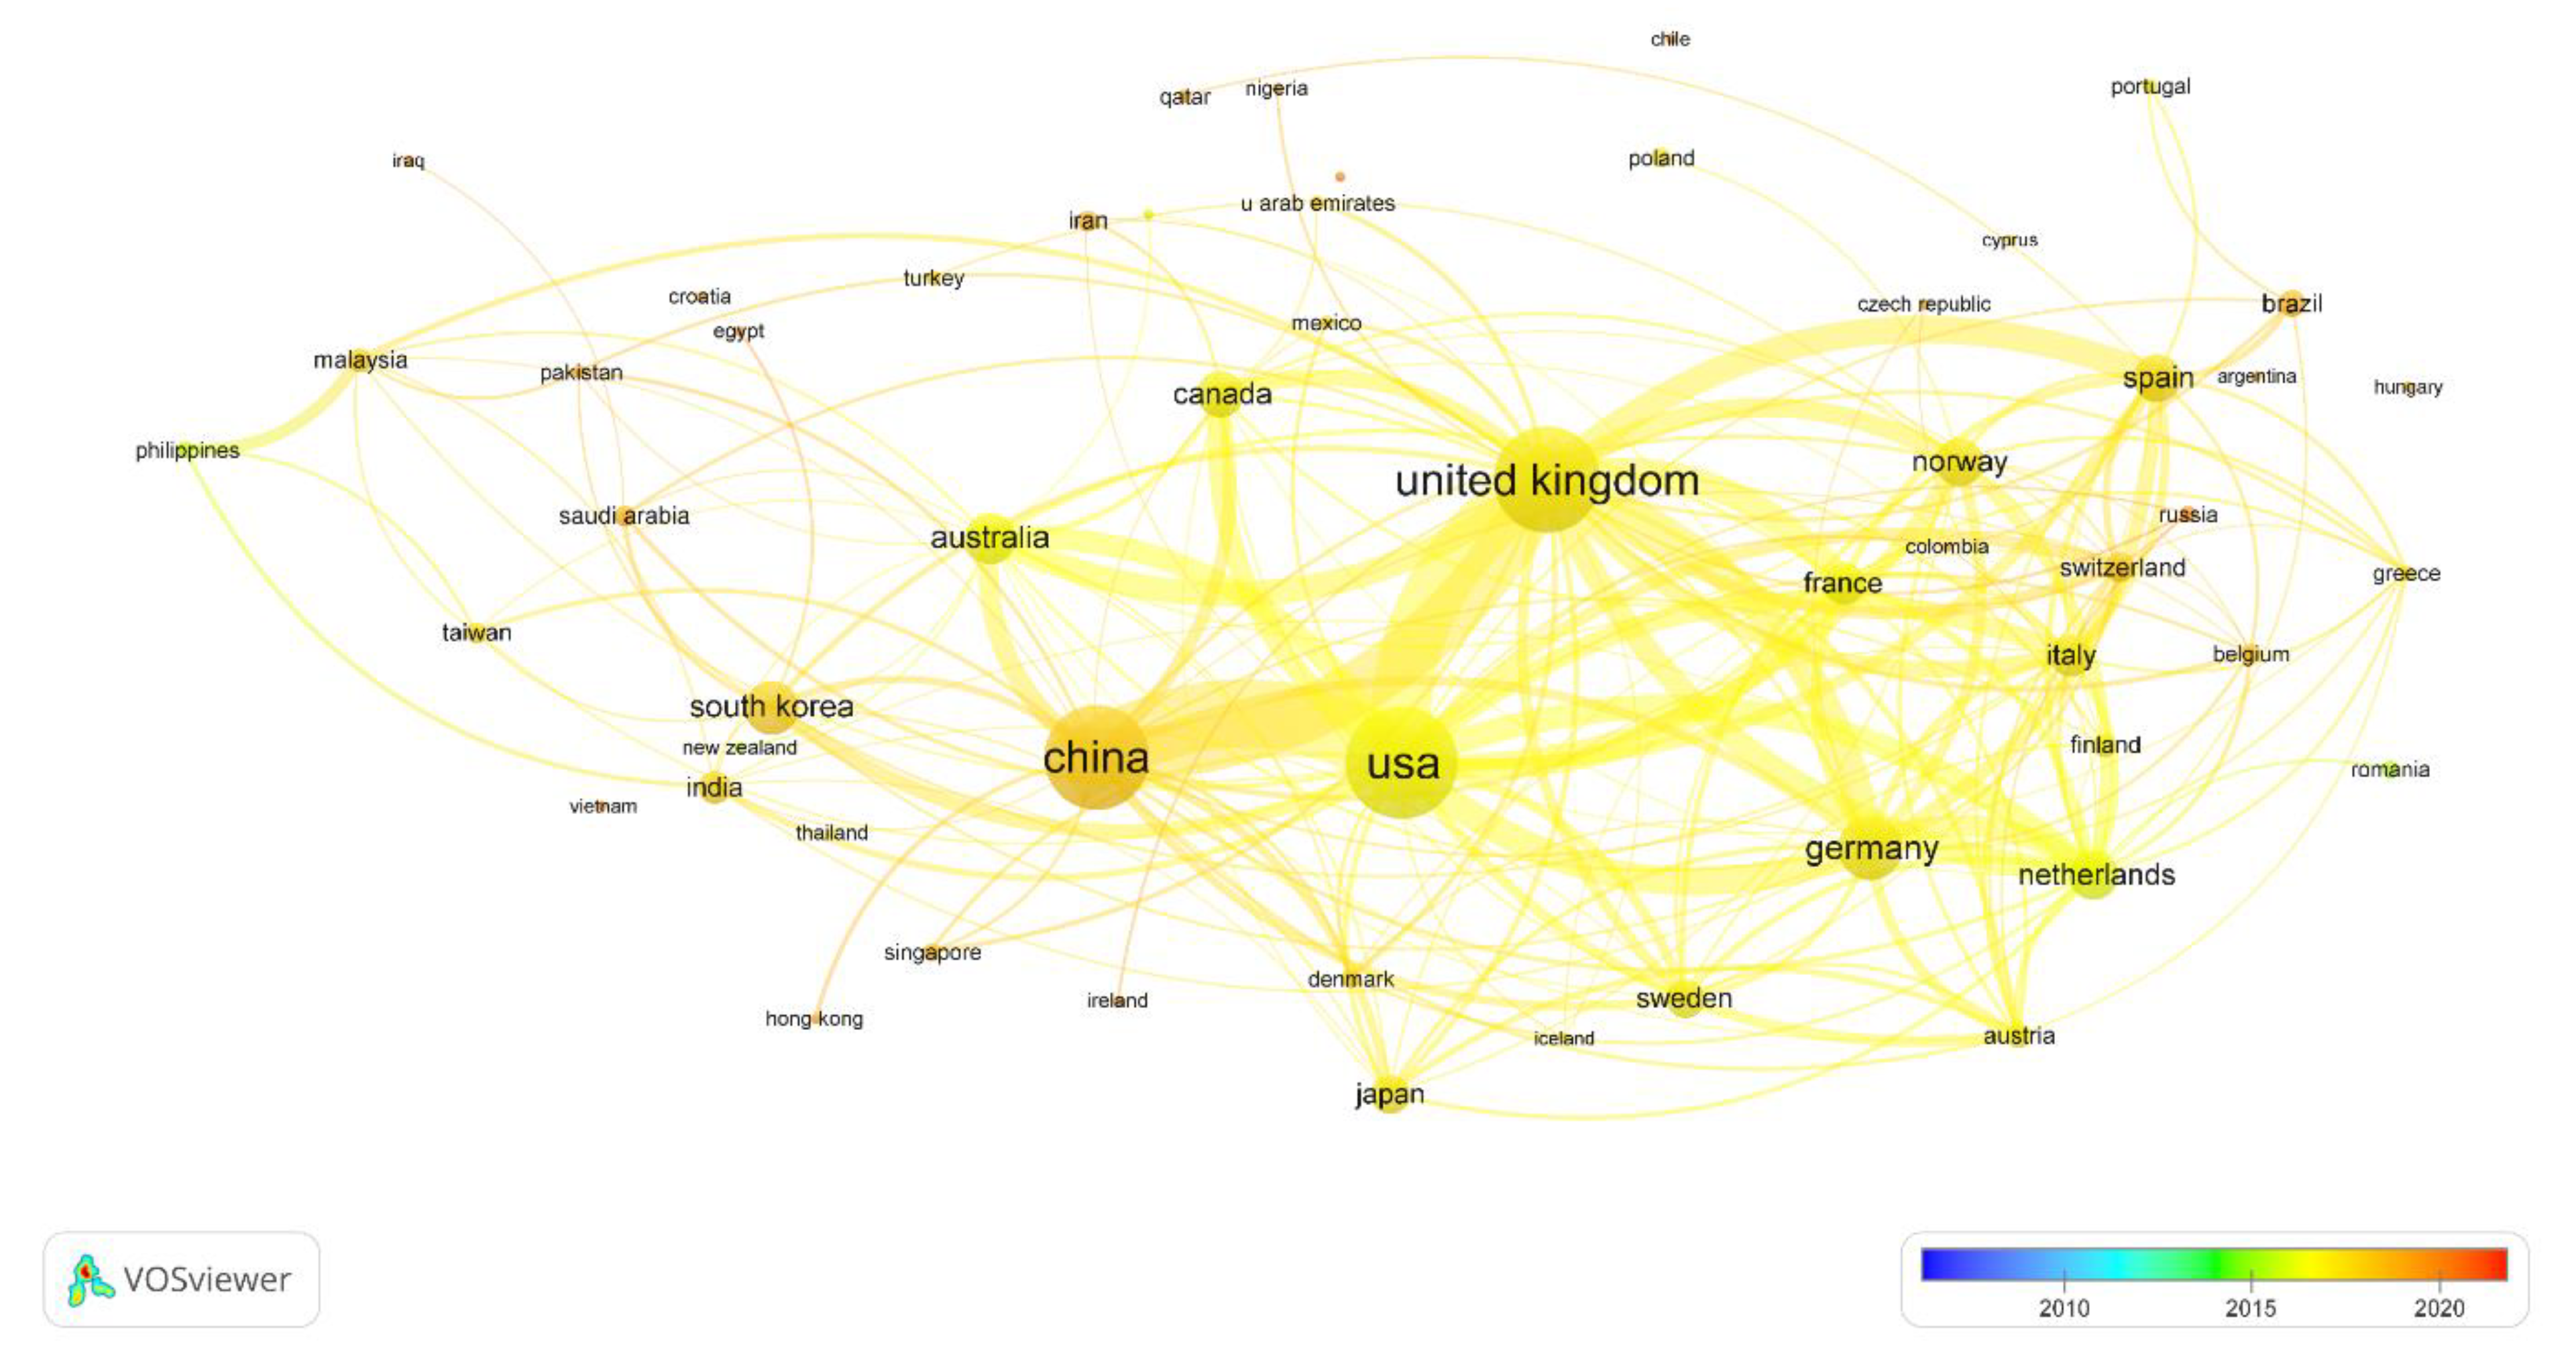
3.5. Most Productive and Influential Countries

There were 88 countries involved in carbon capture and utilization research between 2007–2021. Figure 3 illustrates the geographical distribution of countries according to the number of articles in each country. There was 36.36% (32 countries) involved in fewer than five publications, which shows not a significant amount of study carried out in these countries regarding this topic. In addition, 40.91% (36 countries) were involved in 6 to 50 publications, while 22.23% (20 countries) were involved in more than 50 publications.
The publications related to this research field originate from 6 geographical regions and 88 countries and is shown in Figure 4. Asian and European countries prevailed in this research area. The combined contribution of these origins was 71.59%, with 32 (36.36%) Asian countries and 31 (35.23%) European countries involved in the research. However, the involvement of other regions is somewhat limited in this field, both in quantity and influence. This research field included participation from 10 (11.36%) countries in Africa, 8 (9.09%) countries in South America, 4 (4.55%) countries in North America, and 3 (3.41%) countries in Oceania. China, representing the Asian region; the United Kingdom and Germany, representing the European region; and the United States, representing the North American region, were involved in the maximum number of articles.
Figure 4. Geographical distribution of published articles on carbon capture and utilization (2007–2021).
The United States, the United Kingdom, and China were the countries that contributed the most articles, with 888, 797, and 776, respectively. According to the findings of the study, Europe and Asia were the continents that have contributed the most to the carbon capture and utilization research field. On the list of the top 10 countries listed in Table 5, there were two countries from North America, two countries from Asia, one country from Oceania, and five countries from Europe. The level of quality and production in these countries indicates that the Netherlands, Australia, and the United States were found to be the top three most productive countries, each with more than 30 citations per article. South Korea (C/A = 13.36) and China (C/A = 22.20) were at the bottom of the list according to the citations per article calculation. These results are based on the world’s top ten most productive countries. The h-index is another method that may be used to measure productivity. This method puts the United States, the United Kingdom, and China in the top three spots, with an h-index of 82, 69, and 59, respectively.
Table 5. The top ten most productive and influential countries.

3.6. Most Cited Articles in Carbon Capture and Utilization Research

There have been many significant studies published on carbon capture and utilization that have been published in a variety of journals. The number of citations indicates how influential, popular, and attention-grabbing something is within the scientific community. In this part of the article, the published works were evaluated using two different methods. The first method considers the total number of citations obtained, and Table 6 contains a ranking of the 10 publications with the highest number of citations. “Perspective of microporous metal-organic frameworks for CO2 capture and separation” was the top-cited article, with 605 citations. In this article, the authors promote the concepts of CO2 capture and separation technologies. “Eco-efficient cements: Potential economically viable solutions for a low-CO2 cement-based materials industry” and “Cost and performance of fossil fuel power plants with CO2 capture and storage” were the other most cited articles, with 530 and 516 citations, respectively. According to Table 6, the four most cited articles crossed the limit of 500 citations. The second method analyzed the articles based on citations per year, and the top ten articles are listed in Table 7. In this list, the most influential article was authored by Sarkodie and Strezov (2019) and had the highest number of citations per year. In this list, only two articles crossed the 100 citations per year.
Table 6. Top ten most cited articles in carbon capture and utilization (based on total citations).
Table 7. Top ten most cited articles in carbon capture and utilization (based on citations per year).
The first method preferred the older article, as they had more time to receive citations. Only 3 articles out of 10 were published in the last five years. On the other hand, there is a chance of a relatively new article in the second method, and 8 out of 10 were published in the last five years. Second, only two articles were present in both categories.

3.7. Potential Sources Publishing Research on Carbon Capture and Utilization

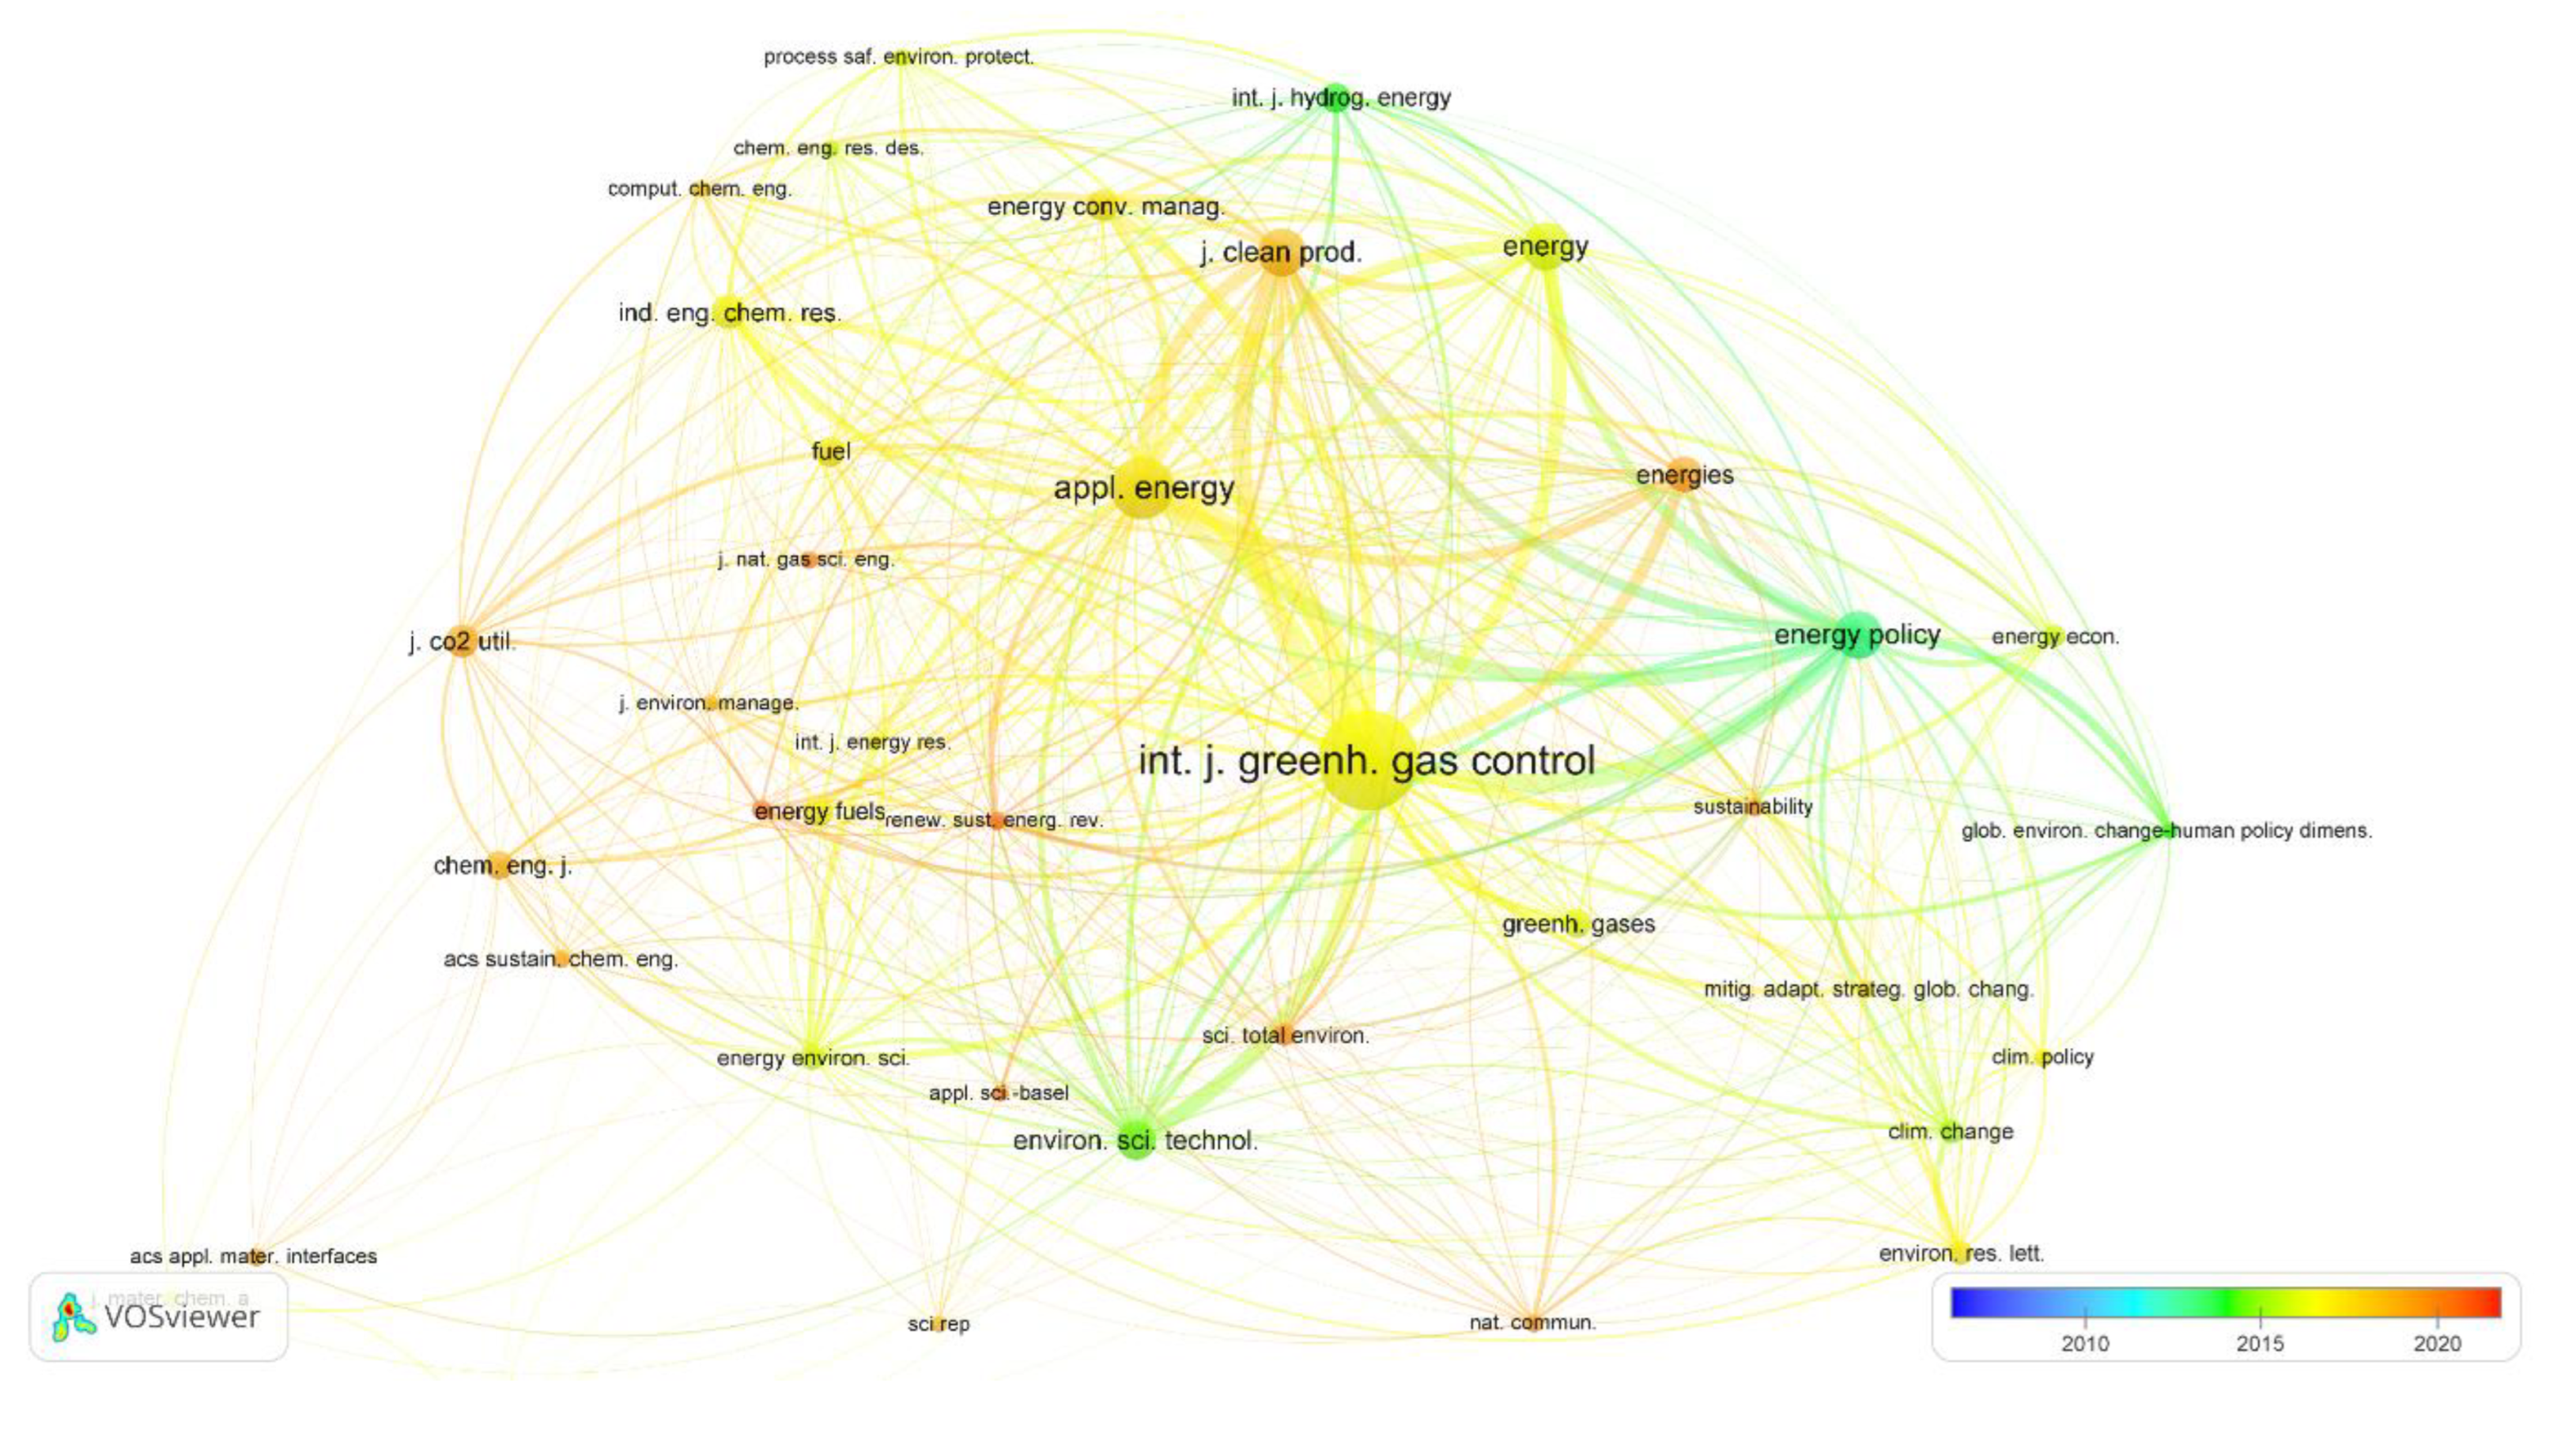
The use of VOSviewer resulted in the creation of a visualization map that provides an overlay depiction of journal publications on carbon capture and utilization research. The size of the circles represents the number of publications that a journal has, and the level of activity that the journal has had throughout time is reflected by the color of the nodes, as can be seen in Figure 5.
Figure 5. Visualization map of sources publishing research on carbon capture and utilization.
Most of the publications were published before or around 2015 in the journals Energy Policy, Environmental Science and Technology, International Journal of Hydrogen Energy, and Energy. Most of the publications created between 2015 and 2020 were published in the International Journal of Greenhouse Gas Control and Applied Energy, which is the most active publishing source. Emerging publishing sources, such as the journal of cleaner production, journal of energies, and journal of CO2 use were involved in creating the bulk of the publication around 2020.
There were 727 journals with at least one article related to carbon capture and utilization. Of these, 52.96% (385 journals) have published only one article, which indicates that they were not specialized journals on the topic. Another 14.86% of the journals have published two papers, 8.39% have published three, 4.68% four, and 19.20% of the journals (139 journals) have published five or more articles. The top ten journals, based on the number of articles, number of citations, and average article citations, are shown in Table 8. The International Journal of Greenhouse Gas Control was the most active source with 491 articles, followed by Applied Energy and the Journal of Cleaner Production with 213 and 136 articles, respectively. Based on the number of citations, the International Journal of Greenhouse Gas Control, Applied Energy and Energy Policy was ranked first, second, and third, with 11661, 8524, and 5916 citations, respectively. Based on the average citations per article, Environmental Science & Technology had the highest score (C/A = 46.94), followed by Energy Policy (C/A = 44.48) and Applied Energy (C/A = 40.02).
Table 8. Top ten sources publishing research on carbon capture and utilization (based on number of total articles).
The majority of the articles were published in Elsevier’s journals. Specifically, seven out of ten source titles were Elsevier’s journals; two journals were published by the American Chemical Society (ACS) and one by MDPI.

4. Collaboration Analysis

4.1. Co-Authorship Network

Figure 6 displays the results of an analysis performed using VOSviewer on the co-authorship pattern involving a number of different authors. A total of 13,272 authors contributed to this field of study. However, the overlay visualization map includes only authors, with a minimum of five publications each. This map does not include authors who were not associated with other authors. The width of the arc connecting the authors illustrates the extent to which they worked together on the publication, while the size of the circle represents the total number of publications. Individual colors employ the evolution stage with respect to time. For example, Faaij, Andre (from the University of Groningen, the Netherlands) and Van Den Broek, Machteld (from Utrecht University, the Netherlands), were very active before 2015 and had a strong co-authorship network with each other. Mac Dowell Nail (from Imperial College London, UK), who was top ranked (number of articles basis) and very active in the last five years (2017–2021), has a strong co-authorship network with Shah, Nilay (from Imperial College London, UK), and Fajardy, Mathilde (from University of Cambridge, UK). Other authors, including Zhang, Xian, Yang, Lin, Fan, Jing-Li and Xu, Mao, who were very active in the last five years (2017–2021), have a strong co-authorship network with each other.
Figure 6. Network visualization map of international researcher’s collaboration on carbon capture and utilization with a minimum of 5 publications.

4.2. Collaboration of Institutions

The collaboration network of the most active institutions involved in carbon capture and utilization research was created using VOSviewer, as shown in Figure 7. There was a total of 3,020 institutions involved in this research field, but Figure 7 only represents institutions with a minimum of 20 publications. The size of the circles represents the relative strength of publications, the color implies their evolution stage with respect to time, and the thickness of the arc shows the collaboration strength of the institutions. For example, it can be seen that Imperial College London, the Chinese Academy of Sciences, the University of Utrecht, the University of Edinburgh, the Norwegian University of Science and Technology, and the University of Sheffield were more active in this research field. The collaboration strength among these institutions was meager. The authors from the Chinese Academy of Sciences and the University Chinese Academy of Science collaborate strongly with each other. The authors from Imperial College London strongly collaborate with those from University College London, the University of Cambridge, and the Swiss Federal Institute of Technology. The authors from the University of Utrecht also have a strong collaboration with the authors of the University of Groningen, whereas there was a collaboration network between the authors of the University of Edinburgh and the University of Strathclyde.
Figure 7. Network visualization map of research collaboration among institutions on carbon capture and utilization, with a minimum of 20 publications.

4.3. Collaboration of Countries

The collaboration network of all countries involved in carbon capture and utilization research was created using VOSviewer and is shown in Figure 8. There was a total of 88 countries involved in this research field, but Figure 8 only represents countries with a minimum of 5 publications. The size of the circles represents the relative strength of publications, the color implies their evolution stage with respect to time, and the thickness of the arc shows the collaboration strength of the countries. It can be seen that China, the United States, and the United Kingdom were the most active countries working in this field after 2015. The authors from institutions in these countries collaborated with those from institutions in other countries, including Australia, Germany, Netherlands, Spain, and France. Authors from South Korean-based institutions have highly collaborated with authors from United States-based institutions. Authors from institutions in Germany and the Netherlands have also been strongly collaborating with each other. Although authors from other country-based institutions have collaborated with the authors of the most dominant countries, their collaboration strength is relatively low.
Figure 8. Network visualization map of research collaboration among countries/territories on carbon capture and utilization with a minimum of 5 publications.

5. Conclusions

This study presents a bibliometric analysis of carbon capture and utilization research published from 2007–2021 (15 years). It was found that substantial work in this domain is being carried out globally, including in developed and developing countries. Carbon capture and utilization research has received uneven attention worldwide, although several countries have published articles on the topic. The United States is the most active country, with 888 publications, followed by the United Kingdom (797 publications) and China (776 publications). Even though the United States has the most publications, no American institutions were on the top ten list. Imperial College London is among five British institutions on the top 10 list, taking first place with 121 publications. The 10 most influential authors were listed based on the number of publications, total citations, and citations per year. Niall Mac Dowell (Imperial College London, UK), Edward S. Rubin (Carnegie Mellon University, USA), and Hani M. El-Kaderi (Virginia Commonwealth University, USA) grabbed the top places in all these categories. International Journal of Greenhouse Gas Control, Applied Energy, Journal of Cleaner Production, Energy and Energy Policy were the top publishing sources with more than 100 publications. Finally, the collaboration network of authors, institutions, and countries was presented, and it was found that the authors in the top ten list have a significant co-authorship network with other authors and with each other. Collaboration networks for different institutions and countries were also involved in carbon capture and utilization research. Finally, it can be concluded that research on carbon capture and utilization is a growing area of research. The results obtained in this article allow researchers to use the references and trends identified to guide relevant future research in this field.

6. Limitations of the Study

There are some limitations to this study. First, even though the WoS database is one of the most reputable, some important articles available in other databases but not in the WoS database, may be overlooked. Second, there was a possibility that the source data contained errors. Some authors may have more than one name, use different initials, or have different names in different publications. This limitation may cause misunderstandings about the productivity of various authors, institutions, and countries and discrepancies in the bibliographic analysis. Third, data cleaning was conducted, including eliminating duplicates and incorrectly classifying documents. Even though this reduces inaccuracies, the study may still be affected by errors in the database. Future researchers can circumvent these issues by including other databases in their research.

Author Contributions

Conceptualization, M.N.; Project administration, A.S.M.; Resources, H.S.; Supervision, A.S.M.; Validation, M.N. and A.S.M.; Writing—original draft, M.N. and H.S.; Writing—review & editing, H.S. All authors have read and agreed to the published version of the manuscript.

Funding

This research received no external funding.

Institutional Review Board Statement

Not applicable.

Data Availability Statement

Raw data can be found in the Web of Science database.

Acknowledgments

The authors would like to thank Universiti Teknologi PETRONAS (UTP) for providing technical and administrative support.

Conflicts of Interest

The authors declare no conflict of interest.

References

  1. Florides, G.A.; Christodoulides, P. Global warming and carbon dioxide through sciences. Env. Int. 2009, 35, 390–401. [Google Scholar] [CrossRef] [PubMed]
  2. Xu, Y.; Cui, G. Influence of spectral characteristics of the Earth’s surface radiation on the greenhouse effect: Principles and mechanisms. Atmos. Environ. 2021, 244, 117908. [Google Scholar] [CrossRef]
  3. Tans, P.; Keeling, R. Earth System Research Laboratories (ESRL) Global Monitoring Laboratory–Carbon Cycle Greenhouse Gases, National Oceanic and Atmospheric Administration (NOAA); US Department of Commerce: Washington, DC, USA, 2021. [Google Scholar]
  4. Van Soest, H.L.; den Elzen, M.G.J.; van Vuuren, D.P. Net-zero emission targets for major emitting countries consistent with the Paris Agreement. Nat. Commun. 2021, 12, 2140. [Google Scholar] [CrossRef] [PubMed]
  5. Chen, S.; Liu, J.; Zhang, Q.; Teng, F.; McLellan, B.C. A critical review on deployment planning and risk analysis of carbon capture, utilization, and storage (CCUS) toward carbon neutrality. Renew. Sustain. Energy Rev. 2022, 167, 112537. [Google Scholar] [CrossRef]
  6. Piaggio, M.; Padilla, E. CO2 emissions and economic activity: Heterogeneity across countries and non-stationary series. Energy Policy 2012, 46, 370–381. [Google Scholar] [CrossRef]
  7. Suleman, H.; Fosbøl, P.L.; Nasir, R.; Ameen, M. Sustainable Carbon Capture: Technologies and Applications; CRC Press: Boca Raton, FL, USA, 2022. [Google Scholar]
  8. Aaron, D.; Tsouris, C. Separation of CO2 from flue gas: A review. Sep. Sci. Technol. 2005, 40, 321–348. [Google Scholar] [CrossRef]
  9. Philbin, S.P. Critical Analysis and Evaluation of the Technology Pathways for Carbon Capture and Utilization. Clean Technol. 2020, 2, 492–512. [Google Scholar] [CrossRef]
  10. Olfe-Kräutlein, B. Advancing CCU Technologies Pursuant to the SDGs: A Challenge for Policy Making. Front. Energy Res. 2020, 8, 198. [Google Scholar] [CrossRef]
  11. Jia, B.; Chen, Z.; Xian, C. Investigations of CO2 storage capacity and flow behavior in shale formation. J. Pet. Sci. Eng. 2022, 208, 109659. [Google Scholar] [CrossRef]
  12. Garcia-Garcia, G.; Fernandez, M.C.; Armstrong, K.; Woolass, S.; Styring, P. Analytical Review of Life-Cycle Environmental Impacts of Carbon Capture and Utilization Technologies. ChemSusChem 2021, 14, 995–1015. [Google Scholar] [CrossRef]
  13. Sifat, N.S.; Haseli, Y. A Critical Review of CO2 Capture Technologies and Prospects for Clean Power Generation. Energies 2019, 12, 4143. [Google Scholar] [CrossRef]
  14. Khalilpour, R.; Mumford, K.; Zhai, H.; Abbas, A.; Stevens, G.; Rubin, E.S. Membrane-based carbon capture from flue gas: A review. J. Cleaner Prod. 2015, 103, 286–300. [Google Scholar] [CrossRef]
  15. Nasir, R.; Mukhtar, H.; Man, Z.; Mohshim, D.F. Material Advancements in Fabrication of Mixed-Matrix Membranes. Chem. Eng. Technol. 2013, 36, 717–727. [Google Scholar] [CrossRef]
  16. Hussin, F.; Aroua, M.K. Recent trends in the development of adsorption technologies for carbon dioxide capture: A brief literature and patent reviews (2014–2018). J. Clean. Prod. 2020, 253, 119707. [Google Scholar] [CrossRef]
  17. Priestnall, M. Method and System of Activation of Mineral Silicate Minerals. U.S. Patent No. 9,963,351, 8 May 2018. [Google Scholar]
  18. Ding, M.; Flaig, R.W.; Jiang, H.-L.; Yaghi, O.M. Carbon capture and conversion using metal–organic frameworks and MOF-based materials. Chem. Soc. Rev. 2019, 48, 2783–2828. [Google Scholar] [CrossRef]
  19. Dean, C.C.; Blamey, J.; Florin, N.H.; Al-Jeboori, M.J.; Fennell, P.S. The calcium looping cycle for CO2 capture from power generation, cement manufacture and hydrogen production. Chem. Eng. Res. Des. 2011, 89, 836–855. [Google Scholar] [CrossRef]
  20. Chai, S.Y.W.; Ngu, L.H.; How, B.S.; Chin, M.Y.; Abdouka, K.; Adini, M.J.B.A.; Kassim, A.M. Review of CO2 capture in construction-related industry and their utilization. Int. J. Greenhouse Gas Control 2022, 119, 103727. [Google Scholar] [CrossRef]
  21. Tcvetkov, P.; Cherepovitsyn, A.; Fedoseev, S. The Changing Role of CO2 in the Transition to a Circular Economy: Review of Carbon Sequestration Projects. Sustainability 2019, 11, 5834. [Google Scholar] [CrossRef]
  22. Jones, C.R.; Olfe-Kräutlein, B.; Naims, H.; Armstrong, K. The Social Acceptance of Carbon Dioxide Utilisation: A Review and Research Agenda. Front. Energy Res. 2017, 5, 11. [Google Scholar] [CrossRef]
  23. Cuéllar-Franca, R.M.; Azapagic, A. Carbon capture, storage and utilisation technologies: A critical analysis and comparison of their life cycle environmental impacts. J. CO2 Util. 2015, 9, 82–102. [Google Scholar] [CrossRef]
  24. Thonemann, N. Environmental impacts of CO2-based chemical production: A systematic literature review and meta-analysis. Appl. Energy 2020, 263, 114599. [Google Scholar] [CrossRef]
  25. Lamberts-Van Assche, H.; Compernolle, T. Economic feasibility studies for Carbon Capture and Utilization technologies: A tutorial review. Clean Technol. Environ. Policy 2022, 24, 467–491. [Google Scholar] [CrossRef]
  26. Carmona-Serrano, N.; Moreno-Guerrero, A.-J.; Marín-Marín, J.-A.; López-Belmonte, J. Evolution of the Autism Literature and the Influence of Parents: A Scientific Mapping in Web of Science. Brain Sci. 2021, 11, 74. [Google Scholar] [CrossRef] [PubMed]
  27. Kamran, M.; Khan, H.U.; Nisar, W.; Farooq, M.; Rehman, S.-U. Blockchain and Internet of Things: A bibliometric study. Comp. Electr. Eng. 2020, 81, 106525. [Google Scholar] [CrossRef]
  28. Wang, L.-H.; Wang, Q.; Zhang, X.; Cai, W.; Sun, X. A bibliometric analysis of anaerobic digestion for methane research during the period 1994–2011. J. Mater. Cycles Waste Manag. 2013, 15, 1–8. [Google Scholar] [CrossRef]
  29. Alauddin, M.; Khan, F.; Imtiaz, S.; Ahmed, S. A bibliometric review and analysis of data-driven fault detection and diagnosis methods for process systems. Ind. Eng. Chem. Res. 2018, 57, 10719–10735. [Google Scholar] [CrossRef]
  30. Amin, M.T.; Khan, F.; Amyotte, P. A bibliometric review of process safety and risk analysis. Process Saf. Environ. Protect. 2019, 126, 366–381. [Google Scholar] [CrossRef]
  31. Athar, M.; Shariff, A.M.; Buang, A. A review of inherent assessment for sustainable process design. J. Clean. Prod. 2019, 233, 242–263. [Google Scholar] [CrossRef]
  32. Ali, H.; Soleimani, H.; Yahya, N.; Khodapanah, L.; Sabet, M.; Demiral, B.M.R.; Hussain, T.; Adebayo, L.L. Enhanced oil recovery by using electromagnetic-assisted nanofluids: A review. J. Mol. Liq. 2020, 309, 113095. [Google Scholar] [CrossRef]
  33. Ferrari, G.; Pezzuolo, A.; Nizami, A.-S.; Marinello, F. Bibliometric Analysis of Trends in Biomass for Bioenergy Research. Energies 2020, 13, 3714. [Google Scholar] [CrossRef]
  34. Sridhar, A.; Ponnuchamy, M.; Senthil Kumar, P.; Kapoor, A.; Xiao, L. Progress in the production of hydrogen energy from food waste: A bibliometric analysis. Int. J. Hydrogen Energy 2022, 47, 26326–26354. [Google Scholar] [CrossRef]
  35. Zhang, Z.; Yao, Z.-Z.; Xiang, S.; Chen, B. Perspective of microporous metal–organic frameworks for CO2 capture and separation. Energy Environ. Sci. 2014, 7, 2868–2899. [Google Scholar] [CrossRef]
  36. Scrivener, K.L.; John, V.M.; Gartner, E.M. Eco-efficient cements: Potential economically viable solutions for a low-CO2 cement-based materials industry. Cement Concr. Res. 2018, 114, 2–26. [Google Scholar] [CrossRef]
  37. Rubin, E.S.; Chen, C.; Rao, A.B. Cost and performance of fossil fuel power plants with CO2 capture and storage. Energy Policy 2007, 35, 4444–4454. [Google Scholar] [CrossRef]
  38. Gibbins, J.; Chalmers, H. Carbon capture and storage. Energy Policy 2008, 36, 4317–4322. [Google Scholar] [CrossRef]
  39. Rubin, E.S.; Davison, J.E.; Herzog, H.J. The cost of CO2 capture and storage. Int. J. Greenh. Gas Control 2015, 40, 378–400. [Google Scholar] [CrossRef]
  40. Shaner, M.R.; Atwater, H.A.; Lewis, N.S.; McFarland, E.W. A comparative technoeconomic analysis of renewable hydrogen production using solar energy. Energy Environ. Sci. 2016, 9, 2354–2371. [Google Scholar] [CrossRef]
  41. Sarkodie, S.A.; Strezov, V. Effect of foreign direct investments, economic development and energy consumption on greenhouse gas emissions in developing countries. Sci. Total Environ. 2019, 646, 862–871. [Google Scholar] [CrossRef]
  42. Weisser, D. A guide to life-cycle greenhouse gas (GHG) emissions from electric supply technologies. Energy 2007, 32, 1543–1559. [Google Scholar] [CrossRef]
  43. Mac Dowell, N.; Fennell, P.S.; Shah, N.; Maitland, G.C. The role of CO2 capture and utilization in mitigating climate change. Nat. Climate Chang. 2017, 7, 243–249. [Google Scholar] [CrossRef] [Green Version]
  44. Puxty, G.; Rowland, R.; Allport, A.; Yang, Q.; Bown, M.; Burns, R.; Maeder, M.; Attalla, M. Carbon Dioxide Postcombustion Capture: A Novel Screening Study of the Carbon Dioxide Absorption Performance of 76 Amines. Environ. Sci. Technol. 2009, 43, 6427–6433. [Google Scholar] [CrossRef]
  45. Zappa, W.; Junginger, M.; van den Broek, M. Is a 100% renewable European power system feasible by 2050? Appl. Energy 2019, 233–234, 1027–1050. [Google Scholar] [CrossRef]
  46. Wilberforce, T.; Olabi, A.G.; Sayed, E.T.; Elsaid, K.; Abdelkareem, M.A. Progress in carbon capture technologies. Sci. Total Environ. 2021, 761, 143203. [Google Scholar] [CrossRef] [PubMed]
  47. Tong, D.; Zhang, Q.; Zheng, Y.; Caldeira, K.; Shearer, C.; Hong, C.; Qin, Y.; Davis, S.J. Committed emissions from existing energy infrastructure jeopardize 1.5 °C climate target. Nature 2019, 572, 373–377. [Google Scholar] [CrossRef] [PubMed]
  48. Fasihi, M.; Efimova, O.; Breyer, C. Techno-economic assessment of CO2 direct air capture plants. J. Clean. Prod. 2019, 224, 957–980. [Google Scholar] [CrossRef]
  49. Van Vuuren, D.P.; Stehfest, E.; Gernaat, D.E.H.J.; van den Berg, M.; Bijl, D.L.; de Boer, H.S.; Daioglou, V.; Doelman, J.C.; Edelenbosch, O.Y.; Harmsen, M.; et al. Alternative pathways to the 1.5 °C target reduce the need for negative emission technologies. Nat. Climate Chang. 2018, 8, 391–397. [Google Scholar] [CrossRef] [Green Version]
Publisher’s Note: MDPI stays neutral with regard to jurisdictional claims in published maps and institutional affiliations.

Article Metrics

Citations

Article Access Statistics

Multiple requests from the same IP address are counted as one view.