Abstract
A simple semi-empirical gas-dynamic approach for measuring the instantaneous mass flow rate of gasification products of low-melting solid material (polypropylene) in a flow-through gas generator with ambient-temperature air as gasifying agent is proposed. The approach is validated experimentally in the direct-connect facility allowing for the short-term (~0.5 s) heating of incoming air up to ~1700 K by hydrogen injection and ignition or by pyrotechnic charge activation. The application of the proposed method for processing experimental data for 9 (of over 100) selected typical test fires showed that the time-averaged total yield of polypropylene gasification products varied from 43 to 120 g/s, while the air-to-gasification product mass ratio was 2.3–2.9. The results of all conducted experiments confirm the applicability of the proposed approach for determining the mass flow rate of gasification products. The universality of the proposed approach is confirmed by applying two different schemes of gas generator: one with hydrogen ignition and another with pyro-charge ignition.
1. Introduction
Gas generators (GGs) are used for generating gases with the desired composition, flow rate, temperature, and pressure due to the gasification/vaporization and/or combustion of solid or liquid materials. All GGs can be divided into two groups: single-action closed-type GGs, in which all ingredients are initially enclosed in a single housing, and flow-through GGs, in which a working medium is continuously supplied to the GG inlet, ensuring the continuous operation of the GG. Thus, the GGs of liquid propellant rocket engines [1], solid propellant engines [2], hybrid rockets [3,4,5,6,7], and solid-fuel ramjets [8,9,10] can be attributed to closed-type GGs. Closed-type GGs are also used in automobile airbags [11,12,13] and in fire extinguishing systems for the rapid production of large amounts of inert gas [14]. Flow-through GGs are widely used in the industry for the commercial production of gaseous chemicals. Additionally, flow-through GGs are used for converting solid wastes (biomass, sewage sludge, peat, plastics, coal, etc.) into a power gas for generating heat and electricity [15,16].
At present, when designing GGs, the numerical simulation of their operation is often used [17,18]. However, the existing physicochemical and mathematical models are not capable of predicting gas yield and quality with sufficient accuracy due to the complexity of gasification/vaporization and combustion processes. Therefore, in addition to numerical simulations, the design of GGs is accompanied by validation experiments and model refinement [19,20,21,22]. Experiments with phase transition and the combustion of liquid/solid materials are rather complicated both in terms of implementation and measurements. For example, in [23], a method for measuring the gasification rate of condensed matter by changing the electrical capacity of a variable volume combustion chamber using a microwave resonator was considered. In [24], the rate of solid fuel burnup in a hybrid rocket engine was determined using X-ray radiation. Because of the complexity of measuring the instantaneous fuel mass flow rate, researchers are usually use the end-point averaging method for estimating the average fuel mass flow rate based on the initial and final shapes of the fuel charge. However, the fuel mass flow rate is not constant during motor firings, and such a method is accompanied with large errors. The approach based on short firing duration for the end-point averaging (to diminish the error) is also not reliable due to the uncertainties introduced by ignition and shutdown transients. In the literature on hybrid rockets, there exist several reconstruction techniques for estimating the instantaneous fuel mass flow rate based on the measured chamber pressure and oxidizer mass flow rate, but their accuracy is still questionable (see [25] and references therein).
The objective of the present work is to develop a simple semi-empirical method for determining the instantaneous mass flow rate of gasification products of a low-melting solid material (LSM) charge in a flow-through GG. The main issue addressed is the feasibility of determining the instantaneous mass flow rate of gasification products by measuring the inlet/outlet pressure and temperature only. The objective and issue of the paper are the novel and distinctive features of the present work.
2. Experimental Setup
The experimental setup was assembled based on the Model Aerodynamic Facility (MAF) [26] shown in Figure 1. The MAF uses electrical heating of working gas and allows operating at the following parameters: stagnation pressure P0 up to 20 MPa, stagnation temperature T0 up to 800 K, mass flow rate of working gas up to 5 kg/s, and test duration from 1 to 10 s. For conducting the test fires described below using LSM gasification in a GG, the MAF was modified by replacing its settling chamber, nozzle, and test section by a flow-through GG according to the direct-connect scheme (Figure 2) and installing a vacuum tank downstream of GG to remove gasification products. In test fires, GGs with hydrogen- or pyro-charge-assisted ignition were used.
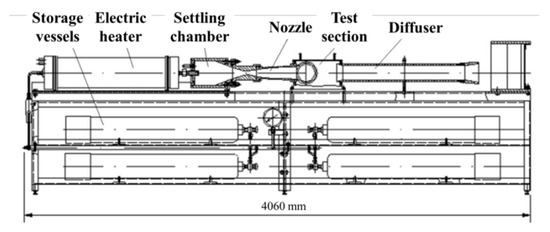
Figure 1.
Schematic of MAF.
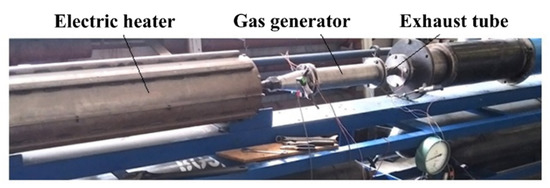
Figure 2.
Direct-connect scheme of flow-through GG.
2.1. Gas Generator with Hydrogen-Assisted Ignition
Figure 3 shows a schematic of GG with hydrogen-assisted ignition. Air from the MAF enters the GG through a throttling insert with throat diameter D1. Downstream of the insert, a provision is made for a fire heater operating on combustion of hydrogen to increase the temperature of the incoming air up to ~1700 K for a short time (~0.5 s). The hydrogen–air mixture is ignited with a spark plug. The mass of hydrogen used for ignition was less than 2 g. The inner cavity of the fire heater is partly covered with a heat-insulating insert. Polypropylene (PP) was used as LSM as it is gasified without formation of liquid phase (condensate). As will be shown later in this article, the approach developed herein was based on gas dynamic relationships that are not generally applicable to the two-phase flows containing liquid or solid particles. A PP test sample was placed in the combustion chamber of the GG in the form of 16 blocks with a diameter of 80 mm and a length of 25 mm connected in series (Figure 4). Each block had 61 holes with a diameter of 4 mm.
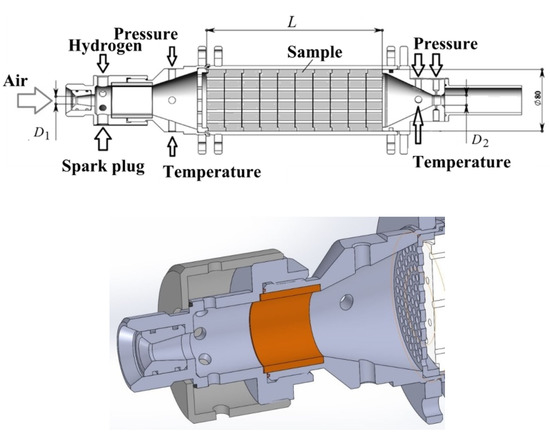
Figure 3.
Gas generator with hydrogen-assisted ignition.
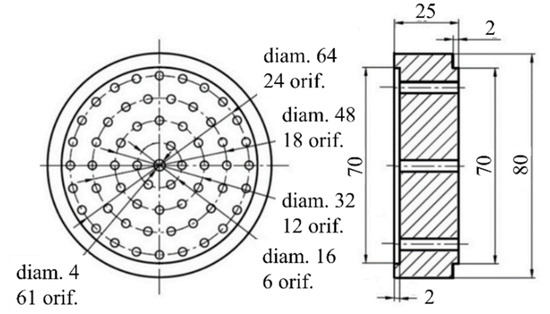
Figure 4.
Schematic of the polypropylene block. Dimensions are in millimeters.
When assembling the PP sample, the holes of all blocks are aligned, forming straight longitudinal channels. The total length of the PP sample was L = 368 mm. The total initial weight of the sample was 1.28 kg. A measuring sonic nozzle with throat diameter D2 = 20 mm was placed downstream of the combustion chamber in the GG. To measure the total pressure and temperature of the outgoing gas mixture, pressure sensor and thermocouples were installed upstream of the nozzle. The outgoing gas mixture was directed to the vacuum tank through a tube attached to the nozzle.
2.2. Gas Generator with Pyro-Charge-Assisted Ignition
Figure 5 shows a photo and schematic of the flow-through GG with pyro-charge assisted ignition. Air from the MAF enters the GG through a throttling insert with throat diameter D1. A ring-shaped pyro-charge weighing 36 g was placed in the cavity around the channel. The charge can be activated at a given time when voltage is applied to initiator on a command from synchronization system. Upon ignition, charge burning increases the temperature of the passing air. If the calorific value of charge material is ~2.0 MJ/kg then about 72-kJ energy is released during charge combustion. During 0.1–0.15 s of charge combustion, 22.5 g of air enters the channel. With full use of the supplied heat, the air at the GG inlet must be heated to about 2400 K. However, the actual air temperature in the experiments reaches a value of 900–1100 K only, thus indicating large heat losses into the walls of the ignition device. Upstream of the PP sample, a provision was made for the ports for measuring the total pressure and the stagnation temperature of the incoming air flow.
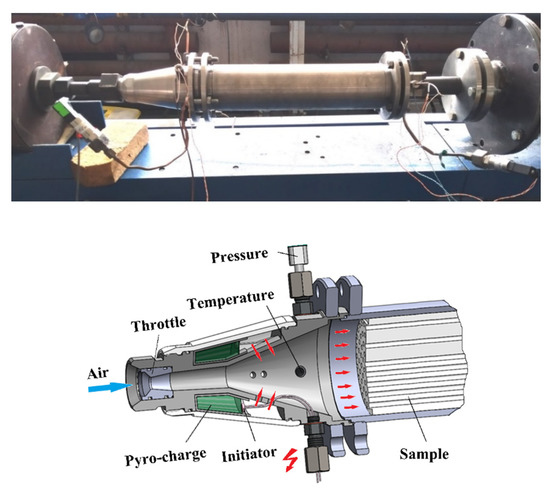
Figure 5.
Gas generator with pyro-charge-assisted ignition.
2.3. Measurements
In test fires, gas flow parameters were recorded both upstream and downstream of the PP sample. The measured parameters upstream of the PP sample included the stagnation pressure in the facility storage vessels as well as gas flow total pressure and temperature at the inlet to the combustion chamber of the GG. The measured parameters downstream of the PP sample included the total pressure and stagnation temperature provided by pressure sensor and three tungsten–rhenium thermocouples upstream of the sonic nozzle at GG outlet. In addition, a static pressure sensor was placed in the nozzle throat, which allows measuring the static pressure to control a local flow Mach number.
For pressure measurements, RPD-I pressure sensors with measurement ranges up to 1.0 and 2.5 MPa were used. The rated measurement error of the pressure sensors was 0.2%. The actual pressure measurement error was established by the results of numerous calibrations of the sensors in the expected pressure range. In this case, to control the set pressure, a PDE-020I reference pressure transducer was used with a basic relative error of ±0.02%. The resulting estimate of the actual pressure measurement error did not exceed 1%.
For temperature measurements, tungsten–rhenium thermocouples were used. To convert the electrical signal of thermocouples into temperature readings, a standard calibration table was used. The temperature measurement error did not exceed 5%.
The data acquisition system was based on the National Instruments NI PCI-6255 board. The system has 80 differential measuring channels. The bit depth of the analog-to-digital converter (ADC) was 16 bits. The maximum sampling frequency was 1.25 MHz. In the experiments, a sampling frequency of 1000 samples for each channel was used. The frequency characteristics of the measuring equipment including pressure and temperature sensors as well as the data acquisition system were measured by applying preset pulse signals. It is shown based on the results of such dynamic tests that the operation frequency of the measuring equipment used ranges from 0 to 100 Hz. Since the characteristic frequencies of the processes under investigation do not exceed 10 Hz, dynamic measurement errors were not considered and were not taken into account.
In addition to measuring gas pressure and temperature, the change in the mass of the PP sample was measured by weighing the sample and its separate blocks before and after test fires. The error in mass measurements was 0.05 g.
The experimental study included more than 100 experiments. In the following, we discuss only 9 selected test fires with typical results.
3. Data Processing Procedure
3.1. Mass Flow Rate at GG Inlet
For determining the air mass flow rate through the GG, we calculated the time history of pressure in the air storage vessel of a known volume V with known values of initial pressure and temperature at adiabatic outflow of air through a critical opening with a cross-sectional area [26]:
where
is time, = 1.4 is the constant specific heat ratio, is the mass flow rate for choked flow at = 0, is the initial mass of air in the storage vessel, is the gas constant, and = 0.0404 (kg·K/J)1/2 for the air flow. The value of was selected to fit the curve predicted by Equation (1) with the pressure drop in the storage vessel measured by a pressure sensor. After was determined, the air mass flow rate was calculated from the relationship:
Figure 6 shows an example of determining the air mass flow rate through the GG in one of test fires (test fire #4, see below) with = 3.74 MPa, = 290 K, = 1.4, = 287 J/kg/K, = 0.0404 (kg·K/J)1/2, = 20.83 mm2, = 0.002554 1/s, and = 0.181 kg/s. At time = 0.8 s, the air supply valve is opened, and the pressure in the air storage vessel starts to decrease (Figure 6a). At time = 5.3 s, the valve is closed, and air supply is stopped. The dashed curve shows the approximation of the measured pressure curve according to Equation (1). On the one hand, this equation was used to determine the value of , and then the function was determined according to Equation (2) (Figure 6b). Thereafter, the mean mass flow rate of air during test fire was calculated. According to estimates [26], this method allows determining the air mass flow rate with an error of less than 1.0%. On the other hand, the mean mass flow rate of air was calculated based on the difference in the mass of air in the storage vessel before and after test fire (taking the change in temperature into account) based on the measured values of initial and final pressure and test duration. The difference between the values of mean mass flow rates thus obtained does not exceed 0.1%.
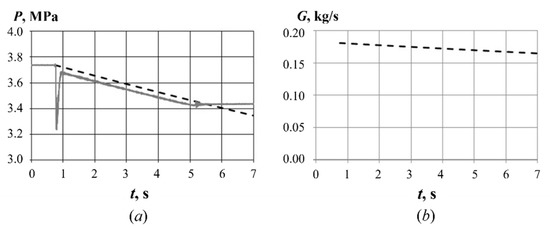
Figure 6.
Example of determining the air mass flow rate Gin(t) in one of test fires (test fire #4, see below): (a) time history of pressure in the air storage vessel (solid curve) and its approximation (dashed curve) according to Equation (1), and (b) time history of the air mass flow rate according to Equation (2).
3.2. Mass Flow Rate at GG Outlet
When heated air flows through the PP sample, the PP material undergoes gasification, and gasification products mix with the passing air flow. Moreover, the gasification products are partly oxidized by air (combusted in air), leading to heat release. This heat causes additional gasification of the sample, thus increasing the amount of gasification products in the gas mixture. The task is to determine the increased mass flow rate of the gas mixture at the GG outlet. In test fires, the mass flow rate of gas mixture was determined using a sonic nozzle installed at the GG outlet. The gas flow stagnation pressure and stagnation temperature measured upstream of the nozzle allow the calculation of the choked-flow mass flow rate :
where is the cross-sectional area of nozzle throat. The presence of sonic velocity in the nozzle throat is checked against the measured static-to-total pressure ratio in each test fire. Typical values of this ratio range from 0.5 to 0.6, which allows taking the area for further calculations with an error below 1%. The main difficulty of Equation (3) is to determine a value of constant coefficient , which depends on the thermophysical properties of the gas mixture:
where and refer to the gas mixture flowing through the sonic nozzle and depend on the unknown mixture temperature, pressure, and composition. Figure 7 shows typical values of depending on temperature and initial composition of the PP–air system at 1 MPa obtained by iterations using the Astra 4 code [27]. As can be seen, varies from 0.0404 to 0.0300 (kg·K/J)1/2. This variation leads to a change in the calculated mass flow rate of gas mixture by 30%. Noteworthy, when the pressure varies from 0.1 to 1.0 MPa, the value of changes by less than 3%. The present authors’ experience in processing experimental data shows that coefficient can be considered constant with a good accuracy (see below).
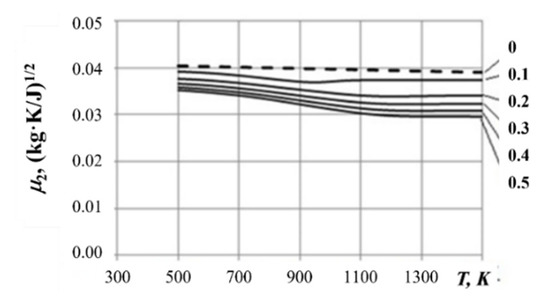
Figure 7.
Coefficient for calculating gas mass flow rate at GG outlet depending on the PP-to-air mass ratio at 1 MPa.
3.3. Mass Flow Rate of Gasification Products
An important step in the data processing technique under consideration is the determination of the mass of PP sample before () and after () test fire. The difference between and , (), determines the amount of sample material converted to gas, which flows out of the GG in the form of gasification products. The comparison of gas mass flow rates at GG inlet and outlet with the change in the sample total mass allows writing a mass balance equation in the following form:
Here, the lower integration limit () corresponds to the beginning of air temperature rise when the igniter is triggered, and the upper one () corresponds to the shutdown of air supply; and stands for discrepancy between two methods of determining the decrease in sample total mass: by weighing (left-hand side of Equation (5)) and by integrating the mass flow rates and (right-hand side of Equation (5)). The instantaneous mass flow rate of gasification products, , can be determined as:
When the value of is found by iterative procedure depending on instantaneous temperature, pressure, and initial composition of the PP–air system (see Equation (4)), then must be equal to unity. Deviation from the unity indicates a level of measurement error. When the value of is unknown, one can take an arbitrary constant value of (e.g., 0.0404 (kg·K/J)1/2 for pure air, see Figure 7) and use Equations (5) and (6) for determining the first approximation of , that is , and a value of . This value of can be further considered as a correction factor for calculating the corrected mass flow rate of gasification products, , using the relationship:
Figure 8 illustrates the procedure of determining the corrected mass flow rate of gasification products, , for one of the test fires (test fire #9, see below). By the iteration process mentioned earlier one can obtain a value of = const = 0.0349 (kg·K/J)1/2 for this test case. The corresponding curves for and are represented in Figure 8a,b. To avoid iterations, let us assume for a constant value of 0.0404 (kg·K/J)1/2 corresponding to pure air. The curves and obtained for such a value of are represented in Figure 8a,b. Accordingly, the time integral of the mass flow rate of gasification products along curve in Figure 8b (i.e., the integral in the right-hand side of Equation (5)) exceeds the value of determined by sample weighing (shaded area in Figure 8a) by a factor of 1.62. Thus, coefficient in Equation (5) takes a value of 1/1.62 = 0.617. The corrected mass flow rate was then calculated from Equation (7) and represented by curve in Figure 8b. Now, one can see a fairly accurate agreement between curves and in Figure 8b. The difference between these curves is represented by curve in Figure 8b. The relative difference between and is less than 8%.
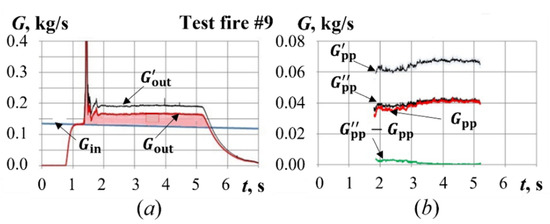
Figure 8.
Calculated time histories of total gas mass flow rates (a) and mass flow rate of gasification products (b) for test fire #9.
4. Typical Test Fires
4.1. Test Fires with Hydrogen-Assisted Ignition
Figure 9 shows the typical time histories of gas pressure and temperature in test fires without and with PP sample combustion. Air is supplied to the GG from facility storage vessels in 0.5 s after triggering the data acquisition system. Hydrogen is supplied to the GG during 0.5 s (from 1.5 to 2.0 s after triggering the data acquisition system). The spark plug is then turned on for 0.3 s followed by hydrogen ignition. It was experimentally established that reliable ignition of the PP sample in this design of the experimental setup occurred when the air-to-hydrogen equivalence ratio, α, in the burning mixture upstream of the PP sample was in the range of 1.4–1.6, i.e., the mixture was fuel lean. Therefore, other values of α were not considered. The total hydrogen consumption during ignition stage is 2.2–2.4 g with the rate of consumption of 4.2–4.6 g/s. The air-to-hydrogen equivalence ratio in the burning mixture upstream of the PP sample is α ≈ 1.4–1.6, i.e., the mixture is fuel lean. Due to hydrogen combustion, the temperature of the passing air increases sharply and provides PP sample ignition. After cutting hydrogen supply, cold air at ambient temperature (290 K) continues flowing into the GG, while the combustion of the PP pyrolysis products continues in the cold air flow for about 3 s. Thus, the mass flow rate of gasification products is manly measured after ignition, when hydrogen is not supplied and its influence does not need to be taken into account.
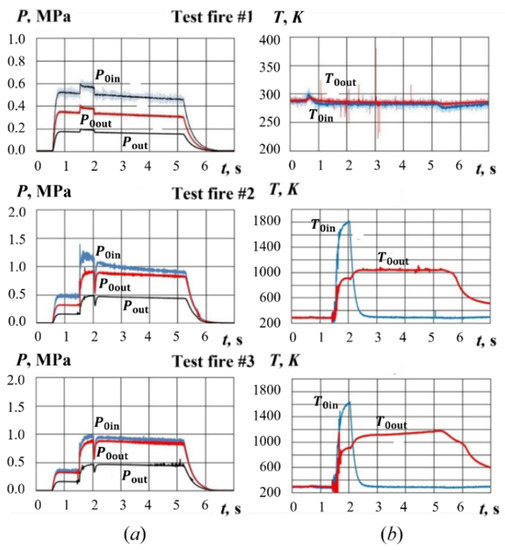
Figure 9.
Time histories of (a) pressure and (b) temperature at PP sample inlet and outlet in test fires #1 to #3.
Test fire #1 in Figure 9 is a reference experiment without hydrogen ignition (spark plug is purposefully not activated). In this test fire, only a slight pressure rise caused by hydrogen supply is detected, while the temperatures at the PP sample inlet and outlet remain constant (ambient temperature). The sample mass is also not changed in this test fire. In test fires #2 and #3, the activation of spark plug results in hydrogen combustion followed by ignition and self-sustaining combustion of the PP sample. As seen, hydrogen assisted ignition of the PP sample results in a sharp pressure rise both at the sample inlet and outlet by a factor of 1.5–2. During ignition, the temperature at sample inlet and outlet increases to 1600–1800 K and 800–1000 K, respectively. If hydrogen consumption during ignition is taken equal to a mean value of 2.3 g (as discussed earlier in the paper), then combustion of this amount of hydrogen would release an energy of 120,000,000 × 0.0023 = 276,000 J. The air consumption during ignition is ~120 g. With the full use of the heat of hydrogen combustion, the air should have been heated to temperature 276,000/1000/0.120 + 300 = 2600 K. However, the actual temperature of the heated air at the sample inlet is below 1800 K. This means that the heat loss to the GG walls upstream of the PP sample is about 45%. After termination of hydrogen supply, the gas temperature at the sample inlet is seen to drop to 290 K, whereas the gas temperature at the sample outlet remains virtually constant at 1000–1100 K. This indicates that PP gasification products react with air leading to additional heat release.
4.2. Test Fires with Pyro-Charge-Assisted Ignition
Figure 10 shows typical time histories of gas pressure and temperature in test fires without ignition of PP sample. In test fire #4, a pyro-charge is not ignited despite the initiator being triggered. Therefore, the pressure sensors do not show any changes, and the temperature sensors register only a slight temperature rise (10–20 K). In test fire #5, a pyro-charge is ignited and the gas temperature at the sample inlet increases to 950 K. However, the PP sample itself is not ignited, and the gas temperatures at sample inlet and outlet drops to 290 K in 0.5 s.
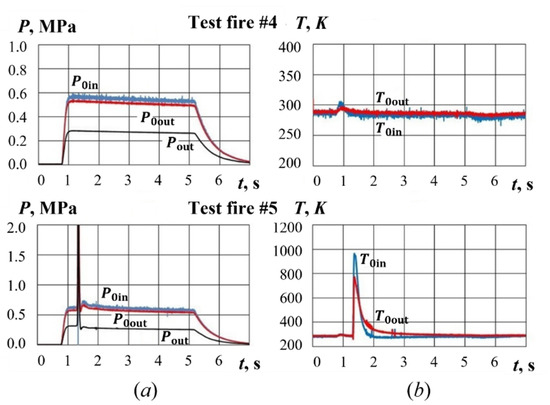
Figure 10.
Time histories of (a) pressure and (b) temperature at PP sample inlet and outlet in test fires #4 and #5.
Figure 11 shows the typical time histories of gas pressure and temperature in test fires with the ignition, combustion, and gasification of PP sample. In test fires #6 to #9, after pyro-charge ignition, the gas temperature at sample inlet increases to 900–1100 K and the PP sample is ignited. As for the pressure, its values at sample inlet and outlet increase by a factor of 2.5–3.0. It is noteworthy that the pressures at sample inlet and outlet are virtually the same, which is indicative of the subsonic flow in sample channels with a low total pressure loss. After ignition, the temperature at sample inlet decreases to 290 K, whereas the temperature at sample outlet remains at 1000–1100 K until the shutdown of the air supply. The latter indicates the presence of PP sample combustion and gasification.
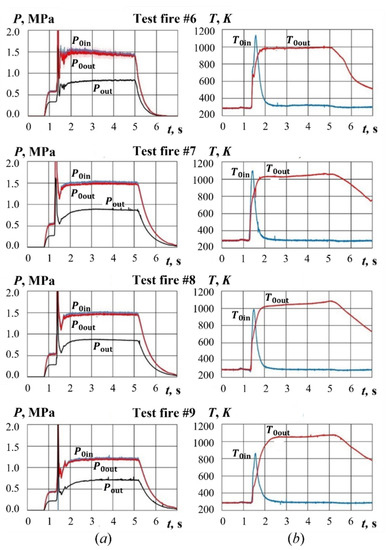
Figure 11.
Time histories of (a) pressure and (b) temperature at PP sample inlet and outlet in test fires #6 to #9.
5. Results and Discussion
5.1. Yield of Gasification Products with Hydrogen-Assisted Ignition
Figure 12 shows the time histories of gas mass flow rates at GG inlet, , and outlet, , as well as the mass flow rates of gasification products, , calculated based on experimental data for test fires #1 to #3 with hydrogen-assisted ignition. For calculating , , and , the procedure described in Section 3 was used. In test fire #1 without combustion, calculations show the appearance of an additional mass flow rate at GG outlet due to hydrogen supply. This additional mass flow rate does not exceed 3 g/s and can be readily considered in calculations using realistic properties of hydrogen and air for air-to-fuel ratio ≈ 1.5. In test fires #2 and #3 with hydrogen-assisted ignition, the duration of a high-temperature ignition pulse is 0.5 s. Therefore, the total yield of sample gasification products can include a noticeable contribution of the ignition stage. The adopted approach to processing the experimental data allows separating the yield of gasification products during ignition (with air temperature = 1600–1800 K) and during further combustion at a low temperature of incoming air. This separation is clearly seen in Figure 12.
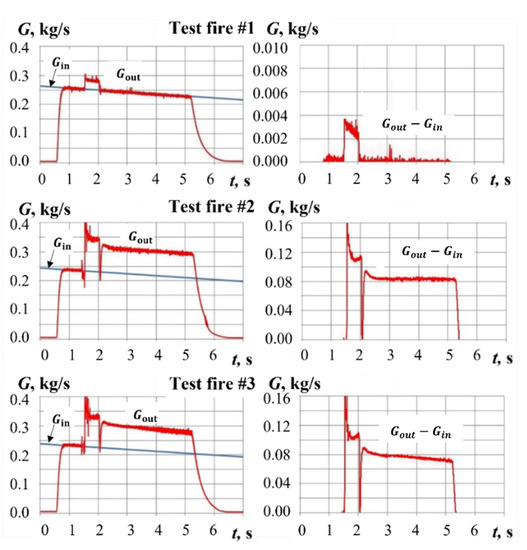
Figure 12.
Calculated mass flow rates Gin(t), Gout(t), and Gout(t) − Gin(t) in test fires #1 to #3.
Table 1 shows the operation parameters of gasification process in test fires with hydrogen-assisted ignition. Upon ignition, the yield of gasification products reaches 107–121 g/s due to the high air temperature at sample inlet. Later, when the temperature of the incoming air decreases to an ambient temperature, the mass flow rate of gasification products decreases to 72–82 g/s. The measurements of PP sample mass before and after test fires confirm a significant decrease in sample mass (by 283–338 g) due to PP gasification. The time-averaged ratio of the total mass of air to the total yield of PP gasification products varies from 2.46 to 2.87.

Table 1.
Operation parameters of GG at hydrogen-assisted ignition.
5.2. Yield of Gasification Products with Pyro-Charge-Assisted Ignition
Figure 13 and Figure 14 show the time histories of gas mass flow rates at GG inlet, , and outlet, , as well as the mass flow rates of gasification products, , calculated based on experimental data for test fires #4 and #5 with pyro-charge assisted ignition. For calculating , , and , the procedure described in Section 3 was used. In test fire #4, ignition is not activated. As a result, the mass flow rates of gas (air) at GG inlet and outlet are nearly the same. The difference in mass flow rates does not exceed 1 g/s. In test fire #5, despite the activation of pyro-charge ignition, a PP sample is not ignited. The total yield of gasification products is virtually zero, except for a small amount generated during pyro-charge ignition. In this test fire, a decrease in sample mass by about 10 g is detected.
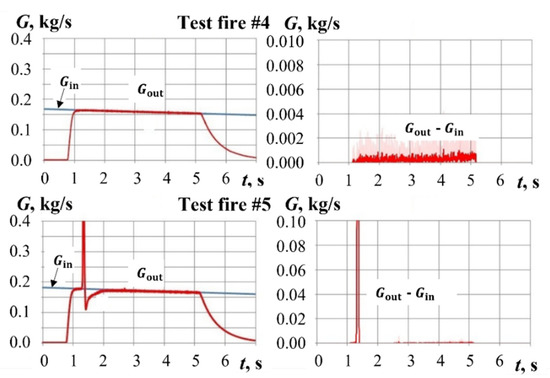
Figure 13.
Calculated mass flow rates Gin(t), Gout(t), and Gout(t) − Gin(t) in test fires #4 and #5.
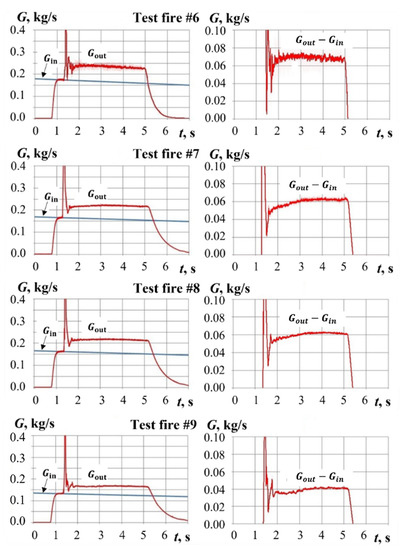
Figure 14.
Calculated mass flow rates Gin(t), Gout(t), and Gout(t) − Gin(t) in test fires #6 to #9.
In test fires #6 to #9, PP sample ignition and combustion in air flow was registered. As seen from Figure 14, the yield of gasification products remains virtually constant until shutdown of air supply. The duration of pyro-charge combustion does not exceed 0.15 s. The temperature of ignition pulse is relatively low (less than 1100 K). Therefore, the contribution of the ignition stage to the total yield of gasification products can be neglected.
Table 2 shows the operation parameters of gasification process in test fires with pyro-charge-assisted ignition. The mass flow rate of gasification products varies from 43 to 71 g/s. The measurements of PP sample mass before and after test fires confirms a significant decrease in sample mass (by 180–276 g) due to PP gasification. The time-averaged ratio of the total mass of air to the total yield of PP gasification products varies from 2.34 to 2.90.

Table 2.
Operation parameters of GG at pyro-charge-assisted ignition.
Thus, for the GGs with hydrogen ignition and with pyro-charge ignition, the time-averaged ratio of the total mass of air to the total yields of PP gasification products appeared to be quite close: 2.46 to 2.87 and 2.34 to 2.90, respectively. This can be related to the universality of the proposed method. Additionally, the method can be readily applied to LMSs other than polypropylene if they are gasified without the formation of the liquid phase (condensate), since the method is based on gas dynamic relationships not generally applicable to the two-phase flows containing liquid or solid particles. One of the subjects of further research is the uncertainty analysis of the proposed method.
6. Conclusions
A simple semi-empirical method for determining the instantaneous mass flow rate of gasification products of low-melting solid materials in a flow-through gas generator was proposed. The method is based on measuring the instantaneous mass flow rate of gas mixture at gas-generator inlet and outlet by gas-dynamic techniques. We presented the procedures of calculating the air mass flow rate at the gas-generator inlet, the mass flow rate of gaseous mixture at the gas-generator outlet, as well as the mass flow rate and yield of gasification products. The corresponding measurement errors were estimated. To demonstrate the method, a series of over 100 test fires of flow-through gas generator with polypropylene sample gasification was conducted using ambient-temperature air as a gasifying agent. The ignition of a polypropylene sample was triggered either by short-term hydrogen injection and ignition or by activating a pyro-charge during 0.1–0.5 s. After sample ignition, the gasification process was continued due to sample combustion in the air flow. The application of the proposed method for processing experimental data for the nine selected typical test fires showed that the time-averaged yield of polypropylene gasification products varied from 43 to 120 g/s, while the ratio of the mass of air to the yield of gasification products varied from 2.30 to 2.90. The results of other experiments not discussed herein confirm the applicability of the proposed method for determining the mass flow rate of gasification products. The universality of the proposed method was confirmed by applying two different schemes of gas generator: one with hydrogen ignition and another with pyro-charge ignition. The method can be readily applied to low-melting solid materials other than polypropylene if they are gasified without formation of liquid phase (condensate), since the method is based on gas dynamic relationships not generally applicable to the two-phase flows containing liquid or solid particles.
Further work will be focused on the uncertainty analysis of the proposed method.
Author Contributions
V.I.Z.: conceptualization, methodology; D.A.V.: investigation; D.G.N.: investigation; S.M.F.: writing—original draft and editing, project administration. All authors have read and agreed to the published version of the manuscript.
Funding
This work was financially supported by the Ministry of Science and Higher Education of Russian Federation under state contract N13.1902.21.0014 (agreement N075-15-2020-806).
Institutional Review Board Statement
Not applicable.
Informed Consent Statement
Not applicable.
Data Availability Statement
The data presented in this study are available upon request from the corresponding author.
Conflicts of Interest
The authors declare no conflict of interest.
References
- Sutton, G.P.; Biblarz, O. Rocket Propulsion Elements, 9th ed.; Wiley: New York, NY, USA, 2017. [Google Scholar]
- Freesmeier, J.J.; Butler, P.B. Analysis of a Hybrid Dual-Combustion-Chamber Solid-Propellant Gas Generator. J. Propuls. Power 1999, 15, 552–561. [Google Scholar] [CrossRef]
- Karabeyoglu, A.; Zilliac, G.; Cantwell, B.J.; DeZilwa, S.; Castellucci, P. Scale-up Tests of High Regression Rate Paraffin-Based Hybrid Rocket Fuels. J. Propuls. Power 2004, 20, 1037–1045. [Google Scholar] [CrossRef]
- Galfetti, L.; Merotto, L.; Boiocchi, M.; Maggi, F.; DeLuca, L.T. Experimental Investigation of Paraffin-Based Fuels for Hybrid Rocket Propulsion. In Progress in Propulsion Physics; DeLuca, L., Bonnal, C., Haidn, O., Frolov, S., Eds.; EUCASS Advances in Aerospace Sciences Book Series; EDP Sciences–Torus Press: Les Ulis, France, 2013; Volume 4, pp. 59–74. [Google Scholar] [CrossRef] [Green Version]
- Mazzetti, A.; Merotto, L.; Pinarello, G. Paraffin-Based Hybrid Rocket Engines Applications: A Review and a Market Perspective. Acta Astronaut. 2016, 126, 286–297. [Google Scholar] [CrossRef]
- Wada, Y.; Kawabata, Y.; Kato, R.; Kato, N.; Hori, K. Observation of Combustion Behavior of Low Melting Temperature Fuel for a Hybrid Rocket Using Double Slab Motor. Int. J. Energetic Mater. Chem. Propuls. 2016, 15, 351–369. [Google Scholar] [CrossRef]
- Lee, D.; Lee, C. Hybrid Gas Generator for a Staged Hybrid Rocket Engine. J. Propuls. Power 2017, 33, 204–212. [Google Scholar] [CrossRef]
- Wang, L.; Wu, Z.; Chi, H.; Liu, C.; Tao, H.; Wang, Q. Numerical and Experimental Study on the Solid-Fuel Scramjet Combustor. J. Propuls. Power 2015, 31, 685–693. [Google Scholar] [CrossRef]
- Zvegintsev, V.I.; Fedorychev, A.V.; Zhesterev, D.V.; Mishkin, I.R.; Frolov, S.M. Gasification of Low-Melting Hydrocarbon Materials in High-Temperature Gas Flow. Combust. Explos. 2019, 12, 108–116. [Google Scholar] [CrossRef]
- Frolov, S.M.; Shamshin, I.O.; Kazachenko, M.V.; Aksenov, V.S.; Bilera, I.V.; Ivanov, V.S.; Zvegintsev, V.I. Polyethylene Pyrolysis Products: Their Detonability in Air and Applicability to Solid-Fuel Detonation Ramjets. Energies 2021, 14, 820. [Google Scholar] [CrossRef]
- Schmitt, R.G.; Butler, P.B.; Freesmeier, J.J. Performance and CO Production of a Non-Azide Airbag Propellant in a Pre-Pressurized Gas Generator. Combust. Sci. Technol. 1997, 122, 305–330. [Google Scholar] [CrossRef]
- Wu, W.T.; Hsieh, W.H.; Huang, C.H.; Wang, C.H. Theoretical Simulation of Combustion and Inflation Processes of Two-Stage Airbag Inflators. Combust. Sci. Technol. 2005, 177, 383–412. [Google Scholar] [CrossRef]
- Cheng, C.; Zhang, X.; Wang, C.; Wang, L. Numerical Investigation on Cooling Performance of Filter in a Pyrotechnic Gas Generator. Def. Technol. 2021, 17, 343–351. [Google Scholar] [CrossRef]
- Schmid, H.; Eisenreich, N.; Baier, A.; Neutz, J.; Schröter, D.; Weiser, V. Gas Generator Development for Fire Protection Purpose. Propellants Explos. Pyrotech. 1999, 24, 144–148. [Google Scholar] [CrossRef]
- Mahinpey, N.; Gomez, A. Review of Gasification Fundamentals and New Findings: Reactors, Feedstock, and Kinetic Studies. Chem. Eng. Sci. 2016, 148, 14–31. [Google Scholar] [CrossRef]
- Salaudeen, S.A.; Arku, P.; Dutta, A. Gasification of Plastic Solid Waste and Competitive Technologies. In Plastics to Energy; Al-Salem, S.M., Ed.; William Andrew Publishing: Norwich, NY, USA, 2019; pp. 269–293. [Google Scholar] [CrossRef]
- Salgansky, E.A.; Lutsenko, N.A. Effect of Solid Fuel Characteristics on Operating Conditions of Low-Temperature Gas Generator for High-Speed Flying Vehicle. Aerosp. Sci. Technol. 2021, 109, 106420. [Google Scholar] [CrossRef]
- Rashkovskiy, S.A.; Yakush, S.E. Numerical Simulation of Low-Melting Temperature Solid Fuel Regression in Hybrid Rocket Engines. Acta Astronaut. 2020, 176, 710–716. [Google Scholar] [CrossRef]
- DeLuca, L.T.; Galfetti, L.; Colombo, G.; Maggi, F.; Bandera, A.; Boiocchi, M.; Gariani, G.; Merotto, L.; Paravan, C.; Reina, A. Time-Resolved Burning of Solid Fuels for Hybrid Rocket Propulsion. In Progress in Propulsion Physics; DeLuca, L., Bonnal, C., Haidn, O., Frolov, S., Eds.; EUCASS Advances in Aerospace Sciences Book Series; EDP Sciences–Torus Press: Les Ulis, France, 2011; Volume 2, pp. 405–426. [Google Scholar] [CrossRef] [Green Version]
- Shiplyuk, A.N.; Zvegintsev, V.I.; Frolov, S.M.; Vnuchkov, D.A.; Kiseleva, T.A.; Kislovsky, V.A.; Lukashevich, S.V.; Melnikov, A.Y.; Nalivaychenko, D.G. Gasification of Low-Melting Hydrocarbon Material in the Airflow Heated by Hydrogen Combustion. Int. J. Hydrogen Energy 2020, 45, 9098–9112. [Google Scholar] [CrossRef]
- Shiplyuk, A.N.; Zvegintsev, V.I.; Frolov, S.M.; Vnuchkov, D.A.; Kislovsky, V.A.; Kiseleva, N.A.; Lukashevich, S.V.; Melnikov, A.Y.; Nalivaychenko, D.G. Gasification of Low-Melting Fuel in a High-Temperature Flow of Inert Gas. J. Propuls. Power 2021, 37, 20–28. [Google Scholar] [CrossRef]
- Arkhipov, V.A.; Basalaev, S.A.; Kuznetsov, V.T.; Poryazov, V.A.; Fedorychev, A.V. Modeling of Ignition and Combustion of Boron-Containing Solid Propellants. Combust. Explos. Shock. Waves 2021, 57, 308–313. [Google Scholar] [CrossRef]
- Zarko, V.; Perov, V.; Kiskin, A.; Nalivaichenko, D. Microwave Resonator Method for Measuring Transient Mass Gasification Rate of Condensed Systems. Acta Astronaut. 2019, 158, 272–276. [Google Scholar] [CrossRef]
- Evans, B.N.; Favorito, A.; Kuo, K. Study of Solid Fuel Burning-Rate Enhancement Behavior in an X-ray Translucent Hybrid Rocket Motor. In AIAA Paper 2005-3909, Proceedings of the 41st AIAA/ASME/SAE/ASEE Joint Propulsion Conference & Exhibit, Tucson, Arizona, USA, 10–13 July 2005; The American Institute of Aeronautics and Astronautics: Reston, VA, USA, 2012. [Google Scholar] [CrossRef]
- Saito, Y.; Kamps, L.T.; Komizu, K.; Bianchi, D.; Nasuti, F.; Nagata, H. The accuracy of reconstruction techniques for determining hybrid rocket fuel regression rate. In AIAA Paper 2018-4923, AIAA Propulsion and Energy Forum, Proceedings of the Joint Propulsion Conference, Cincinnati, OH, USA, 9–11 July 2018; The American Institute of Aeronautics and Astronautics: Reston, VA, USA, 2018. [Google Scholar] [CrossRef]
- Zvegintsev, V.I. Short-Duration Gas-Dynamic Facilities. Part 1. Facilities for Scientific Research; Parallel Publ.: Novosibirsk, Russia, 2014; (In Russian). ISBN 978-5-98901-169-8. [Google Scholar]
- Trusov, B.G. Modeling of Chemical and Phase Equilibria at High Temperatures “Astra 4”; Bauman State Technical University Publ.: Moscow, Russia, 1991. [Google Scholar]
Publisher’s Note: MDPI stays neutral with regard to jurisdictional claims in published maps and institutional affiliations. |
© 2022 by the authors. Licensee MDPI, Basel, Switzerland. This article is an open access article distributed under the terms and conditions of the Creative Commons Attribution (CC BY) license (https://creativecommons.org/licenses/by/4.0/).