1. Introduction
Environmental degradation and energy consumption are hotly debated topics among scientists, policymakers, academics, and business professionals. Energy-related greenhouse gas (GHG) emissions from the usage of non-renewable energy sources (coal, oil, petroleum, etc.) are a well-established cause of environmental degradation and global warming [
1]. Reducing carbon and greenhouse gas emissions to promote a low-carbon economy has been a priority for developed, developing, and rising nations, which is incompatible with their sustainable development goals [
2]. Several policy-related tools, such as administrative orders, economic incentives, and environmental and carbon-related taxes, have been implemented in this context. The administrative directives and regulations are inflexible and ineffectual for achieving the desired results.
In contrast, economic incentives are reasonably well-suited to play a significant role in the economic cycle [
3]. Consequently, environment-related taxes have been implemented as a crucial role in mitigating energy-related emissions and environmental issues, such as pollution, ecological footprints, greenhouse gas emissions, heatwaves, and climate change [
4,
5,
6]. Carbon and green taxes are charged on the quantity of energy-related emissions released into the atmosphere [
5].
To achieve numerous climate change goals, for instance, environmental pollution, reduced emissions, and water waste, the introduction of the environmental tax is necessary [
7,
8]. Green taxes may be used in different countries to minimize energy usage [
9]. By integrating environmental consequences into pricing through taxes, environmental policies address the inability of economic policies to account for the environmental implications of resource usage [
10]. Incentives to encourage environmental technology innovation are provided by green taxes, which make low-cost solutions possible. Efficient use of gasoline reduces the per capita need for petroleum goods and fosters the development of new technology, while also stimulating the expansion of clean energy sources, all of which are aided by green taxes [
11,
12]. There has been much attention paid to green taxes in Europe and the Organisation for Economic Co-operation and Development (OECD). In Europe, for example, 76.94 percent of environmental tax revenue comes from energy taxes. Two percent of GDP and five percent of tax revenue is generated by these taxes [
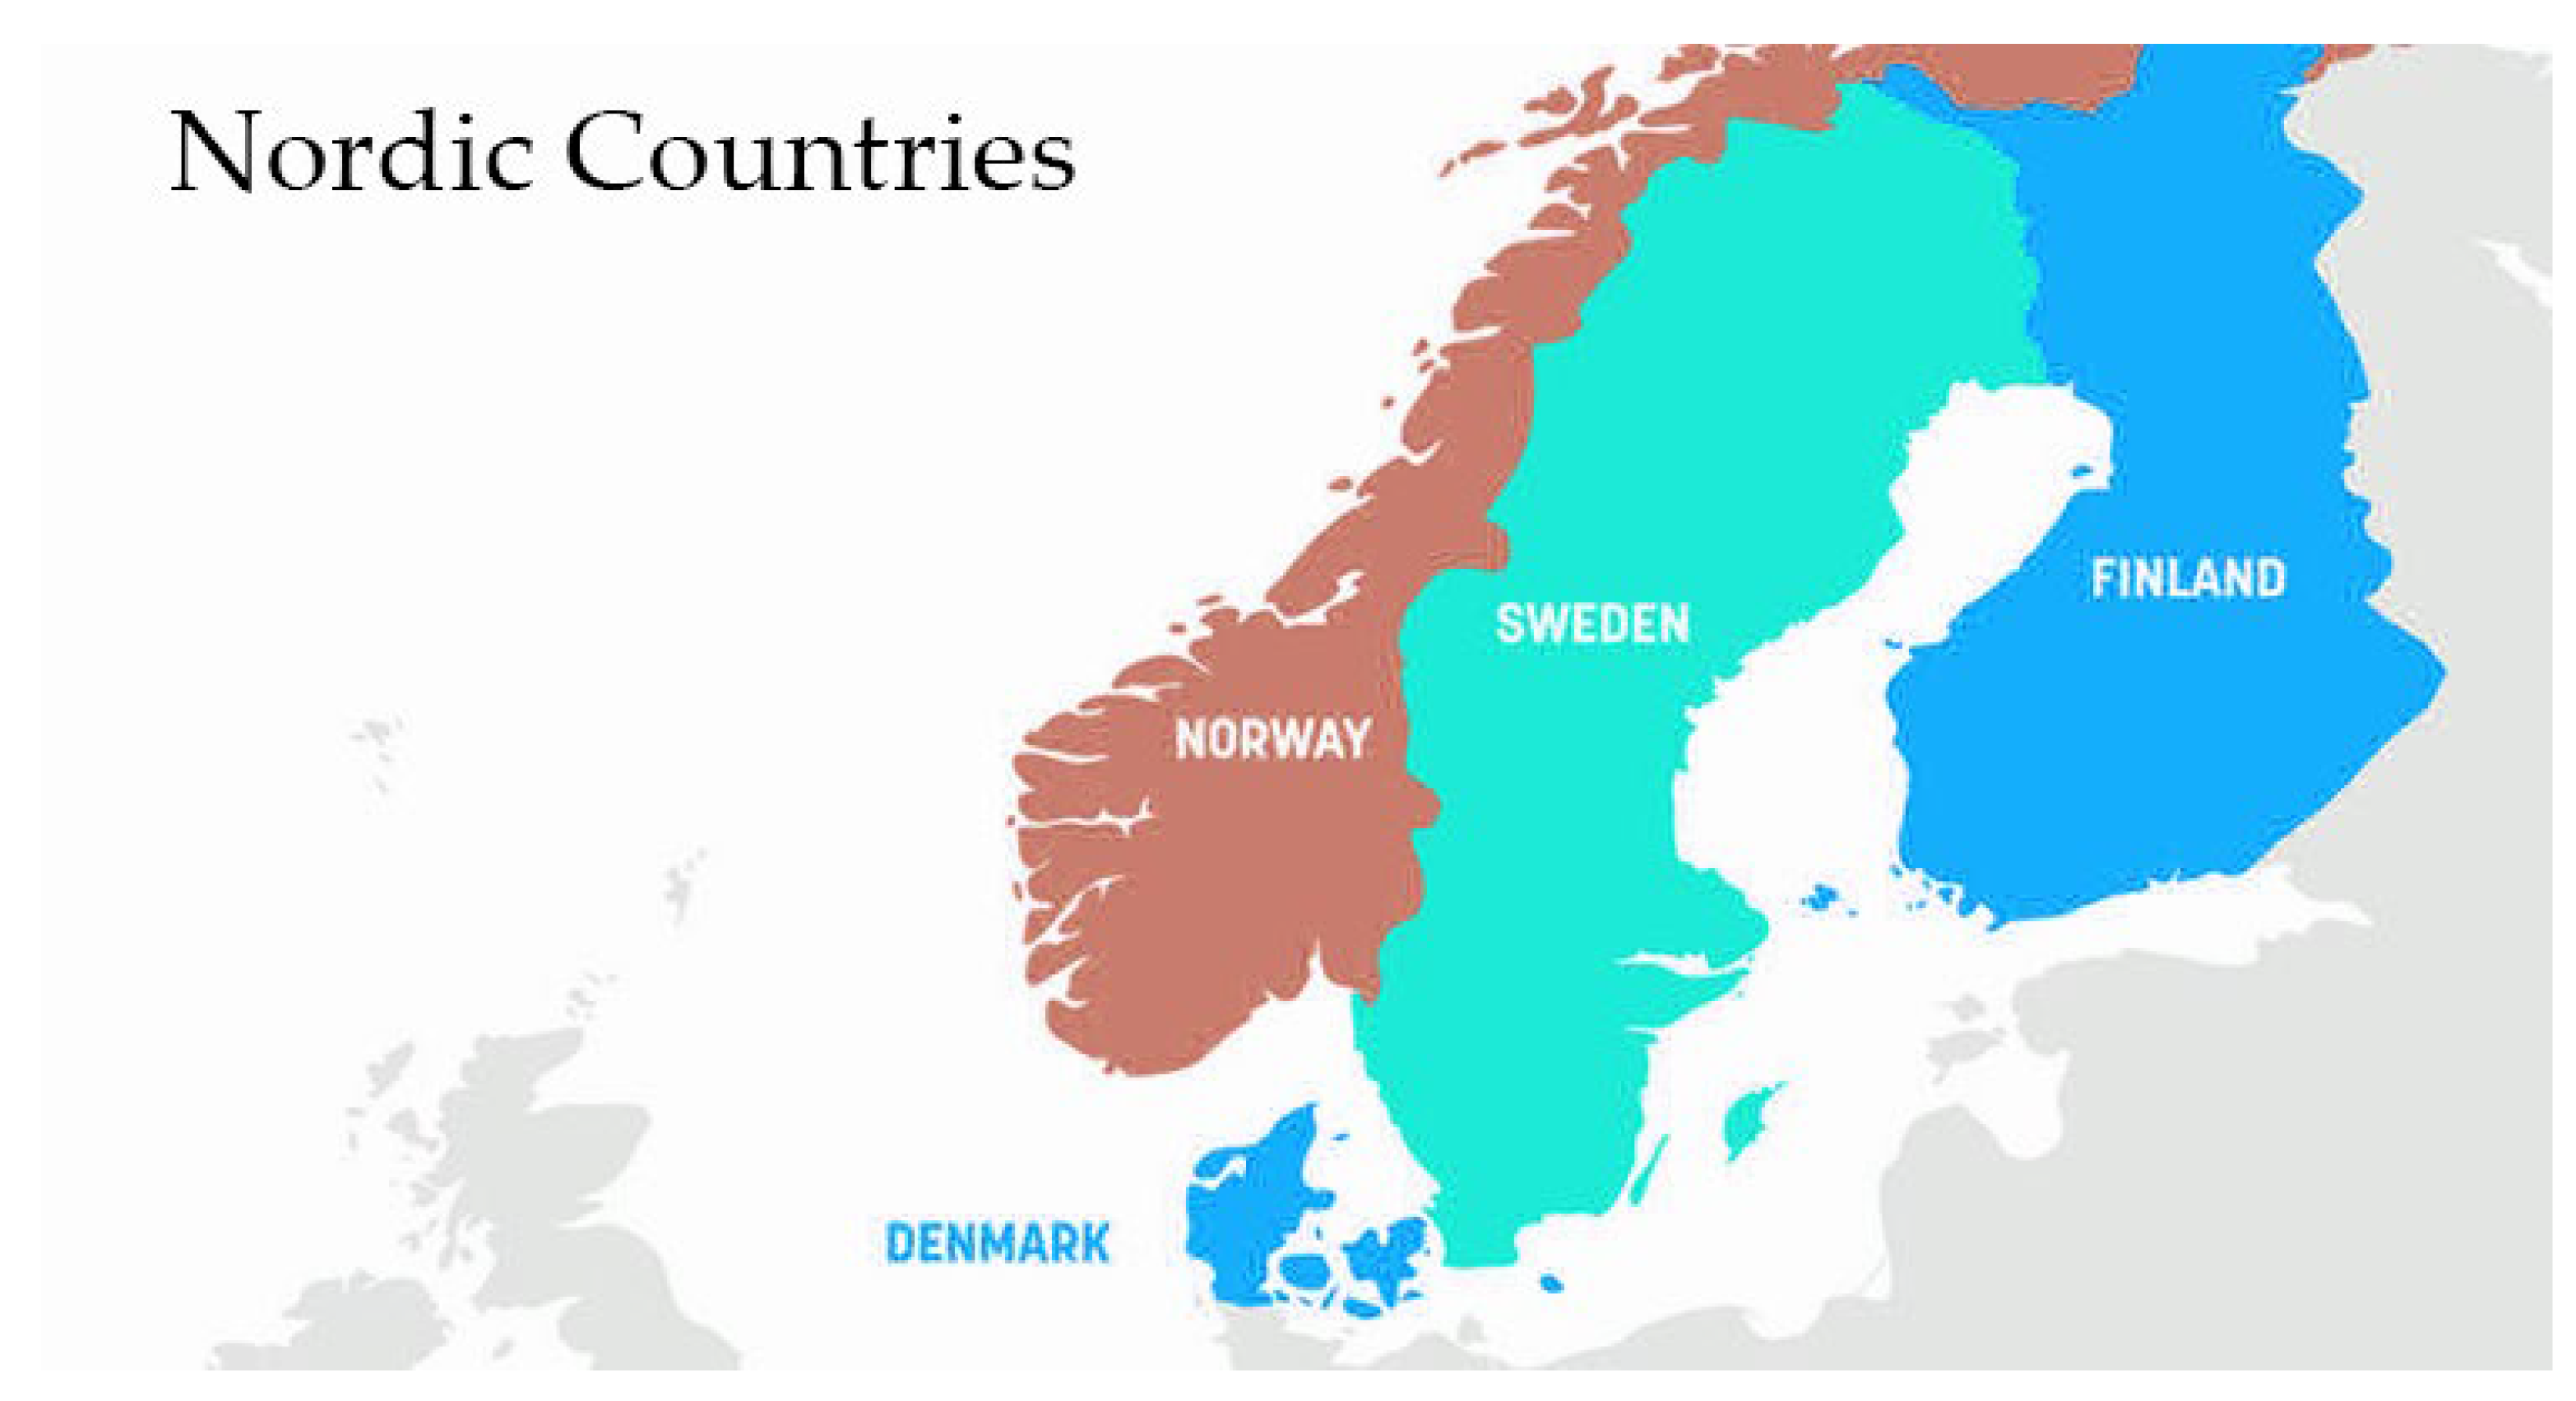
13]. The area of the study is depicted in
Figure 1 below.
As economies grow, so does energy consumption in emerging or developed countries. Total energy consumption, which includes both fossil fuels and non-renewable sources, is a significant factor in economic development since it drives up pollution emissions and raises the overall energy intensity of the economy [
14,
15]. The two key factors that are considered for climate change are energy consumption and intensity. “The direct use at the source, or supply to users without transformation, of all forms of energy” is called energy consumption. Energy intensity is defined as “units of energy consumed to produce one unit of GDP”. The Nordic nations’ principal goal in achieving sustainable development goals is to reduce their reliance on fossil fuels and energy intensity [
16].
In order to solve environmental issues (such as pollution), an environmental tax increases the incentive to engage in less damaging activities [
17]. A tax on carbon emissions, the most significant greenhouse gas (GHG) in the atmosphere, is included in all of the ‘eco-leaders’ environmental tax reform programs [
18]. As the rate of an environmental tax rises, the concentration of carbon dioxide may fall [
19].
Although Tamura, Nakanishi [
19] argued that there is an optimal tax amount for reducing overall carbon emissions, they also said the tax is more effective when improved technology with lower costs are used. According to some academics, environmental levies such as energy taxes aren’t nearly as effective as carbon taxes [
20].
Carbon taxes are sometimes referred to as “environmental taxes” in nations where they are enacted. Various taxes, such as those on energy, gasoline, and carbon, may aid in the achievement of environmental goals such as lowering pollution [
21]. Carbon taxes are successful because they tax the most significant source of GHG emissions, carbon emissions [
22]. Chen, Zhou [
23] and Jiang and Shao [
24] prove the link between carbon taxes and carbon emissions. Others assert that carbon taxes may successfully cut emissions of carbon dioxide [
25]. For instance, in Liaoning Province (China), the highest carbon tax of 221 USD/ton-CO
2 would lead to a decrease in carbon emissions of 44.92% in 2030 [
26]. Some believe that carbon fees will have little impact on cutting emissions [
18]. Carbon taxes, according to Vera and Sauma [
6], will reduce CO
2 emissions by just 1% year between 2014 and 2024, compared to the baseline estimate.
Understanding how environmental fees affect energy use and intensity is critical to implementing effective policies. As a result, these taxes must be economically efficient to accomplish this goal. Research [
5] shows that energy taxes reduce energy use and carbon emissions. However, other studies [
27] refute these conclusions. The literature on green taxes in energy consumption does not yet consider this integrated structure, leaving us with a shaky image of real-world results. We are also looking into energy intensity as a measure of energy efficiency. Preliminary estimates suggest that improving energy efficiency might reduce environmental pollution by 25% [
28]. Energy-efficiency investments result in more economical consumption, promote competitiveness, and increase energy security.
Regarding greenhouse gas emissions, the Nordic nations are on track to fulfill their 2020 objectives. However, they are still struggling with how to increase their energy intensity due to rising energy use and gaps in attaining the established targets in the industrial sector [
29,
30]. The investigation into how green taxes affect energy consumption and intensity follows the United Nations’ 2030 Agenda for Sustainable Development goals and the fight against climate change (SDGs). Sustainability and environmental goals have been achieved in recent years in the Nordic economies by decoupling economic expansion from environmental pressure through activities such as promoting efficient resource usage.
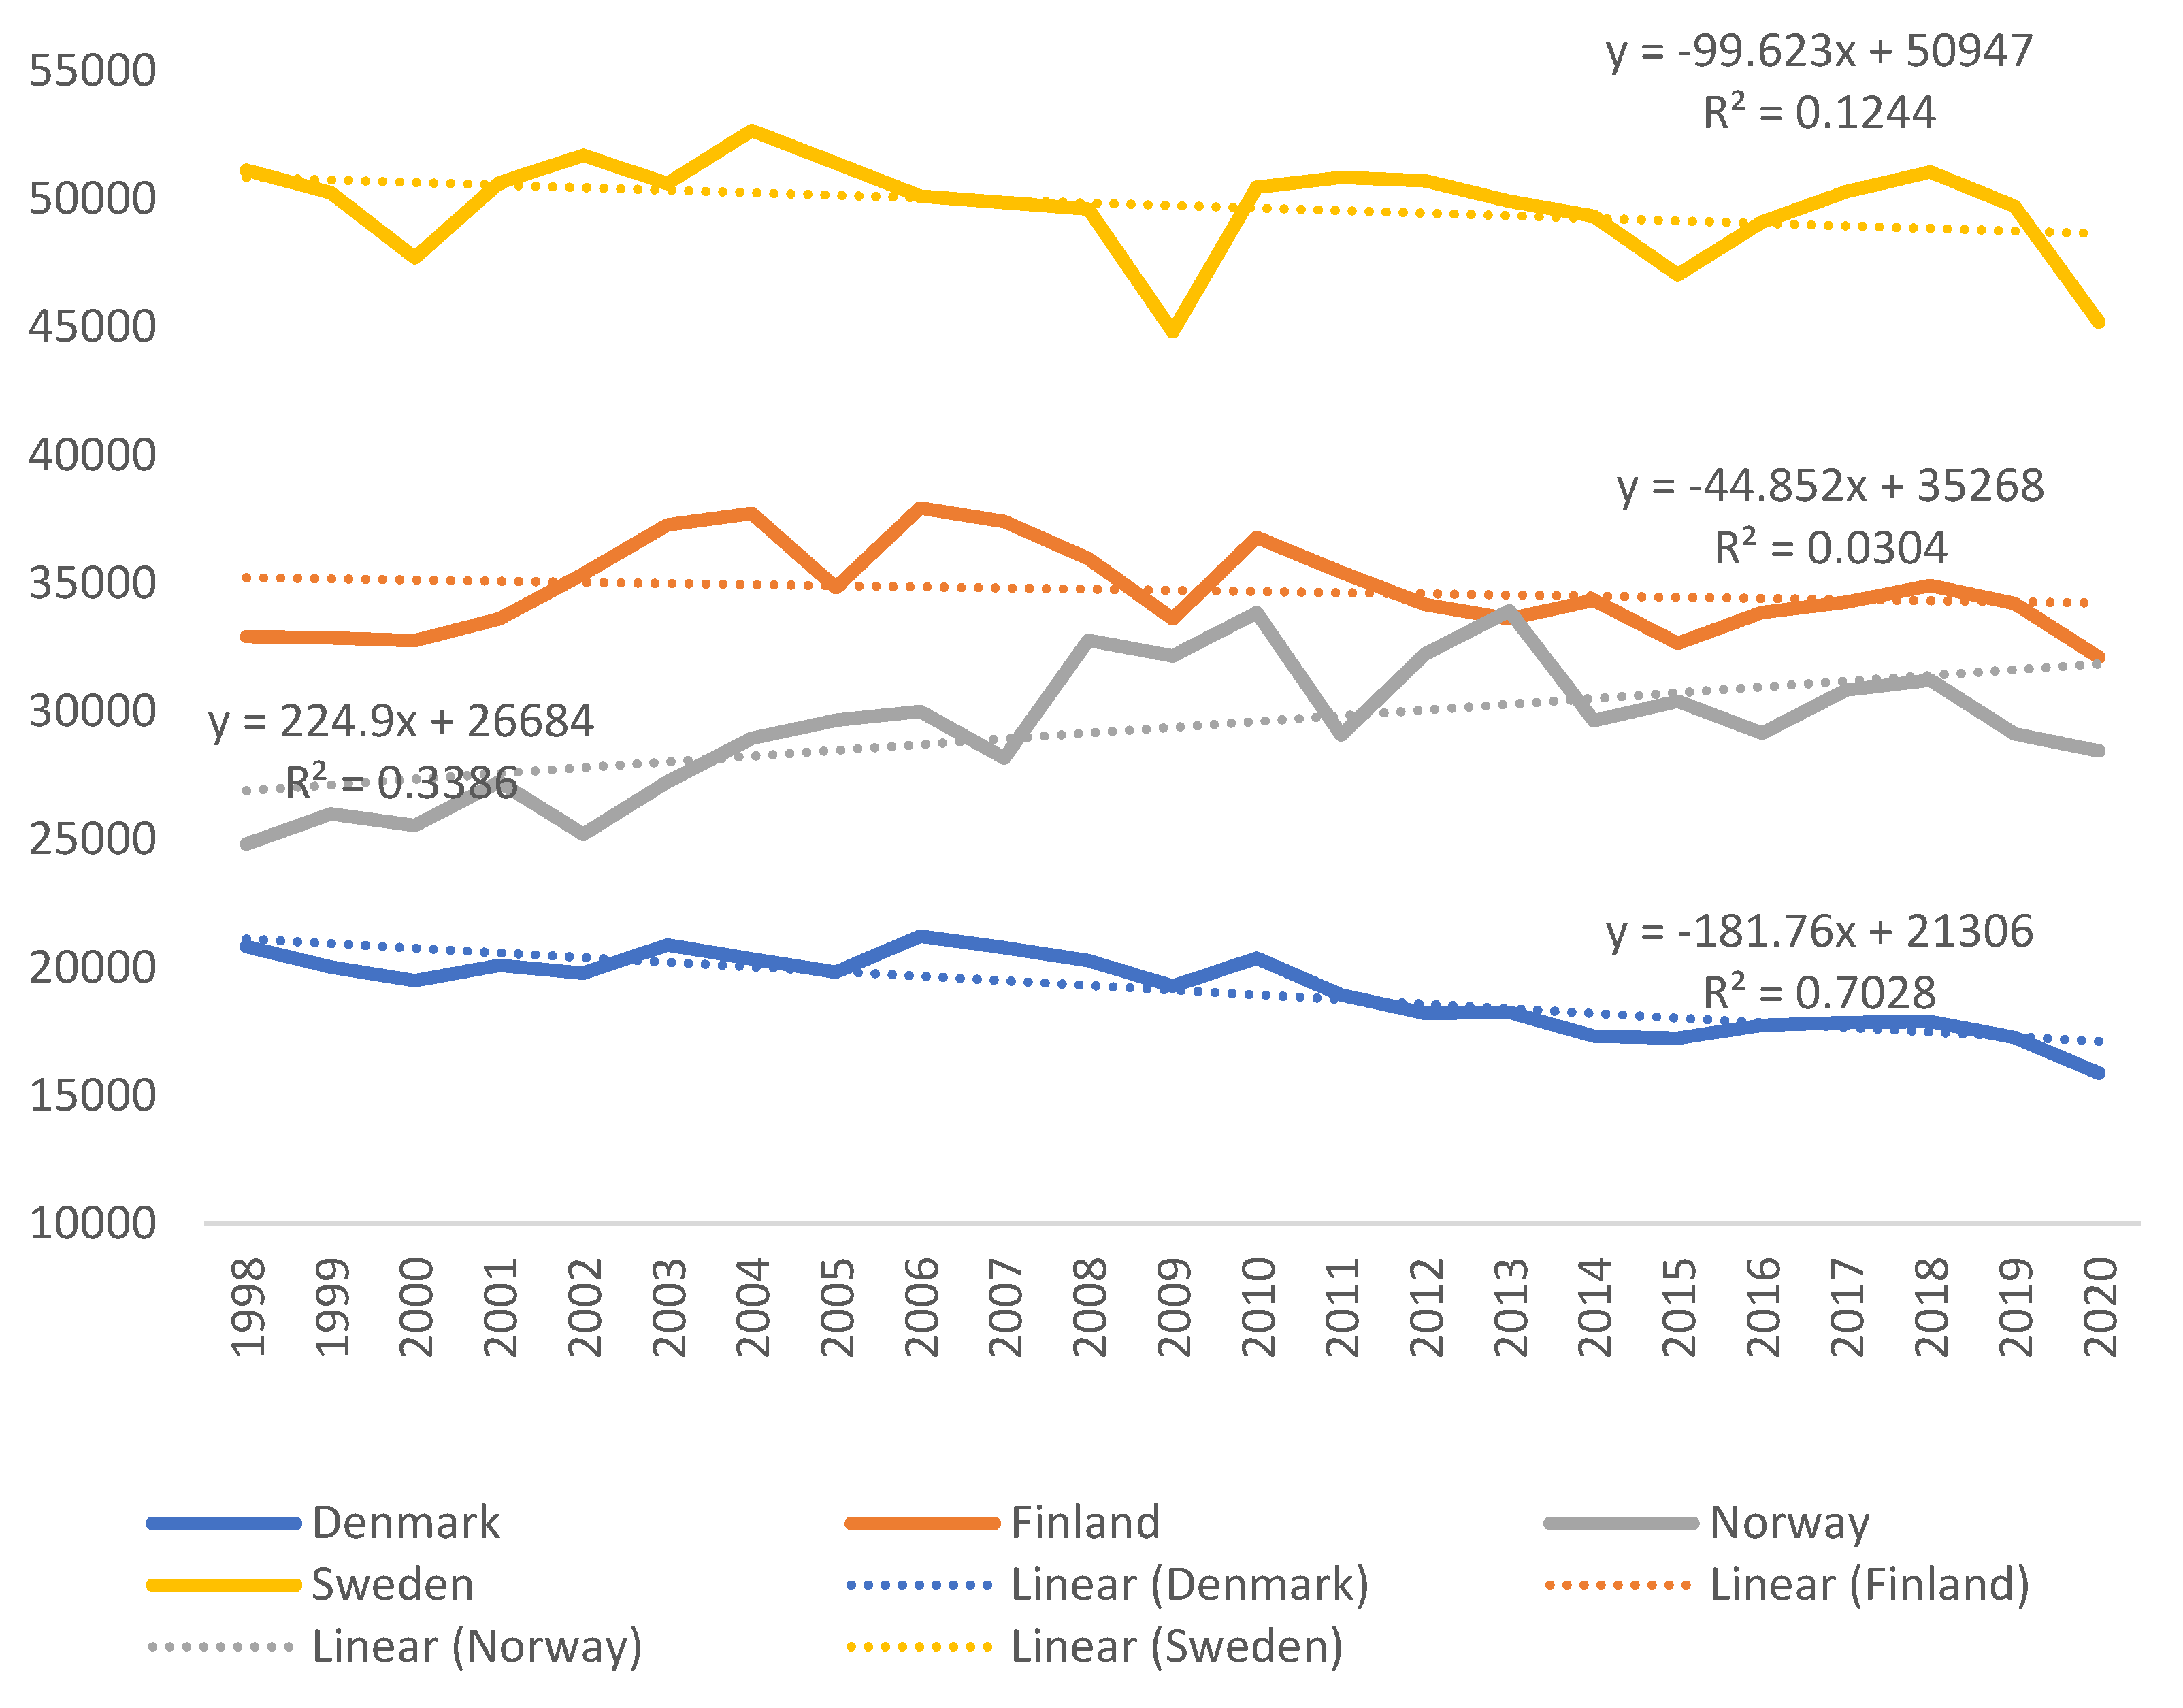
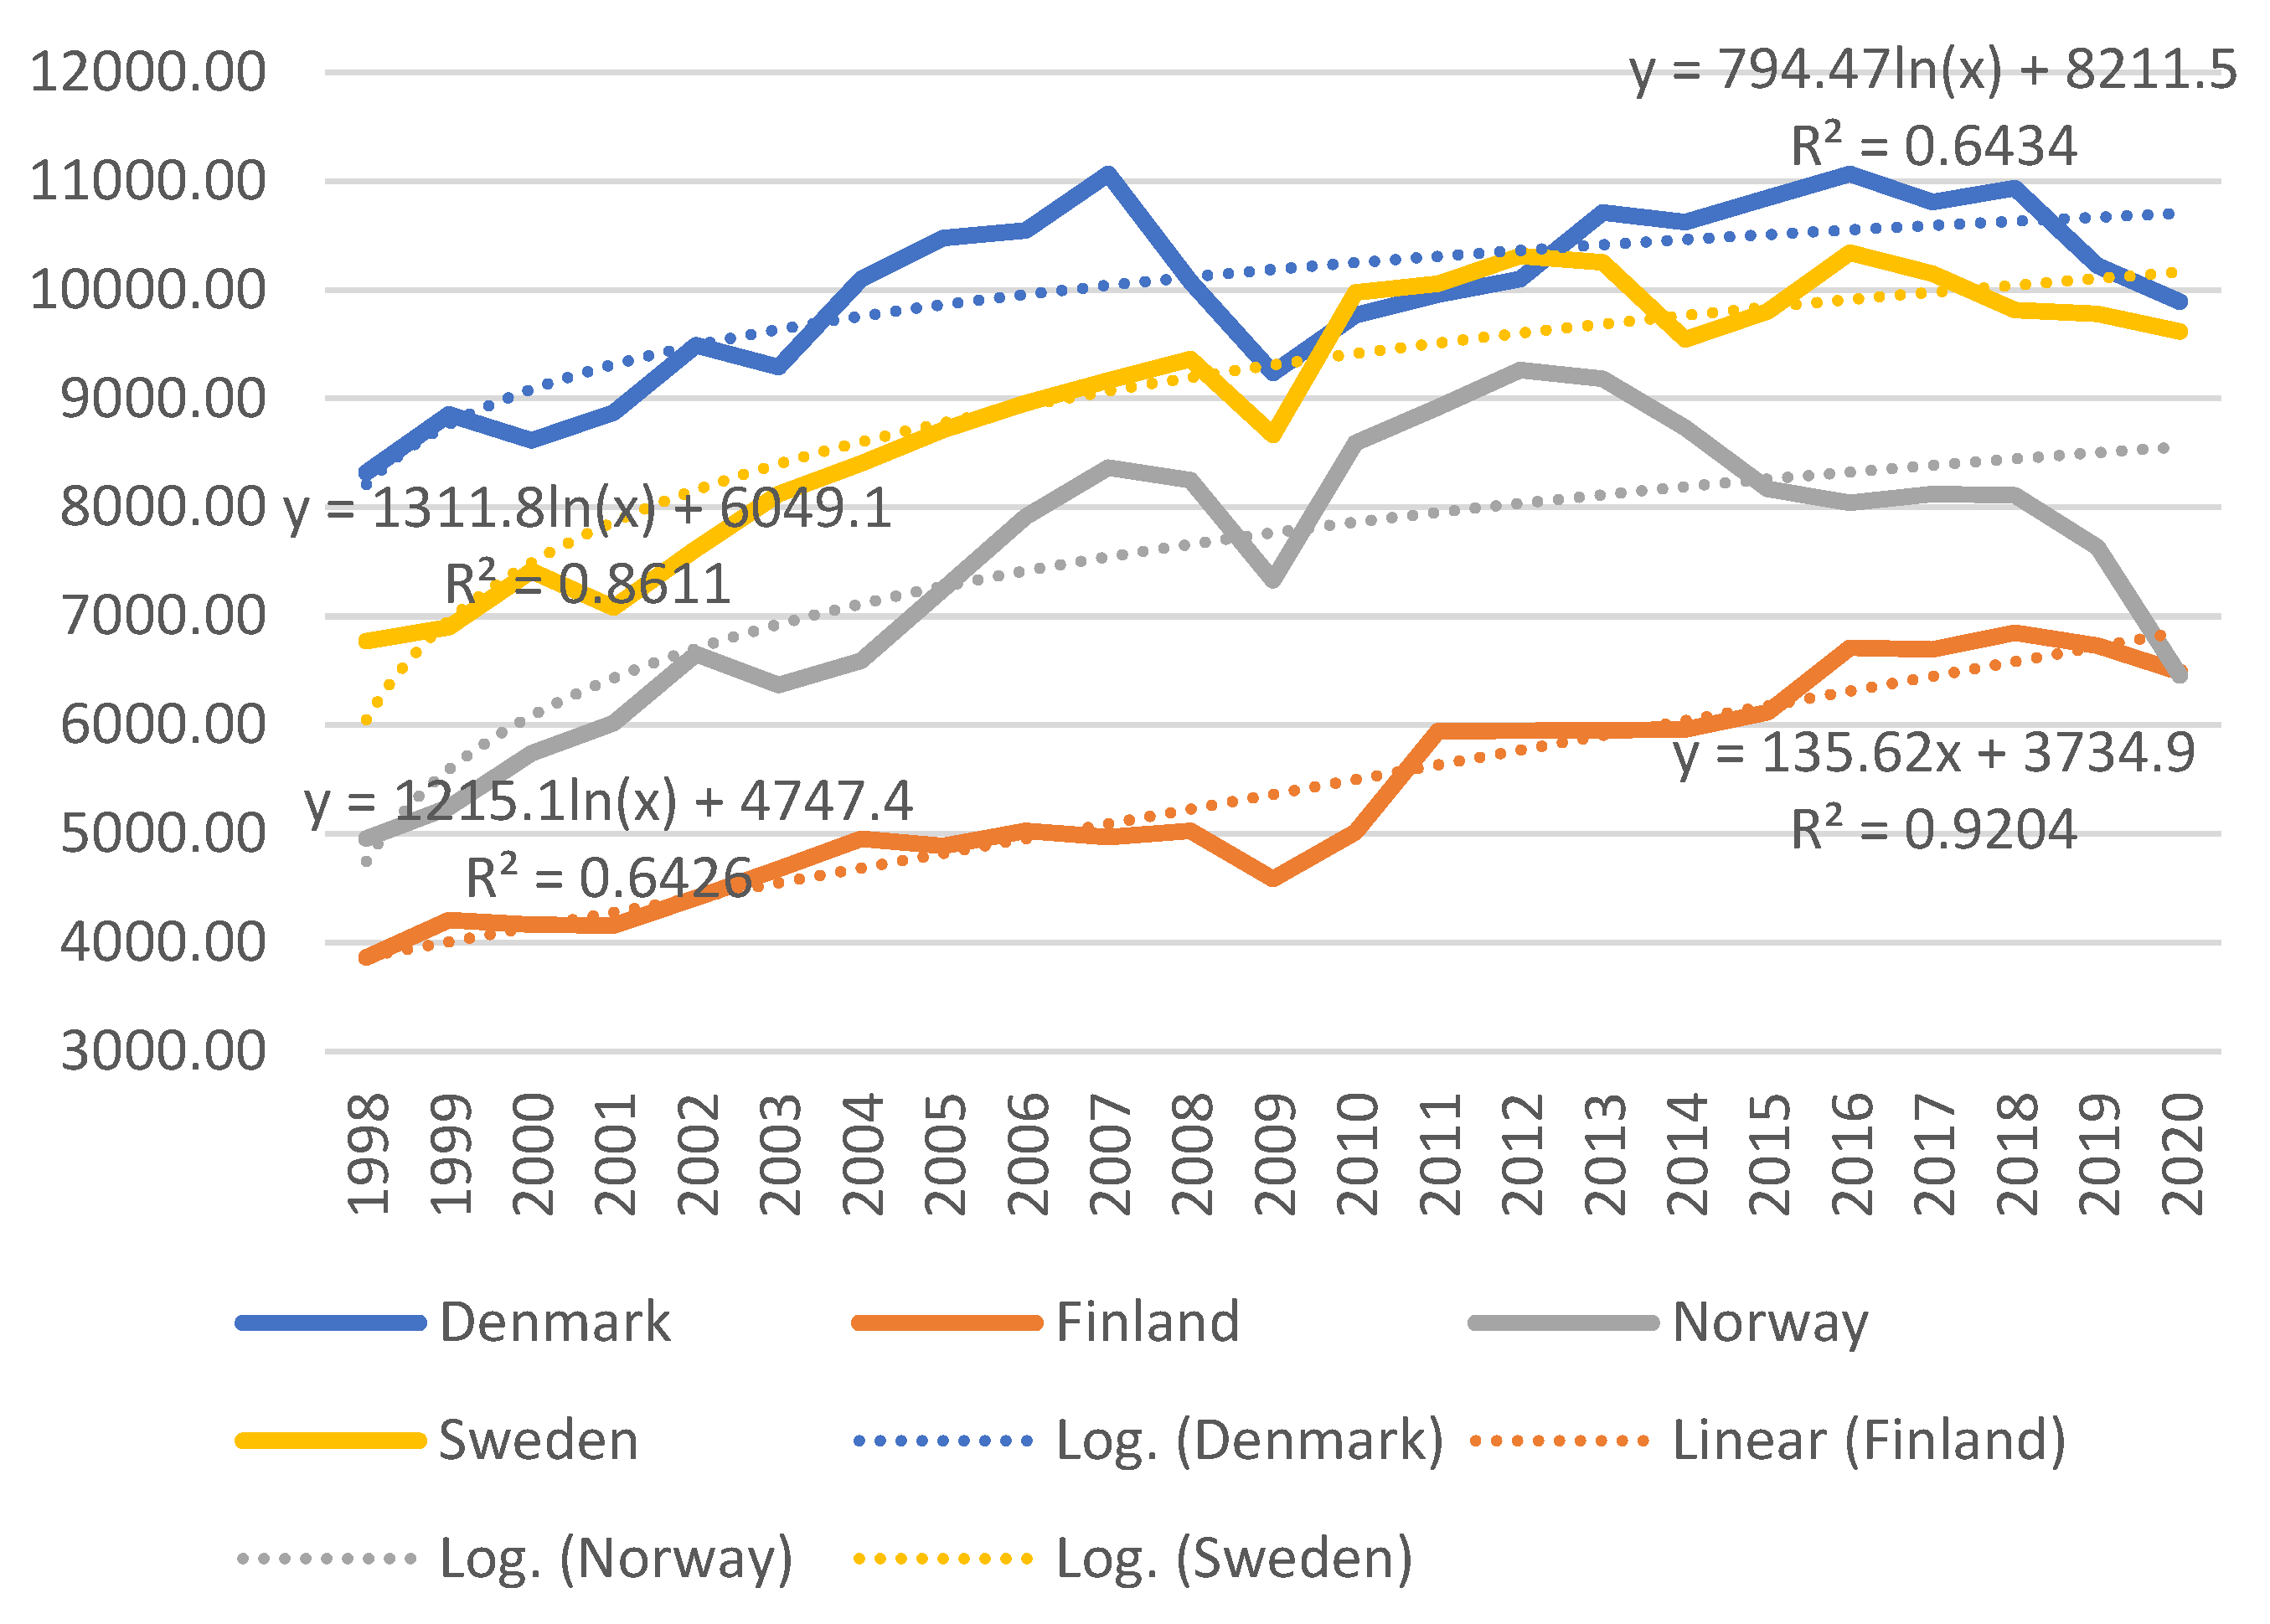
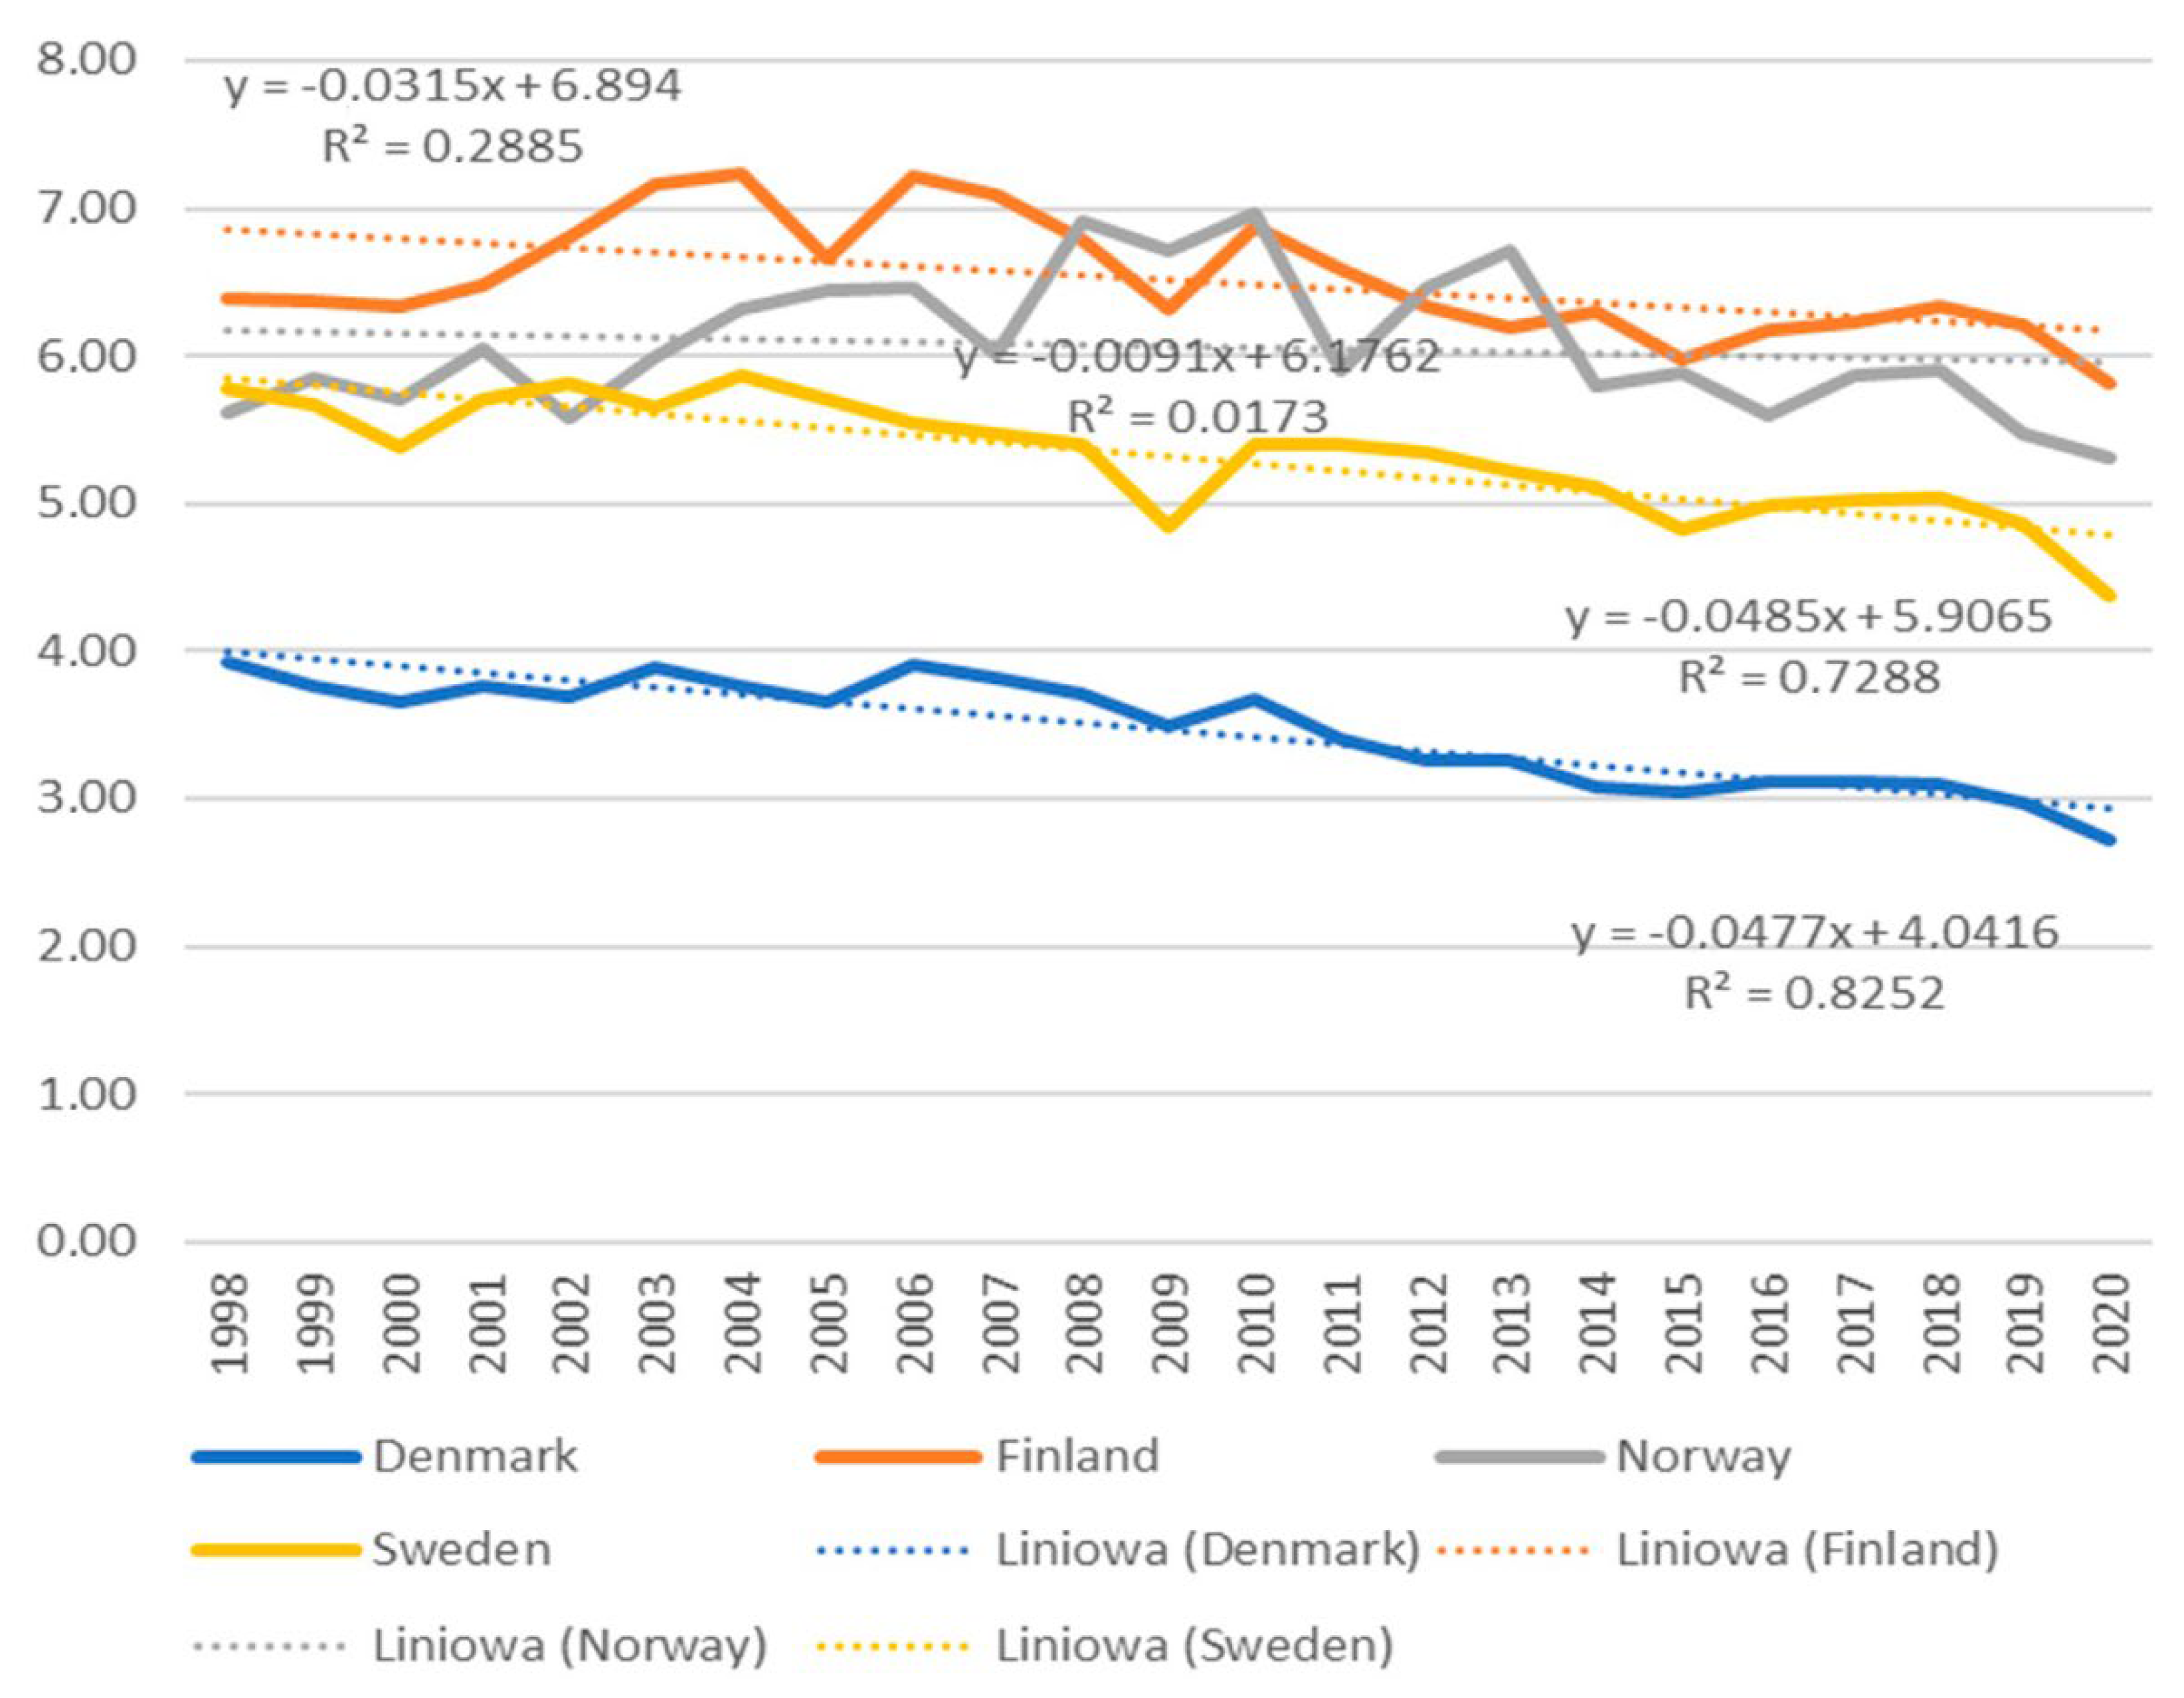
Figure 2 depicts the energy consumption in Nordic countries [
9], and
Figure 3 illustrates the energy consumption in Nordic countries per capita. Considering changes in energy consumption, total and per capita, in Denmark, Sweden, and Finland, a modest decrease could be noticed. Although Norway reported an increase in total energy consumption, the energy consumption per capita was decreasing.
2. The Literature
For decades, researchers have focused on reducing energy usage through green taxes. Fossil fuel usage is the primary target of these taxes, which aims to reduce overall energy consumption. Green taxes and their economic effects have been intensively studied since the 1990s [
8,
40]. Taxes have been widely praised as one of the most effective ways to reduce energy use. When [
41] studied green taxes in Japan and the ensuing impact on the country’s industries, they confirmed that green taxes had a detrimental influence on its energy usage. Environmental externalities in Norway have been successfully combated, according to [
42]. Environmental laws to reduce carbon emissions have been implemented. Furthermore, ref [
43] stated that green taxes should be redistributed to support greener energy sources, such that fossil fuel use is limited by lowering subsidies to non-renewable industries.
In Ireland, ref [
44] found that 25% of the emissions can be cut out by applying a green tax of 15 Euros per ton. A similar argument was put out by [
45], who claimed that green taxes on fossil fuels might reduce non-renewable energy use over the long run, while cutting carbon emissions by as much as half. It was shown that implementing green taxes may reduce emissions by 90% and generate an additional
$13 billion in income for the Irish economy each year. Meanwhile, ref [
35] examined the impact of green taxes on the Chinese car sector. According to their empirical research, green taxes will lower energy use by 16.3 percent, gasoline by 18.5 percent, and GHG emissions by 16 percent by 2030.
In comparative research, green taxes have influenced carbon emissions in Brazil, China, India, and South Africa [
46]. According to their study, green taxes considerably impact the concentration of carbon emissions in BRICS countries.
According to [
47], there is a positive relationship between economic expansion and energy use. Ref. [
48] Investigating the relationship between energy consumption and economic growth found that economic growth had a unidirectional correlation with energy consumption. The authors in [
30] used a global panel of 274 cities to predict that energy consumption would increase up to 730 EJ, only due to urbanization, which would be a more than threefold increase from the 240 EJ consumed in 2005. The authors in [
49,
50] have claimed that economic factors play a significant role in deciding whether or not there is a link between urbanization and increased energy usage.
The authors in [
51], using panel data for ninety countries, concluded that financial development has no association with environmental degradation in newly industrialized economies but has a positive and significant impact in industrial economies. This finding was based on the observation that newly industrialized economies do not affect environmental degradation.
Data for analysis are from Nordic countries from 1998 and 2020. Green taxes are a significant variable due to their link with total energy consumption and capacity to address environmental issues. That is, researchers think green taxes can help reduce environmental concerns. The variables that were considered for our model are listed in
Table 1.
Specific data factors, known as control variables, have been incorporated into the analysis to prevent bias in the data. These data variables include energy intensity, consumption, economic growth, trade openness, urbanization, and financial development. Because modern industrialization and economic growth are so highly reliant on fossil fuels, the study’s major focus is on measuring energy consumption and the energy intensity of various sectors of the economy [
52]. It is critical to understand the function of energy, given that increased energy consumption not only drives an economy closer to the stage of industrialization but also has the potential to exacerbate environmental problems. The broad need for energy has been a critical contributor to improving living standards, and industrialization, even though economic policies may have significantly raised GHG emissions in recent decades [
53]. Openness to international trade is often regarded as one of the most crucial aspects of any economic model since unrestricted trade flow contributes to increased economic development and energy consumption [
53]. Urbanization is another essential factor for energy consumption. The higher the urbanization rate, the greater the pressure on the limited resources. Although urbanization helps spur economic growth and innovation, it is risky to lead to environmental deterioration and increased CO
2 emissions due to increased energy consumption [
49]. Last but not least, financial development is defined as the capacity of financial institutions to supply the financial resources necessary to grow output and satisfy aggregate demand.
Following an in-depth analysis of the relevant prior research, the study has concluded that urbanization, economic growth, and openness to trade are the primary factors that influence overall energy intensity and energy consumption. The study has the following research questions: (i) Does a causal linkage exist between green taxes, energy consumption, and energy intensity. (ii) Will imposing green taxes reduce energy consumption in Nordic countries. (iii) Can imposing green taxes improve the energy intensity in the region.
The rest of the paper comprises three sections:
Section 3, “materials and methods section,” describes the data and model specifications;
Section 4, “results and discussion,” discusses the results of the study; and the last section, “conclusions and policy implications,” presents the outcome summary and practical implications.
3. Materials and Methods
The study examines the effect of green taxes on energy intensity and the total amount of energy used.
The empirical models are shown below:
where time and country are represented by
t and
I, respectively; energy consumption is denoted by
EC, energy intensity by
EI, and green taxes are denoted by
GTX, respectively; the vector
X denotes control variables; variables contained within the vector are denoted by
j; the residual term is denoted by
ε; and
b and d are used as estimators.
In order to obtain accurate and consistent empirical conclusions, empirical data must first be translated into a logarithm form. The following models are used to represent the empirical equations of energy consumption and energy intensity functions:
where
ln,
denotes natural-log, energy consumption, energy intensity,
is used for green taxes, urbanization, financial development, and
represent trade openness and economic growth, respectively.
This study first checks for cross-sectional dependency. Researchers in [
8] asserted that cross-sectional dependency is a crucial statistic for explaining geographic effects, unknown mutual shocks, and the presence of linkages in social networks. This is accomplished through the use of the Pearson’s CD (cross-sectional dependency) test [
54]. The null hypothesis is that there is no cross-sectional dependence between the variables and the alternate hypothesis confirms the presence of cross-sectional dependence.
After verifying cross-dependence, this study uses the LLC and IPS panel unit root tests to examine the stationary qualities of the variables. The LLC test [
55] assumes that an autoregressive parameter is common to all cross-sections, whereas the IPS test [
56] assumes that there is variance in autoregressive parameters across all cross-sections. The Dickey-Fuller (ADF) technique is used in both tests.
To check if long-term cointegration occurs between the variables, the study uses Westerlund [
57], which uses the ECM technique to examine whether the error correction is provided by the error correction model. The study uses econometric methods such as PDOLSFMOLS and PDOLS to analyze the cointegration connection’s long-run effects, which is our empirical strategy’s primary emphasis. Using FMOLS and PDOLS econometric methodologies, the study may solve the problems of serial correlation in error terms and endogeneity among the regressors using these empirical procedures. Autocorrelation and endogeneity concerns can be addressed using the FMOLS methodology, which employs a nonparametric approach, but the PDOLS technique incorporates the independent variables’ lag and eliminates the difficulties by using a parametric approach [
58]. Cross-sectional dependency may be solved using the PDOLS approach, which is more suited for obtaining country-specific coefficients and produces consistent results. The cointegrated panel’s heterogeneity and long-run variation are controlled by the FMOLS and PDOLS weighted criteria [
58].
There are definite quantiles associated with each explanatory variable in the quantile regression developed by [
59], which allows for an in-depth evaluation of each independent variable’s influence on the dependent variable’s quantiles. Using panel quantile regressions, ref [
60] also examined the impact of energy taxes on the usage of electricity.
Finally, the study validates the short-term correlation between variables, using the Dumitrescu and Hurlin [
61] causality test, which is essential for policy-making choices. The Dumitrescu–Hurlin panel causality test is a simple version of the Granger noncausality test for non-homogeneous panel data models with constant coefficients. The authors of Dumitrescu and Hurlin [
61] studied heterogeneity from two perspectives: the heterogeneity of the regression model used to evaluate Granger causality and the heterogeneity of causal linkages. This test requires the series to be stationary at the same level. This technique takes into account the cross-sectional dependency among sample nations [
61]. The Dumitrescu–Hurlin test may forecast scenarios of cross-section dependency and independence. Examining the conventional panel, Granger causality tests reveal that if there is a causal link in a subgroup of the variable owing to a lack of cross-sectional data, it is because of the homogenous null hypothesis. The null hypothesis states that there is no Granger causality link between cross-sections, while the alternative hypothesis states that there is at least one Granger causality relationship between cross-sections [
61].
4. Results and Discussion
The correlation matrix and summary statistics for the variables examined are shown in
Table 2. The pairwise correlation study of energy consumption demonstrates a significant association between energy consumption and trade openness and economic growth. Moreover, a negligible link of energy consumption was founded with environmental tax and financial development. However, the pairwise correlation concluded that it has a negative and significant impact with energy intensity. The rate at which people live in cities and the amount of energy they use are directly inversely connected. There is a strong association between urbanization and the amount of energy used. Trade openness (economic development) correlates negatively and substantially with energy intensity.
According to
Table 3, the outcomes of the cross-sectional dependence test validate the existence of cross-sectional dependence among variables and accept the alternate hypothesis. This prompts us to investigate the stationary properties of the variable further, taking into account the presence of cross-sectional dependency and heterogeneity. The findings of IPS and LLC for all the aforementioned variables are provided in
Table 4. For the IPS unit root test, energy consumption, energy intensity, trade openness and urbanization are stationary at first difference, but all the selected variables are stationary at level for the LLC unit root test. Overall, the IPS unit root test found a mixed order of integration.
The Westerlund [
57] cointegration technique is shown in
Table 5. At a 5% significance level, the study finds statistical significance for all Model 1 and Model 2 findings, confirming the existence of cointegration between the variables. For the FMOLS and PDOLS approaches,
Table 6 shows the long-term empirical. Nordic nations are less likely to see a rise in their energy consumption and intensity of use due to green taxes, as shown by the coefficients for Models 1 and 2. These findings also suggest that rigorous rules and tax reforms may regulate total energy usage and intensity, which is useful in achieving a few SDGs and cleaner production in the Nordic countries. It has been noted that green taxes help to reduce energy use by supporting environmental protection and sustainable economic growth. Both urbanization and financial development have quite substantial and positive coefficients. As a result of urbanization’s favorable influence on economic structure shifting towards industrialization, energy consumption rises [
30]. The authors in [
53] examined Bangladesh’s energy trends and found a long-term relationship between openness to trade, energy use, and financial development.
There is a significant and positive correlation between the amount of energy consumed and the degree of trade openness. The authors in [
62] found a one-way positive correlation between energy consumption and trade openness in NICs, which he attributed to trade liberalization promoting economic activity and, in turn, raising energy consumption. Studies by [
63,
64] found a positive correlation between energy use and trade openness, while finding a negative and significant correlation between energy use and energy intensity as competition between domestic firms increases to achieve continuous innovation. This may be seen in more efficient technologies, R&D, and market changes [
53]. Finally, both empirical models show a strong positive correlation with economic growth. According to [
65], energy consumption may be utilized as an assessment criterion to quantify economic growth since economic activities significantly impact energy consumption.
Table 7 present the empirical results of quantile regression to examine the impact of green taxes on energy intensity and consumption.
Energy consumption and intensity have unfavorable connections with green taxes, appearing to be substantial at the medium- and high-quantile levels. These data demonstrate that businesses and government agencies can better monitor and regulate environmental contamination under green taxes. When taxes are raised over an extended period of time, businesses have the opportunity to adjust and preserve their competitiveness. Urbanization is having a considerable yet favorable impact on the mid- and high-quantile energy consumption curves. Evidence from this study shows that implementing a sensible urbanization strategy helps keep environmental problems at bay. Four out of the five quantile regression estimations for energy consumption show that financial development is important but, at the medium quantiles, it has a substantial negative connection with energy intensity. These findings demonstrate the need for a well-balanced approach to financial development and energy reforms, as well as the importance of effectively integrating financial development. Evidence also shows that trade openness has a strong yet negative relationship with energy intensity and energy consumption at low quantiles. Low and high quantiles of energy intensity have a detrimental impact on economic growth. Trade openness and economic activity are influenced by energy use and energy intensity. There is a need for strong policies to promote efficient use of energy and technological advances that will save the environment.
For our key empirical findings, the study performed a robustness test (see
Table 8). The empirical evidence shows a bidirectional association between energy consumption and green taxes and energy consumption and urbanization. Financial development Granger causes energy consumption unidirectionally. Similarly, there is a unidirectional association from trade openness to energy consumption. Moreover, the causality relationship between energy intensity and its determinants are provided in
Table 8. The findings concluded that there is a bidirectional correlation between green taxes and energy intensity, urbanization and energy intensity, and trade openness. Finally, a unidirectional causality relationship is found between economic growth to energy intensity, and financial development to energy intensity. The picture depicts the graphical results of the article. The graph shows that green taxes have a positive and negative relationship with energy intensity and energy consumption.
Figure 5 provides the graphical results of the study.
5. Conclusions, Discussion and Policy Implications
Policymakers are being pushed to seek sustainable economic policies to reduce environmental damage and maximize economic efficiency. Climate action, sustainable communities, and affordable and clean energy are just a few of the sustainable development goals that this research examines in relation to the implementation of green taxes in the Nordic nations. Researchers are studying the impact of green taxes on energy consumption and intensity in order to find new solutions for climate change and cleaner manufacturing caused by the growing energy demand. Furthermore, the study incorporates the financial crisis into our analysis of the influence of economic shocks on green tax arrangements in the Nordic nations. First, the study ran the CD test to see if there was any cross-sectional correlation between variables. After that, the study ran IPS and LLC unit root tests to make sure the dataset was stationary, and the results showed that it was (1). The study used FMOLS, PDOLS, and panel quantile regressions and concluded that green taxes have been shown to be effective in lowering energy usage and intensity, according to empirical research.
Green taxes can reduce manufacturing costs by persuading businesses to reduce energy consumption, invest in energy-saving and environmentally friendly technology, and reduce their environmental footprint. Improved energy efficiency may be achieved by helping to optimize energy and industrial structure to create more output with lower energy inputs. Introducing green taxes as an institutional policy and adopting SDGs are essential to preserving the environment in the Nordic nations. Green taxes in the Nordic nations have contributed to environmental consciousness, encouraging firms to focus on energy optimization, clean production, minimizing GHG emissions, and achieving a higher economic and environmental output. In addition, the development of energy-efficient technology has eliminated the need for large-scale industrial buildings that consume a large amount of energy. The imposition of green taxes, on the other hand, will impede economic growth in emerging nations and raise the price of commodities manufactured. We suggest that developing countries adopt a two-tiered strategy, where environmental fees are implemented alongside economic measures to help fund the move towards cleaner energy sources. The application of dumping taxes on trade partners and multinational enterprises by wealthy countries, such as the Nordic countries, can also encourage less developed countries to enact environmental protection measures, such as green taxes, by discouraging the use of out-of-date technologies. The disruption generated by COVID-19 presents governments with the option of either doubling down on fossil fuels and polluting sectors or using it as an opportunity to establish a new, cleaner economy. The Nordic countries have demonstrated that this is a financially sustainable strategy. It would be a good idea for other countries to follow suit. To that end, the study believes that Nordic policymakers should pay more attention to environmentally friendly and long-term strategies for increasing industrial energy efficiency. Clean energy, industrial innovation, and climate action will benefit from this policy shift in these economies. For example, follow-up research may look at the impact of green taxes on the specific energy industry. Also fascinating to watch is the influence of the technical transition, which is encouraged by taxation on environmental pollution, but raises the cost of producing goods and services as firms seek to cut emissions. Further research on the effectiveness of green taxes in reducing specific pollutants would be a valuable addition to the body of knowledge now available. The study excludes Iceland due to the lack of availability of data.


 ,
, 

