Article

The Rod String Loads Variation during Short-Term Annular Gas Extraction

by
Alexander Vladimirovich Artyukhov
1,
Anatoliy Andreevich Isaev
2,*,
Alexander Nikolaevich Drozdov
3,
Yana Alekseevna Gorbyleva
3 and
Karina Shamilyevna Nurgalieva
4
1
Tatneft PJSC, 423450 Almetyevsk, Russia
2
Sheshmaoil Management Company LLC, 423458 Almetyevsk, Russia
3
Department of Mineral Developing and Oil & Gas Engineering, Peoples’ Friendship University of Russia, 117198 Moscow, Russia
4
Department of Development and Operation of Oil and Gas Fields, Saint-Petersburg Mining University, 199106 St. Petersburg, Russia
*
Author to whom correspondence should be addressed.
Energies 2022, 15(14), 5045; https://doi.org/10.3390/en15145045
Submission received: 19 April 2022 / Revised: 27 June 2022 / Accepted: 5 July 2022 / Published: 11 July 2022

Abstract

:
This paper highlights field studies to determine the nature of variations in the load on the sucker-rod string during short-term gas extraction from the wellbore annulus. The results of step-by-step gas extraction from the annular spaces of the wells of fields developed by PJSC TATNEFT are provided. In the course of investigations, we have obtained both the trends of maximum and minimum loads on the polished rod during annular gas extraction, and the dependence of maximum load increment on the rod string with respect to pump size and pressure variation in the annular space. The analysis of the research data resulted in the elaboration of guidelines for short-term extraction of annular gas from wells operated by the PCP units.

1. Introduction

Complications arising when wells are operated by artificial lift methods result in lower flow rates (i.e., they prevent the well from reaching its maximum flow rate potential). One such adverse factor that negatively affects oil production by submersible pumps is the presence of associated petroleum gas accumulated in the annulus.
The petroleum gas is responsible for lifting the fluid from the bottomhole to the surface. However, a significant amount of free gas at the pump’s inlet reduces the pump’s volumetric efficiency, potentially leading to the pump’s starvation.
The analysis of various factors’ influence on the process of gas emission and accumulation in the annular space as described in [1,2], shows the need to develop methods for predicting the behavior of annular gas pressure value. The papers [3,4] are focused on the investigation of the gas accumulation process and the way in which they resulted in obtaining dependences for calculating the intensity of gas pressure growth in the annular space and the time of its accumulation. However, it was revealed that the intensity of annular gas pressure growth increases nonlinearly over time as the GOR increases and the water cut decreases, and increases linearly along with an increase in fluid flow rate. Besides, an algorithm for calculating the parameters of optimal well operation mode has been developed, and the influence of gas-oil ratio and water cut on the efficiency of gas pressure reduction in the annular space of producing wells has been studied in the paper [5]. For example, at a 100 m3/m3 gas-oil ratio and less than 60% water cut, the ideal annular gas pressure can be as high as 4 MPa.
Numerous studies [6,7,8,9,10,11,12,13,14,15] have addressed the problem of finding technical solutions to reduce gas pressure in the annular space at various methods of well operation. A review in [16] illustrates tools to reduce the impact of gas on the operation of downhole sucker-rod pumps and their effectiveness under various operating conditions. In [17], the results of a technology developed for optimizing the operating mode of sucker rod pumps when extracting oil with a high gas content are presented.
The authors of [11] show that depending on the geological and technical properties of wells, the growth pattern of the separated gas pressure in the annular space has been established, and the experimental dependence for calculating the time of gas pressure stabilization in the annular space upon getting the pressure equal to the pressure in a well’s discharge manifold has been obtained. The work of [8] has revealed that the disposal period of annular gas has a significant dependence on water cut and gas-oil ratio.
In recent years, the method of separating gas from the wellbore annulus by a compressor and pumping it into the manifold line has been increasingly employed in the oil production industry [9,10]. Piston compressors are mainly used for these purposes [18,19]. The main effect of using this method is the additional oil production due to increasing the dynamic fluid level in the well and the pump’s volumetric flow efficiency [20]. Gas bleeding or evacuating from the annulus leads to a change in pressure and temperature conditions in the wellbore [3]. The authors of [21] show options for reducing the effect of gas on the operation of downhole sucker-rod pumps and their efficiency under different operating conditions. A large volume of gas at the pump’s intake can reduce the overall pump efficiency by up to 60%, which is due to the late opening of the delivery valve during downward movement due to gas compression under the plunger [16]. Raising the level above the pump is one of the ways to control gas production using sucker rod pumps and since the gas has a lower density, it will flow up into the annulus of the well [15].
In the work of [21], it was established experimentally by sampling and examination of 813 samples that when the gas was pumped out and the vacuum was created in the annular space, the oil viscosity at the wellhead increased by 6.8% on average for the groups of formations, which is an insignificant indicator that corresponds to the measurement error. Injection of associated annular gas into the manifold reduces the density of the liquid and improves its transportation through pipelines [17]. The decrease in pressure at the pump’s inlet caused by the gas extraction leads to an increase in the maximum load acting on the pumpjack’s horsehead and the rod string. This effect is attributed to an increase in hydrostatic pressure drop on the plunger as the rod string moves upward.

2. Materials and Methods

To determine the nature of changes in loads, it is necessary to perform calculations and field tests to determine the effect of annular gas extraction on the loads acting on the rod string. In the presented study, calculations and field tests were performed for the wells of fields developed by PJSC TATNEFT.
During intermittent extraction of gas from the well’s annulus, the maximum and minimum loads were measured by means of a sensor included in the “XSPOC” Production Optimization Software and Hardware. The sensor controller transmits all data to the specialists’ workstations.
The dynamometry method was used [22] to determine the efficiency of the sucker rod pump. The method of the dynamometer map for wells allows for continuous measurement and monitoring in real time [23,24].
Viscosity and asphaltene-resin-paraffin substances (ARPS) have been studied and measured in chemical analysis laboratories.
A cluster compressor of KOGS type (Figure 1) developed by the department for innovations and examination of LLC MC Sheshmaoil (Republic of Tatarstan), was applied for pumping the associated petroleum gas. The KOGS consists of the following pieces of equipment: a three-stage compressor with two electric drives; process lines including shutoff valves, systems for monitoring gas parameters and the unit’s operation (explosion-proof pressure and temperature sensors, check valves, pressure gauges, etc.); ventilation and heating system; fire alarms located in the sheltered enclosure; control station allowing remote monitoring and control; connection points to the wellhead fittings; a set of 16.5 MPa high-pressure hoses (HPH); connection assemblies to the manifold line (including ball valves, check valves); heating cable and HPH heat insulation (for winter conditions); cables and wires.

3. Results

3.1. Experimental Results

The presence of gas at the pump intake can be determined by dynamometer charts, which are diagrams of load variations on the polished rod depending on its stroke [25,26]. The dynamograph records friction forces, inertial and dynamic effects in the actual conditions [27,28,29].
The results of the experimental work are presented in Figure 2, Figure 3 and Figure 4, the data were obtained from the Lufkin Automation controller. Figure 2 shows that extraction of gas from the wellbore annulus caused simultaneous changes in the polished rod loads: the maximum loads increased by 7%, and the minimum loads decreased by 11%. After the gas had been removed from the wellbore annulus and the gas filled it again, the polished rod loads restored to their original values.
During the tests (Figure 3), the pumpjack’s operation without the controller was simulated (we disabled the function of the pumpjack emergency shutdown when the maximum permissible load is reached), that resulted in breakage of the gearbox fasteners. On the second day of research, the pattern of load variations was similar to the previous one.
Similar results with respect to the loads on the polished rod were obtained at wells No. 32554 (Figure 4), No. 14764d and No. 3963 (Figure 5) after the annular gas had been extracted.
At the well No.5597d, after the gas was extracted from the annulus, the viscosity increased significantly from 20 mPa-s to 330 mPa-s, the ARPS content in oil increased from 3.3% to 12.1% (Figure 6). The viscosity variations of the produced fluid after recovery of annular gas are not that evident at all wells due to emulsion breakdown while samples are being transported to the laboratory.

3.2. Analysis of Results

An analysis of the data obtained from the results of field tests revealed the following:
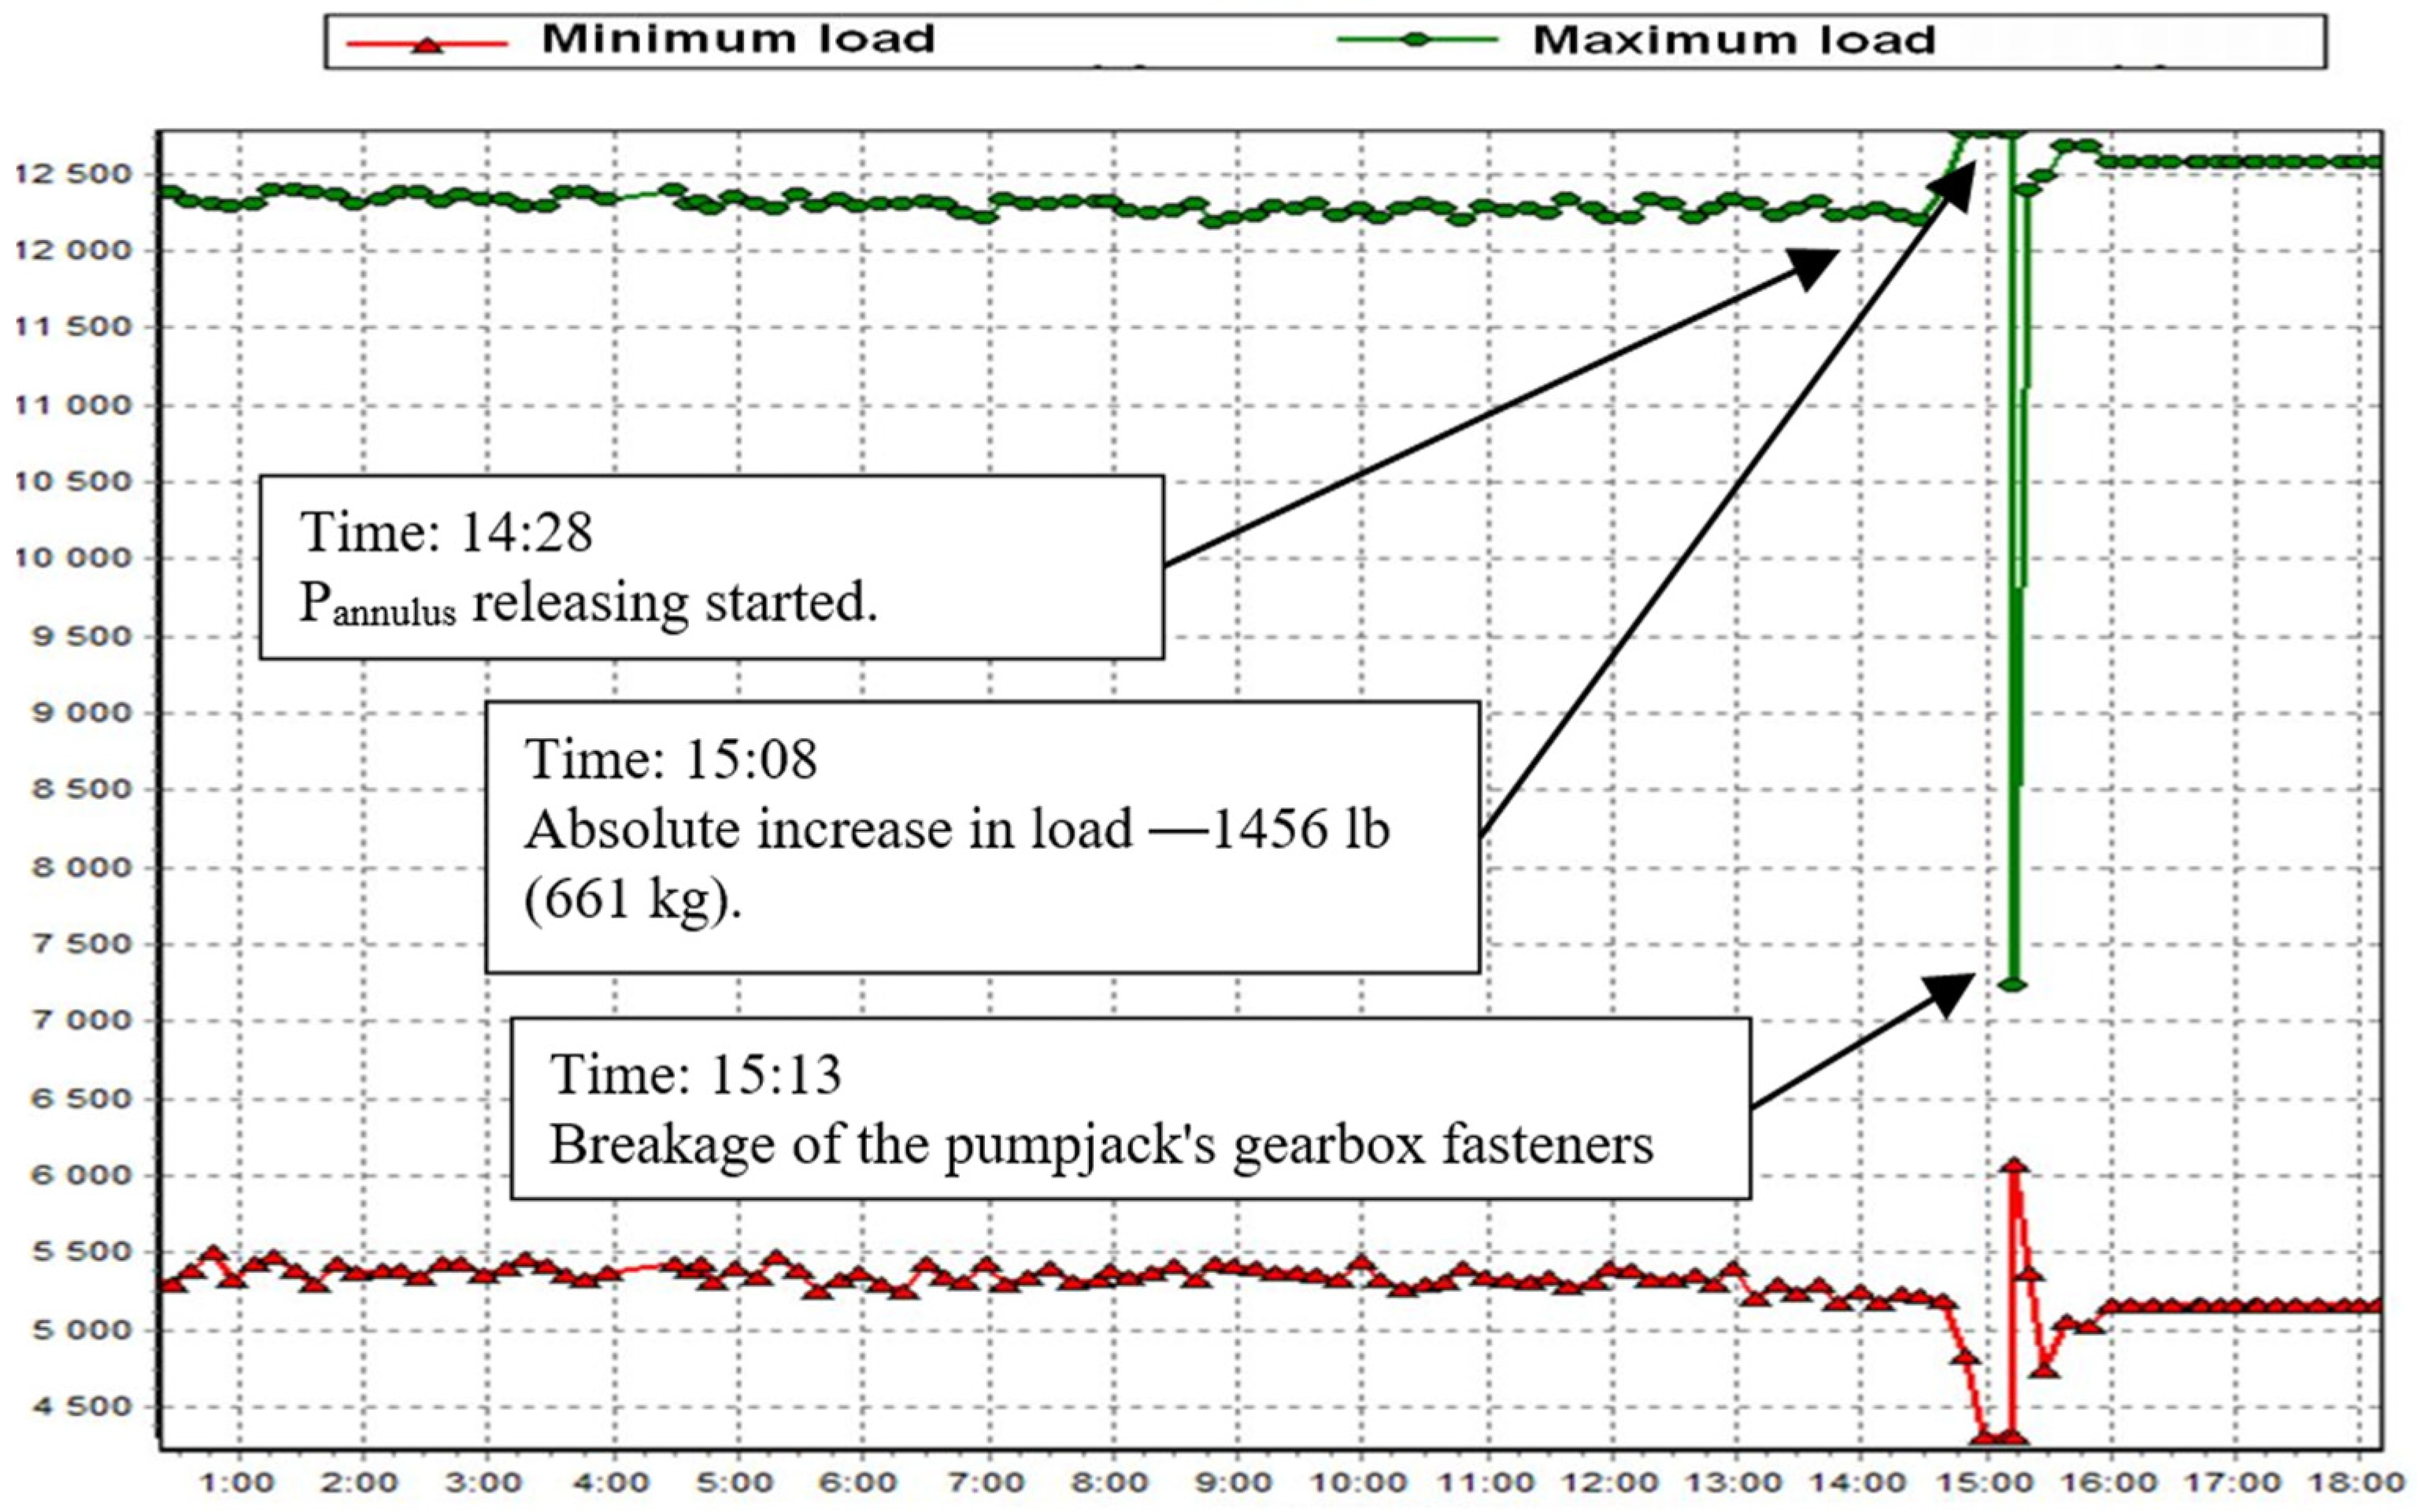
  • The maximum load during gas extraction grows as a result of a sharp decrease in pressure at the pump inlet.
The intensity of the load growth depends on the pump type and size, gas extraction rate, well’s production capacity, as well as the water cut of the product. Table 1 shows how the maximum load on the rod string varies depending on the pump size. N-44 indicates the type and size of a rod pump with a plunger diameter of 44 mm.
2.
The minimum load on the sucker-rod string decreases due to increased viscosity of the fluid in the tubing string.
The reason why the viscosity increases is obviously due to the decreased inflow of the gaseous phase into the pump. Pressure reduction at the pump’s inlet makes the gas bubbles in the liquid therein grow in size. The rate at which larger bubbles float up in the fluid contributes to greater gas separation and more gas entering the annulus. At the same time, reduction of the free gas content in the liquid leads to growth of its viscosity [30,31,32].
3.
There is a direct correlation between the gas-oil ratio of the produced fluid and the duration of the gas extraction effect.
The period of maximum load variation in the wells of the Devonian formation is shorter than that in the sulfur-containing wells.
During the experimental operations at the well No. 32554, a floating rod effect occurred for a short time after the completion of annular gas extraction. Full operation of the well was restored after 1 h.
Dynamogram variations for the well No. 32554 after gas extraction are shown in Figure 7, Figure 8 and Figure 9.
The average operating parameters of KOGS (maintaining annular pressure in the wells) are mainly as follows during the operation:
-
Sheshmaoil JSC—max. 0.25 MPa, min. 0.1 MPa;
-
Ideloil JSC—max. 0.2 MPa, min.0.1 MPa;
-
Geotech JSC—max. 0.15 MPa, min. 0.05 MPa;
-
Geology JSC—max. 0.2 MPa, min. 0.1 MPa.
Application of KOGS makes it possible to increase the dynamic fluid level in the annulus and boost fluid and oil production (Table 2).
Within the next stage of the research, we measured the volume of gas extracted by KOGS from the annuli of wells of the wells cluster 16,142. The measurements were carried out using a DRG.M160 gas flow meter. At this stage it was necessary to compare the volume of gas extracted by KOGS with the default values.
The conversion formula to obtain the Vnc volume (flow rate) of gas reduced to normal (standard) conditions is included in the software of the KOGS Control Station (CS) controller:
Vnc = Q ∗ 2893.17 ∗ (Pw + Pn)/(Tn + Tw) ∗ K, Nm3/h
where: Pw is working pressure, MPa;
Pn = 760 mmHg = 0.101325 MPa is a constant;
Tn = 20 °C = 273.15 °K is a constant value;
Tw—measured temperature of gas at the inlet, °C;
K is the gas compressibility factor (assumed to be 1);
Q is the gas flow calculated by the device (m3/h):
Q = Qmax ∗ (I − 4)/16,
where Qmax is the upper range value of the flow meter, m3/h (a constant, reference value).
I is the current at the output of the flow meter, mA.
This is how the gas flow measurement parameters have been visualized on the Control Station panel.
Gas measurement tests were performed within 18 days. 5570.2 Nm3 of gas was pumped out by KOGS. The operating time was 82 h 3 min = 82.05 h. Thus, average hourly capacity of KOGS at this cluster amounted to 67.89 Nm3/h. The volume of extracted gas at this cluster of wells has been varying from 369.1 Nm3/day to 258.6 Nm3/day, which can be attributed to changes in physical and chemical properties of the extracted products inside the well and physical processes taking place in producing formations.
Power consumption monitoring has revealed that the average value of power consumption was 15.30 kWh. The readings are taken through current transformers with a transformation ratio of 150/5. One cycle of gas evacuation by KOGS takes 23 min, i.e., 0.39 h. Average daily performance of KOGS is 10.2 cycles of gas pumping. The average time required for annular gas to gain pressure from 0.05 MPa to 0.25 MPa is 2 h 5 min. The performance of the compressor was 87 Nm3/h, which corresponds to the factory specifications of 80.8 Nm3/h ± 10%.
To provide professionals who operate various gas compressors with a clear explanation, a detailed calculation will be provided below, with the compressor performance indicated in the formulas. Proficiency in using Formula (1) will allow specialists to calculate compressor performance for their applications, based on inlet and outlet pressures, temperatures, and gas flow rate.
To calculate the volume of gas according to (1), it is necessary to calculate the volumes of KOGS cylinders. The source data for GC 1 (single-stage compressor) are as follows:
  • Piston diameter D1 = 108 mm = 0.108 m;
  • Piston diameter D2 = 52 mm = 0.052 m;
  • Piston stroke h = 93 mm = 0.093 m;
  • 7.5 kW electric motor sheave diameter = 209 mm;
  • GC sheave diameter = 456 mm;
  • Transmission ratio is 456/209 = 2.18;
  • Motor speed: 2980 rpm;
  • Compressor speed: 2980/2.18 = 1366 rpm;
The working volume of the first stage (GC1) V1 is defined as the product of the cylinder area by the stroke:
V1= π ∗ R2 ∗ h = (π ∗ D2)/4) ∗ h = ((3.14 ∗ 0.1082/4) + (3.14 ∗ 0.0522/4)) ∗ 0.093 = 0.00104 m3
The volume of the gas compressed by the first stage per minute under normal conditions will be:
Q1 = 0.00104 Nm3 ∗ 1366 rpm = 1.42 Nm3/min ∗ 60 min = 85.2 Nm3/h,
which corresponds to factory specifications of 80.8 ± 10% Nm3/h.
The source data for GC 2/3 (two-stage compressor) are as follows:
  • Piston diameter D3 = 78 mm = 0.078 m;
  • Piston diameter D4 = 52 mm = 0.052 m;
  • Piston stroke h = 93 mm = 0.093 m;
  • The diameter of the 11 kW electric motor = 133 mm;
  • GC sheave diameter = 456 mm;
  • Transmission ratio is 456/133 = 3.428;
  • Motor speed: 2980 rpm;
  • Compressor speed: 2980/3.428 = 870 rpm.
The working volume V2 of the second stage (GC2) will be:
V2 = (3.14 ∗ 0.0782/4) ∗ 0.093 = 0.0004442 m3.
The volume of compressed gas per minute by the second stage will be:
Q2 = 0.0004442 Nm3 ∗ 870 rpm = 0.386 Nm3/min ∗ 60 min = 22.8 Nm3/h.
The working volume V3 of the third stage (GC2) will be:
V3 = (3.14 ∗ 0.0522/4) ∗ 0.093 = 0.0001974 m3.
The volume of compressed gas per minute by the third stage will be:
Q3 = 0.0001974 Nm3 ∗ 870 rpm = 0.17 Nm3/min ∗ 60 min = 10.2 Nm3/h.
Now it is necessary to calculate the gas volume in the discharge line after the third stage, with a pressure of 0.8 MPa at the inlet to the stage, and 1.49 MPa in the discharge line.
ΔP = 1.49 − 0.8 = 0.69 MPa, Tw = 150 °C is the gas temperature after the third stage of compression, Q is the gas flow rate in the third stage, K is the compressibility factor.
V = Q ∗ 2893.17 ∗ (ΔP + 0.101325)/(273.15 + Tw ∗ K) = 10.2 ∗ 2893.17 ∗ (0.69 + 0.101325)/(273.15 + 150) ∗ 1.0 = 55.80 Nm3/h
which corresponds to the factory specifications of 57.0 ± 10% Nm3/h at a pressure of 2.5 MPa in the line, excluding the K factor.
Further studies were carried out to determine the hydrodynamic connectivity between production wells operated by means of a pumpjack. To clarify these connections between the wells and their mutual influence, as well as to determine the effect of the KOGS unit on the operation of the downhole pumping equipment and the fluid dynamics of the well site, high-precision downhole pressure metering was performed in the wells No. 3730 and 3735, while these wells were connected to KOGS, which had been pumping gas from the wellbore annulus.
According to the testing (pressure transient analysis) results obtained at the well site No. 3736 and the perturbation of a plot with a dense grid of wells (completed by hydraulic fracturing), the following conclusions were made (Figure 10).
1.
There is a hydrodynamic connectivity within the plot.
1.1.
The connection is rapid (immediate) due to the existence of fractures of limited and unlimited conductivity after hydraulic fracturing (all wells were fractured in 2014–2015). Hydraulic fracturing was carried out in the wells No. 3741, 3742, 3739, 3735, and 3730. The plot can be further considered as a uniform hydrodynamic system.
1.2.
Interference responses are weak due to minor perturbations (daily extraction during operation is less than 1.5 m3/day). In case the flow rates increase at similar plots, it is reasonable to resume the well testing.
2.
The downhole pressure gauge makes it possible to accurately monitor the changes in the well operation (fluid extraction through pressure) online.
3.
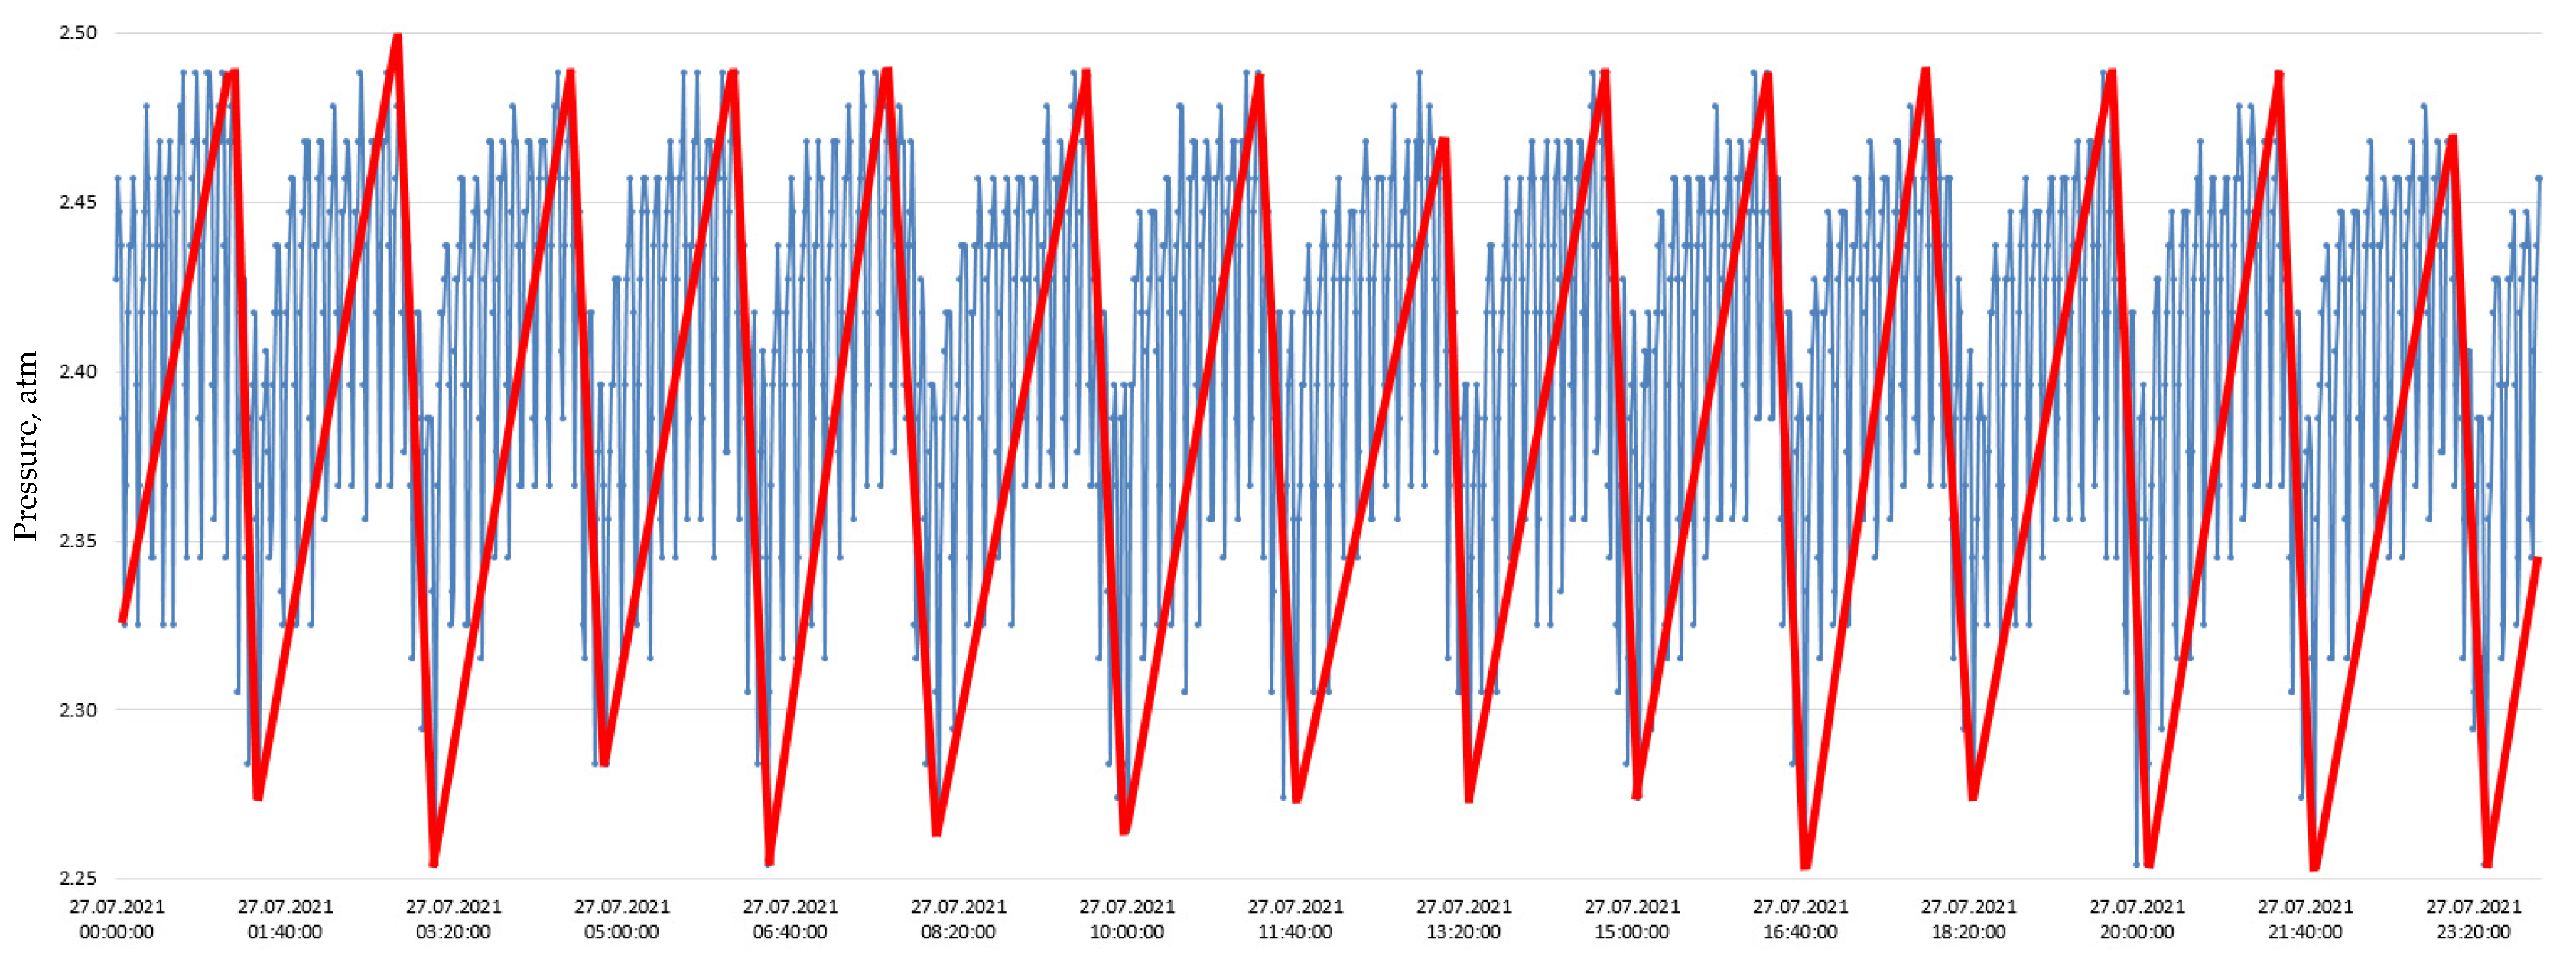
The harmonic with 100 min/7 min periodicity detected within one day’s section is connected with the operation of KOGS No. 110 at the wells No. 3730, 3735, 3729, 3733, 3728 (Figure 11). The blue color shows pressure values at the well No. 3735, while the red curve indicates KOGS operation, where the upper point means KOGS start-up, and the lower point means KOGS shut-down and switching to the mode of gas accumulation in annular space. Metering by means of a downhole pressure gauge and KOGS unit revealed that extraction of gas from the wellbore annulus down to 0.5 atm triggers changes in bottomhole pressure, and the harmonic of bottomhole pressure and annulus pressure equalize.
4.
The importance of “intelligent oilfield” and “machine learning” increases.

3.3. Recommendations for Extraction of Annular Gas

The analysis of the obtained results of studies of load variations on the rod string, as well as variations of values of maximum and minimum loads at a number of wells of fields developed by PJSC TATNEFT resulted in recommendations for performing short-term gas extraction from the annuli of wells equipped with downhole sucker-rod pumps.
  • If there are significant values of gas pressure in the annulus space, the gas should be pumped into the flowline gradually, by 1.0–1.5 MPa/day.
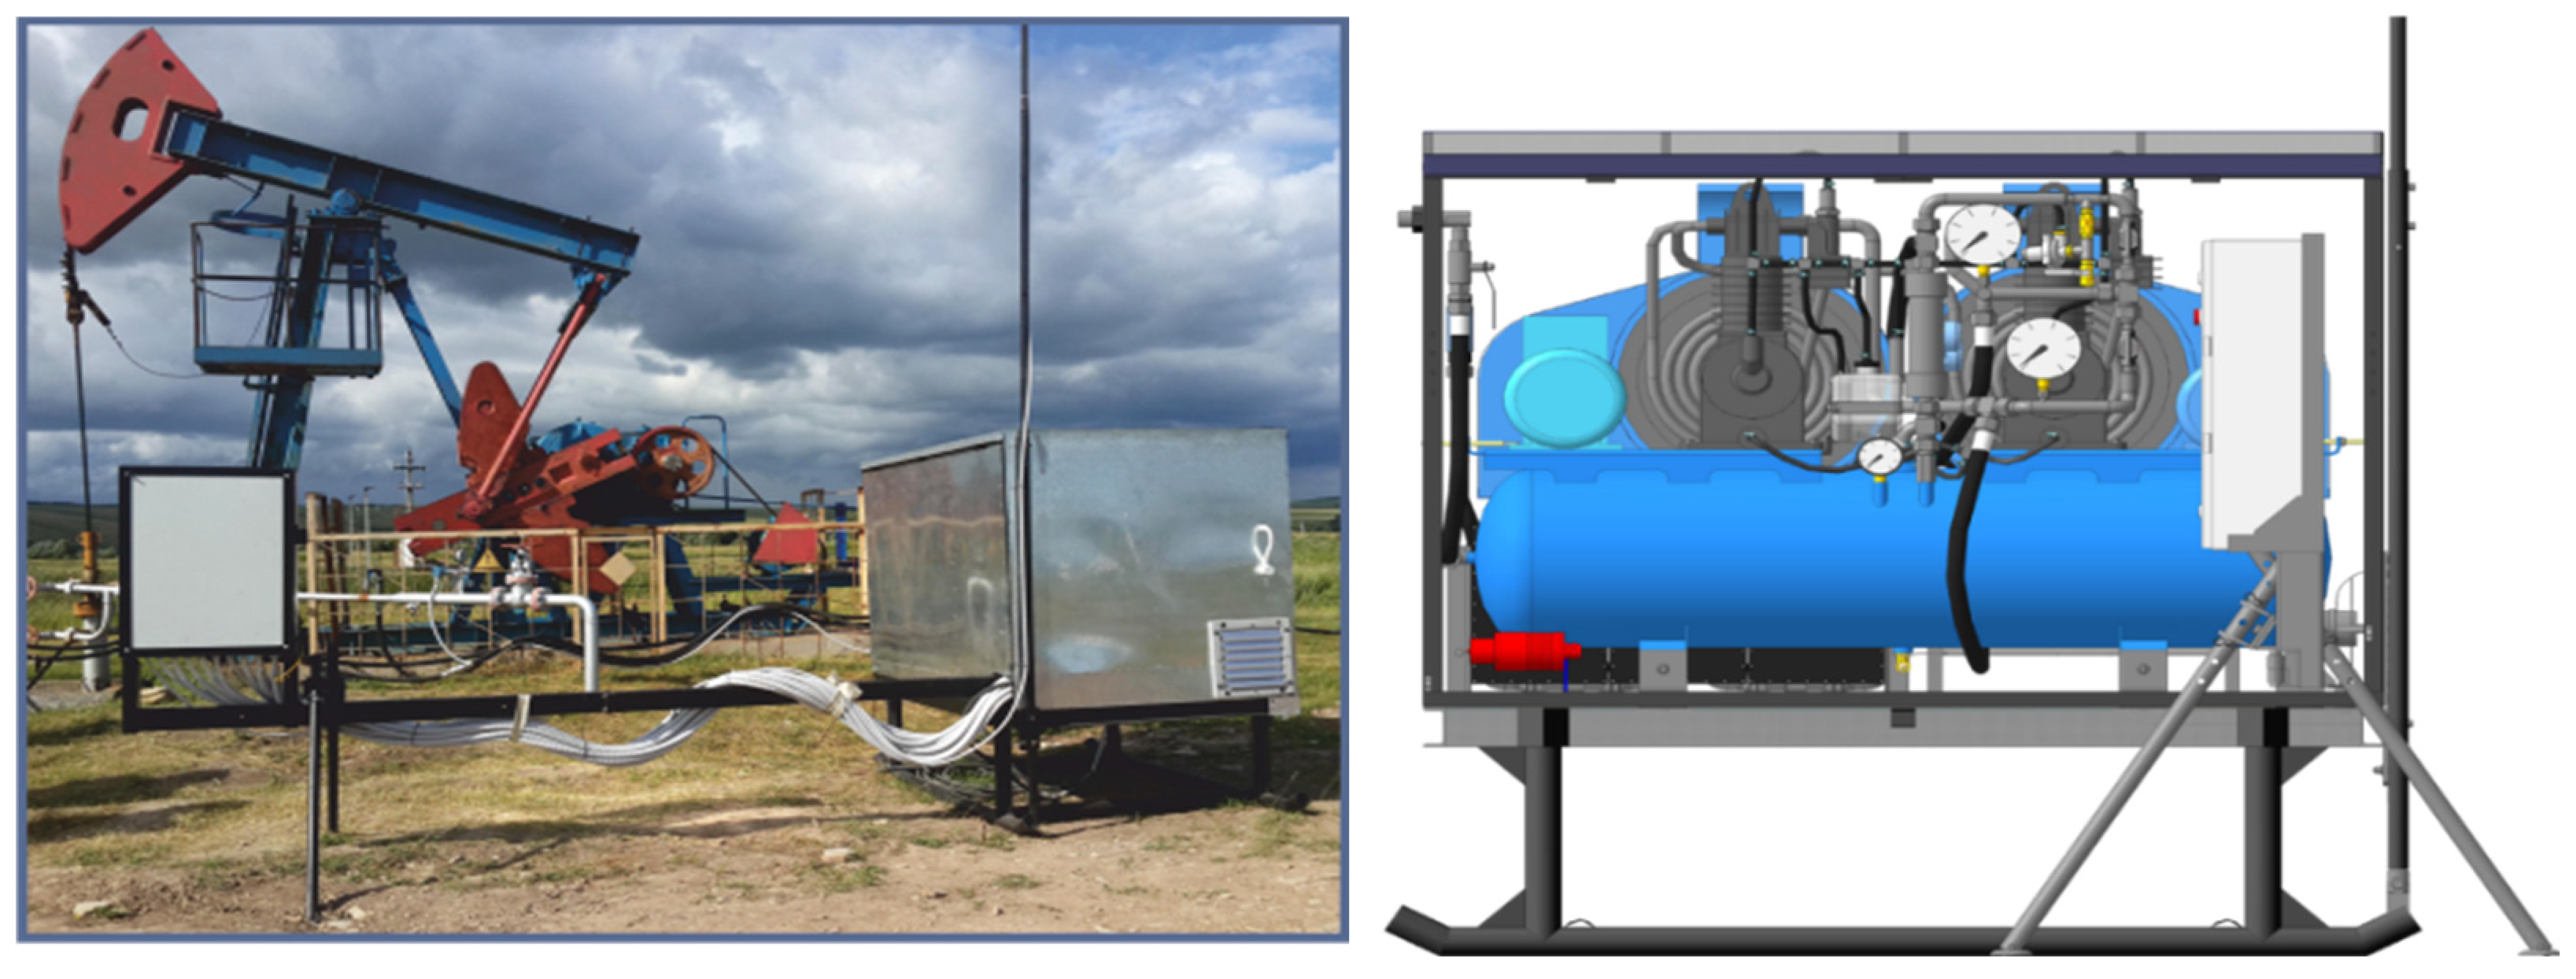
  • Oil wells featuring an intense accumulation of annular gas must be equipped with compressors for gas evacuation or lifting valves to evacuate gas into the manifold line. The valve should be installed with regard to the location of the probe plug on the wellhead assembly’s pipe holder.
  • If it is necessary to evacuate annular pressure down to atmospheric pressure (stuffing-box packing, valve replacement, etc.) and there is no compressor for gas evacuation at the wellsite, the operation of the well should be started no sooner than one hour after complete extraction of annular gas.
  • Extraction of annular gas needs to be carried out with due consideration of the research results and recommendations presented in this paper.

4. Conclusions

1.
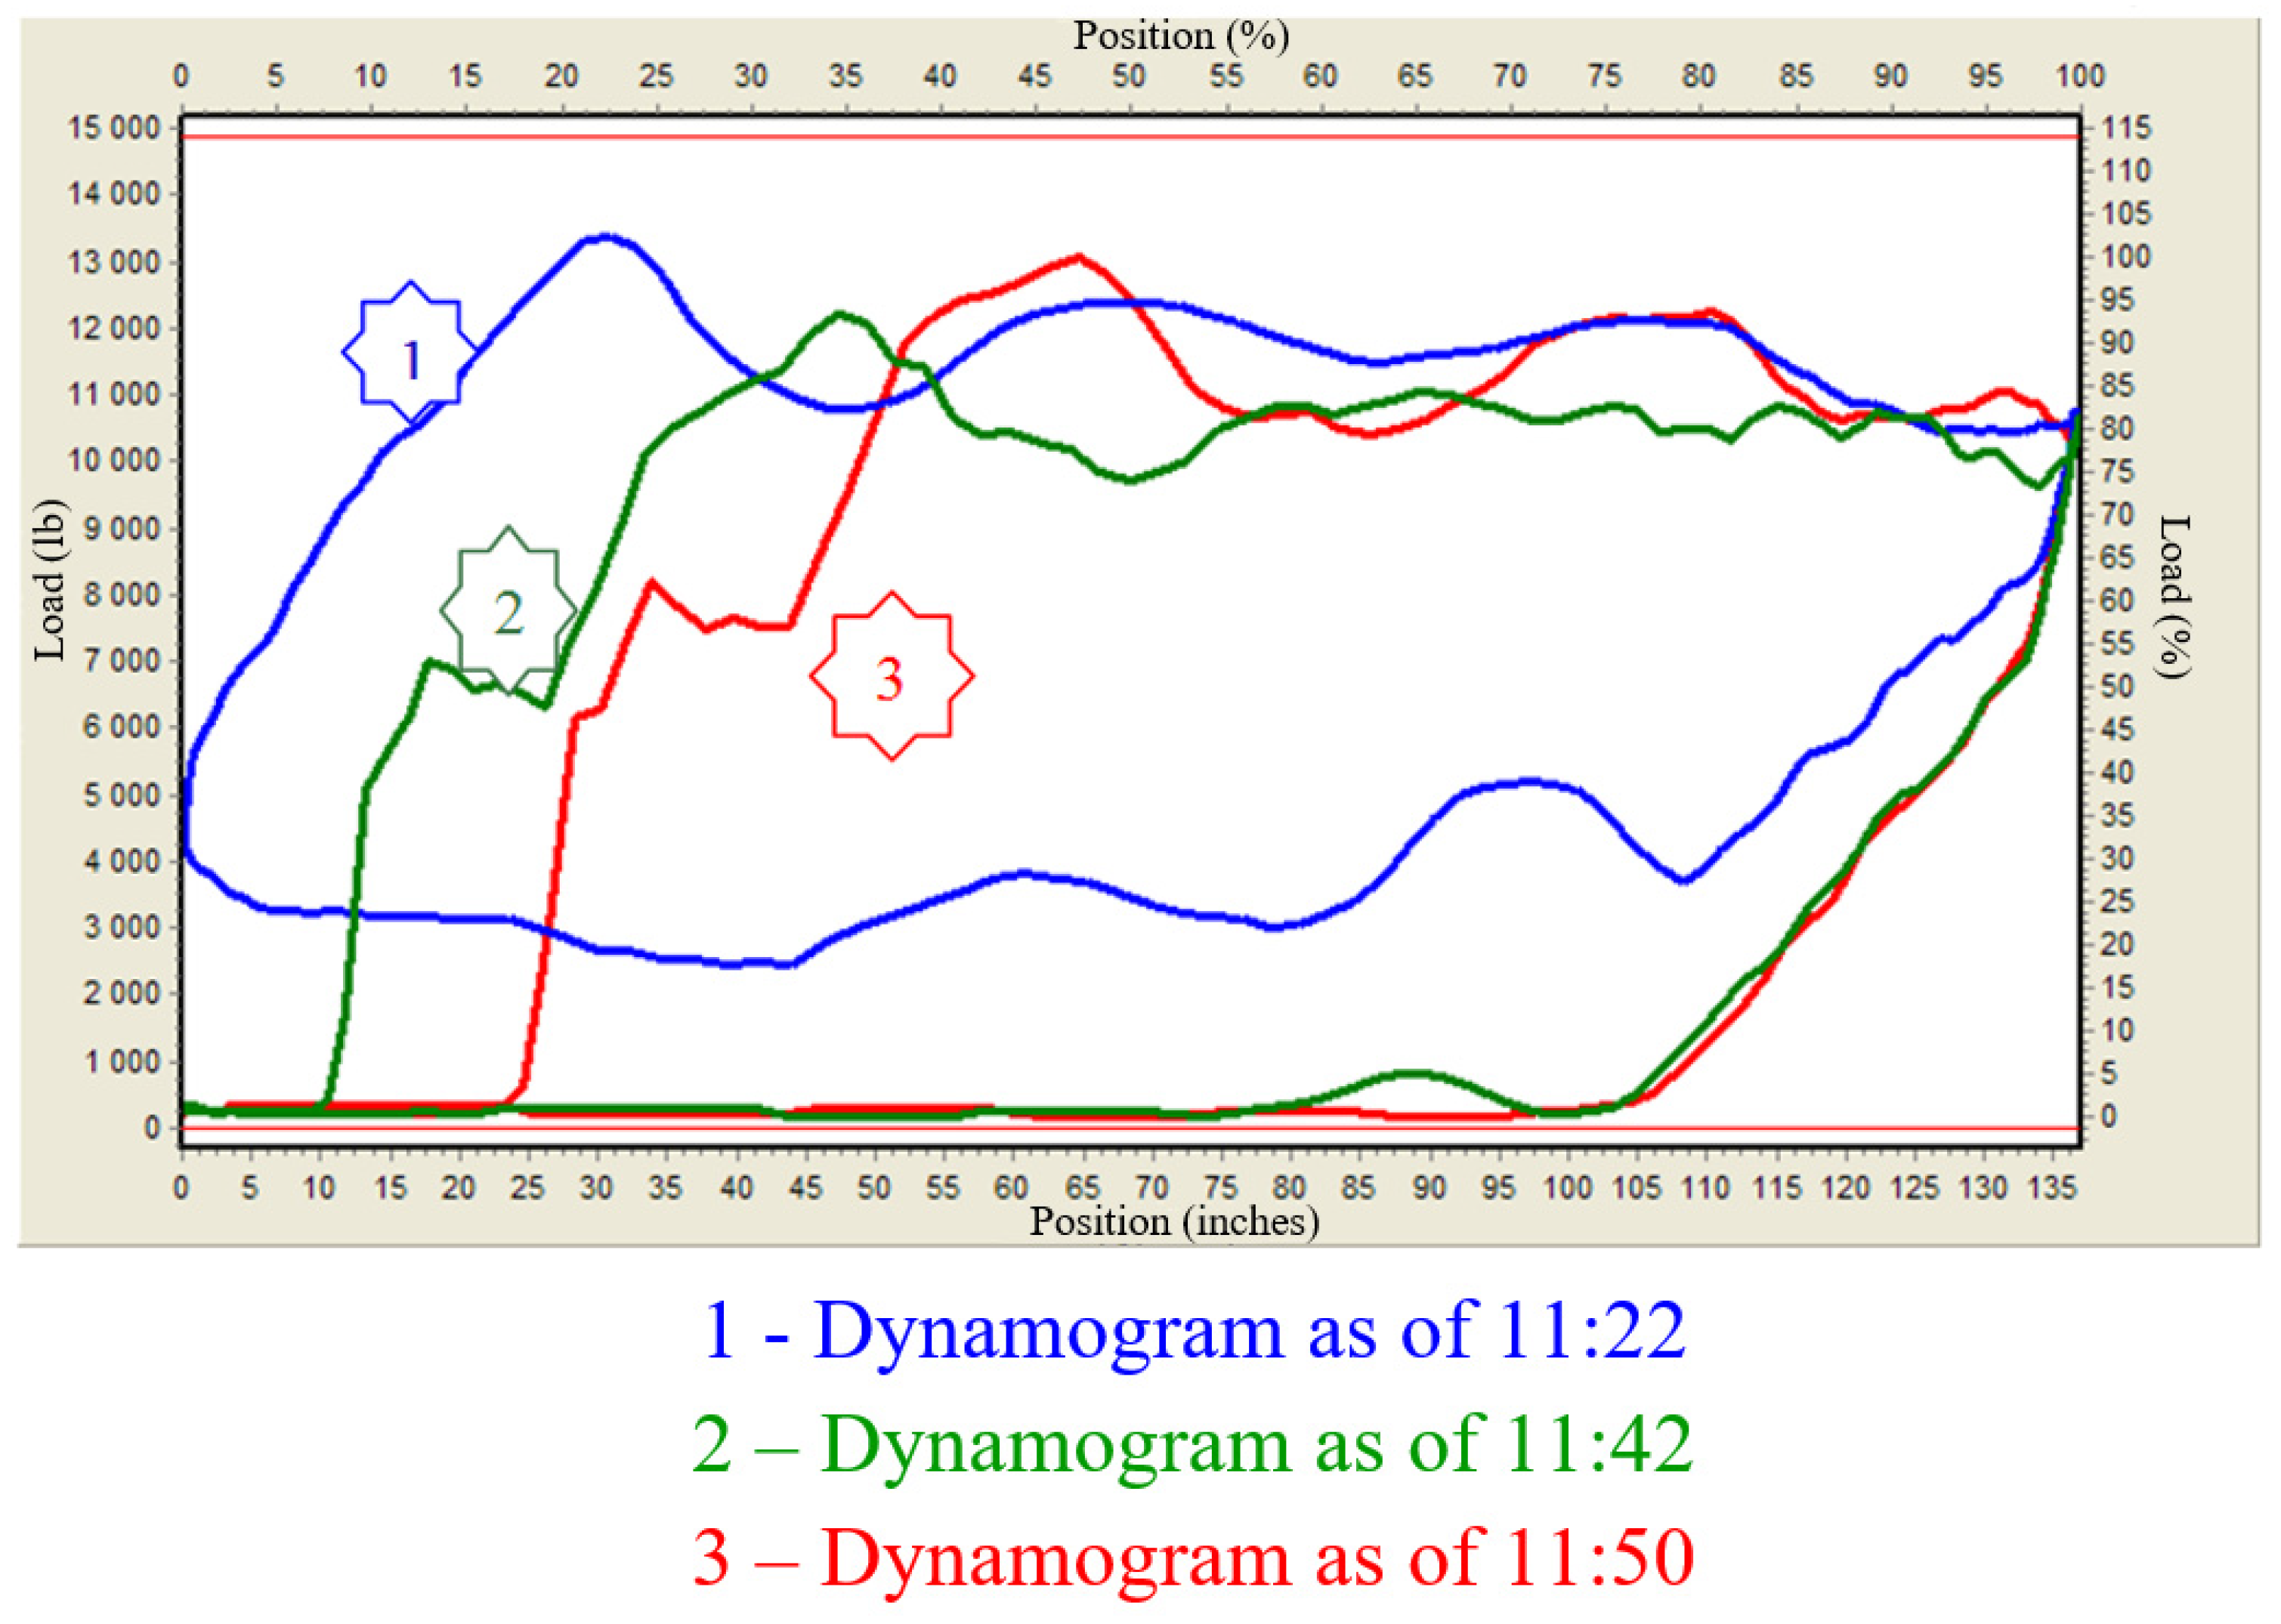
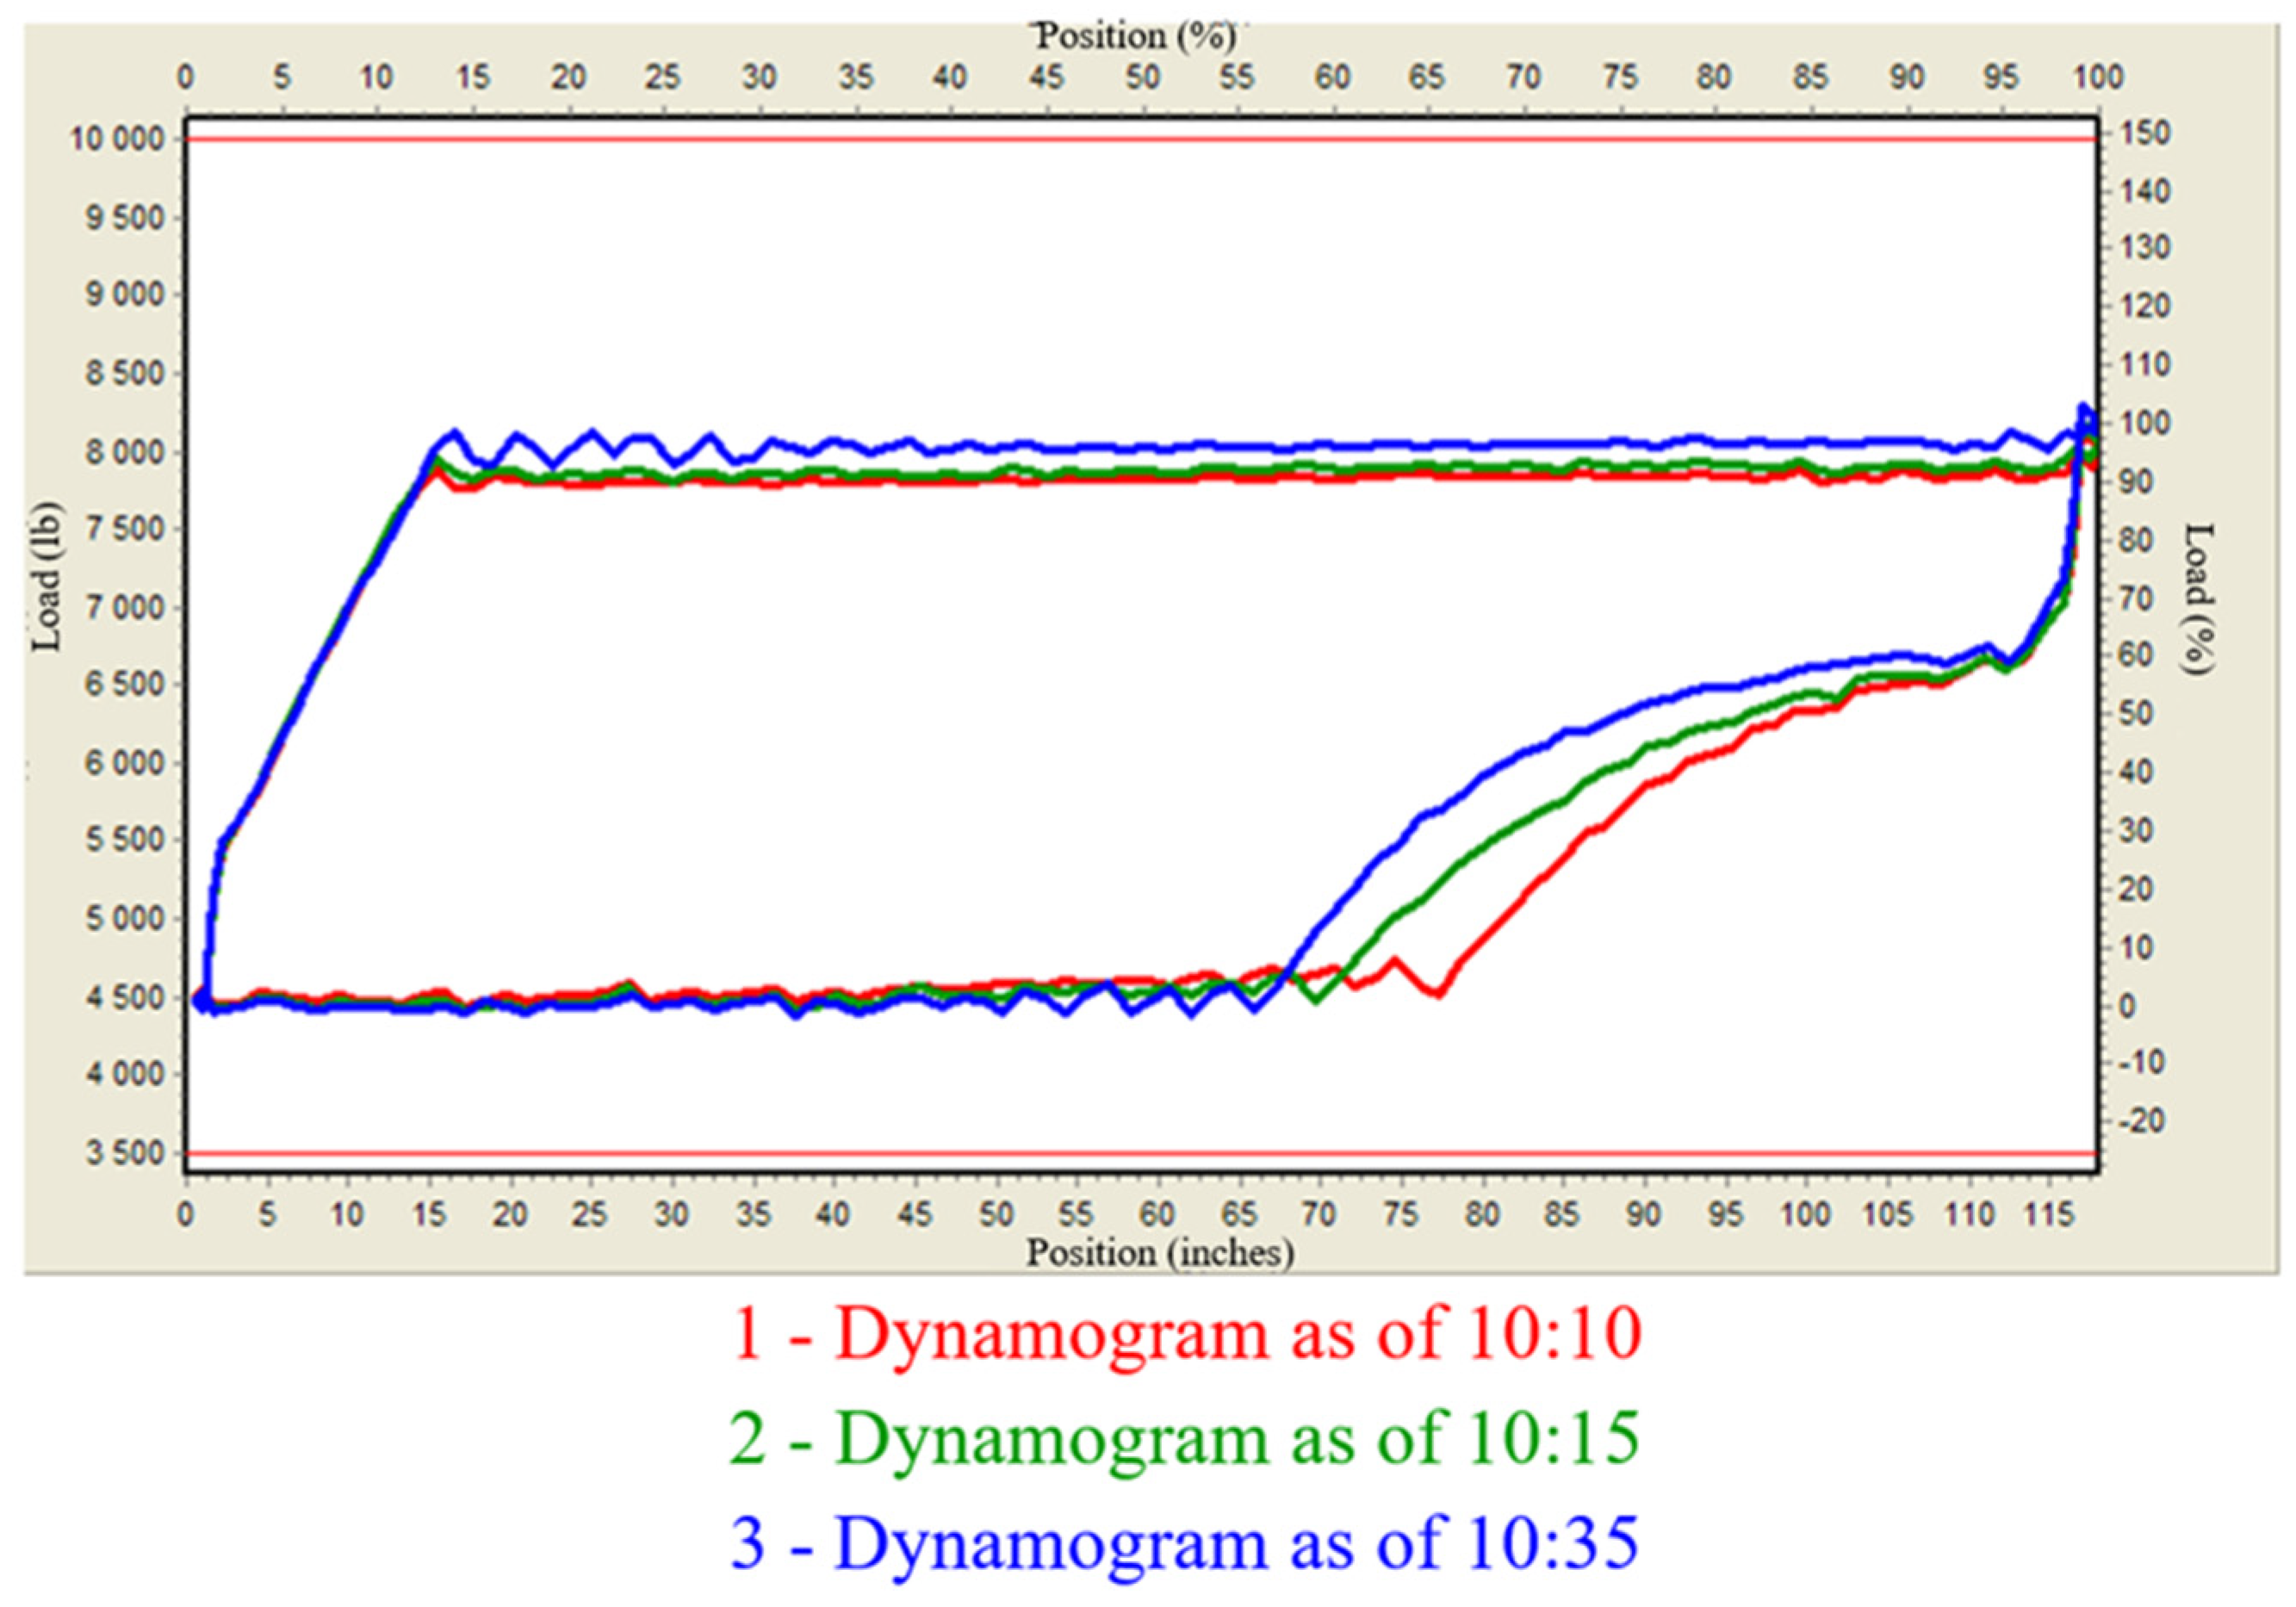
Sudden evacuation of gas from annular space leads to an increased amplitude of the loads acting on the sucker-rod string.
This results in the following:
  • Sharp growth in maximum and decline in minimum loads on a pumpjack’s horsehead, which can lead to failure of the pump drive’s parts in case the pumpjack is operated with the loads close to the rated lifting capacity;
  • Growth of the reduced stresses and increased probability of rod breakage;
  • Growth of the maximum load, which, in turn, leads to loss of equilibrium of the pumpjack. This results in electric motor overload, increased power consumption, and considerable wear and tear on the belts.
2.
The maximum load growth during gas extraction is directly proportional to the pump’s type and size, as well as to the pumping rate.
3.
Gas extraction with ARPS deposits present in the tubing string can lead to further buildup of such deposits on the downhole pumping equipment that would consequently cause the tubing string to float.
4.
The presented detailed calculations have proved that the capacity of the KOGS compressors complies with the default values.
5.
Metering by means of a downhole pressure gauge and KOGS unit revealed that forced extraction of gas down to 0.5 atm from the annuli of the wells with a single hydrodynamic system changes the bottomhole pressure, and the harmonic of bottomhole pressure and annulus pressure equalize.

Author Contributions

Conceptualization, A.V.A., A.A.I. and A.N.D.; methodology, A.V.A., A.A.I.; software, A.A.I., A.V.A.; validation, A.A.I., A.N.D. and Y.A.G.; format analysis, A.A.I.; investigation, A.A.I., A.N.D.; resources, A.A.I., K.S.N.; data curation, A.A.I., A.V.A.; writing—original draft preparation, A.A.I., A.V.A.; writing—review and editing, A.A.I., Y.A.G.; visualization, A.A.I., A.V.A.; supervision, A.N.D.; project administration, Y.A.G.; funding acquisition, A.A.I., A.N.D. and Y.A.G. All authors have read and agreed to the published version of the manuscript.

Funding

This paper has been supported by the RUDN University Strategic Academic Leadership Program.

Institutional Review Board Statement

Not applicable.

Informed Consent Statement

Not applicable.

Conflicts of Interest

The authors declare no conflict of interest. The funders had no role in the design of the study; in the collection, analyses, or interpretation of data; in the writing of the manuscript, or in the decision to publish the results.

References

  1. Wang, W.; Zuo, X.; Zhao, H. Analysis on tubing-casing annular gas production. Oil Drill. Prod. Technol. 2008, 30, 52–55. [Google Scholar]
  2. Zhang, B.; Guan, Z.; Lu, N.; Wang, Q.; Hasan, A.R.; Xu, B. Trapped annular pressure caused by thermal expansion in oil and gas wells: A review of prediction approaches, risk assessment and mitigation strategies. J. Pet. Sci. Eng. 2019, 172, 70–82. [Google Scholar] [CrossRef]
  3. Urazakov, K.R.; Belozerov, V.V.; Latypov, B.M. Study of the dynamics for gas accumulation in the annulus of production wells. J. Min. Inst. 2021, 250, 606–614. [Google Scholar] [CrossRef]
  4. Pai, R.; Gupta, A.; Sathuvalli, U.B.; Suryanarayana, P.V.; Affes, S.; Okoroafor, J.; Nwamara, N. Validation of Transient Annular Pressure Build-Up APB Model Predictions with Field Measurements in an Offshore Well and Characterization of Uncertainty Bounds. In Proceedings of the IADC/SPE International Drilling Conference and Exhibition, Galveston, TX, USA, 3–5 March 2020. SPE-199561-MS. [Google Scholar] [CrossRef]
  5. Belozerov, V.V.; Rabaev, R.U.; Molchanova, V.A. Efficiency research of the reducing the gas pressure in the annulus (Russian). Neft. Khozyaystvo—Oil Ind. 2019, 11, 134–138. [Google Scholar] [CrossRef]
  6. Mingulov, S.G.; Mingulov, I.S. Techniques for optimization of gas extraction from production wells annulus. IOP Conf. Ser. Mater. Sci. Eng. 2021, 1111, 012037. [Google Scholar] [CrossRef]
  7. Kang, Y.; Liu, Z.; Gonzales, A.; Samuel, R. Investigating the Influence of ESP on Wellbore Temperature, Pressure, Annular Pressure Buildup, and Wellbore Integrity. In Proceedings of the SPE Deepwater Drilling and Completions Conference, Galveston, TX, USA, 14–15 September 2016. SPE-180299-MS. [Google Scholar] [CrossRef]
  8. Rabaev, R.U.; Belozerov, V.V.; Molchanova, V.A. Associated annular gas utilization methods. Neftegazovoe Delo 2019, 17, 88–93. (In Russian) [Google Scholar] [CrossRef]
  9. Isaev, A.A.; Takhautdinov, R.S.; Malykhin, V.I.; Sharifullin, A.A. Gas removal efficiency from a well. Georesources 2018, 20, 359–364. [Google Scholar] [CrossRef]
  10. Isaev, A.A.; Takhautdinov, R.S.; Malykhin, V.I.; Sharifullin, A.A. Oil production stimulation by creating a vacuum in the annular space of the well. In Proceedings of the SPE Annual Caspian Technical Conference, Baku, Azerbaijan, 16–18 October 2019; p. 28. [Google Scholar] [CrossRef]
  11. Sevastyanov, A.V.; Mingulov, S.G.; Nigai, Y.V.; Valeev, M.D.; Tretyakov, R.S. Research and optimization of gas extraction from the annular spaces of oil wells. Problemy Sbora, Podgotovki i Transporta Nefti i Nefteproduktov [Probl. Collect. Treat. Transp. Oil Pet. Prod.] 2016, 2, 42–48. [Google Scholar] [CrossRef]
  12. Belozerov, V.V.; Rabaev, R.U.; Urazakov, K.R.; Zhulaev, V.P.; Khabibullin, M.Y. Gas pressure optimization method in the annulus of a production well. Neftegazovoye Delo [Oil Gas Bus.] 2019, 17, 23–32. [Google Scholar] [CrossRef]
  13. Urazakov, K.R.; Mukhin, I.A.; Vakhitova, R.I. Simulation of a jet pump properties. Elektrotekhnicheskiye i Informatsiyonniye Kompleksy i Sistemy [Electr. Inf. Complexes Syst.] 2015, 11, 41–50. [Google Scholar]
  14. Korabelnikov, M.I.; Korabelnikov, A.M. Method of Production of an Oil with Increased Gas Content and a Device for Its Implementation. Patent 2667182 (RF) IPC E21B 43/12, F04B 47/02, 17 September 2018. [Google Scholar]
  15. Jiang, M.; Cheng, T.; Dong, K.; Liu, J.; Zhang, H. An Efficient Downhole Oil/Water-Separation System with Sucker-Rod Pump. SPE Prod. Oper. 2020, 35, 522–536. [Google Scholar] [CrossRef]
  16. Allison, A.P.; Leal, C.F.; Boland, M.R. Solving Gas Interference Issues with Sucker Rod Pumps in the Permian Basin. In Proceedings of the SPE Artificial Lift Conference and Exhibition—Americas, The Woodlands, TX, USA, 28–30 August 2018. SPE-190936-MS. [Google Scholar] [CrossRef]
  17. Han, G.; Wu, X.; Zhang, H.; Zhang, X.; Ling, K. The optimization approach of casing gas assisted rod pumping system. In Proceedings of the International Petroleum Technology Conference, Doha, Qatar, 19–22 January 2014. IPTC-17331-MS. [Google Scholar] [CrossRef]
  18. Harms, L.K. Installing Low-Cost, Low-Pressure Wellhead Compression on Tight Lobo Wilcox Wells in South Texas: A Case History. In Proceedings of the SPE Annual Technical Conference and Exhibition, Houston, TX, USA, 26–29 September 2004. SPE 90550. [Google Scholar] [CrossRef]
  19. Sayfullin, I.; Vasyutkin, S.; Ermilov, A. Mobile wellsite compressors: New lease on life for mature gas field. In Proceedings of the SPE Russian Petroleum Technology Conference, Moscow, Russia, 22–24 October 2019; p. 27. [Google Scholar] [CrossRef]
  20. Gabdrkhmanova, K.F.; Izmailova, G.R.; Samigullina, L.Z. Solution of the problem of annular space gas utilization in wells operated by walking-beam pumping unit. IOP Conf. Ser. Earth Environ. Sci. 2020, 459, 042080. [Google Scholar] [CrossRef]
  21. Isaev, A.A.; Malykhin, V.I.; Sharifullin, A.A. Investigation of the oil physical properties and the main indicators of well operation when creating vacuum in a well annulus. Oilfield Eng. 2019, 5, 46–52. [Google Scholar] [CrossRef]
  22. Liu, Y.; Li, Y.; Li, X.; Tang, G. An Approach to Apply the Gas in the Annulus to Assist Pumping Oil in High GOR Wells. In Proceedings of the Society of Petroleum Engineers, Oklahoma City, OK, USA, 31 March–3 April 2007. SPE-107041-MS. [Google Scholar] [CrossRef]
  23. Han, G.; Tan, C.; Li, J.; Pan, Z. Determination of oil well production rate by analysis of the real-time dynamometer card. In Proceedings of the SPE Annual Technical Conference and Exhibition, Dubai, United Arab Emirates, 26–28 September 2016. [Google Scholar] [CrossRef]
  24. Hua, C.; Yin, Y.; Sun, S.; Zhu, H.; Xing, L. Each-Phase Metering with Gas-Liquid Stratified Flow Based on the Multi-Frequency Coriolis Principle. Appl. Sci. 2020, 10, 7747. [Google Scholar] [CrossRef]
  25. Fakher, S.; Khlaifat, A.; Hossain, M.E.; Nameer, H. A comprehensive review of sucker rod pumps’ components, diagnostics, mathematical models, and common failures and mitigations. J. Pet. Explor. Prod. Technol. 2021, 11, 3815–3839. [Google Scholar] [CrossRef]
  26. Palka, K.; Jaroslaw, C. Optimizing downhole fuid production of sucker-rod pumps with variable motor speed. SPE Prod. Oper. 2009, 24, 346–352. [Google Scholar] [CrossRef]
  27. Peng, Y.; Zhang, J.; Xiong, C.; Shi, J.; Zhao, R.; Zhang, X.; Xu, D.; Li, Q.; Deng, F.; Chen, S.; et al. Deep autoencoder-derived features applied in virtual fow metering for sucker-rod pumping wells. In Proceedings of the SPE/IATMI Asia Pacifc Oil & Gas Conference and Exhibition, Bali, Indonesia, 29–31 October 2019. [Google Scholar] [CrossRef]
  28. Ferrigno, E.; El Khouri, D.; Moreno, G. Downhole plunger speed study in sucker rod high GOR and high friction wells. In Proceedings of the SPE Artifcial Lift Conference and Exhibition—Americas, The Woodlands, TX, USA, 28–30 August 2018. [Google Scholar] [CrossRef]
  29. Chen, Z. Predicting sucker-rod pumping systems with fourier series. SPE Prod. Oper. 2018, 33, 928–940. [Google Scholar] [CrossRef]
  30. Valeev, M.D. Method of measuring oil viscosity in a borehole of deep-pumping wells. Oilfield Eng. Oil Transp. 1984, 1, 22–24. [Google Scholar]
  31. Didenko, V.S. Investigation of viscosity of gas-saturated oil emulsions. Oilfield Eng. 1983, 12, 12–14. [Google Scholar]
  32. Medvedev, V.F. The Collection and Preparation of Unstable Emulsions on Fields; Nedra Publishers: Moscow, Russia, 1987; p. 144. [Google Scholar]
Figure 1. A set of equipment for gas extraction from wells (KOGS).
Energies 15 05045 g001
Figure 2. Day 1 graph of load variations on the polished rod after extraction of gas at the well No. 14764d.
Energies 15 05045 g002
Figure 3. Day 2 graph of load variations on the polished rod after extraction of gas at the well No.14764d.
Energies 15 05045 g003
Figure 4. Trends of maximum and minimum loads on the sucker-rod string at the well No. 32554 during the experiment.
Energies 15 05045 g004
Figure 5. Variation trends of maximum and minimum loads on the sucker-rod string during annular gas extraction. (a) at the well No. 14764d; (b) at the well No. 3963.
Energies 15 05045 g005
Figure 6. Variation of viscosity and ARPS content in oil after extraction of annular gas at the well No. 5597d.
Energies 15 05045 g006
Figure 7. Sucker-rod string floating chart after annular gas extraction.
Energies 15 05045 g007
Figure 8. Well performance recovery history after annular gas extraction.
Energies 15 05045 g008
Figure 9. The history of gas impact on the operation of the sucker-rod pump in case of rapid extraction of annular gas.
Energies 15 05045 g009
Figure 10. Plot Map of the well No. 3736 (Bashkirian Stage): The red part of the circle indicates the amount of oil produced, the green part–the amount of water produced and angled lines-water cutting of wells from reservoir pressure maintenance.
Energies 15 05045 g010
Figure 11. Harmonic of the KOGS No.110. The blue lines indicate the bottom hole pressure, the red lines-harmonic of the KOGS operation (the upper peak–the KOGS is waiting for gas collection in the wellbore space, the lower peak–the KOGS starts to work with gas pumping.
Energies 15 05045 g011
Table 1. Correlation of maximum load growth on the rod string with a pump’s type and size and pressure variation in the annular space.
Annular Pressure, MPaN-44N-57N-70
ΔP Max Calc, tΔP Max Fact, tΔP Max Calc, tΔP Max Fact, tΔP Max Calc, tΔP Max Fact, t
1.00.3000.2550.3000.2780.6500.135
2.00.5000.3620.6500.5571.2000.651
3.00.7000.4690.9500.609--
4.00.9000.6021.3000.714--
Table 2. Well parameters before and during implementation of KOGS.
No.NameQfluid,
m3/day
Qoil,
t/day
Hdyn,
m
Pannulus,
MPa
1Average value before implementation10.408.091098.01.57
2Average value after implementation11.108.74980.00.1
3Value difference0.700.65118.01.47
3.1Percentage difference6.37.410.7-
Publisher’s Note: MDPI stays neutral with regard to jurisdictional claims in published maps and institutional affiliations.

