Abstract
In Poland, in 2021, an increase in demand for electricity was recorded, and hard coal and lignite power plants still had a dominant share in its production. Another source of electricity was renewable energy sources (RES), mainly wind farms. Young people in Poland are aware that electricity is not only its production, but also consumption in households. Therefore, it is also essential to properly educate young people, aiming at a cost-effective, sustainable lifestyle, in relation to electricity consumption. The article presents the current state of the electricity generation sector in Poland along with the proposed changes in this respect, in particular in terms of the development prospects for the use of renewable energy sources and the influence of government administration on the production and consumption of electricity. The aim of this research was to broaden the knowledge of young people’s opinions on energy production and consumption. The research results can be used to create long-term directions of energy policy and to build a social attitude of sustainable energy consumption in Poland. The research was non-probabilistic, based on questionnaires, using the CAWI (Computer Assisted Web Interview) technique. The questionnaire was conducted in 2021, and the analysis was made on the basis of 741 correctly completed research questionnaires. The results of the research confirmed the research hypotheses—that the surveyed youth see the need to reduce consumption as a way to counteract climate change and excessive energy consumption. They also expect government support in the energy transformation in Poland, based on a diversified scenario, using both renewable energy sources (RES) and nuclear energy.
1. Introduction
1.1. Energy Consumption in Poland at the Beginning of the 21st Century
In Poland, 173.6 TWh of electricity was produced in 2021 and 174.4 TWh was consumed. At the same time, gross energy demand increased by 5% compared to 2020, while energy production increased by 14%, which is the highest indicator since 1955. These data show that despite a significant increase in energy production, more was used than was produced, which is related to electricity trading. In 2021, electricity trade was mainly related to energy exports to Slovakia (2.7 TWh) and Germany (1.8 TWh), and net imports, mainly from Sweden (3.3 TWh), Ukraine (0.8 TWh), Lithuania (1.0 TWh), and the Czech Republic (0.4 TWh) [1,2].
The year 2020 was specific, i.e., the period of the global COVID-19 pandemic. Production plants, shopping malls, restaurants, and office buildings were closed, which contributed to the reduction of the demand for electricity. This phenomenon was not compensated by the increase in electricity consumption in households. The total electricity consumption in Poland in 2020 was 165,532 GWh, while domestic electricity production was 152,308 GWh. This means that energy consumption exceeded its production by 13,224 GWh. For comparison, the difference in 2019 was 10,624 GWh [2].
It is worth noting that in 2020, i.e., in the year of the COVID-19 pandemic, a record was achieved in terms of the amount of electricity imported by Poland. This amount was as much as 12.5 TWh, which means an increase by 20% compared to 2019. The amount of imported electricity was very important for Polish industry, enterprises, and households, because due to the government’s preference for coal as the main energy raw material, Poles currently pay the most for electricity among all European countries [3]. The highest electricity consumption in Poland in 2020 was in the industrial sector (34.6%), followed by households (18.6%) and the energy sector (15.3%) [4]. In the provinces where the study was conducted, electricity consumption in 2020 accounted for 7.1% of total consumption, in the Lubelskie Province—3.7%, and in the Podkarpackie Province—3.4% [5].
Nowadays, it is very difficult to imagine household prosperity without the use of electricity. All farm equipment requires electricity supply. In Poland in 2020, there were about 38.5 million persons, operating in 14.6 million households, of which 48.6% lived in urban areas, 28.5% in rural areas, and 23.0% in urban-rural communes [4]. On average, there are 2.6 people per household. The average area of a Polish flat was 82.1 m2. A one-person household uses an average of about 900 kWh per year, which gives an average consumption of 75–116 kWh per month. On the other hand, the next person on the farm consumes approximately 500 kWh per year, i.e., 42 kWh per month. The general parameters of electricity consumption indicate a greater consumption of urban rather than rural residents [5,6,7,8,9].
Data from [5] show that 56.9% of households have a gas-electric cooker, and 20.2% have an electric cooker. Poles use electricity to illuminate their homes and for this purpose they buy energy-saving LED bulbs (70% of Polish households do this). According to data [5], the most popular devices among Poles are a TV set, a washing machine, a fridge-freezer, a radio (cassette player, tower), a laptop, a dishwasher, a printer (multifunction), a desktop computer, a home theater, a rotary washing machine, a washer-dryer, and a tumble dryer [10].
Usually, residents, especially young people, are not aware of how much electricity our home appliances consume. Therefore, society should be made aware that the largest consumers of electricity in households are induction hob (748.2 kWh per year), electric oven (496.4 kWh per year), refrigerator (270.0 kWh per year), and electric kettle, dishwasher, computer stationary, vacuum cleaner, washing machine, laptop, TV set, microwave oven, iron, and mobile phone (2.48 kWh per year) [11].
The energy awareness of Poles, in the context of the ongoing discussion on the development strategy of the Polish energy sector, should go beyond the decision-making circle of government institutions, parliamentary, and senate committees [12]. Poles do not expect the government to support coal-based energy, but many believe that coal resources should be used in the energy sector. Research [12] shows that 48% of respondents believe that the state should control the energy market in order to ensure energy security for the society. At the same time, respondents argue that the state should allow private energy producers and suppliers to operate. On the other hand, 33% of respondents to [12] believed that securing energy supplies belongs to the government and that the entire sector should be organized and controlled by the state. Meanwhile, 11% of respondents [12,13] claimed that the state should not, in principle, interfere in the energy market, and energy should be produced and sold by various suppliers [13].
Meanwhile, the results of the study [14] show that Poles are not interested in the energy sector, but at the same time are concerned about the impact of greenhouse gas emissions on the natural environment. Unfortunately, the lack of interest is mainly characteristic of young people, who should think about how the path of economic development and the environment in which they will live, work, and rest will change. The results show that Poles are very sensitive to the price of energy. Many of them choose green technologies, but when there is a need to incur additional costs, they quickly abandon them. Here, there is a great need for education on this subject—efficient use of energy and the growing role of new technologies in the energy sector. Poles, when asked whether they are interested in energy as a branch of the economy, declare that this topic is not of interest to them [13,14]. Among the respondents, 66.5% do not follow current events in the field of energy, only 17.8% expressed their interest, and 15.7% were unable to answer unequivocally [14]. In addition, it is worth noting that the greatest interest in energy (22%) is among people over 60. Unfortunately, this share drops to 10% in the case of respondents up to 29 years of age [13,14]. Poles are sensitive to the price: for most of the respondents, the price is more important than the certainty of supply and the source of energy, but young people more often chose renewable energy sources, even at the cost of a higher price [14].
The results of the research conducted by IBRiS (Institute for Market Research and Social Research—Polish non-governmental organization dealing with market and public opinion research) show that more than half of the respondents (54%) believe that an increase in the price of electricity is inevitable, 46% of respondents say that they can pay more if they invest in green energy, and 41% are willing to pay extra for electricity if it is produced from renewable energy sources [15].
The research results of the Public Opinion Research Center [16] indicate that people aged 18–34 suggest that in 2035, 33% of electricity should be generated from coal, 18.5% from gas, 33.5% from RES, 10.5% from nuclear energy, and 4.5% from other sources. However, in 2050, according to research [16], the structure of energy sources will be as follows: 15.5% from coal, 17% from gas, 47.5% from renewable energy, 16% from nuclear energy, and 4.5% from other sources. It can therefore be seen that young people emphasize the importance of reducing electricity production from coal sources and, increasing, electricity production from renewable energy sources and nuclear energy [16].
Awareness of the correct consumption of electricity, is an extremely important element of modern life. It is not only about financial issues, but also about environmental issues. Young people should be made aware of how to rationally control the amount of energy used.
Almost half of Poles consider themselves to be energy savers [17,18]. Among the ways to save electricity, Poles mainly mention using energy-saving light bulbs (92%), turning off the light outside the house (89%), not putting warm food in the refrigerator, starting the washing machine and dishwasher only when it is full. As many as 92% of respondents [18] declared that they save electricity, and 82% declared that they attach great importance to it. Poles save mainly due to financial reasons (84%), and for as much as 80% the motivation is to care for the natural environment [17]. This is particularly important because in Poland there are approximately 200 million household appliances in use that consume significant amounts of electricity [18].
1.2. World Trends in Energy Production in the 21st Century
The increasing number of inhabitants of the Earth, the rising standard of their lives, which is only slightly in line with the style of minimalism and consumerism, and the style of minimalism of wealth [19,20], force an increasing demand for raw materials and energy. Data from United Nations [21,22] show that the population in 2030 will increase to 8.6 billion, and in 2050 there will already be 9.8 billion people in the world, while in 2100 there will be as many as 11.2 billion. Such an increase in the human population will increase the demand for fuel and energy [23,24]. Growth in energy demand is expected to be greatest in Asia [7]. Other data show that India’s energy demand will increase by 30% by 2040, and the country’s share of global energy consumption will then reach 11% [23,24,25]. Many experts believe that developing countries in Asia account for two-thirds of global growth in energy demand [26]. Much of the demand is also from the Middle East, Africa, and Latin America [25].
In Poland, a decline in the human population is expected in the coming years. In 2050, the number of people residing in Poland, i.e., people staying in our country for at least 12 months, will amount to 34 million, 856 thousand [24,27,28]. After 2030, in each five-year period, a decrease in the number of Poles is expected by over 500,000, with the highest losses expected in the years 2035–2045. During these 10 years, therefore, a decrease in the number of inhabitants of Poland by 1.24 million is forecast [24]. Taking into account the above fact, and at the same time the continuous development of the country in order to achieve a standard of living in Poland similar to that of the richest countries [29], the demand for primary energy will continue to grow. On the other hand, in recent years in many developed countries, the phenomenon of further development has been observed with the simultaneous maintenance of the constant level of energy consumption or even its decrease [24,29]. It is related to the increase in the efficiency of energy use [30]. This direction of development in the energy industry is currently the most probable [26,27].
The structure of fuel demand is also likely to change in the future [31]. Coal will be less and less important, while the importance of renewable energy sources (RES) will increase [32]. It is predicted that RES will cover 40% of the increase in primary energy demand, and by 2040, RES will account for 80% of new capacity in the European Union (EU), while the production of electricity after 2030 in the EU will come mainly from wind [30]. On the other hand, in other regions of the world, distributed generation will be developed, based on photovoltaic systems installed in households and enterprises [25,27].
For several years, the consumption of coal has been decreasing in the world, which is caused by concerns for the protection of the environment. In order to transform its economy into a resource-efficient and competitive economy, the European Union has introduced the European Green Deal, which will help to achieve zero greenhouse gas emissions by 2050 net and decoupling economic growth from resource consumption [33,34]. On the other hand, the importance of natural gas as a fuel, that is much less harmful to the environment, is growing. Crude oil has been the main fossil fuel for years, and its share in energy consumption, the primary one, is currently the largest [35]. However, it is predicted that the strong development of electromobility will also result in a decrease in demand for oil in future petroleum [24,25,31,32].
Depending on the scenario for the development of energy in the world [4], the consumption of coal will be diverse over the coming years and will depend on the direction of changes in the Global Energy Policy [24]. If the current policy of obtaining and using fuels and energy is continued (the Carrent Policies of Energy scenario), the demand for coal will continue to increase, and in 2040 it will exceed 7000 million tones [21,24,25]. In the case of the “New Policies of Energy” scenario, the demand for coal will only slightly increase, compared to 2016 [31]. In Poland, the share of coal in the consumption structure of primary energy carriers will depend primarily on the prices of CO2 emission allowances, coal supply capacity, and the development of the domestic gas sector [36]. Especially high prices of CO2 emission allowances have the greatest impact on the costs of electricity generation in our country and may displace coal from the fuel structure of Poland [37].
Until 2025, changes in oil demand will depend on the currently implemented fuel efficiency policy for vehicles [30,31,32]. It is forecasted that only after 2025 will the demand for crude oil start to decline [24]. The “New Policies of Energy” scenario is characterized by a steady upward trend in crude oil prices by 2025 [21,22]. On the other hand, the “Sustainable Development Policies of Energy” scenario assumes that the demand for crude oil will remain at almost the same level, as it is today (a decrease of only 1.0 million barrel/day), but after 2025 the decrease in consumption of this primary raw material will be sharp, similar to coal, and in 2040, the demand for crude oil will amount to 25.9 million barrel/day, which means a 36.4% decrease [24,25,26].
By 2040, the demand for gas will increase by 45%. Industry [24,36,37] will have a very large share in this growth. In a dozen or so years, the share of gas in the energy sector will also increase due to the declining importance of coal in this sector [37]. Gas and renewable energy sources (RES) will be able to take its place [38,39,40]. Only the “Sustainable Development Policies of Energy” scenario predicts a decrease in gas consumption, but the decrease is very slow, as gas, as a cleaner source of energy, will replace coal withdrawn from the power industry [31,32]. The forecasted demand for natural gas in Poland, according to the Polish Energy Policy, still in force until 2030 [29,36,37], provides for a systematic increase in gas consumption until 2030.
The increase in the share of renewable energy sources (RES) will be observed not only in the power industry, but also in the heating sector and in transport sector, where its share will double. China will be the leader in the development of renewable energy sources, followed by the United States, the European Union, and India [41]. In the “Sustainable Development Policies of Energy” scenario, a coordinated implementation of energy efficiency and renewable energy sources is forecast [24,35]. Such actions are necessary in order to reduce greenhouse gas emissions. These measures are expected to reduce 40% of emissions [34]. It is estimated, that by 2030, electricity generated from wind and sun will jointly account for the largest share of electricity production in the world [29,30]. Technological improvements and reduction of production costs have made renewable energy sources, especially wind and photovoltaic energy, a very fashionable and dynamic industry in the world [23,24,25,38].
Due to limited energy resources and the consequences of climate change, the unlimited increase in energy demand and consumption is unsustainable in the long run. A profound energy transformation seems inevitable. Four scenarios have been presented in the development of the Polish energy sector until 2050 [39,40]:
- Coal scenario—based mainly on coal, it assumes the construction of new hard and brown coal mines, with the share of RES in 2050, amounting to 17%.
- Diversified scenario with nuclear power emphasizes a balanced mix of energy technologies exclusively from nuclear power, instead of lignite power plants. The share of renewable energy sources in this scenario by 2050 would be 38%, and CO2 emissions, in relation to the coal scenario, would be 69% reduced.
- Diversified scenario without nuclear power. Similar to the previous one, but replacing energy production in nuclear energy with increased production from natural gas and RES, the share of which is 50%, and CO2 emissions are 70% reduced, compared to the coal scenario.
- Renewable scenario. Gradual phase-out of coal-based energy, the share of energy from renewable sources increases to 73%, and the emission of CO2 is the lowest, representing 60% reduction in relation to the coal-based scenario.
Thus, the structure of both obtaining and consumption of primary energy is changing, although the demand for it is constantly growing [41,42,43]. Moreover, the share of coal in the global primary energy consumption will probably decrease in the coming years [22,31,36], and the share of gas will increase [24]. Gas is also a fossil fuel but burning it does not cause such harmful environmental effects as coal [24]. In the coming years, crude oil will still be the dominant energy raw material, but the developing market of electric cars [35] will result in a gradual withdrawal from the use of internal combustion engines and thus the demand for this primary fuel will decrease [29,30,31,32]. It should be noted that the global consumption of renewable energy sources is steadily increasing, and this trend is likely to continue and gain momentum [22,34,35].
2. Research Methodology
The climate policy of the European Union [34,35] poses serious and long-term challenges for the Member States. The European Green Deal will require significant changes, including economic ones, which are expected to lead to net zero emission in 2050 [33]. Young people, currently entering the labor market, choose a specific path of creating the quality of life [19,20]. Their social attitude, the level of consumption, the perception of energy sources, and climate change, as well as their lifestyle, will be key in implementing the current strategic directions for the next 30 years. Hence the research problem concerning the perception of the production and consumption of electricity by young people in south-eastern Poland.
The aim of this research was to broaden the knowledge of young people’s opinions on energy production and consumption. The results of the research can be used to create long-term directions of energy policy, and to build a social attitude of sustainable energy consumption. The following research questions were asked in the paper:
- Do young people want to reduce the consumption of raw materials and energy?
- What do young people think about global climate change?
- What directions of the energy policy are expected by young people?
- Does the perception of the production and consumption of electricity depend on the sex of young people?
In the context of the questions presented, the following research hypotheses were formulated:
- Reducing consumption is seen as a way to combat climate change and excessive energy consumption.
- Young people consider climate change to be one of the main contemporary problems resulting from human activity.
- Young people prefer renewable energy sources.
- Young people expect government support in the energy transformation.
- The perception of climate problems and the prospects for the production and consumption of electricity depends on the sex of the person.
The study was targeted at young adults. As the statistical studies assume young people are aged 15–24, and then 25–34 years old, this research focuses on younger but adult youth, i.e., people who have reached 18 years of age. These people already have full civil rights in Poland, so they can decide on the direction of the state’s development, inter alia, through democratic elections [42]. Today’s youth generation is the most numerous in human history, with 1.8 billion young people living on our planet, with around 85% of these people living in emerging and developing economies, or in fragile states [10]. In Poland, there are 14,212,400 young people aged 18–34, which accounts for 3.7% of the population [7,8]. The study was conducted in south-eastern Poland, in the Podkarpackie and Lubelskie voivodships. As the subject of the research was the social perception of issues affecting the quality of the natural environment, the area of south-eastern Poland was selected. This area is characterized by a high quality of the natural environment, high forest cover, higher than the national average, agricultural character of the region, and a lower average monthly salary, in comparison with whole the country. Among the 16 voivodships in Poland, the Podkarpackie Voivodship was on the 15th place, and the Lubelskie Voivodship on the 12th place [7].
The study was cross-sectional and all characteristics were examined at the same time, so additional attention may need to be paid to other aspects. As a result, future studies should concentrate on this perspective by designing longitudinal data to obtain more accurate and quantifiable results. The study was partial, it was not probabilistic. It was carried out using the diagnostic survey method, the CAWI (Computer Assisted Web Interview) technique was used. The study was conducted between 24 May and 30 June 2021.
Sample selection was random and non-probabilistic. Initially, access to the questionnaire form was given to several dozen people in both voivodships, who invited subsequent respondents to the survey. 816 questionnaires were collected, of which 741 were honestly completed, meeting the research assumptions for the age of respondents and the area of residence. This means that 9.19% of the collected questionnaires were rejected as unreliable.
The research tool was a questionnaire form containing a number of survey thesis formulations assessed by the respondents in terms of compliance with their beliefs. The correctness of the form has been verified by conducting pilot studies.
The assessment was carried out using a five-point, bipolar Likert scale with a neutral value [44,45]. The values on the scale are marked as follows: 1—definitely not; 2—probably not; 3—neither yes nor no; 4—probably yes; 5—definitely yes.
The survey theses have been numbered, which were used in the part of the analysis of the results. The content of the analyzed survey theses was as follows:
1. Support for restriction of consumption; 2. Depopulation as a mechanism of reducing anthropopressure; 3. Recognition of climate change as the main problem of modern civilization; 4. Anthropopression is the main cause of climate change; 5. Climate change is mainly a business of specific interest groups; 6. The reduction of CO2 emissions is necessary; 7. Global warming is a natural process; 8. The European Union’s climate policy brings climate benefits; 9. The climate policy of the European Union is a tool of the economic game; 10. Renewable energy sources (RES) will cover the growing energy demand; 11. RES have strong institutional support and they threaten coal-based energy; 12. Renewable energy is expensive; 13. RES are an unstable source of energy; 14. RES provide new jobs; 15. RES, like conventional energy sources, damage the environment; 16. Wind farms have a negative impact on the environment; 17. RES are causing global warming; 18. In the near future, renewable energy sources will replace conventional energy sources; 19. Internal combustion engines will be phased out by 2050; 20. Tendency to participate in the costs of reducing CO2 emissions; 21. No tendency to take stocks; 22. Searching for products with ecological certificates; 23. Conviction about the high quality of traditional products; 24. Concerns about genetically modified food; 25 Willingness to pay more for organic food; 26. Expectation of government support for increasing the share of renewable energy sources; 27. Expectation of government support for increasing the energy efficiency of sold devices; 28. Expecting the government to create tax breaks for thermal modernization; 29. Expect government support for energy conservation.
Statistical analyses [44,46,47,48] of the collected material were performed using the Statistica program. In order to detect clusters in the collected data, an agglomeration cluster analysis [46,47] was performed. It allows to detect connections between data by separating clusters in such a way that the degree of connection of objects in a given group is as high as possible, and with objects from other groups as small as possible.
Ward’s method was used to perform the cluster analysis. It is an effective method of detecting relationships between objects. This method uses an analysis of variance approach to estimate the distance between clusters. The algorithm aims to minimize the sum of squares of deviations of any two clusters that can be formed at each stage of the linkage [46,47].
The basic descriptive statistics were also calculated, the structure of the scores for survey theses was analyzed, the mean scores and standard deviations were calculated, and the Pearson correlation analysis between the selected scores was calculated. Chi-Square was also calculated in search of differences between the groups according to the sex of the respondents [48].
3. Results
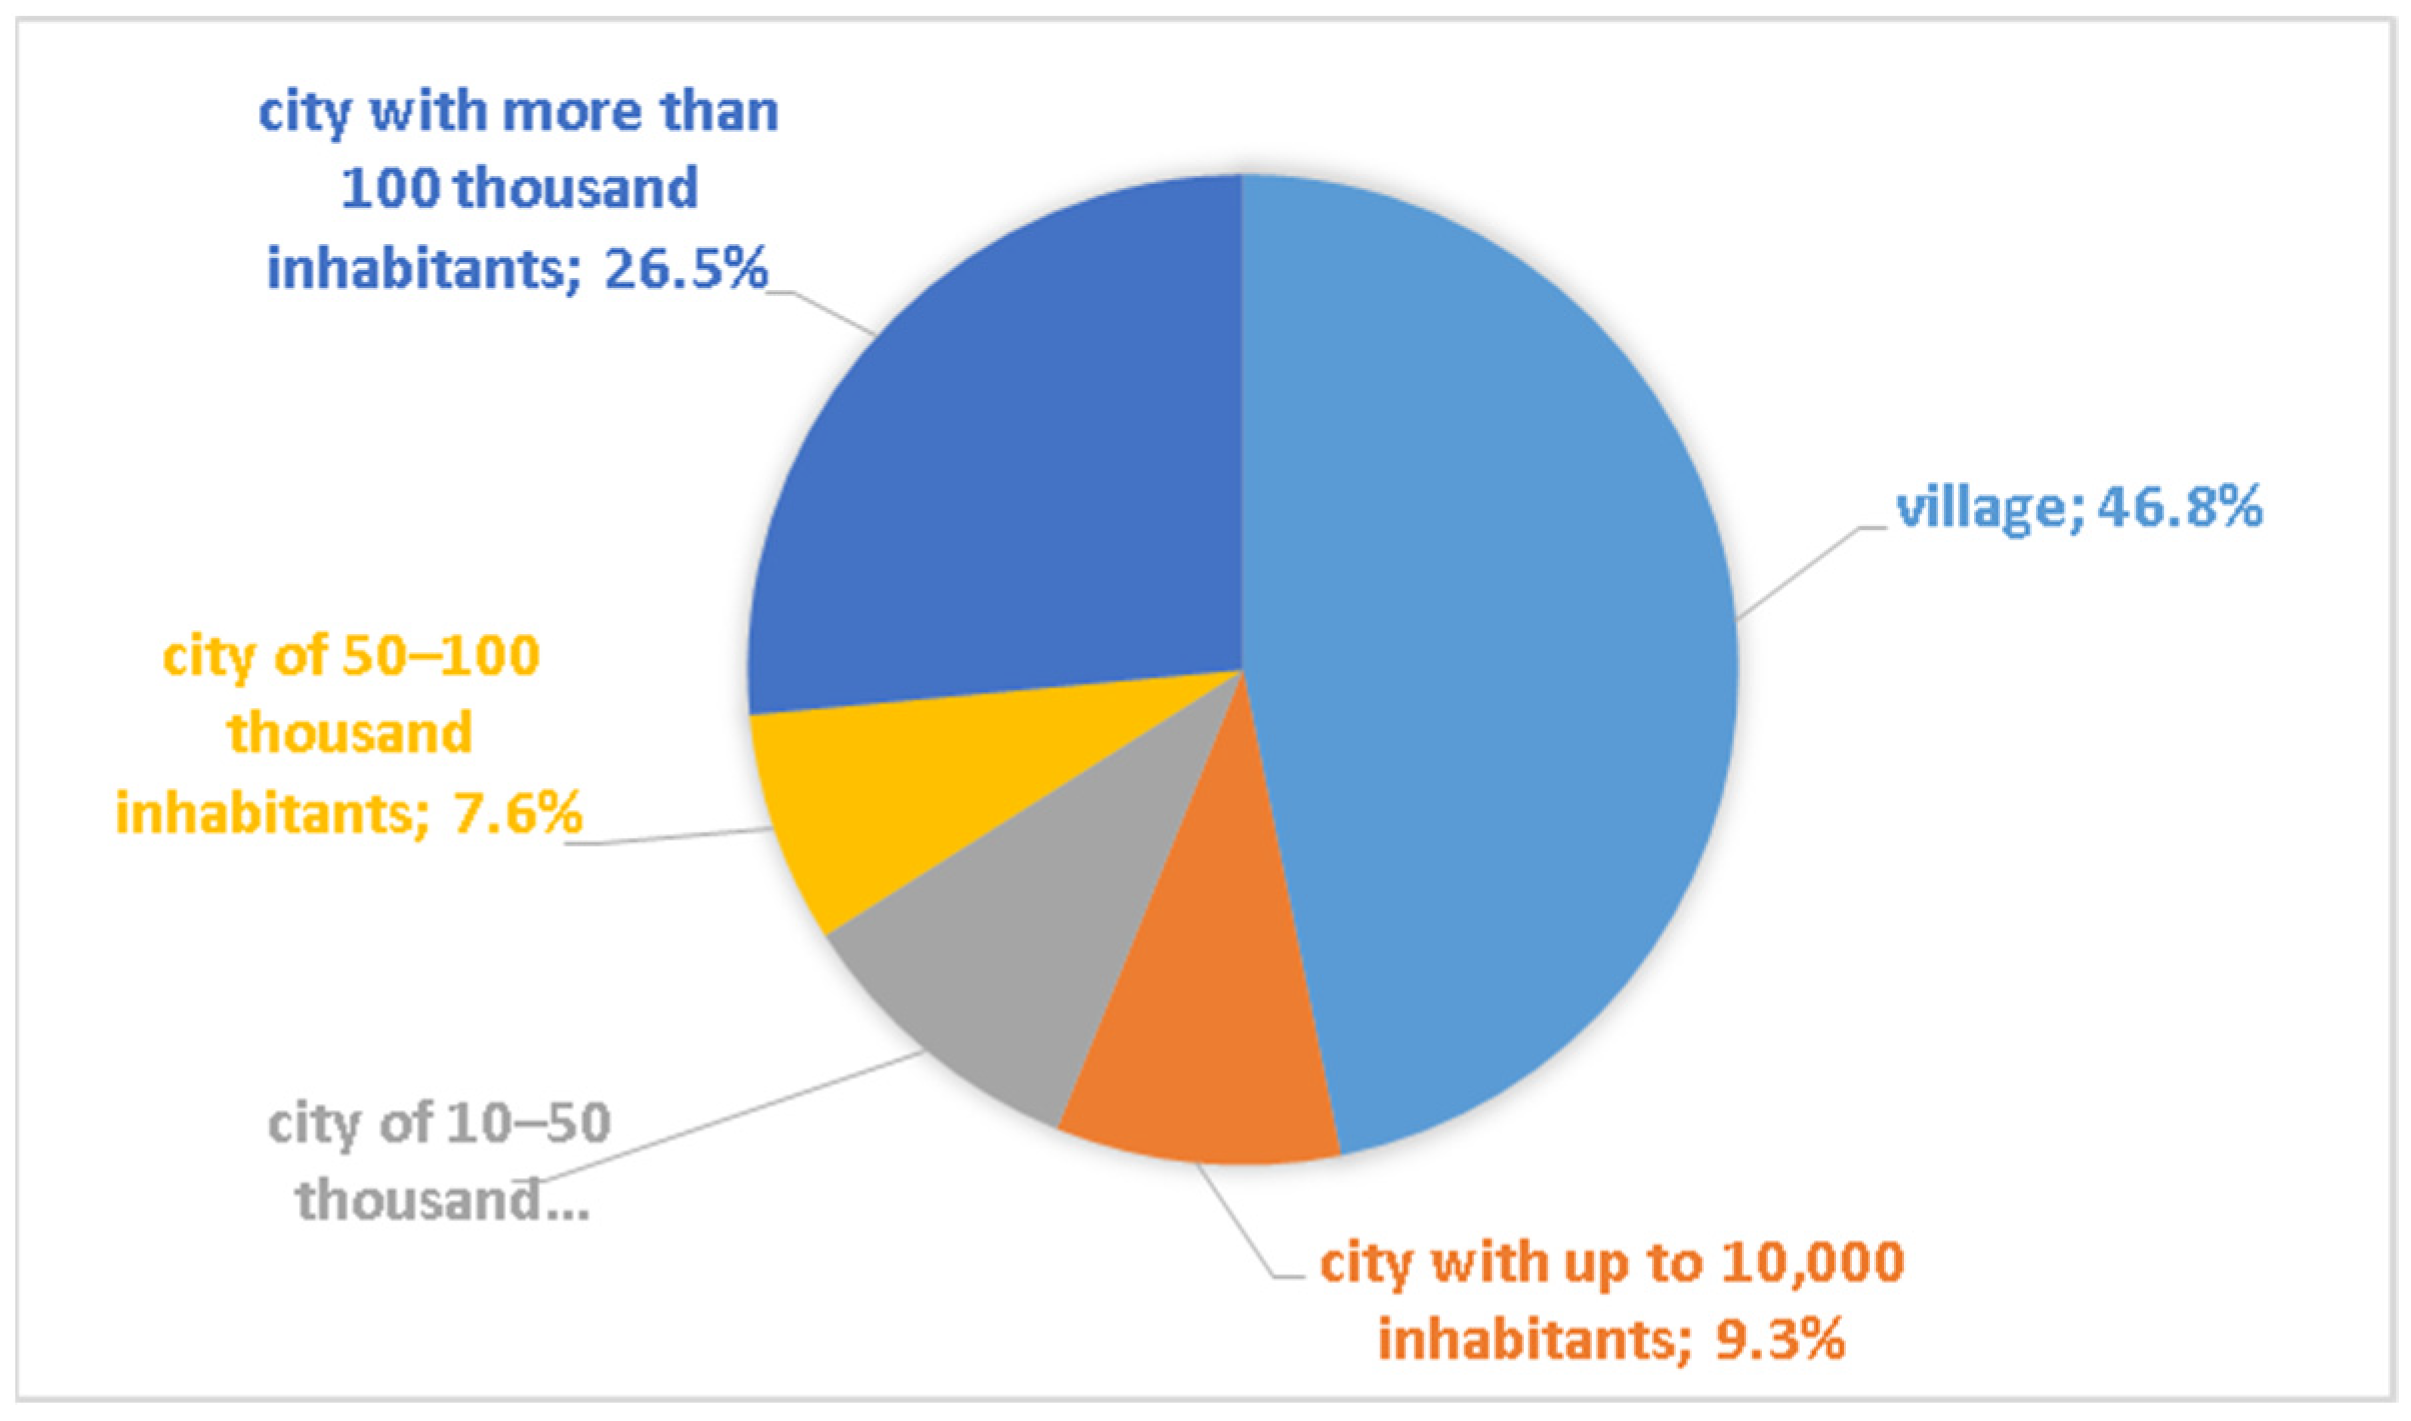
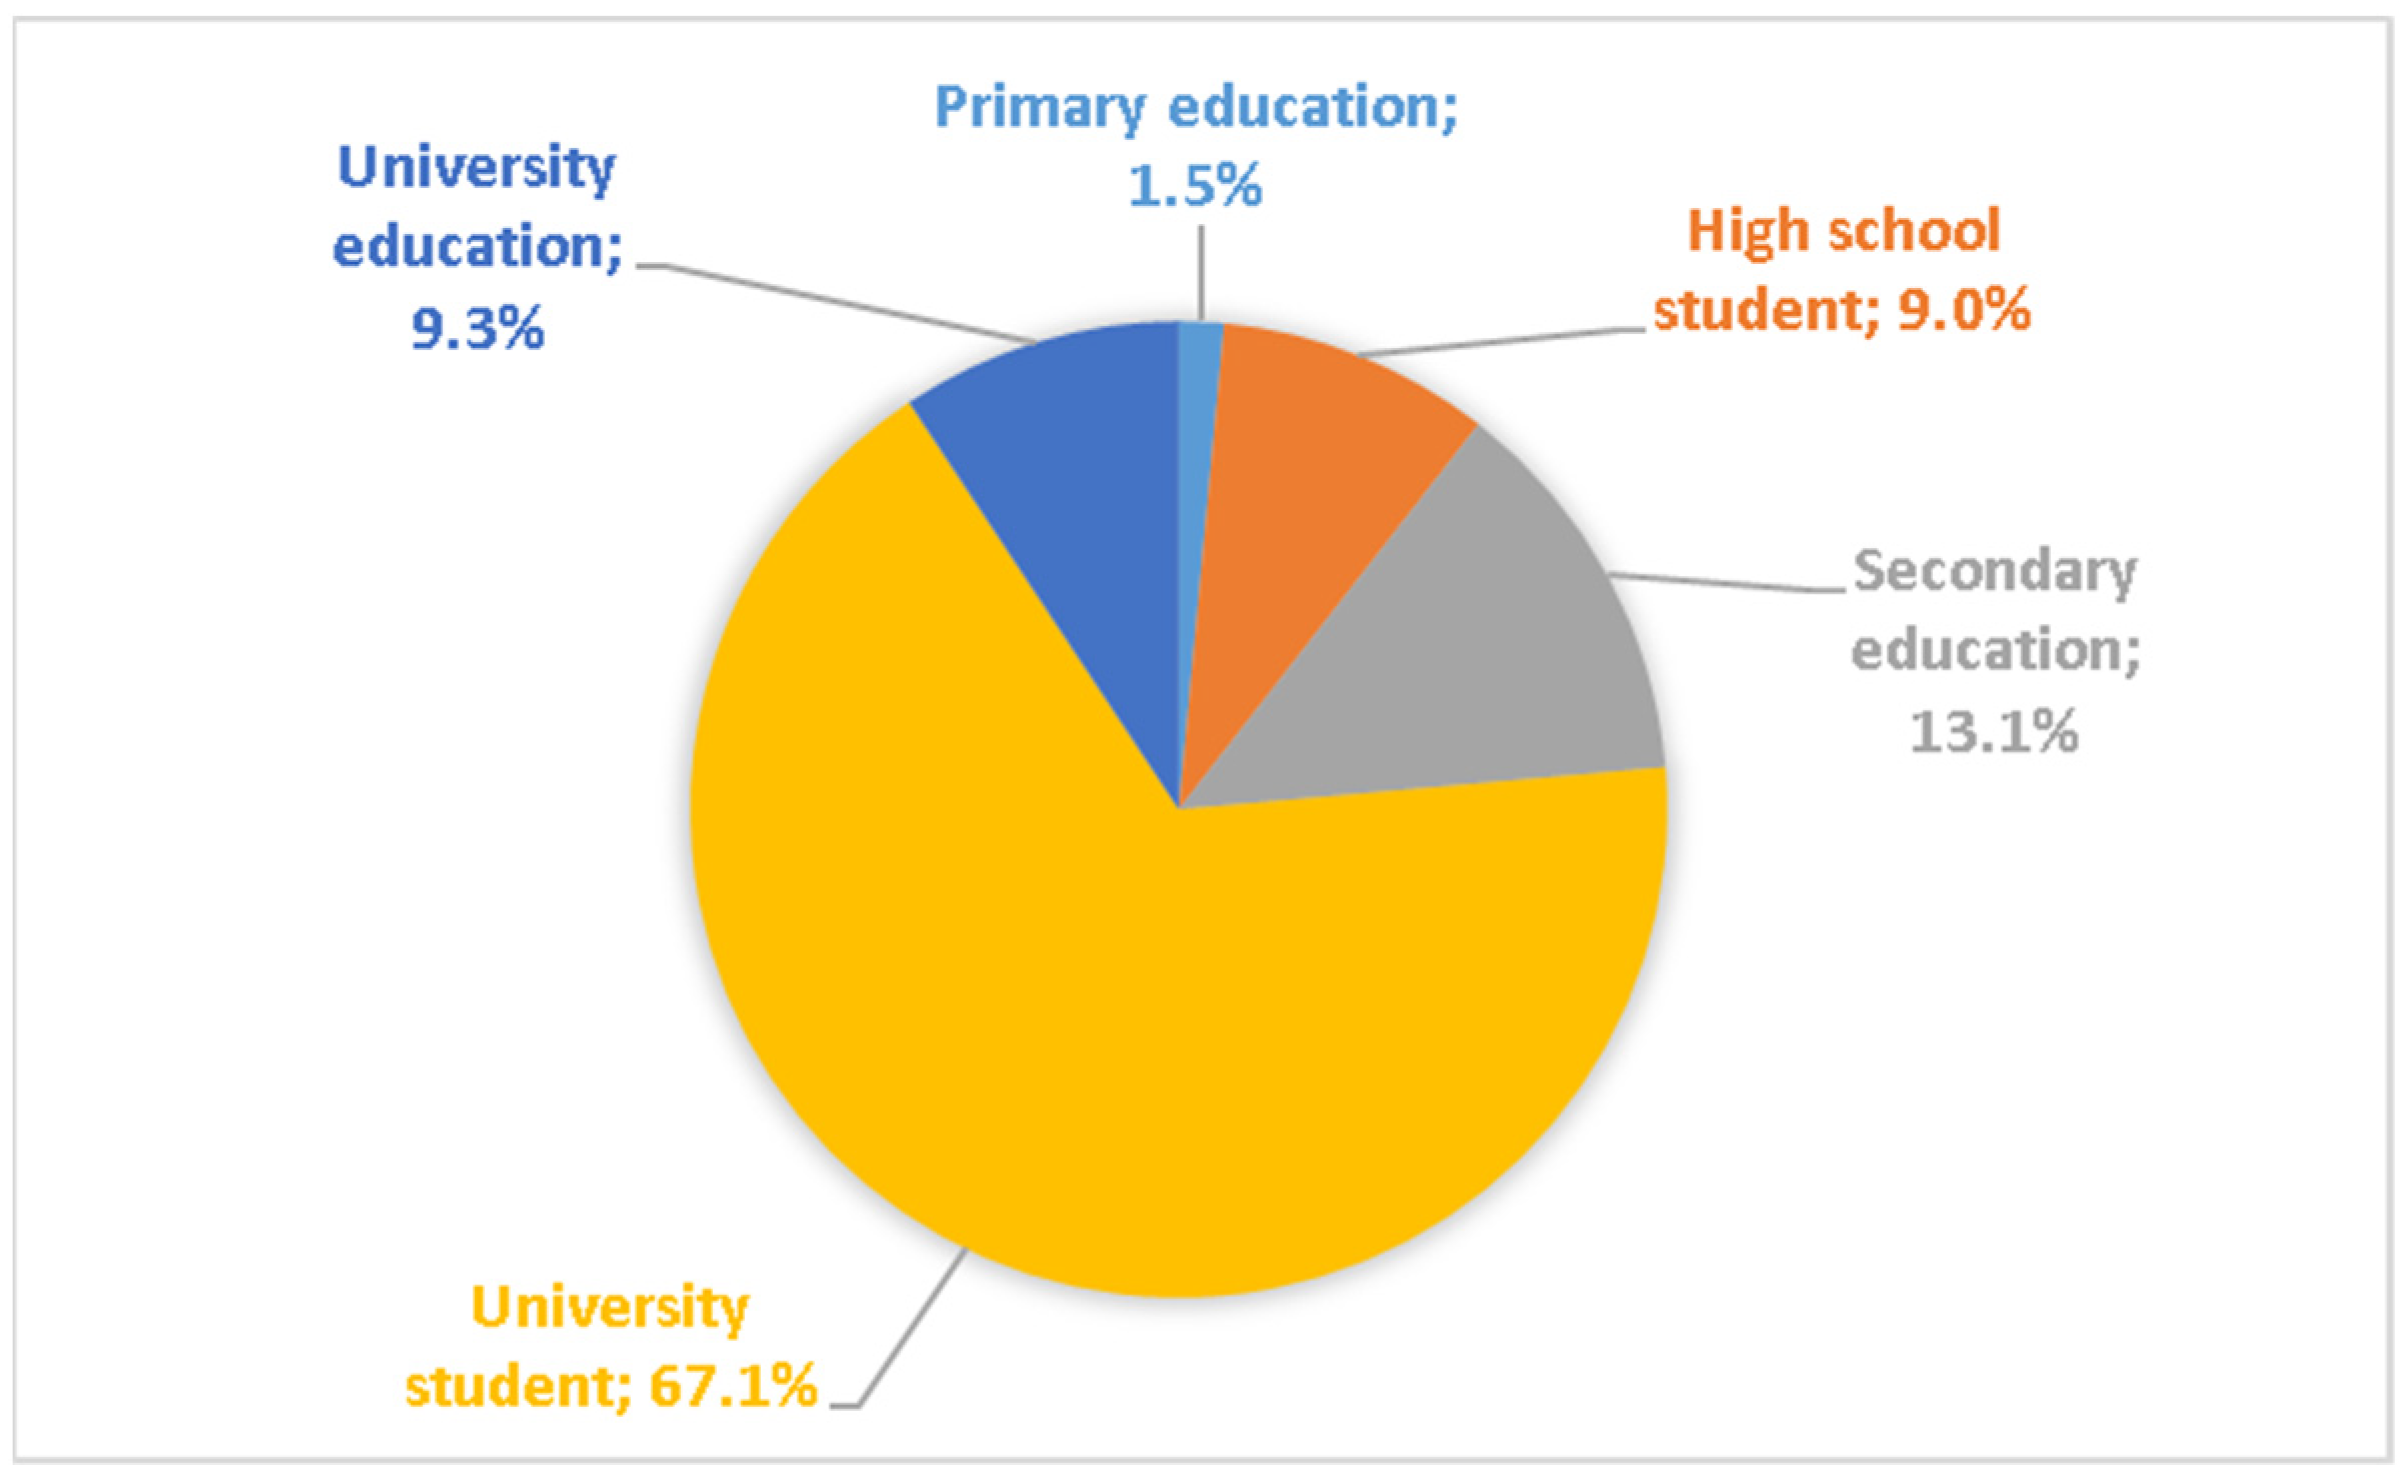
The studied group of inhabitants of south-eastern Poland were people aged 18 to 24, the average age was 20.7 years, the middle value (median), Me = 20, was also the most common value (Mo). In the sex structure of the respondents, women constituted 59.1%, and men 40.9%. Figure 1 shows the structure of respondents by place of residence and Figure 2 by level of education. As can be seen from the data presented in Figure 1, the majority of respondents were city dwellers, the largest group being city dwellers over 100,000. It should be added that there are two such cities in the study area, Lublin and Rzeszów. Rural residents accounted for 46.8% of the respondents. Among the respondents, the most numerous group (67.1%) were university students (Figure 2).
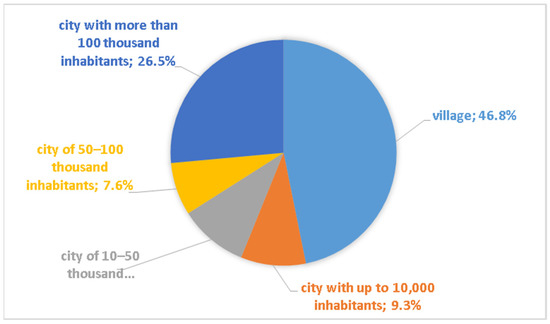
Figure 1.
Structure of respondents divided by place of residence.

Figure 2.
Structure of respondents divided by level of education.
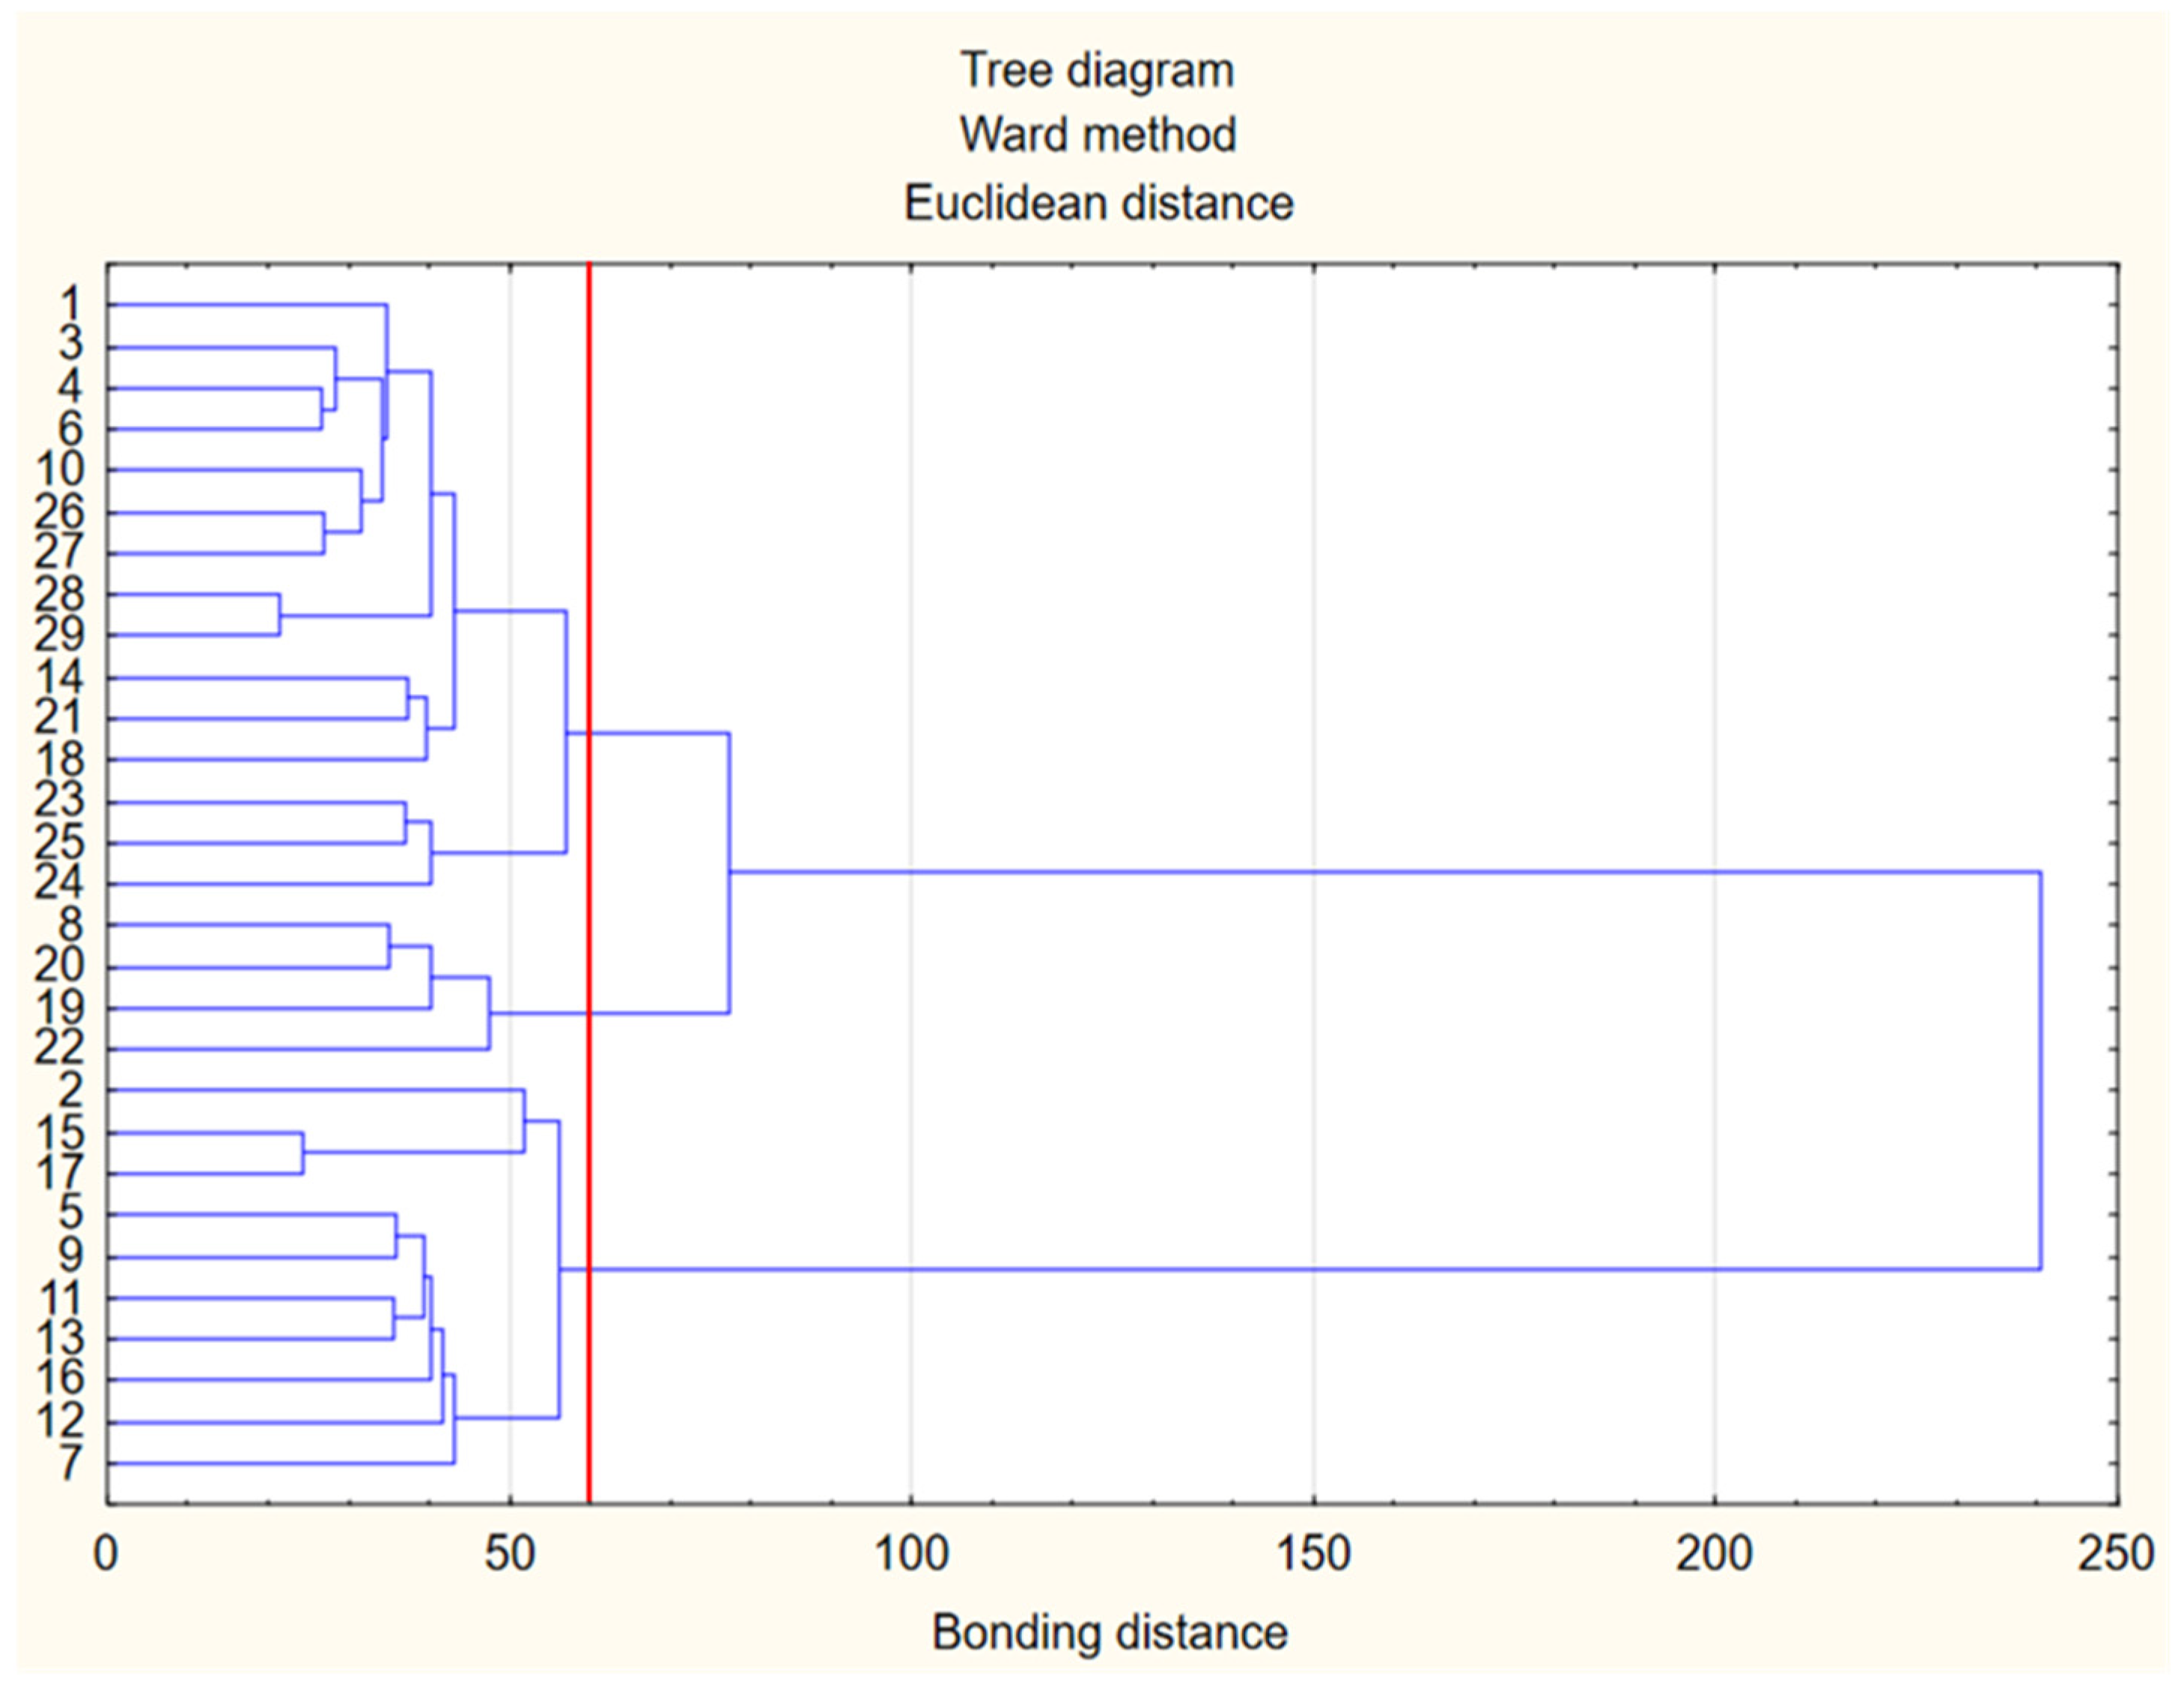
Figure 3 shows the results of the analysis of clustering of survey theses using the Ward’s method, while the descriptions of survey theses are presented in Table 1. The data in Table 1 contain the percentage structure of survey theses ratings, the mean of these ratings, and the standard deviation. The survey theses in Table 1 are ranked according to the results of the cluster analysis. The analysis of the clusters in the “binding distance to the binding stages” part showed an increase in the distance above y = 58. This value is the cut-off point of the dendrogram, which allowed for the separation of three clusters.
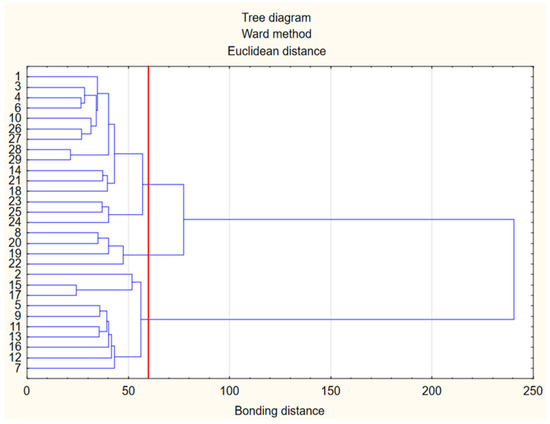
Figure 3.
Cluster analysis dendrogram. Descriptions of survey theses included in Table 1.

Table 1.
The structure of assessments of survey theses, as well as assessment mean and standard deviation.
The first agglomeration was the most numerous. It included survey theses concerning beliefs regarding climate change, directions of government support, and elements of perceiving the quality of consumed food.
At the initial stages of the agglomeration, survey theses 28 and 29, as well as 26 and 27, were related to the expectations regarding government support for measures aimed at respecting and saving energy, and these survey theses were related to the belief that the growing energy demand could be covered with production from renewable sources (survey thesis 10). Strong support prevailed in the structure of assessments of these five survey theses (Table 1).
Another branch in the first agglomeration was the concentration of survey theses relating to people’s actions related to climate change (survey theses 4 and 6), the high threat associated with climate change (survey thesis 3) and the need to limit consumption (survey thesis 1). It is worth emphasizing that the structure of the assessments was dominated by strong support for anthropogenic causes of climate change and the serious threat associated with this problem. However, the need to reduce consumption and CO2 emissions was most often assessed at the level of moderate support. Another group of clusters, related to the above-mentioned ones, was linked by survey theses 14, 21, 18, relating to the perception of renewable energy perspectives and purchasing behavior. On the other hand, this focus was related to the next one, which included the respondents’ attitude to high-quality food (survey theses 23, 25, and 24).
The second cluster included survey theses relating to the effectiveness of the European Union’s activities in reducing greenhouse gas emissions (survey thesis 8). The most numerous group of respondents (41.4%) assessed these activities as neutral, “neither yes nor no”. Over half (55.1%) of the respondents declared their readiness to bear the costs of the climate policy, of which 62.5% moderately (34.4% of all respondents). This cluster also included survey theses concerning the prospects of the automotive industry (survey thesis 19) and the consumers’ search for quality markings and certificates (survey thesis 22). In this case, 41.4% of the respondents did not confirm such a procedure.
The last cluster included survey theses that undermine the sense of the European Union’s climate policy, pointing to the disadvantages of renewable energy and climate policy motivations. It is worth noting that most of the survey theses in this cluster were assessed negatively. Almost 70% of negative assessments were recorded in relation to survey theses 15 and 17, equating the negative impact of renewable energy sources with fossil energy sources. These survey theses were directly related to the statement about the necessity of human depopulation (survey thesis 2), negatively assessed by 53.2% of the respondents. The survey theses relating to the economic motivations of the climate policy (survey theses 5 and 9) were mostly neutral, which proves that their views are not decisive. The next group in this agglomeration were (survey thesis 11) concerning the introduction of RES by force and (survey thesis 13) related to the instability of RES. Regarding this (survey thesis 13), the least numerous were extreme answers, which proves the lack of conviction regarding the issue under study. A total of 39.7% denied this survey thesis, which, in the context of variable renewable energy sources, proves a false perception of renewable energy among the respondents.
Both the survey thesis concerning the negative impact of wind farms (survey these 16) and the survey thesis related to the cyclical nature of climate change (survey thesis 7), apart from the neutral assessments, were mostly negatively assessed. However, survey thesis 12, relating to the high costs of renewable energy sources, was positively assessed by 42.5% of the respondents.
The discussed cluster analysis (Figure 3), together with the structure of assessments of survey theses (Table 1), indicate an unambiguously positive perception of renewable energy sources in the studied group of people. It can be concluded that the sensitivity of young respondents is shaped in an environmentally friendly manner, in line with the main directions outlined by the European Commission.
Table 2 presents the results of the Pearson correlation analysis between the assessments of survey theses diagnosing concern for the climate and other studied issues, which included: perception of renewable energy sources, respondents’ expectations regarding government support in the area of energy conservation, as well as consumer behavior of the respondents. It should be emphasized that the conducted analysis shows relationships that do not necessarily have cause-and-effect relationships. However, with regard to the beliefs of the respondents, one can look for a logical coherence.
Table 2.
Pearson’s correlation coefficients between the assessments of survey theses climate concern and the perception of renewable energy sources, expectations towards government institutions, and consumer behavior.
In the conducted analysis, most of the calculated correlation coefficients were statistically significant. In Table 2, they are marked with an asterisk. The assessment of survey thesis 1, relating to the reduction of consumption, was significantly positively correlated with rational purchasing behavior (survey theses 21–23 and 25) and the expectation of government support for actions limiting energy consumption (survey theses 26–29). High ratings for this survey thesis were related to the lack of support for survey theses pointing to the negatives of RES (survey theses 11, 15, 17). These calculations show the respondents’ understanding of the need to limit consumption to save the climate. On the other hand, the postulate of human depopulation, due to the lack of resources, had positive, significant correlation coefficients with prospective activities regarding RES and electromobility (survey theses 18 and 19), as well as readiness to bear the costs of climate policy (survey thesis 20) and the search for certified products (survey thesis 22). This proves that people agreeing to depopulation show confidence in formal system solutions. It is worth emphasizing that only 23.3% of the respondents expressed a positive opinion on depopulation.
Assessments of the survey thesis pointing to climate change as the main problem of humanity (survey thesis 3) and the anthropogenic causes of these changes (survey thesis 4) had negative, significant correlation coefficients with the survey theses depreciating RES (survey theses 11–13 and 15–17). On the other hand, positive correlations were calculated with the positive role of renewable energy sources in climate protection (survey theses 10, 14, 18–20), the lack of willingness to stockpile (survey thesis 21), the search for certified products (survey thesis 22), and the expectation of government support for energy conservation (survey theses 26–29). Similar relationships were calculated for the assessment of survey thesis 6, relating to the need to reduce CO2 emissions.
Assessments of statements depreciating the threat attributed to climate change (survey theses 5 and 7) had positive significant correlation coefficients with survey theses pejoratively related to RES (11–13,15–17) and government support for energy conservation (survey theses 26–29). This proves that people who do not see the problem of climate change do not see the need to develop renewable energy and support energy saving with public money.
Survey theses 8 and 9 related to the assessment of the European Union’s climate policy and were formulated on the contrary. Survey thesis 8 pointed to the positive effect of legal regulations, and survey thesis 9 questioned the positive impact. This was reflected in the results of the correlation analysis, as the obtained coefficients indicate opposite relationships. Higher ratings of the EU policy (survey thesis 8) were negatively correlated with a negative attitude towards RES (survey theses 11, 13, 15, 17), and at the same time positively correlated with the expectations of government support in saving energy. On the other hand, the assessment of the wording indicating the EU policy as an element of the economic game (survey thesis 9) was positively correlated with a negative attitude towards RES, and at the same time negatively correlated with co-financing energy saving. It can therefore be concluded that the views of the respondents were coherent, people noticing the problem in climate change, trusted the Community policy, expected government support in energy conservation and declared readiness to bear the costs of climate policy. At the same time, people treating climate policy as a form of an economic game, not treating climate change as the main problem of today, were more skeptical about renewable energy sources, government and EU actions, and did not declare their readiness to bear the costs of climate policy. However, it is worth referring these results to Table 1, which shows that the majority of respondents belong to the group of people concerned with climate change.
Survey theses 27 to 29 were formulated to identify the expectations of young people regarding energy consumption and governmental activities supporting energy efficiency. The correlation coefficients of the assessments of these survey theses were positive, statistically significant with the assessments of pro-ecological survey theses. These included: the survey thesis concerning the need to reduce consumption (survey thesis 1), the survey thesis that appreciates the importance of the problem of climate change (survey thesis 3), the survey thesis pointing to anthropogenic causes of climate warming (survey thesis 4), the survey thesis pointing to the need to reduce CO2 emissions (survey thesis 6) and the survey thesis appreciating the EU climate policy (survey thesis 8). It is worth emphasizing the negative correlations of survey theses 26–29 with survey theses that depreciate the importance of the problem of climate change (survey theses 5 and 7) and the lack of positive effects of the EU climate policy.
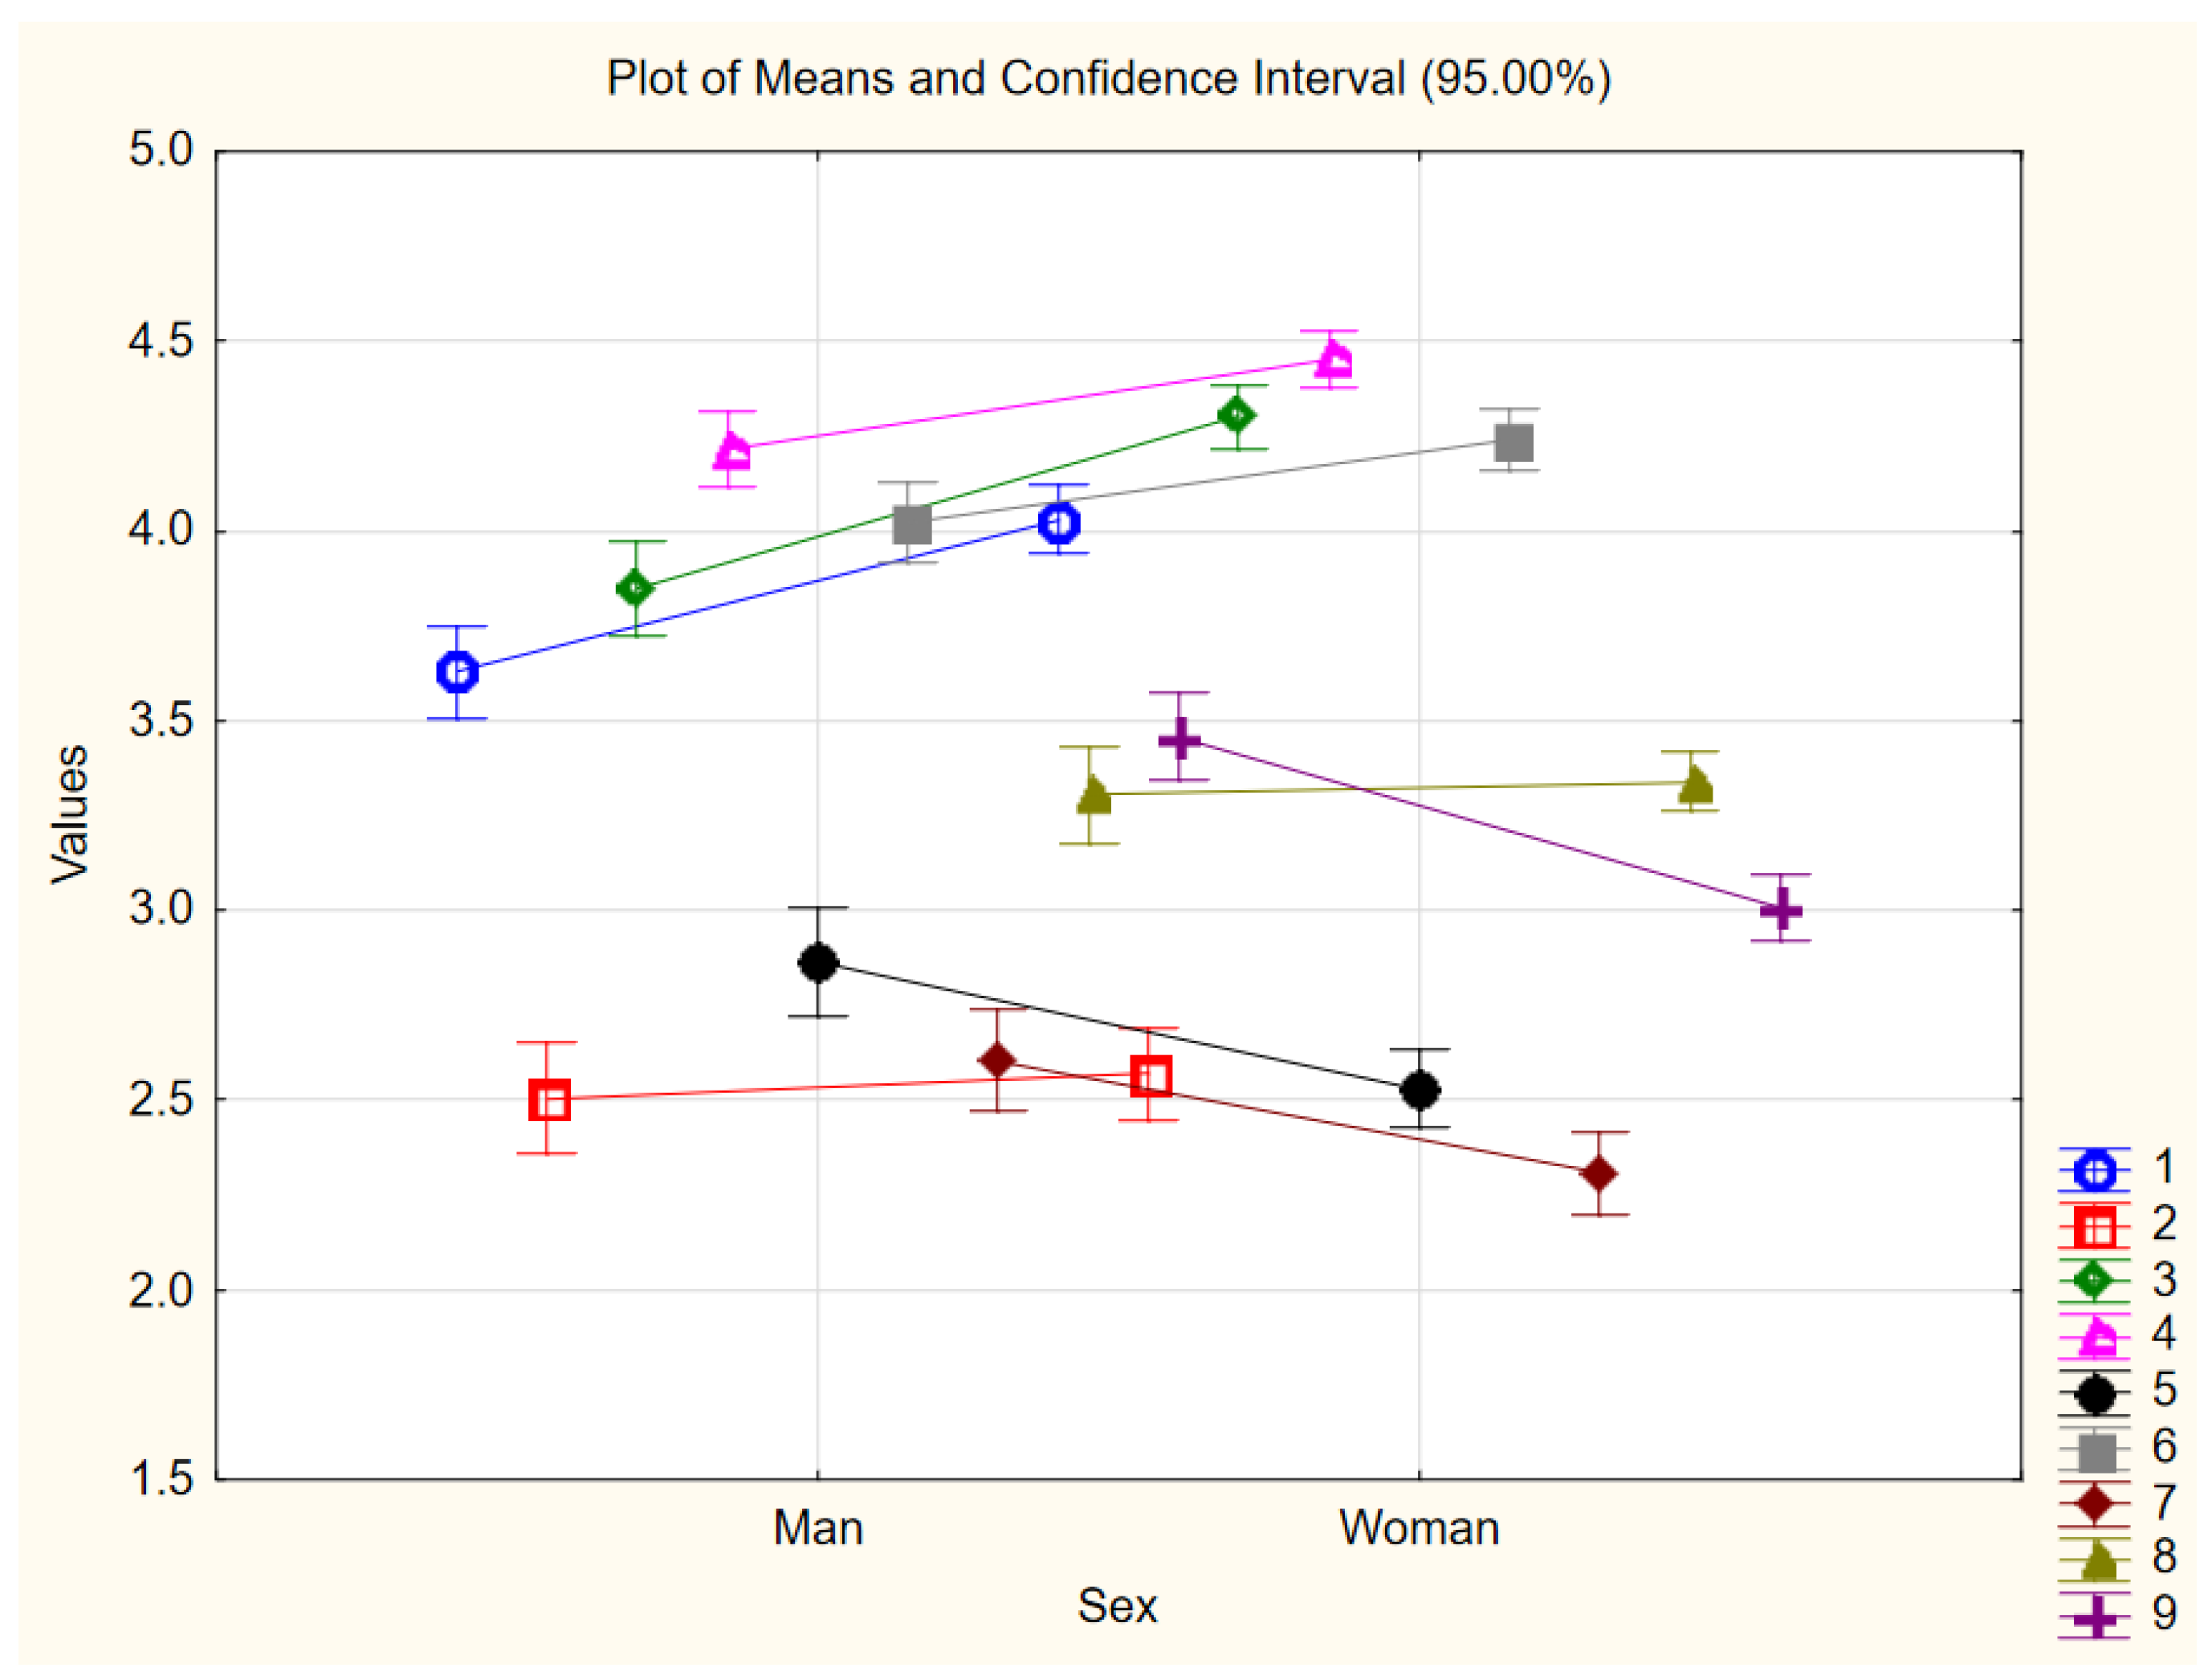
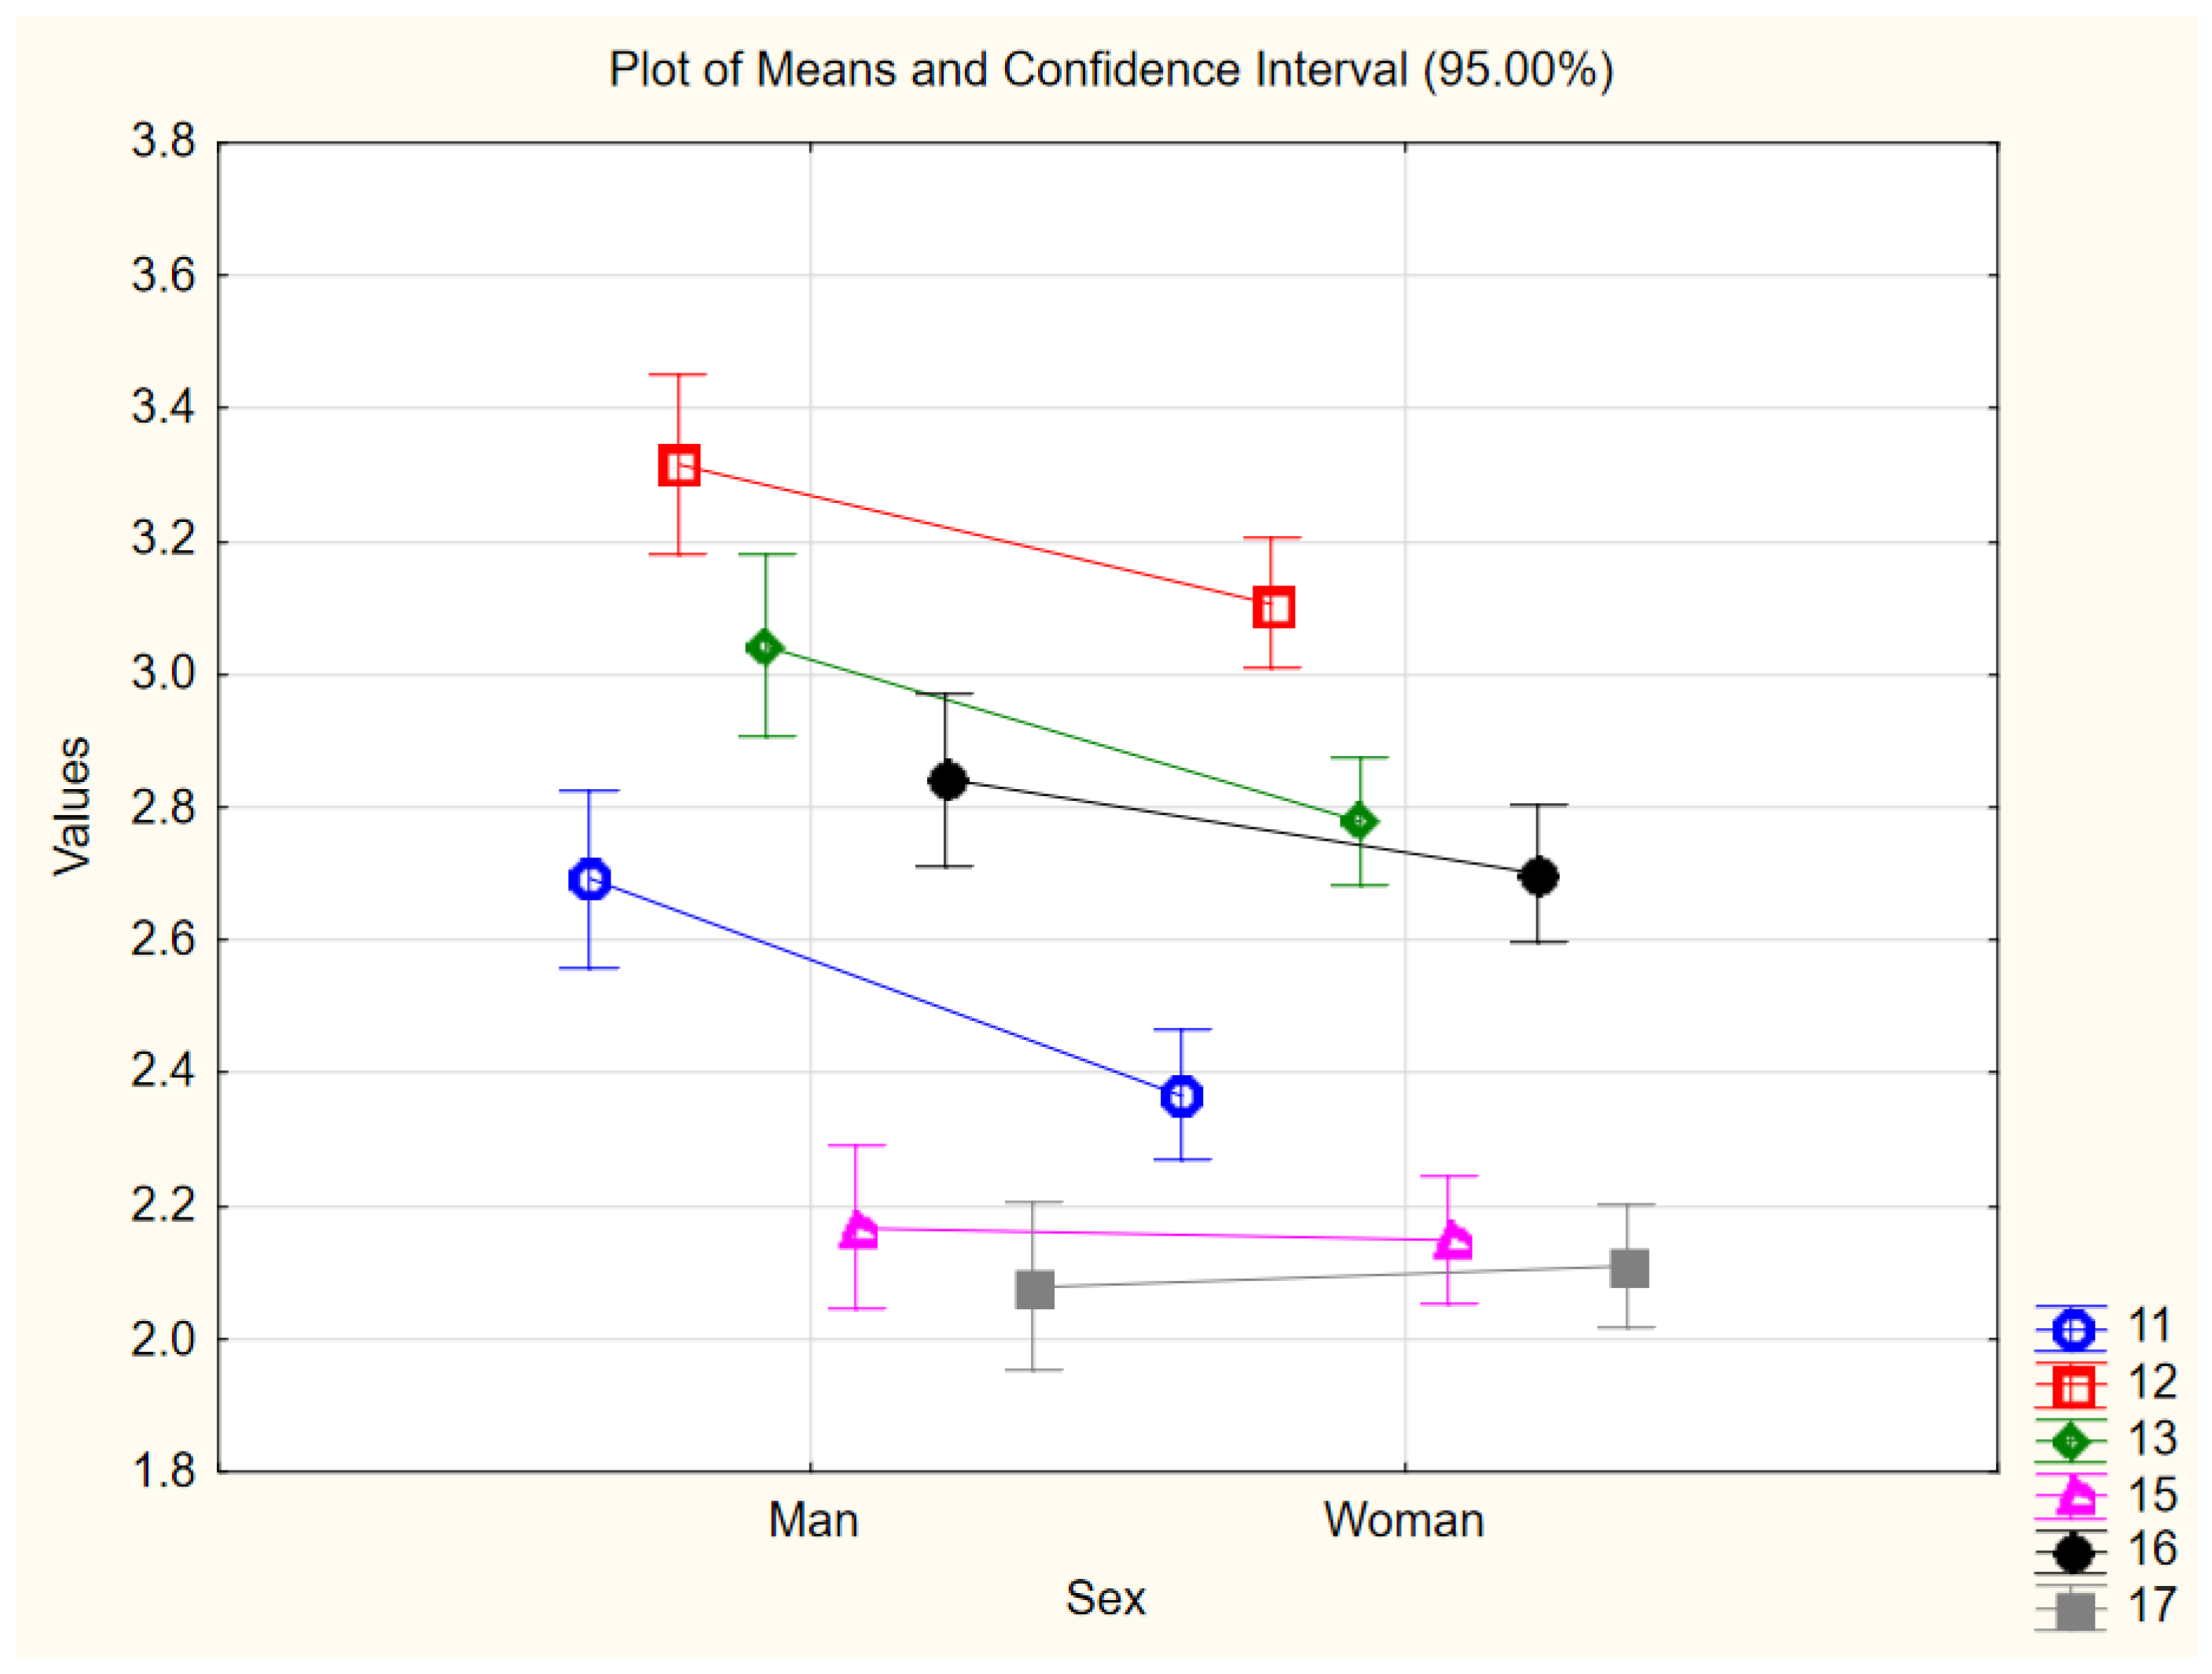
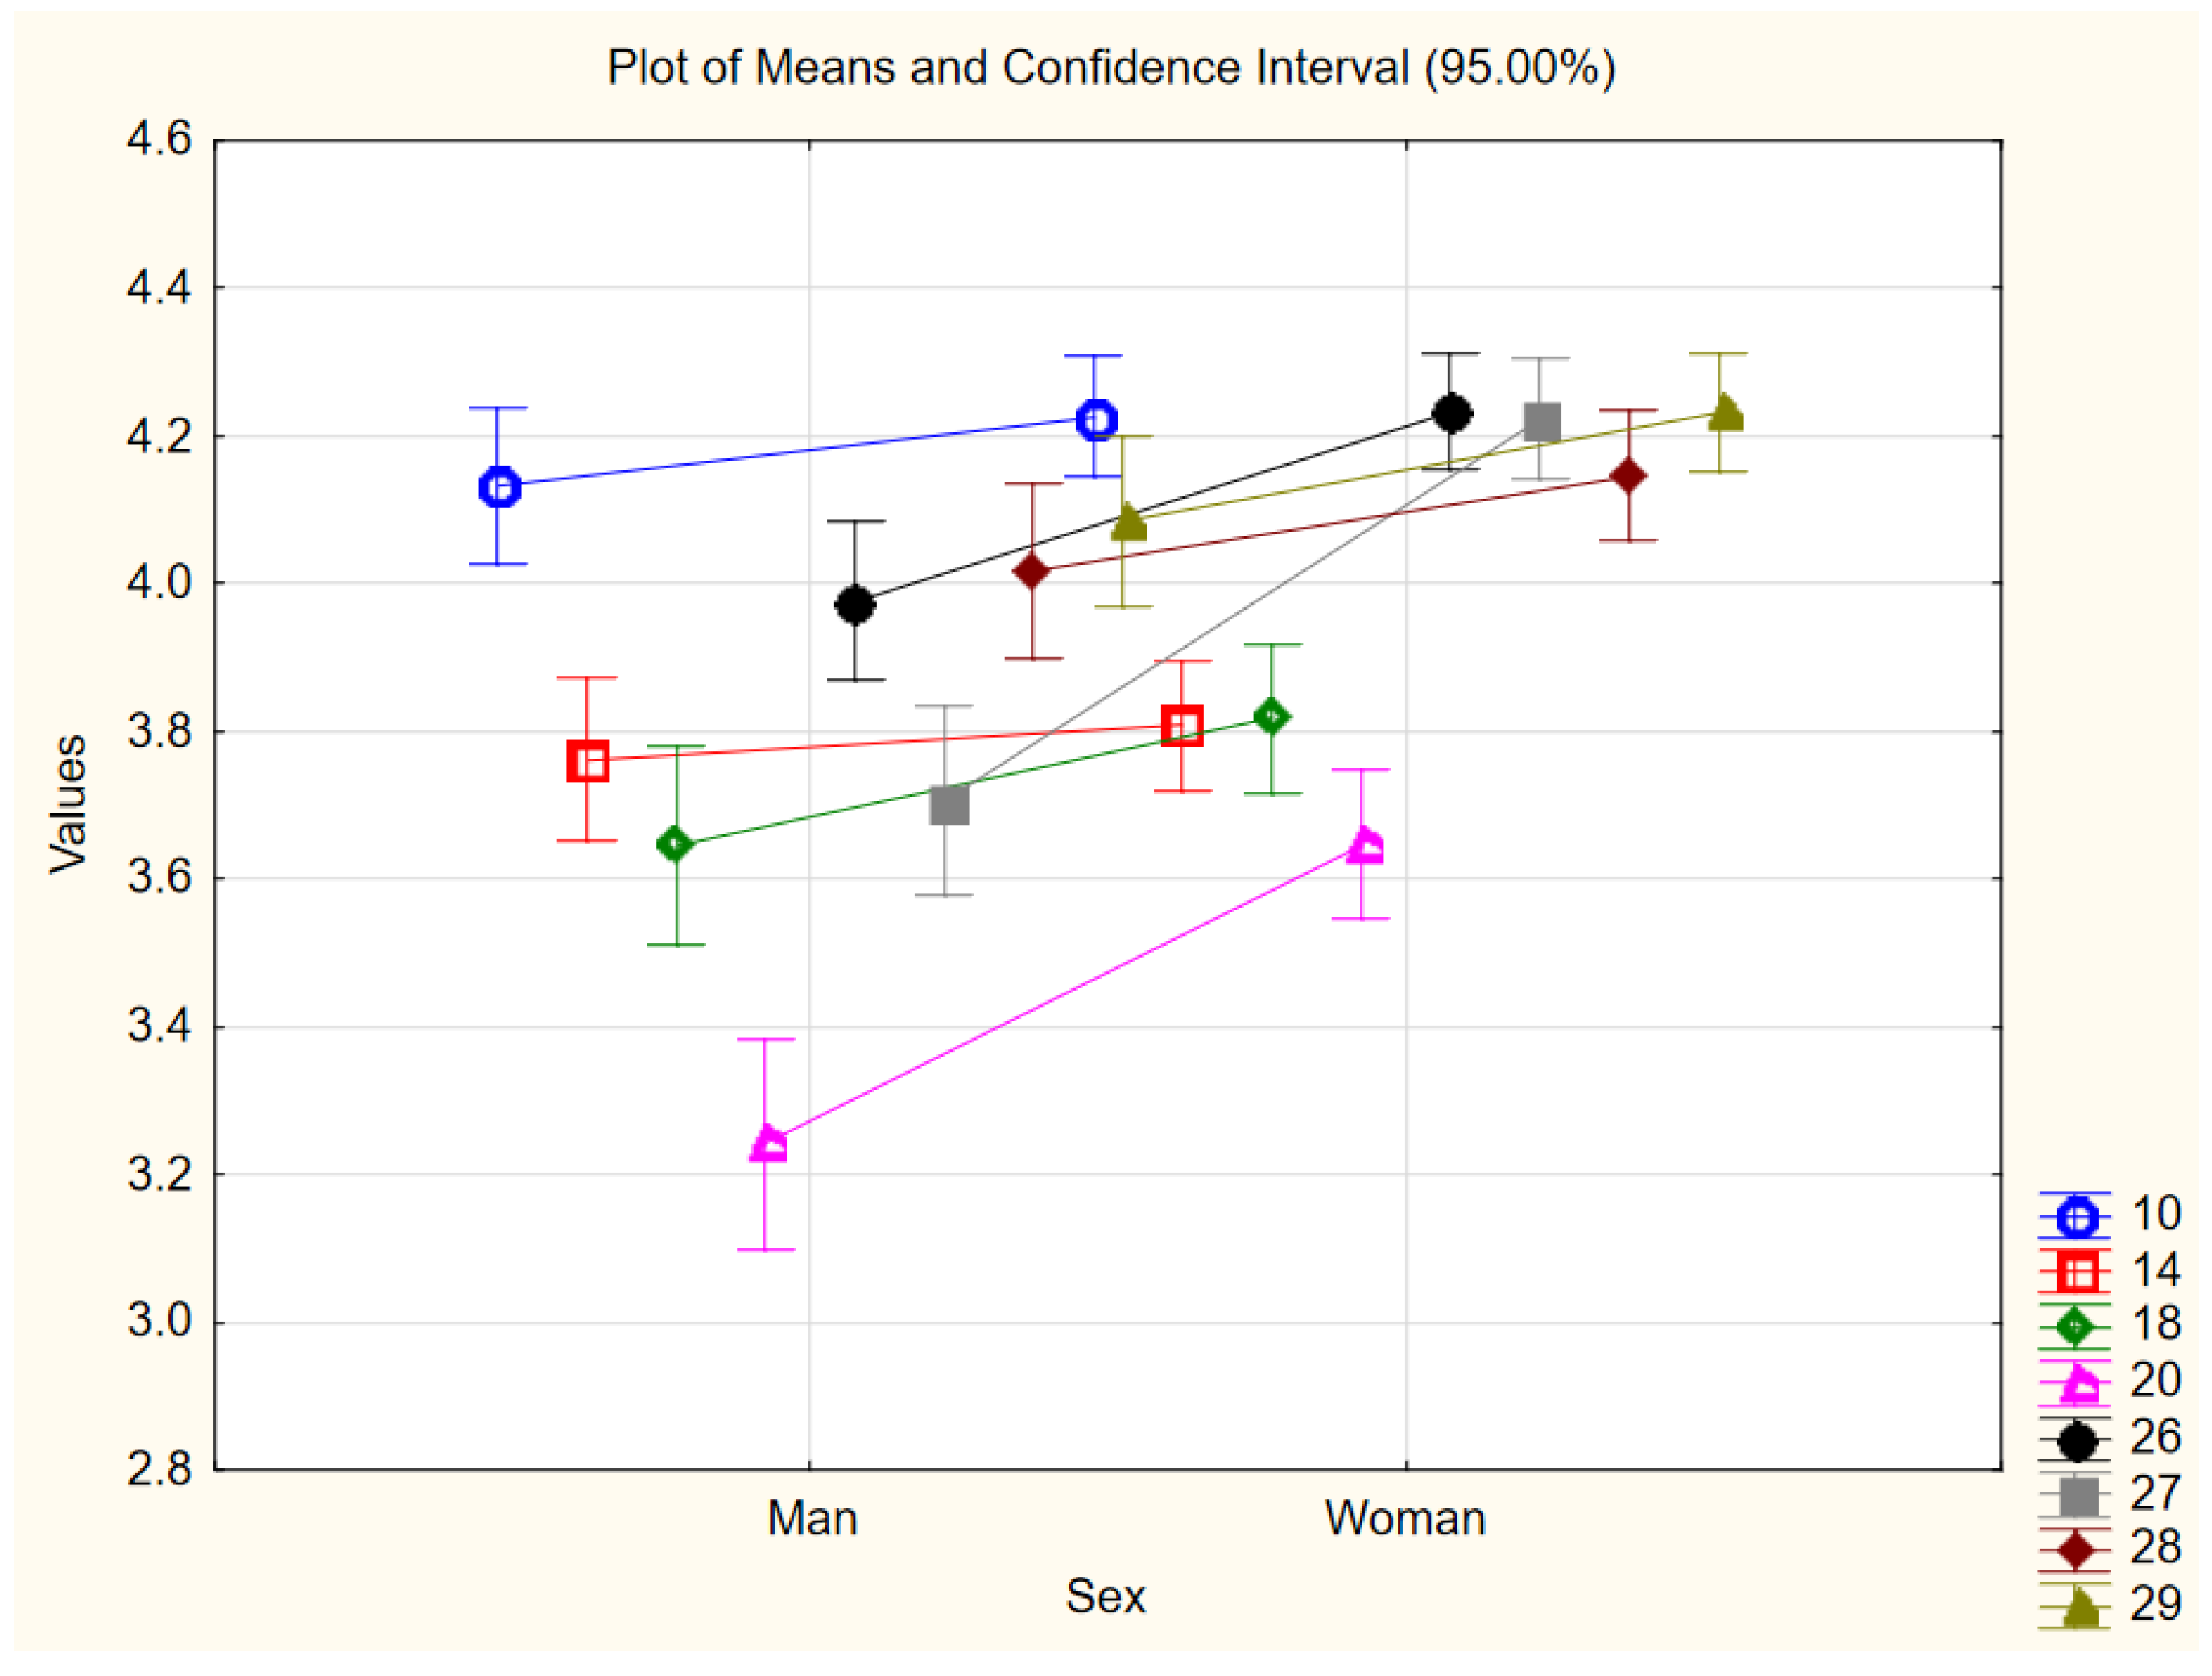
The assessment of diagnostic survey theses was subjected to a categorizing analysis in terms of sex of the respondents. Figure 4, Figure 5 and Figure 6 show the average assessment of diagnostic survey theses broken down by sex of the respondents.

Figure 4.
Average ratings of survey theses concerning the perception of climate change issues, categorized by sex of the respondents. Descriptions of survey theses included in the research methodology and in Table 1.
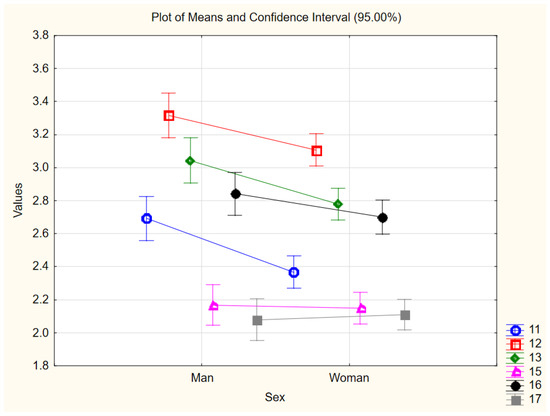
Figure 5.
Average ratings for survey theses RES, categorized by sex of respondents. Descriptions of survey theses included in the research methodology and in Table 1.
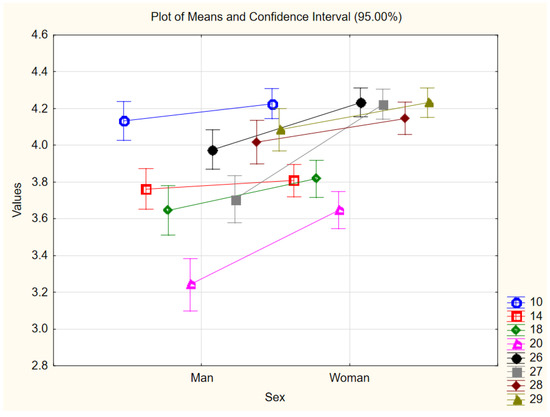
Figure 6.
Average assessments of survey theses concerning the perception of the perspectives of energy production and consumption, categorized by sex of the respondents. Descriptions of survey theses included in the research methodology and in Table 1.
Figure 4 shows the average assessments of survey theses concerning the perception of the issue of climate change, broken down by sex of the respondents. Noteworthy are the higher average ratings given by women for survey theses relating to the reduction of consumption, CO2 emissions, and anthropogenic pressure (survey theses 1, 3, 4, 6). This proves that women are more sensitive to environmental problems. This is also confirmed by the difference in the assessment of survey theses 5, 7, and 9, which depreciate the problem of climate change and indicate the ineffectiveness of climate policy. Women rated these survey theses lower than men.
Comparing the assessments of survey theses proposing the paths of preserving natural resources by limiting consumption (survey thesis 1) or limiting the human population (survey thesis 2), it is worth emphasizing that, regardless of the much higher acceptance of consumption limitation, women show a higher average of assessments compared to the assessments given by men. This may indicate their greater involvement in counteracting negative trends.
Figure 5 shows the average ratings for survey theses depreciating RES, categorized by sex of the respondents. It is worth emphasizing that the average ratings for these survey theses were low, which means that the respondents generally did not confirm their negative opinion about RES. Only the survey thesis concerning high costs of obtaining energy from renewable sources (survey thesis 12) obtained average scores slightly exceeding the value of 3, i.e., a neutral score. Survey theses 11, 12, 13, and 16, which negatively define RES, were assessed below by women. This proves that women have a greater positive attitude towards renewable energy.
Figure 6 shows the average assessments of survey theses concerning the perception of the perspectives of energy production and consumption, categorized by sex of the respondents. High averages were calculated for all survey theses relating to the postulates of government support for measures limiting energy consumption (survey theses 26–29). This means that respondents see the need to improve energy efficiency and increase the share of renewable energy sources in the energy mix. It should be emphasized that the mean scores for these survey theses calculated in the group of women were higher than in the group of men. Additionally, high averages were calculated for the survey thesis, expressing the belief that the growing demand for energy can be covered by developing the use of renewable energy sources (survey thesis 10). In this case, the women also rated this belief higher.
Noteworthy is the difference depending on the respondents’ sex, the average assessment of acceptance of incurring the costs of reducing CO2 emissions (survey thesis 20) and administrative requirements regarding high energy efficiency (survey thesis 27). The mean scores for these survey theses were much higher for women, which indicates their greater willingness to sacrifice and accept administrative orders.
The preferences of the respondents regarding the direction of energy development, categorized by sex of the respondents, are presented in Figure 7.
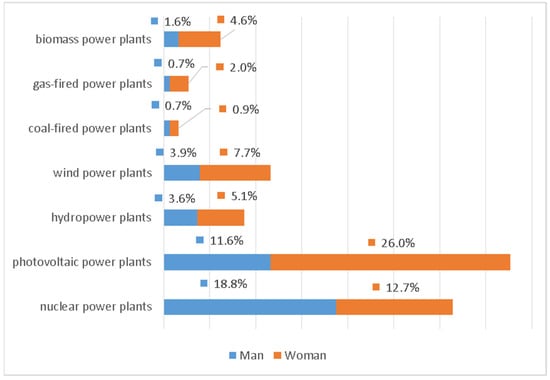
Figure 7.
The preferences of the respondents regarding the future of the energy sector, divided by sex.
The most numerous group consisted of people postulating the development of photovoltaic energy, and the second largest group were those who advocated for the development of nuclear energy. There was much less support for wind farms, followed by hydroelectric power plants, biomass power plants, etc. The least support was expressed for the development of coal-fired power plants. Thus, a significant percentage of young people surveyed expect the development of photovoltaics and nuclear energy, but there are differences depending on the sex of the respondent. In the group of respondents calling for the development of photovoltaic power plants, 69.2% were women, while in the group calling for the development of nuclear energy, 59.7% were men.
Table 3 presents the results of the verification of the hypothesis—that there are no differences in the assessment of the survey theses according to the sex of the respondents.
Table 3.
The results of the Chi-Square test analysis between sex and the assessment of the survey theses.
The null hypothesis (H0) means that there are no differences between the sexes, while the alternative hypothesis (H1) assumes the existence of these differences. The presented data show that the perception of the issue of climate change depended on the sex of the respondents (survey theses 3–9). Survey theses 10–18, regarding renewable energy sources, have obtained mixed results. Regarding the assessments of three (survey theses 11–13), which presented negative RES, differences between the sexes were found, but in the case of the other assessments (survey theses 14–18), no statistically significant differences were found. The assessment of the survey theses identifying purchasing behavior and expectations, regarding the government’s support for energy conservation, mostly differed depending on the sex.
4. Discussion
It should be emphasized that, in the conducted research, the respondents were young, educated, and mostly from cities of various sizes, including the two largest cities in the studied region, i.e., Lublin and Rzeszów. More than half of the respondents were women. It is worth noting that young Polish respondents showed strong support for the anthropogenic causes of climate change and the serious threat associated with this problem, which strongly confirms hypothesis 2: “young people consider climate change to be one of the main contemporary problems resulting from human activity” in no less work. However, the necessity to reduce both consumption and CO2 emissions in connection with this phenomenon was moderately supported by the majority of the surveyed consumers, which in turn refutes hypothesis 1: “reducing consumption is perceived as a way of counteracting climate change, and excessive energy consumption”, presented in this work. Although the reality of anthropogenic climate change has been established “beyond any doubt” by leading scientists around the world [30,33,34,36,49], some authors [49,50,51] have analyzed the existing literature from 1993–2014 on education in terms of climate change for young people, and found that children’s and adolescents’ understanding of these changes is generally limited, wrong, and heavily influenced by the mass media [49,50]. Other research suggests that didactic approaches to climate change education were largely ineffective in influencing student attitudes and behavior [51,52,53,54]. The aforementioned authors [53,54] postulate the development of new forms of climate education, which will directly involve children and young people in the process of responding to climate problems, both in the sphere of scientific, social, ethical, and political matters. Educated Polish youth who participated in this study also fit in with the above trends and opinions [40,41,54].
Additionally, it should be emphasized that the surveyed youth from south-eastern Poland had a neutral perception of the actions of the European Union in reducing greenhouse gas emissions, and at the same time, more than half of them declared their readiness to bear the costs of the climate policy. On the other hand, the survey theses relating to the economic motivations of the climate policy were mostly neutral in opinion by the respondents, which may indicate a lack of decisiveness in their views on this subject [53,54]. Young Poles clearly have a positive perception of renewable energy sources, so it can be concluded that their sensitivity is shaped in an environmentally friendly manner, in line with the main directions outlined by the European Commission [33,34,55,56]. It is also a confirmation of the third research hypothesis put forward by the authors of this work.
The results of the research, presented in this paper also show that the respondents understand the need to limit consumption to save the climate, but most of them expect government support for actions limiting energy consumption [29,30,36,37]. This confirms the hypothesis 4: “young people prefer renewable energy sources”, put forward by the authors of this study. It should be emphasized that in these studies, the postulate of human depopulation, due to the lack of resources, was positively correlated with prospective activities regarding RES and electromobility, as well as with the readiness to bear the costs of climate policy and the search for certified products. However, only a quarter of the surveyed Poles trusted this type of system solutions. Some authors [57,58] report that the continuous growth of the human population in the world has a significant impact on climate change, and the production and consumption of both food and energy. In this research, most respondents from south-eastern Poland do not see such a relationship. Although most of the respondents are concerned about climate change, their opinions are divided. Some of the respondents do not see the problem of climate change, do not see the need to develop renewable energy sources, and do not support energy saving with public money.
This research shows that women are more sensitive to environmental problems than men. Women also showed greater involvement in counteracting negative trends, such as excessive consumption or human depopulation [57,58], and assessed RES more positively than men [59]. Women were also more likely to comply with administrative and government orders regarding energy savings, and costs, to reduce CO2 emissions [37,39,40]. This research confirmed the hypothesis 5: “the perception of climate problems, the prospects for electricity production, and consumption, depends on the respondents’ sex”. The sex of the respondents was of significant importance for the perception of climate problems, and the perspective of energy production and consumption.
In the conducted research, the largest group consisted of people postulating the development of photovoltaic energy in the future, and then supporters of the development of nuclear energy, with women, mostly, having a more positive opinion of photovoltaics, and more than half of the surveyed men of nuclear energy. The least support among the respondents was for the development of coal-fired power plants. The young people from the conducted research fit to a large extent in one of the four scenarios of Poland’s energy development [15,19,21], namely the diversified scenario with nuclear energy [39,40]. On the other hand, the surveyed women tend more towards the renewable scenario [29,39,40,60]. Both scenarios, on the other hand, are very much in line with global trends (New Policiens of Energy and Sustainable Development Policies of Energy (RES) (24,60)).
5. Conclusions
The conducted research confirmed all the research hypotheses, but it can be stated that the views of the Polish youth under study were coherent. People who saw the problem of climate change also trusted the Community Policy, expected government support in terms of energy conservation, and declared their readiness to bear the costs of climate policy. A significant minority of respondents treated climate policy as a form of an economic game, also did not treat climate change as the main problem of the present day in this case, and were more skeptical about renewable energy sources, the actions of the government, and the European Union.
On the basis of the presented research results, the aim of which was to broaden the knowledge about the opinions of young people about the production and consumption of electricity, the following conclusions can be drawn:
- the surveyed youth expressed a strong belief in anthropogenic causes of climate change, and appreciated the seriousness of the resulting problems, 78.0% of respondents thought so. However, the need to reduce consumption was viewed at a moderate level—69.8%;
- the attitude of the surveyed youth to the EU Climate Policy was generally neutral, 43.2%—yes, and 41.4%—neither positive nor negative;
- in terms of bearing the costs of counteracting climate change, more than half of the respondents (55.1%) declared willingness to pay the costs of climate policy, and the average ratings were much higher among women. This means that women are more likely to accept administrative orders;
- the surveyed youth have a positive perception of renewable energy sources (81.9%)—they see these sources as an opportunity to meet their growing energy needs. The respondents did not confirm the negative opinions, both about wind energy and photovoltaics;
- the issues of energy saving, including energy efficiency, were appreciated by the surveyed youth. Women were more sensitive to these problems. The differences between the sexes in the perception of the studied issues also concerned the perspectives for the development of the energy sector. Photovoltaics and other renewable energy sources are preferred by women—this is the opinion of 69.2% of women, and nuclear energy by men—this is the opinion of 59.7% of men. According to the respondents, these two energy sources should dominate the future energy mix.
Author Contributions
Conceptualization: M.W., A.B. and K.K.; methodology: M.W., A.B. and K.K.; software: M.W., A.B., K.K. and L.W.; validation: M.W., A.B., K.K. and L.W.; formal analysis: M.W., A.B., K.K. and L.W.; compiled by M.W., A.B. and K.K.; resources: M.W., A.B., K.K. and L.W.; data processing: M.W., A.B. and K.K.; writing—original project preparation: M.W., A.B. and K.K.; writing—review and editing: M.W., A.B. and K.K.; visualization: M.W., A.B. and K.K. All authors have read and agreed to the published version of the manuscript.
Funding
These studies received no external financing.
Data Availability Statement
The research results were obtained from questionnaires constructed by the Authors of this publication.
Conflicts of Interest
The authors declare no conflict of interest.
References
- Derski, B. Najwyższa w Historii Produkcji i Zużycia Energii. Available online: https://wysokienapiecie.pl/44288-najwyzsza-w-historii-produkcja-zuzycie-energii/ (accessed on 4 May 2022).
- Raport 2020 KSE. Zestawienie Danych Ilościowych Dotyczących Funkcjonowania KSE w 2020 Roku. Available online: https://www.pse.pl/dane-systemowe/funkcjonowanie-kse/raporty-roczne-z-funkcjonowania-kse-za-rok/raporty-za-rok-2020#r6_5 (accessed on 5 May 2022).
- Kazimierska, M. Zużycie Prądu w Polsce. Jaki Wpływ Lockdownu? Available online: https://enerad.pl/aktualnosci/zuzycie-pradu-w-polsce-jaki-wplyw-lockdownu/ (accessed on 6 May 2022).
- Zużycie Paliw i Nośników Energii w 2020 r; GUS: Warszawa, Poland, 2021. Available online: https://stat.gov.pl/obszary-tematyczne/srodowisko-energia/energia/zuzycie-paliw-i-nosnikow-energii-w-2020-roku,6,15.html?contrast=default (accessed on 6 May 2022).
- Roczni Statystyczny Rzeczypospolitej Polskiej 2020; GUS: Warszawa, Poland, 2020. Available online: https://stat.gov.pl/obszary-tematyczne/roczniki-statystyczne/roczniki-statystyczne/rocznik-statystyczny-rzeczypospolitej-polskiej-2020,2,20.html (accessed on 6 May 2022).
- Ile Wynosi Średnie Zużycie Prądu na Osobę? Available online: https://optimalenergy.pl/aktualnosci/prad/ile-wynosi-srednie-zuzycie-pradu-na-osobe/ (accessed on 7 May 2022).
- Polska w Liczbach 2021; GUS: Warszawa, Poland, 2021. Available online: https://stat.gov.pl/obszary-tematyczne/inne-opracowania/inne-opracowania-zbiorcze/polska-w-liczbach-2021,14,14.html (accessed on 7 May 2022).
- Rocznik Statystyczny Rzeczypospolitej Polskiej 2021; GUS: Warszawa, Poland, 2021. Available online: https://stat.gov.pl/obszary-tematyczne/roczniki-statystyczne/roczniki-statystyczne/rocznik-statystyczny-rzeczypospolitej-polskiej-2021,2,21.html (accessed on 7 May 2022).
- Odbiorcy Energii Elektrycznej w Polsce. Available online: https://bdl.stat.gov.pl/BDL/metadane/cechy/1880 (accessed on 7 May 2022).
- Statystyki Zużycia Energii i Używanych Rodzajów Ogrzewania w Polsce. Available online: https://www.polenergia-pv.pl/blog/statystyki-zuzycia-energii-i-uzywanych-rodzajow-ogrzewania-w-polsce (accessed on 5 May 2022).
- Sprawdziliśmy, co Zużywa Najwięcej Prądu w Twoim Domu. Available online: https://pgnig.pl/sprawdzilismy-co-zuzywa-najwiecej-pradu-w-twoim-domu (accessed on 7 May 2022).
- Gwiazda, P.R.M.; Ruszkowski, P. (Eds.) Polacy o Źródłach Energii, Polityce Energetycznej i Stanie Środowiska; CBOS: Warszawa, Polska, 2016; Available online: https://www.cbos.pl/PL/publikacje/diagnozy/034.pdf (accessed on 8 June 2022).
- Micek, D. Społeczno-Kulturowe Uwarunkowania Rozwoju Energetyki Rozproszonej w Polsce. In Raport z Analizy Danych Zastanych; AGH: Kraków, Polska, 2020; Available online: https://www.er.agh.edu.pl/media/filer_public/71/e1/71e19ff4-ed84-4140-91f5-8a170632334f/raport_spoleczno-kulturowe_uwarunkowania_rozwoju_energetyki_rozproszonej_w_polsce.pdf (accessed on 8 June 2022).
- Co Polacy Sądzą o Rynku Energii i Co o Nim Wiedzą? Available online: https://www.gramwzielone.pl/trendy/13468/co-polacy-sadza-o-rynku-energii-i-co-o-nim-wiedza (accessed on 7 June 2022).
- Efektywnośc Energetyczna: 70% Polaków Dostrzega Inwestycje w Swojej Okolicy. Available online: https://swiatoze.pl/efektywnosc-energetyczna-70-polakow-dostrzega-inwestycje-w-swojej-okolicy/ (accessed on 25 April 2022).
- Transformacja Energetyczna—Oczekiwani i Postulaty; CBOS: Warszawa, Poland, 2021; Available online: https://www.cbos.pl/SPISKOM.POL/2021/K_070_21.PDF (accessed on 7 May 2022).
- Dziewięciu na Dziesięciu Polaków Deklaruje, że Oszczędza Energię Elektryczną. PKEE Polski Komitet Energii Elektrycznej. 2022. Available online: https://www.pap.pl/mediaroom/1079358%2Cdziewieciu-na-dziesieciu-polakow-deklaruje-ze-oszczedza-energie-elektryczna.html (accessed on 15 May 2022).
- Polacy Oblewają Egzamin z Oszczędzania Energii. 2022. Available online: https://wysokienapiecie.pl/67837-polacy-oblewaja-egzamin-z-oszczedzania-energii/ (accessed on 5 May 2022).
- Cooke, P. Green governance and green clusters: Regional & national policies for the climate change challenge of Central & Eastern Europe. J. Open Innov. 2015, 1, 1. [Google Scholar] [CrossRef] [Green Version]
- Abraham, S.; Noriega, B.R.; Shin, J.Y. College students eating habits and knowledge of nutritional requirements. J. Nutr. Hum. Health 2018, 2, 13–17. Available online: https://www.alliedacademies.org/articles/college-students-eating-habits-and-knowledge-of-nutritional-requirements.pdf (accessed on 5 April 2022). [CrossRef]
- BP Statistical Review of World Energy, June 2017. Available online: https://www.connaissancedesenergies.org/sites/default/files/pdf-actualites/bp-statistical-review-of-world-energy-2017-full-report (accessed on 15 April 2022).
- Global Resources Outlook 2019: Natural Resources for the Future We Want. Available online: https://www.resourcepanel.org/reports/global-resources-outlook (accessed on 5 April 2022).
- Eurostat. 2020. Available online: https://ec.europa.eu/eurostat/tgm/table.do?tab=table&init=1&language=en&pcode=ceisrm030&plugin=1 (accessed on 5 April 2022).
- Olkuski, T. Światowe zużycie energii pierwotnej oraz zapotrzebowanie na nią w przyszłości. Polityka i Społeczeństwo 2018, 2, 56–70. Available online: https://bazhum.muzhp.pl/media/files/Polityka_i_Spoleczenstwo/Polityka_i_Spoleczenstwo-r2018-t-n2_(16)/Polityka_i_Spolecz (accessed on 6 April 2022). [CrossRef]
- United Nations. Department of Economic and Social Affairs, Population Division 2017. World Population Prospects: The 2017 Revision, Key Findings and Advance Tables. Working Paper No. ESA/P/WP/248. Available online: https://population.un.org/wpp/publications/files/wpp2017_keyfindings.pdf (accessed on 8 April 2022).
- Młynarski, T. Bezpieczeństwo energetyczne w pierwszej dekadzie XXI wieku. In Mozaika Interesów i Geostrategii; Wydawnictwo Uniwersytetu Jagiellońskiego: Kraków, Poland, 2011; Available online: https://wuj.pl/ksiazka/bezpieczenstwo-energetyczne-w-pierwszej-dekadzie-xxi-wieku (accessed on 5 April 2022).
- Młynarski, T. Unia Europejska w procesie transformacji energetycznej. Krak. Studia Międzynarodowe 2019, XVI, 31–44. Available online: https://ksm.ka.edu.pl/tresc/2019-1/krakowskie-studia-miedzynarodowe-2019-nr1-mlynarski.pdf (accessed on 14 April 2022).
- Prognoza Ludności Rezydującej dla Polski w Latach 2015–2050; GUS Departament Badań Demograficznych i Rynku Pracy: Warszawa, Poland, 2020. Available online: https://stat.gov.pl/files/gfx/portalinformacyjny/pl/defaultaktualnosci/5469/8/1/1/prognoza_rezydentow_analiza_vgm.pdf (accessed on 14 April 2022).
- Szczerbowski, R.; Ceran, B. Polityka energetyczna Polski w aspekcie wyzwań XXI wieku. Polityka Energetyczna Energy Policy J. 2017, 20, 17–28. Available online: https://min-pan.krakow.pl/wp-content/uploads/sites/4/2017/12/02-PE-05-Szczerbowski-Ceran.pdf (accessed on 15 April 2022).
- Flisowska, J.; Moore, C. Just Transition or Just Talk? 2020. National Energy and Climate Plans Reveal that the EU Countries Set to Receive Most of the Just Transition Fund Plan to Stick with Coal—Or Swap It for Fossil Gas. Ember and CAN Europe 2020. Available online: https://www.caneurope.org/content/uploads/2020/09/2020-Just-transition-1.5.pdf (accessed on 6 April 2022).
- Competitiveness and Private Sector Development. Enhancing Competitiveness in Central Asia. Available online: https://www.oecd-ilibrary.org/docserver/9789264288133-en.pdf?expires=1653141975&id=id&accname=guest&checksum=D429E6EAAF1438B221B36E52EA922A70 (accessed on 14 April 2022).
- Xuetong, Y. Leadership and the Rise of Great Powers; Princeton University Press: Oxford, UK, 2019; Available online: https://digitalcommons.northgeorgia.edu/cgi/viewcontent.cgi?article=1368&context=issr (accessed on 17 April 2022).
- Communication from the Commission, A Clean Planet for All—A European Strategic Long-Term Vision for A Prosperous, Modern, Competitive and Climate Neutral Economy. European Commission: COM/2018/773 Final of 28.11.2018. Available online: https://eur-lex.europa.eu/legal-content/EN/TXT/PDF/?uri=CELEX:52018DC0773 (accessed on 11 April 2022).
- Regulation (EU) 2018/842 of the European Parliament and of the Council. (EU) 2018/842 of 30 May 2018 on Binding Annual Greenhouse Gas Emission Reductions by Member States from 2021 to 2030 Contributing to Climate Action to Meet Commitments under the Paris Agreement and Amending Regulation (EU) No 525/2013 (Text with EEA Relevance). Available online: https://eur-lex.europa.eu/legal-content/EN/TXT/?uri=celex%3A32018R0842 (accessed on 17 April 2022).
- The European Environment—State and Outlook 2020: Knowledge for Transition to a Sustainable Europe. European Environmental Agency. Available online: https://www.eea.europa.eu/soer/2020 (accessed on 10 April 2022).
- Gawlik, L.; Mokrzycki, E. Changes in the Structure of Electricity Generation in Poland in View of the EU Climate Package. Energies 2019, 12, 3323. Available online: https://www.mdpi.com/1996-1073/12/17/3323 (accessed on 10 April 2022). [CrossRef] [Green Version]
- Polityka Energetyczna Polski Do 2040 r. Ministerstwo Klimatu i Środowiska: Warszawa 2021. Available online: https://www.gov.pl/web/klimat/polityka-energetyczna-polski (accessed on 6 April 2022).
- Wolsink, M. Co-production in distributed generation: Renewable energy and creating space for fitting infrastructure within landscapes. Landsc. Res. 2018, 43, 542–561. [Google Scholar] [CrossRef] [Green Version]
- Polityka Energetyczna Polski Do 2050 Roku. Available online: http://archiwum.inig.pl/INST/nafta-gaz/nafta-gaz/Nafta-Gaz-2014-11-13.pdf (accessed on 6 April 2022).
- Śniegocki, A.; Bukowski, M. Mix Energetyczny 2050; Analiza scenariuszy dla Polski; Ministerstwo Gospodarki: Warszawa, Poland, 2011; Available online: https://ibs.org.pl/publications/mix-energetyczny-2050-analiza-scenariuszy-dla-polski/ (accessed on 5 April 2022).
- Olkuski, T.; Stala-Szlugaj, K. Tendencje zmian występujące w światowej energetyce. Zesz. Nauk. Inst. Gospod. Surowcami Miner. I Energią PAN 2017, 98, 187–198. Available online: https://se.min-pan.krakow.pl/pelne_teksty31/k31_zn_z/k31zn98_olkuski-stala-szlugaj_z.pdf (accessed on 26 April 2022).
- Konstytucja Rzeczypospolitej Polskiej z Dnia 2 Kwietnia 1997 r. Uchwalona Przez Zgromadzenie Narodowe w Dniu 2 Kwietnia 1997 r., Przyjęta Przez Naród w Referendum Konstytucyjnym w Dniu 25 maja 1997 r., Podpisana Przez Prezydenta Rzeczypospolitej Polskiej w Dniu 16 Lipca 1997 r. Dz.U. 1997 nr 78 poz. 483. Available online: https://isap.sejm.gov.pl/isap.nsf/DocDetails.xsp?id=wdu19970780483 (accessed on 8 May 2022).
- Dziennik Urzędowy Unii Europejskiej PL Spis Treści Wydanie Polskie Rocznik 61 C 99/18. Zgromadzenia Parlamentarnego Euronest w Sprawie Przezwyciężania Wpływu Kryzysu Gospodarczego na Bezrobocie Młodzieży w UE i Państwach Partnerstwa Wschodniego. Informacje i Zawiadomienia 15 Marca 2018. Available online: https://eur-lex.europa.eu/legal-content/PL/TXT/PDF/?uri=CELEX:22018P0315(06)&from=SV (accessed on 7 May 2022).
- Rozkrut, D. Editor-in-Chief of Editorial Board of Statistics Poland. Statistical Yearbook of the Republic of Poland 2020. Available online: https://stat.gov.pl/download/gfx/portalinformacyjny/pl/defaultaktualnosci/5515/2/20/1/rocznik_statystyczny_rzeczypospolitej_polskiej_2020_korekta_30.09.2021.pdf (accessed on 4 April 2022).
- Chyung, S.Y.; Roberts, K.; Swanson, I.; Hankinson, A. Evidence-Based Survey Design: The Use of a Midpoint on the Likert Scale. Perform. Improv. 2017, 56, 15–23. [Google Scholar] [CrossRef] [Green Version]
- Ridwan, M.; Retnawati, H. Application of Cluster Analysis Using Agglomerative Method. Numer. J. Mat. Dan Pendidik. Mat. 2021, 5, 33–48. Available online: https://www.researchgate.net/publication/353980480_Application_of_Cluster_Analysis_Using_Agglomerative_Method (accessed on 7 April 2022).
- Härdle, W.K.; Simar, L. Cluster Analysis. In Applied Multivariate Statistical Analysis; Springer: Cham, Switzerland, 2019; ISBN -13: 978-3030260057. [Google Scholar]
- Aczel, A.D.; Sounderpandian, J. Statystyka w Zarządzaniu (Complete Business Statistics), 7th ed.; Wydawnictwo Naukowe PWN: Warszawa, Poland, 2018; ISBN 978-83-01-19537-3. [Google Scholar]
- Anderson, A. Climate Change Education for Mitigation and Adaptation. J. Educ. Sustain. Dev. 2012, 6, 191–206. Available online: https://journals.sagepub.com/doi/pdf/10.1177/0973408212475199 (accessed on 4 May 2022). [CrossRef]
- Cutter-Mackenzie-Knowles, A.; Rousell, D. The Mesh of Playing, Theorizing, and Researching in the Reality of Climate Change: Creating the Co-Research Play Space. In Research Handbook on Childhood Nature; Springer: Berlin/Heidelberg, Germany, 2018; pp. 1–25. Available online: https://journals.sagepub.com/doi/full/10.1177/1532708621997582 (accessed on 11 May 2022).
- Rousell, D.; Cutter-Mackenzie-Knowles, A. A systematic review of climate change education: Giving children and young people a ‘voice’ and a ‘hand’ in redressing climate change. Child. Geogr. 2018, 18, 191–208. [Google Scholar] [CrossRef]
- Pharo, E.; Davison, A.; McGregor, H.; Warr, K.; Brown, P. Using communities of practice to enhance interdisciplinary teaching: Lessons from four Australian institutions. High. Educ. Res. Dev. 2013, 33, 341–354. Available online: https://www.tandfonline.com/doi/abs/10.1080/07294360.2013.832168 (accessed on 11 May 2022). [CrossRef] [Green Version]
- Tanner, T. Shifting the Narrative: Child-led responses to climate change and disasters in El Salvador and the Philippines. Child. Soc. 2010, 24, 339–351. Available online: https://eprints.soas.ac.uk/31353/1/Tanner%20shifting%20the%20narrative%20Children%20and%20Society%202010.pdf (accessed on 11 May 2022). [CrossRef]
- Reid, A. Climate change education and research: Possibilities and potentials versus problems and perils? Environ. Educ. Res. 2019, 6, 767–790. Available online: https://www.tandfonline.com/doi/full/10.1080/13504622.2019.1664075 (accessed on 12 May 2022). [CrossRef] [Green Version]
- Clean Energy For All Europeans. COM (2016) 860 Final, Brussels, 30 November 2016. Communication from the Commission to the European Parliament, the Council, the European Economic and Social Committee, the Committee of the Regions and the European Investment Bank. Available online: https://ec.europa.eu/energy/sites/ener/files/documents/com_860_final.pdf (accessed on 22 April 2022).
- Connolly, D.; Lund, H.; Mathiesen, B.V. Smart Energy Europe: The technical and economic impact of one potential 100% renewable energy scenario for the European Union. Renew. Sustain. Energy Rev. 2016, 60, 1634–1653. [Google Scholar] [CrossRef]
- Ganivet, E. Growth in human population and consumption both need to be addressed to reach an ecologically sustainable future. Environ. Dev. Sustain. 2020, 22, 4979–4998. Available online: https://globalstudies-masters.eu/wp-content/uploads/2020/11/Elias-Ganivet-2020-Growth-in-human-population-and-consumption-both-need-to-be-addressed-to-reach-an-ecologically-sustainable-f.pdf (accessed on 12 May 2022). [CrossRef]
- Bongaarts, J. Development: Slow down population growth. Nature 2016, 530, 409–412. Available online: https://www.nature.com/articles/530409a (accessed on 12 May 2022). [CrossRef] [PubMed] [Green Version]
- Cook, N.J.; Grillos, T.; Andersson, K.P. Gender quotas increase the equality and effectiveness of climate policy interventions. Nat. Clim. Chang. 2019, 9, 330–334. Available online: https://par.nsf.gov/servlets/purl/10099748 (accessed on 12 May 2022). [CrossRef]
- Singer, S.; Denruyter, J.P.; Yener, D. The energy report: 100% renewable energy by 2050. In Towards 100% Renewable Energy; Conference Paper; Springer: Berlin/Heidelberg, Germany, 2017; pp. 379–383. Available online: https://link.springer.com/chapter/10.1007/978-3-319-45659-1_40 (accessed on 12 May 2022).

Publisher’s Note: MDPI stays neutral with regard to jurisdictional claims in published maps and institutional affiliations. |
© 2022 by the authors. Licensee MDPI, Basel, Switzerland. This article is an open access article distributed under the terms and conditions of the Creative Commons Attribution (CC BY) license (https://creativecommons.org/licenses/by/4.0/).