Article

Full-Scale Demonstration of Combined Ground Source Heating and Sustainable Urban Drainage in Roadbeds

by
Søren Erbs Poulsen
*,
Theis Raaschou Andersen
and
Karl Woldum Tordrup
R&D Centre for the Built Environment, Energy, Water and Climate, VIA University College, 8700 Horsens, Denmark
*
Author to whom correspondence should be addressed.
Energies 2022, 15(12), 4505; https://doi.org/10.3390/en15124505
Submission received: 12 May 2022 / Revised: 9 June 2022 / Accepted: 11 June 2022 / Published: 20 June 2022

Abstract

:
This paper proposes and demonstrates, in full scale, a novel type of energy geostructure (“the Climate Road”) that combines a ground-source heat pump (GSHP) with a sustainable urban drainage system (SUDS) by utilizing the gravel roadbed simultaneously as an energy source and a rainwater retarding basin. The Climate Road measures 50 m × 8 m × 1 m (length, width, depth, respectively) and has 800 m of geothermal piping embedded in the roadbed, serving as the heat collector for a GSHP that supplies a nearby kindergarten with domestic hot water and space heating. Model analysis of operational data from 2018–2021 indicates sustainable annual heat production levels of around 0.6 MWh per meter road, with a COP of 2.9–3.1. The continued infiltration of rainwater into the roadbed increases the amount of extractable heat by an estimated 17% compared to the case of zero infiltration. Using the developed model for scenario analysis, we find that draining rainwater from three single-family houses and storing 30% of the annual heating consumption in the roadbed increases the predicted extractable energy by 56% compared to zero infiltration with no seasonal energy storage. The Climate Road is capable of supplying three new single-family houses with heating, cooling, and rainwater management year-round.

1. Introduction

The IPCC report from 2022 predicts catastrophic and irreversible climate change unless immediate and sustained reductions in emissions of carbon dioxide and other greenhouse gases are enforced on a global scale [1]. The heating and cooling sector consumes as much as 50% of the total final energy use in Europe and its decarbonization, by implementing renewable energy sources, has become ever more urgent [2]. In 2021, Aalborg University published the report “Heat Plan 2021” that outlines the necessary steps to decarbonize the Danish heating supply towards the year 2030 [3]. The report recommends an increase in the district heating (DH) supply, from approximately 50% of the total heat consumption as of today to 63–70%, through large-scale utilization of industrial waste heat and geothermal energy. Geothermal energy is both clean and renewable and is expected to play a major role in the decarbonization of the global energy sector [4]. On a global scale, the installed capacity of geothermal heat pumps has increased by 70% from 2015 to 2020, indicating a rapidly growing market for geothermal energy [5].
The “Heat Plan 2021” report makes no recommendation regarding the approximately one-third of the total heating consumption in Denmark that cannot be supplied from DH, other than suggesting widespread distribution of individual ground- or air-source heat pumps [3]. Ground-source heat pumps (GSHPs) are efficient relative to air-source heat pumps (ASHPs) and are also able to supply direct/passive cooling due to the constant and low temperature of the ground [6,7,8,9]. Field trials of domestic heat pumps in Denmark show 35–50% higher seasonal performance factors (SPF) for GSHPs relative to ASHPs [10]. Moreover, the noise levels from GSHPs are lower than from ASHPs, although GSHPs require a larger initial investment. Additional reviews of GSHP and ASHP performance are presented in [11,12].
Approximately 70,000 ASHPs and 4000 GSHPs were sold in Denmark in 2021, making the former the preferred choice of heating supply in areas without the possibility for traditional DH [13]. On such a large scale, individual ASHPs are difficult to manage and integrate properly into the power grid, as they have very limited flexibility in terms of electricity consumption. On the coldest day of the year, there is nothing that can be done beforehand to mitigate the use of the backup electrical heater by ASHPs, as air temperatures are essentially uncontrollable. Consequently, distributing hundreds of thousands of individual ASHPs in Denmark to areas where DH is not possible could have serious ramifications for the magnitude of the investments in the power grid necessary for supplying these future peak loads. A novel alternative to individual heat pumps has been introduced in recent years with the emergence of 5th-generation district heating and cooling (5GDHC) grids, where distributed GSHPs connect to a network of uninsulated pipes and extract and store energy in the shallow subsurface, typically between 0 and 200 m depth [14,15,16]. The introduction of 5GDHC exemplifies successful integration in the energy sector by advancing direct electrification of prosumer-based circular, efficient, and renewable heating and cooling grids, and constitutes one of several promising strategies to address the pressing issue of climate change [16]. Integration across different sectors such as groundwater, heating and cooling, electricity, wastewater, etc., by means of multifunctional supply and utility systems potentially holds additional efficiency gains and decarbonization possibilities [17,18]. With its shared decentralized heating and cooling production, 5GDHC poses an attractive alternative to individual sources (for the heat pumps) due to the improved flexibility and peak power load management from better use of the available production capacity and the possibilities for seasonal energy storage.
The increasing urbanization of the global population limits the available urban space for utility infrastructure such as 5GDHC and traditional DH. Price et al. developed a 3D engineering geological model to maximize the use of the subsurface for sustainable urban drainage and ground-source heating while screening the foundation potential [19]. They consider energy geostructures that embed energy collectors for GSHPs in structural building elements and thus exemplify integration of the building and energy sectors by creating added value from economies of scope, as the need for structural building elements facilitates cost-effective heating and cooling. In previous work, we studied the use of foundation pile heat exchangers (energy piles) as the main energy source for a 5GDHC grid in Vejle, Denmark [20]. We estimated a payback period of 4–7 years for the energy pile-based 5GDHC grid relative to traditional district heating largely due to the significant cost reduction for the ground heat exchangers and greatly reduced variable costs. Several other types of energy geostructures have been successfully developed and implemented, including energy walls, tunnels, and ground anchors [21,22,23].
Charlesworth et al. embedded GSHP geothermal piping in a permeable pavement system (PPS) to supply a single building with heating and cooling in a multifunctional approach to rainwater management and energy supply [24]. The authors concluded that the heat pump employed in the study was overdimensioned and that the geothermal piping was buried at too shallow a depth (35 cm), with detrimental disturbances from seasonal temperature variations, yielding a coefficient of performance (COP) of just 1.8, well below the 2.875 required for satisfactory performance by the 2009 EU Renewable Energy Directive. Nevertheless, the authors further concluded that the combined GSHP-PPS system is expected to perform satisfactorily if designed and dimensioned correctly. They pointed out the need for building full-scale testing of combined SUDS and GSHP.
To address these issues, we propose and demonstrate, in full scale, a novel type of energy geostructure that uses a traditional road construction for combining a GSHP with a sustainable urban drainage system, referred to as the “Climate Road”. The Climate Road uses the geotechnical gravel structure underlying and stabilizing the road simultaneously as an energy source for the GSHP and as a retarding basin for draining excess surface water through permeable asphalt and roadside drainage grates. A total of 800 m (4 × 200 m loops) of geothermal piping was buried in the roadbed 50 and 100 cm below the pavement surface and connected to an existing GSHP in a nearby kindergarten.
We hypothesize that by combining the two supplies in existing road infrastructure, the Climate Road creates added value for both the heating supplier and the wastewater utility, as well as city planners. The wastewater utility increases its surface water retardation capacity without occupying areas on the surface, thus allowing more space for future house owners and/or businesses that create future revenue streams. We further hypothesize that the performance of the heating supply is increased by the constant infiltration of water to the geothermal piping. Both suppliers benefit from the reduced construction costs, as the roadbed has to be constructed in any case. The Climate Road also eliminates any potential noise issues with ASHPs in areas where buildings are closely spaced.
We present the construction details for the 50 m full-scale demonstration of the road and present water balance measurements and operational GSHP data for the initial 1135 days of operation. The experimental data serve to validate a computational model of the heat transport in the roadbed. Model studies are employed to explore sustainable energy production levels for a 30-year period, as constrained by legislative regulations on brine temperatures for GSHP systems operating in Denmark. We further estimate the effects of rainwater infiltration and seasonal energy storage on sustainable heat production levels. For a more in-depth analysis of rainwater management and retardation with the Climate Road we refer to Andersen et al. [25].

2. Materials and Methods

2.1. Climate Road Construction

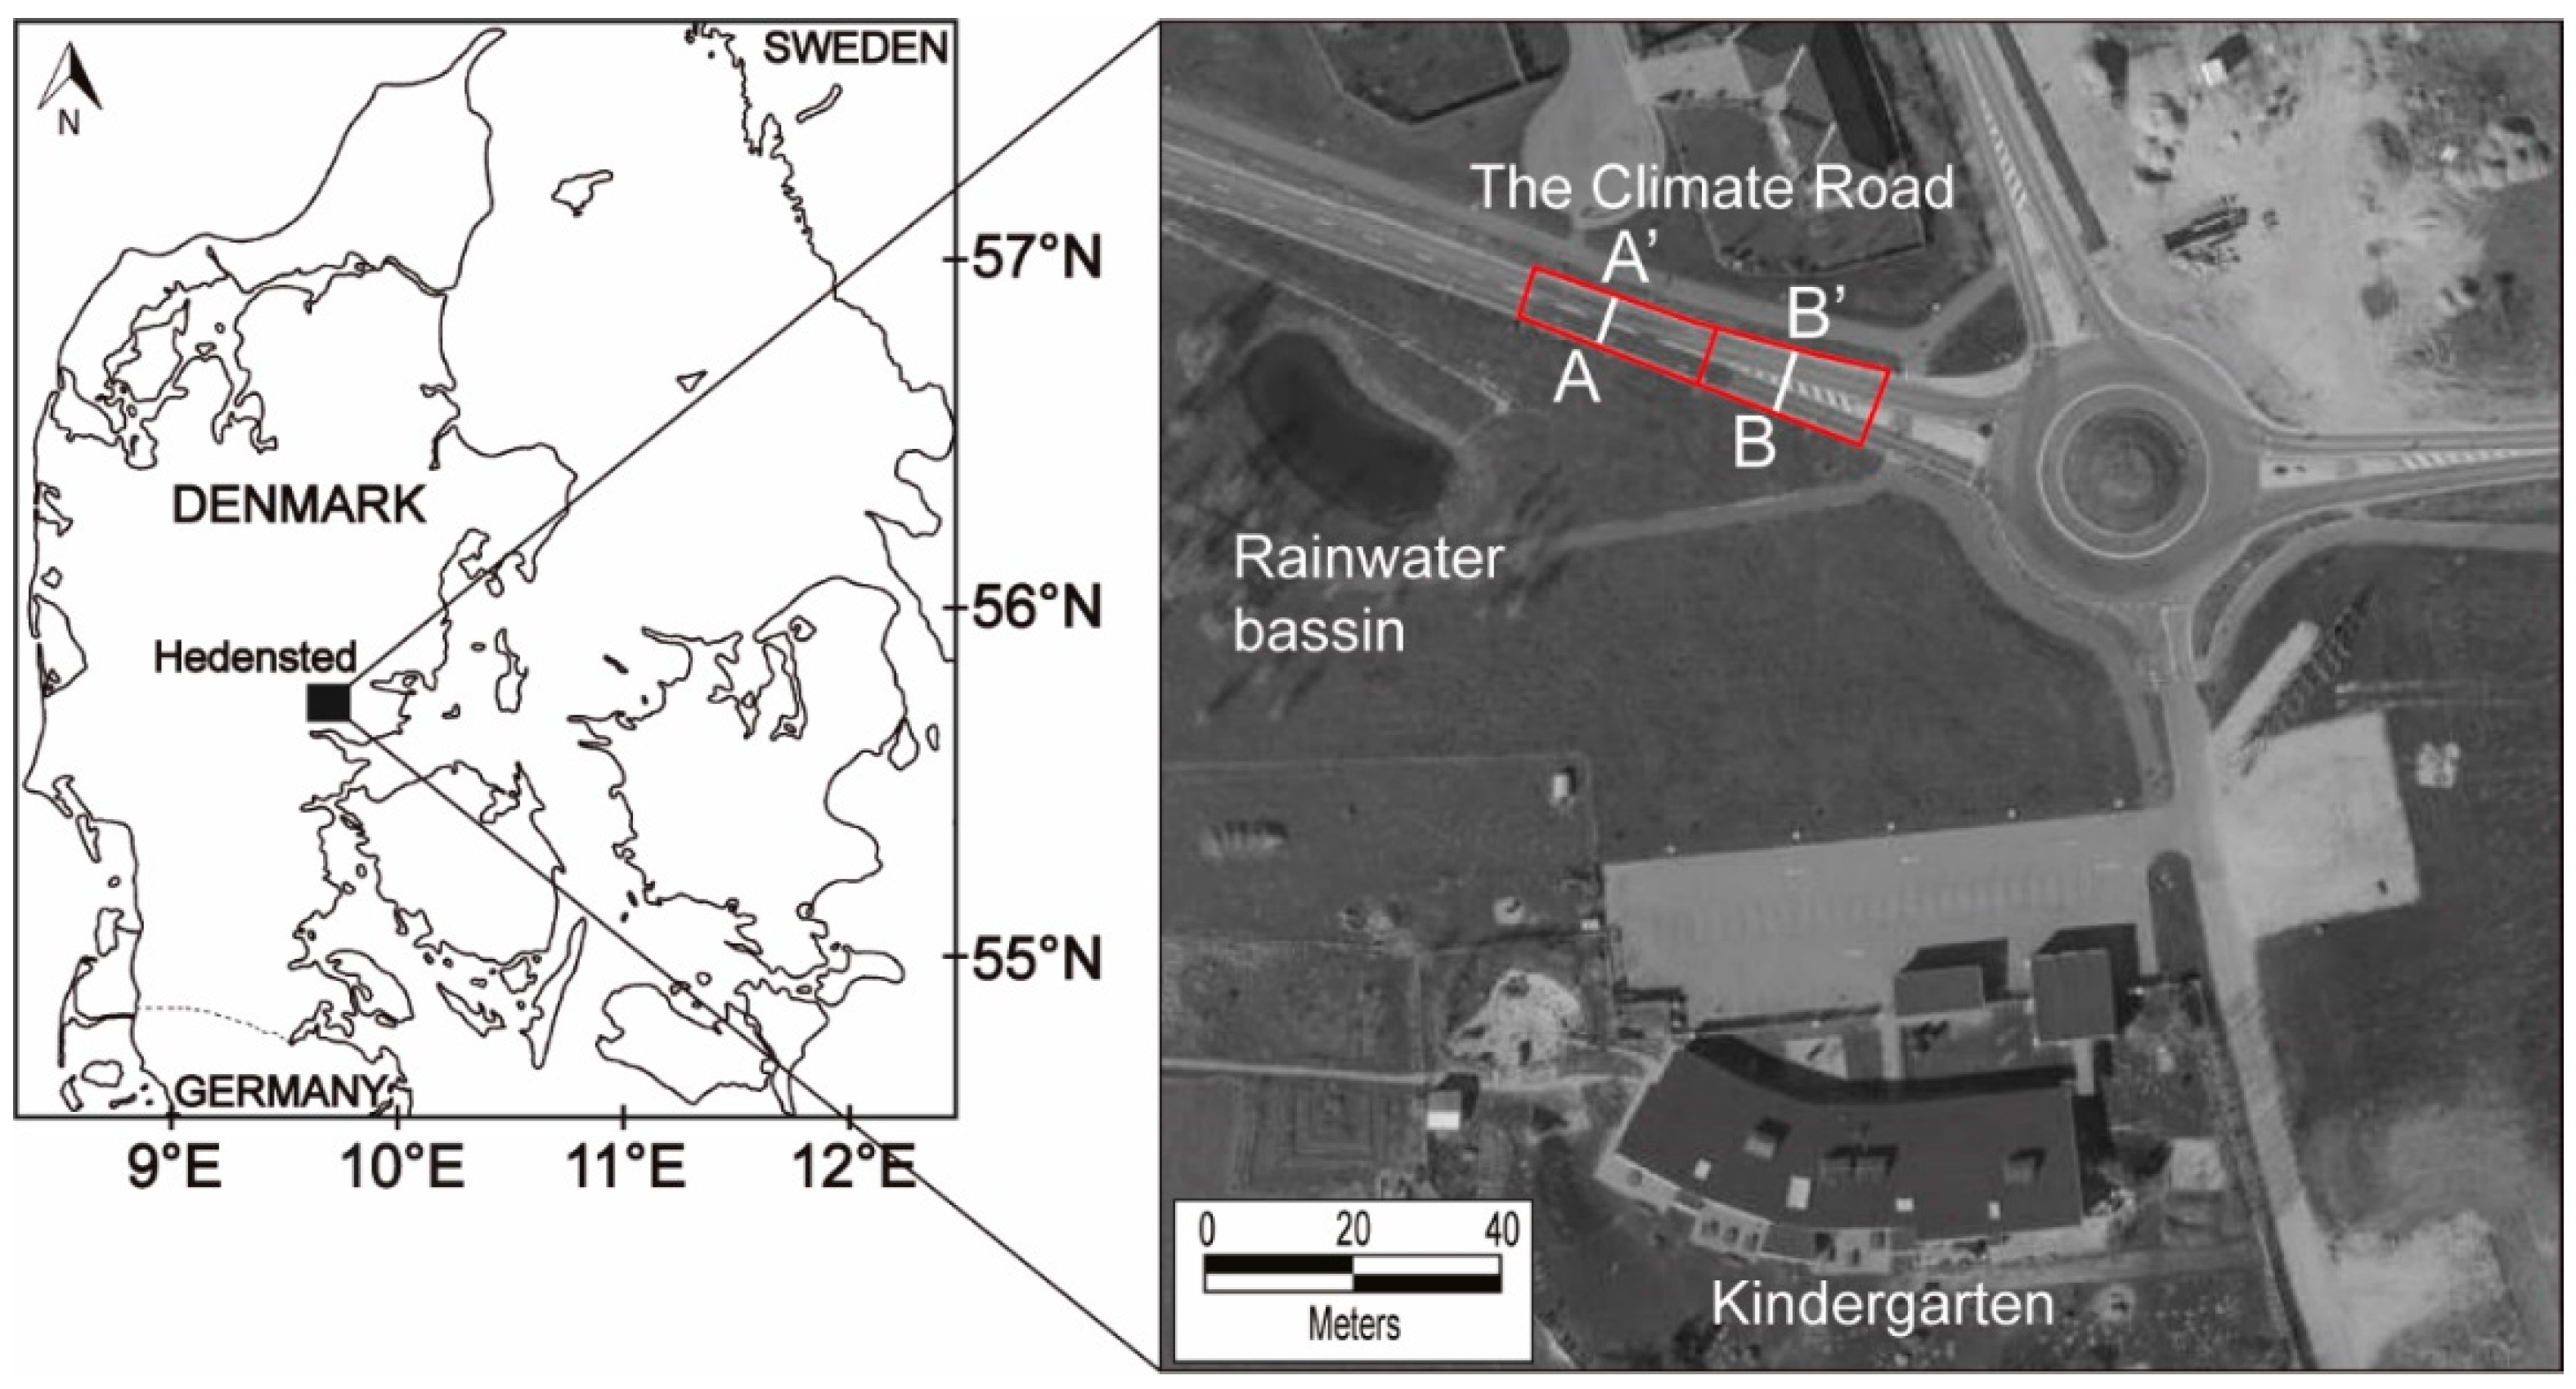
The full-scale demonstration was carried out in cooperation with the local county in Hedensted, Denmark, as part of the Coast to Coast Climate Challenge (C2C-CC) project under the EU Life program. The Climate Road replaces an existing 50 m stretch of road near Hedensted city, scheduled for a complete refurbishment. Moreover, the stretch of road is situated close to a kindergarten that is supplied by an existing GSHP using 1200 m of traditional horizontal collector pipes. The GSHP was disconnected from the existing heat collector and subsequently connected to the geothermal piping in the Climate Road. The location of the full-scale demonstration is shown in Figure 1.
Construction works began on 18 September 2017 and the Climate Road was put into operation on 23 March 2018.
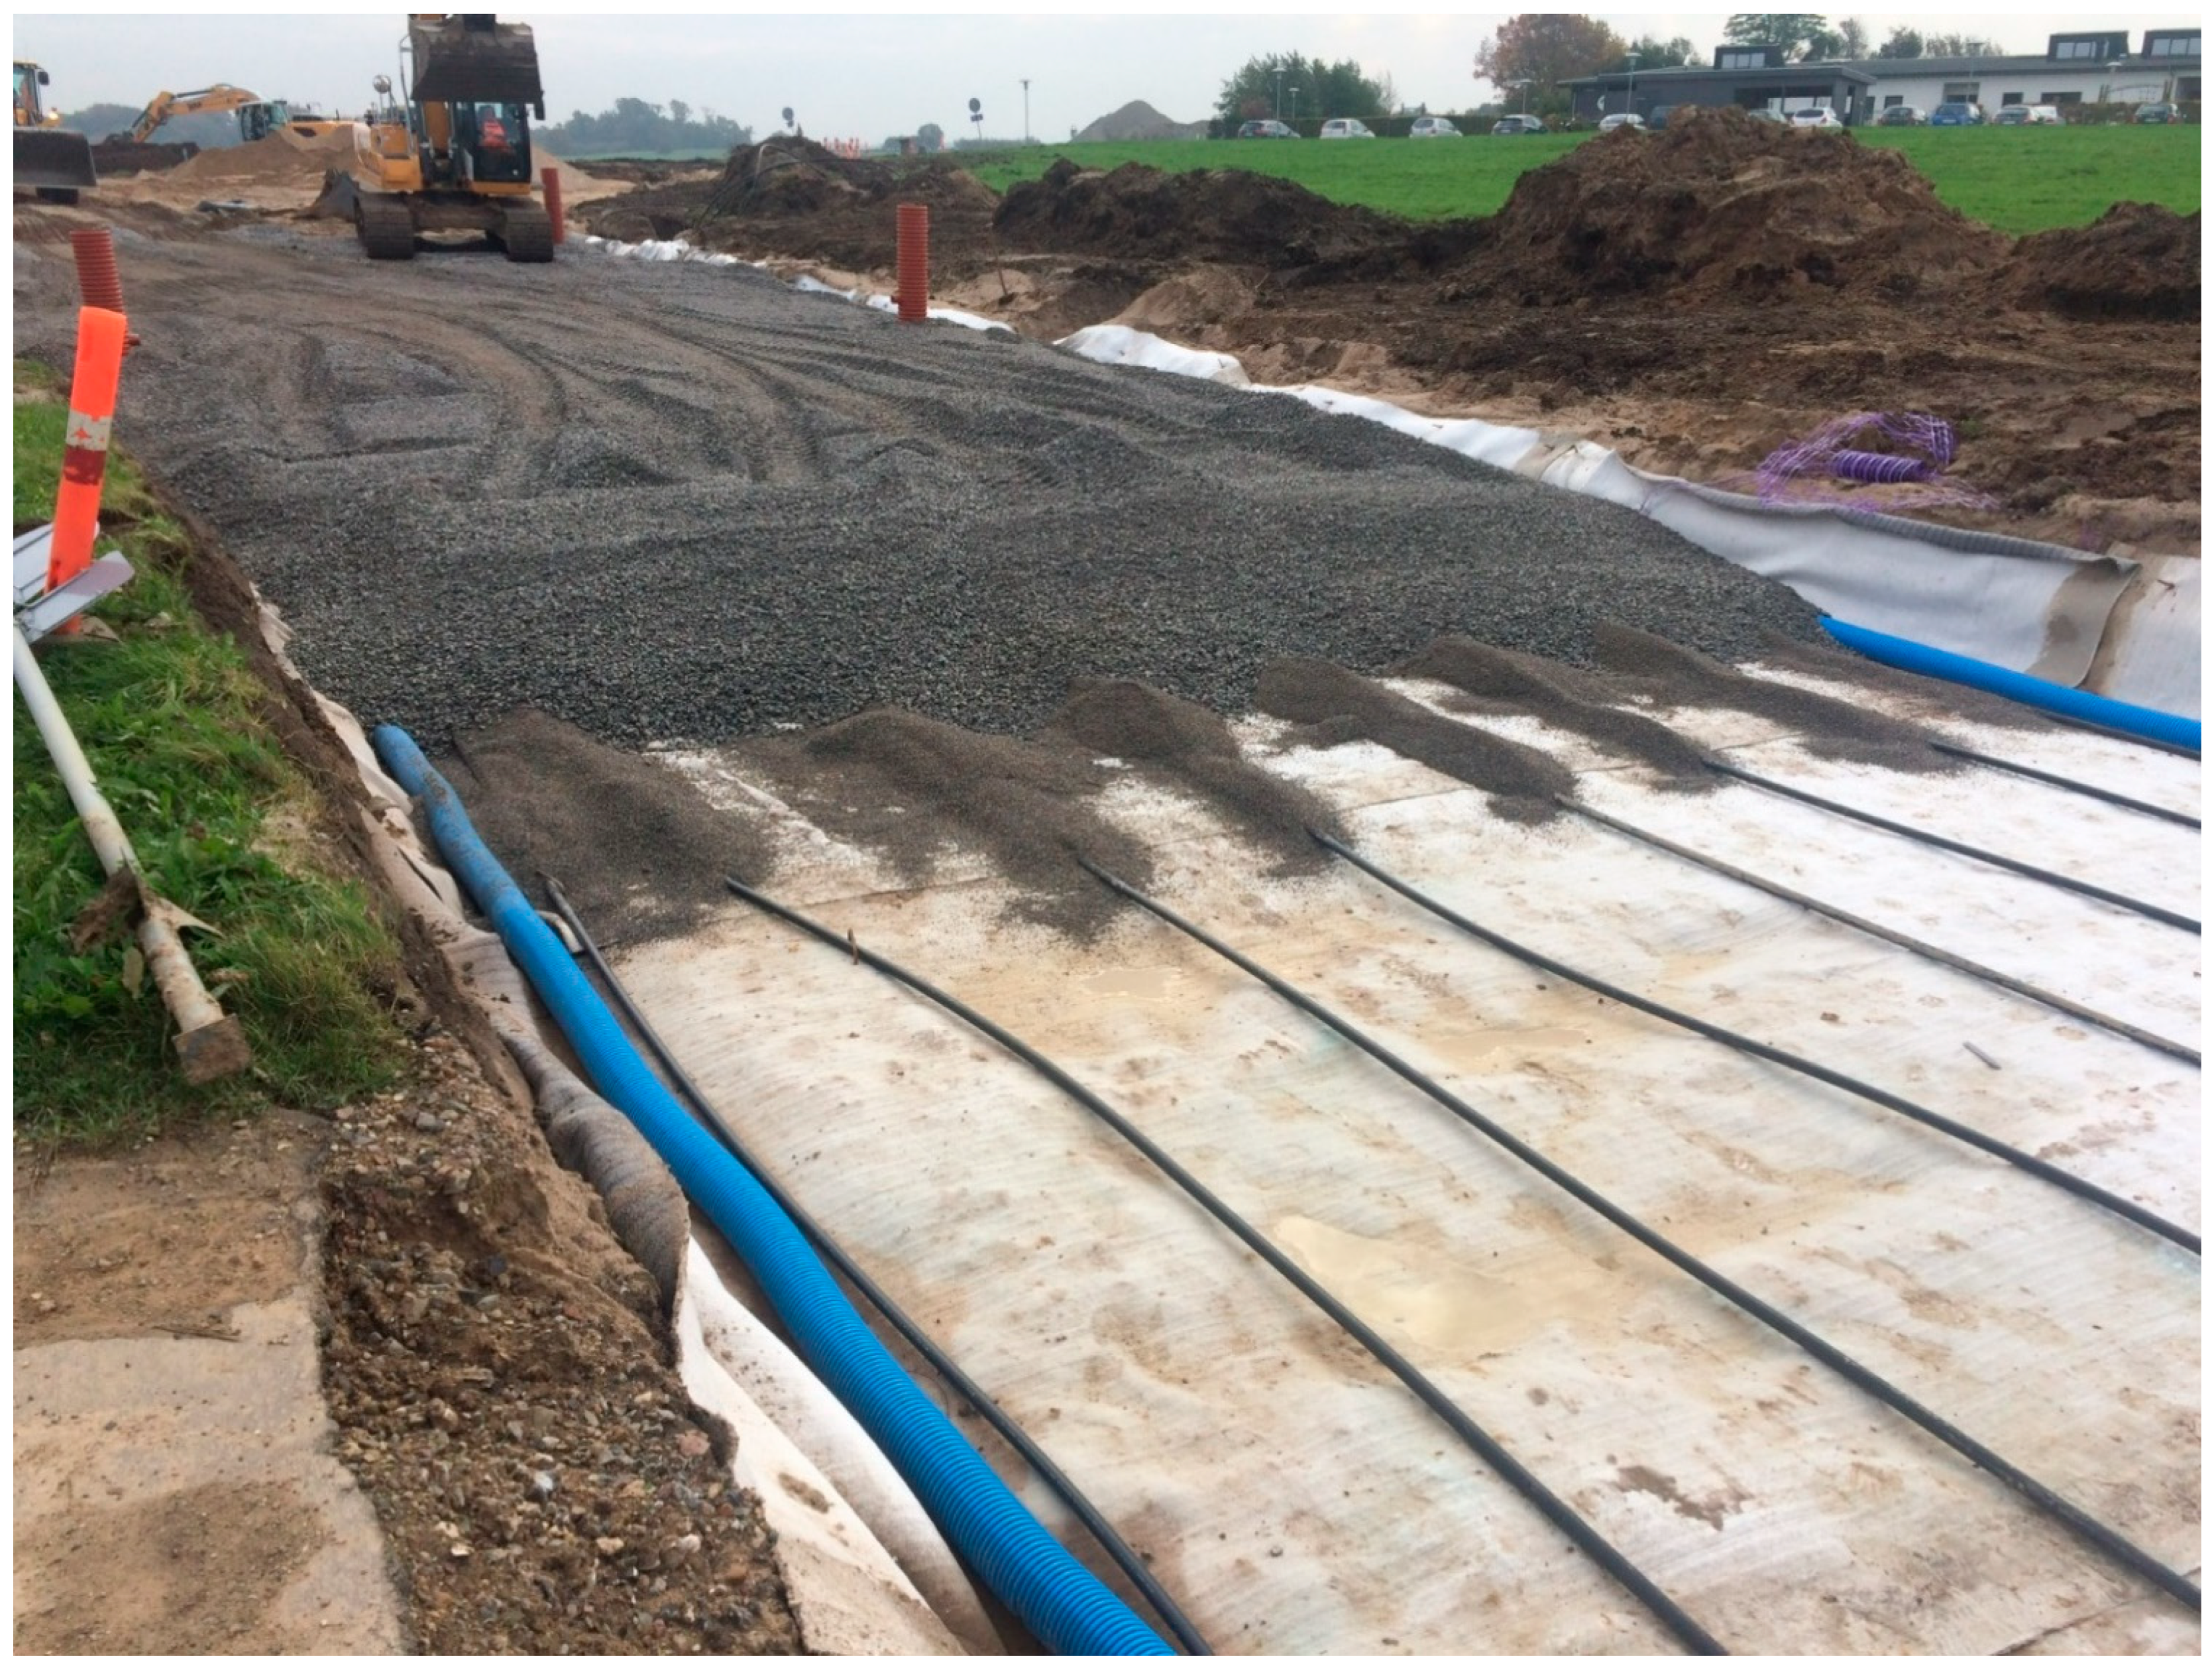
Initially, the existing asphalt was removed and excavations for the roadbed commenced. Once completed, the construction pit was lined with a bentonite membrane on the bottom and sides to ensure full hydraulic control of the retarding basin by preventing uncontrolled seepage of groundwater into the roadbed (white textile membrane under the pipes in Figure 2).
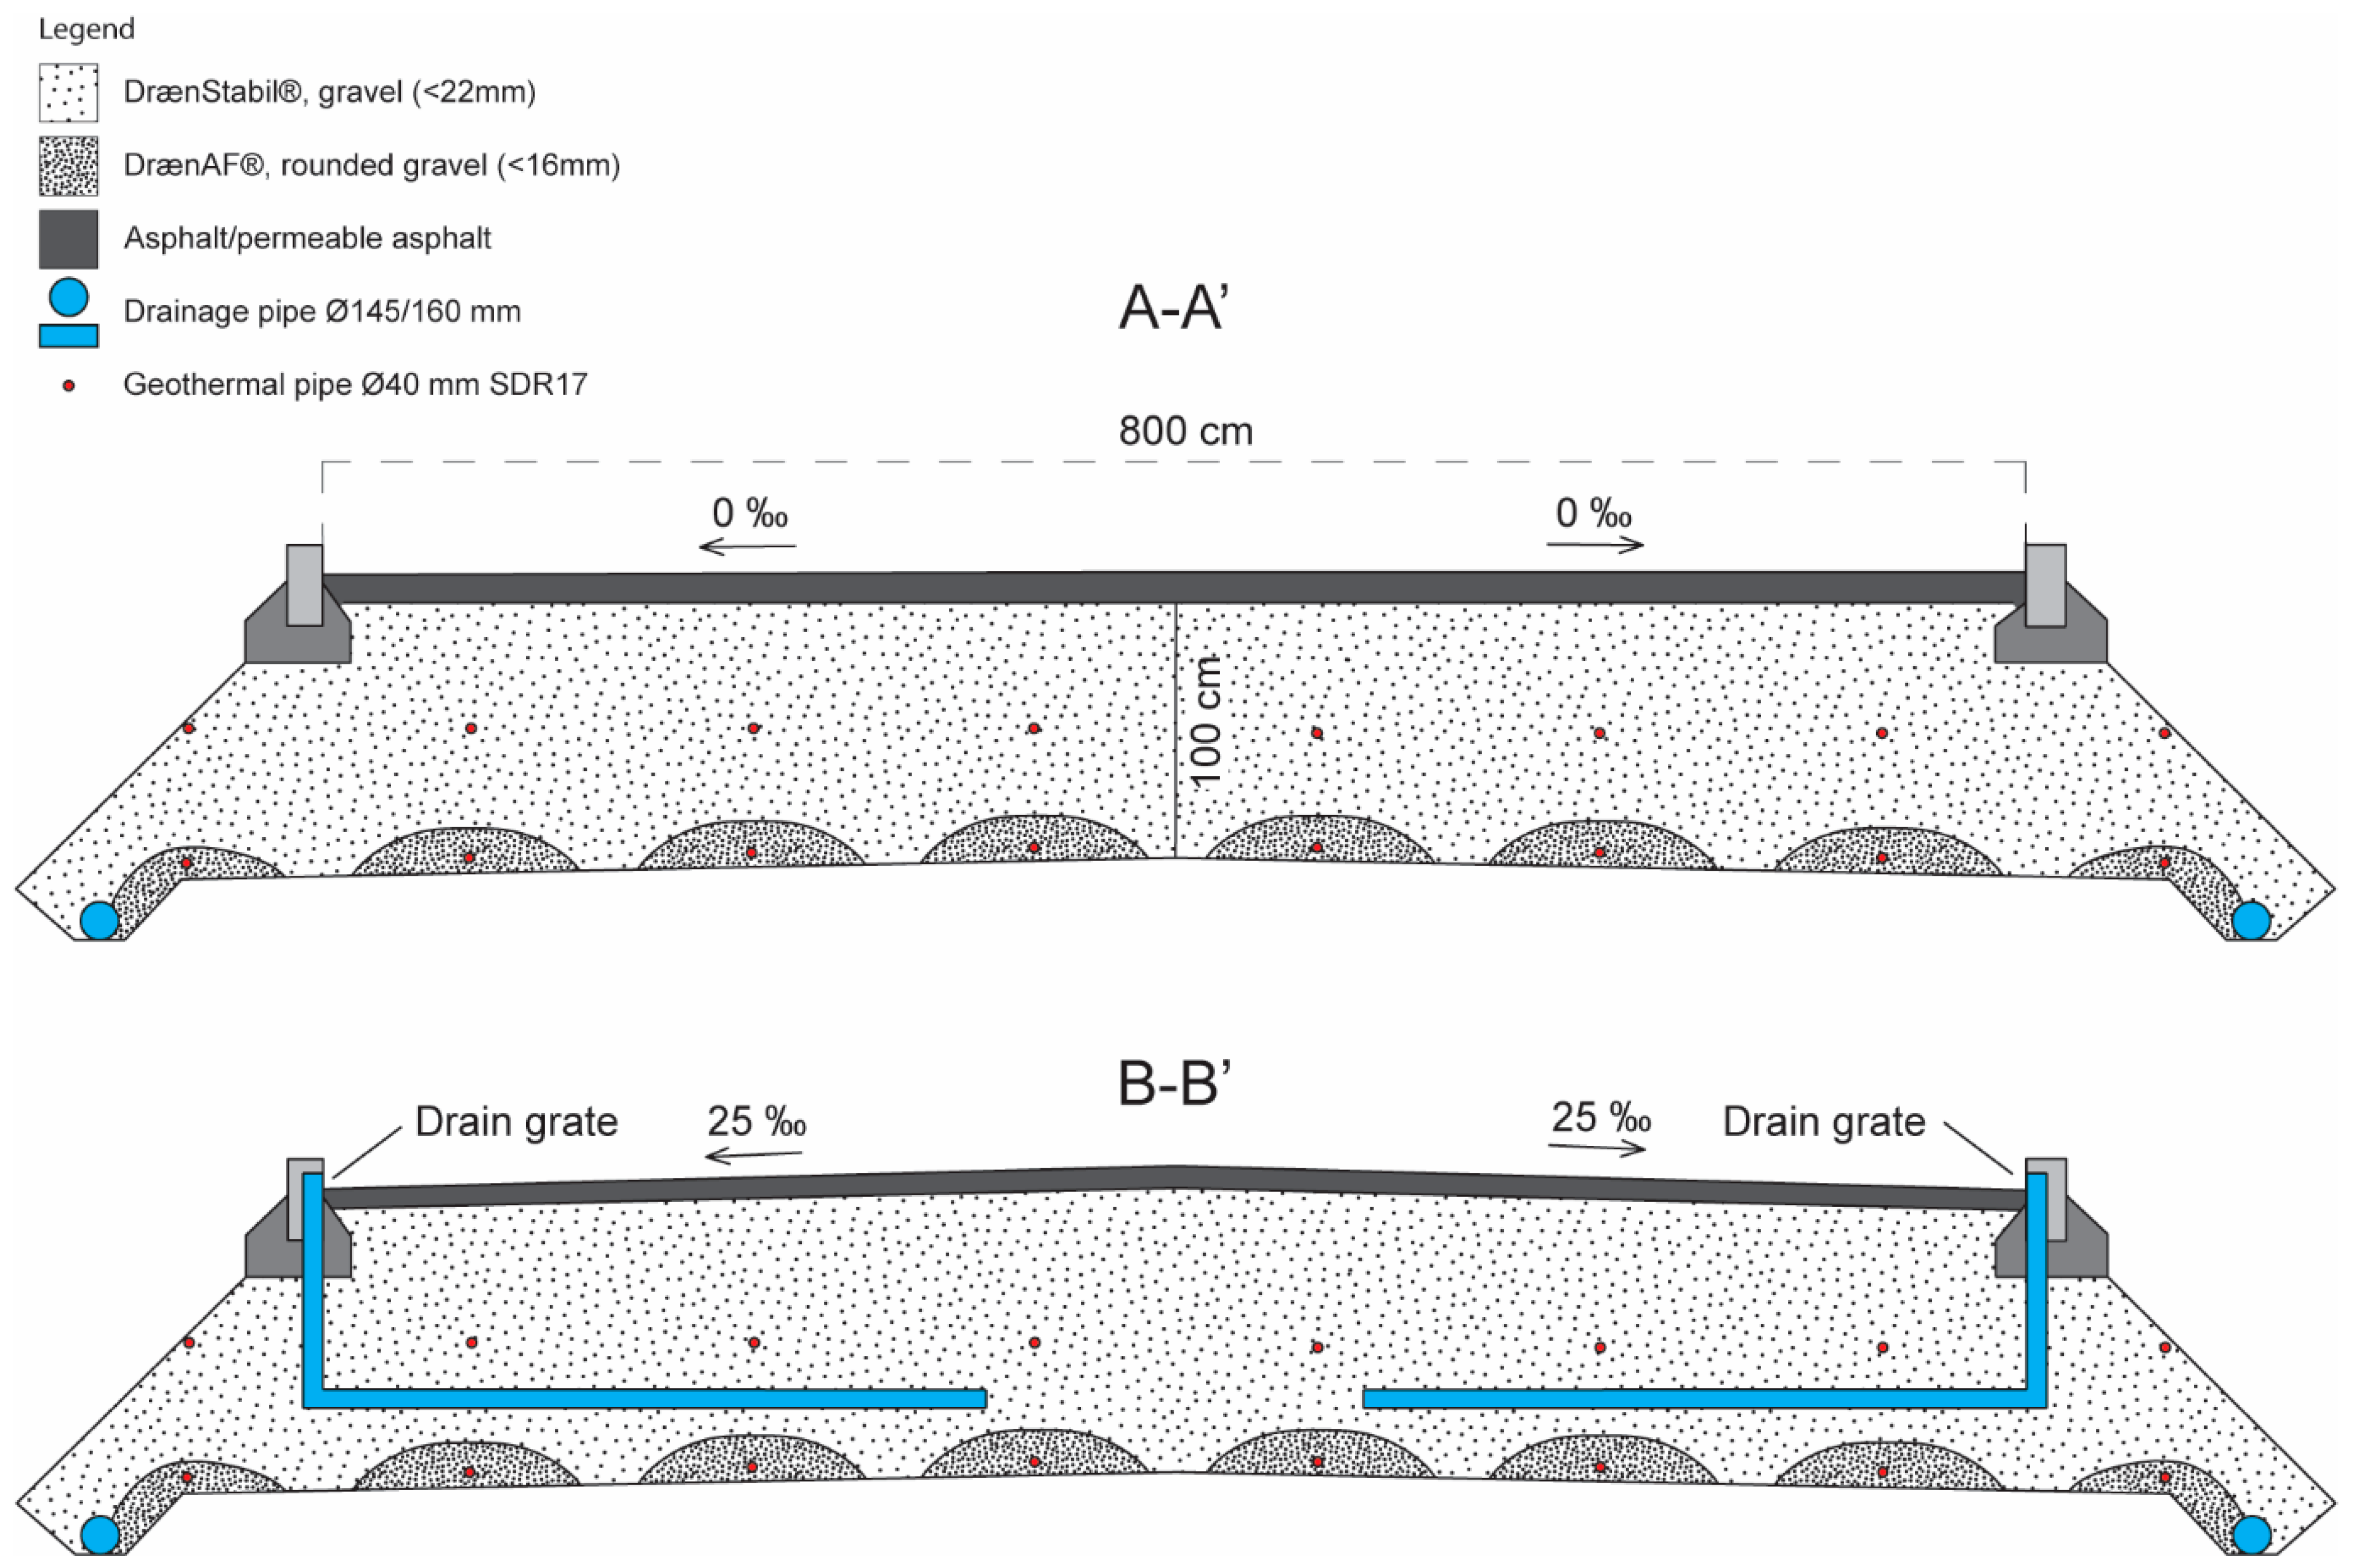
Ø160 mm drainage pipes with slits were then placed on top of the bentonite membrane in small trenches on the sides and ends of the pit (blue pipes in Figure 2). Two equally spaced 200 m Ø40 mm PE geothermal pipes were then placed on top of the bentonite membrane in a W-configuration and then covered with soft, rounded gravel (black pipes covered with small mounds of soft gravel in Figure 2). With the piping in place, construction of the roadbed commenced. The roadbed material consisted of well-sorted gravel from which all fine-grained material was removed to ensure high porosity. Moreover, the gravel was designed to preserve its structural integrity when fully saturated with water. Information pertaining to the construction materials is listed in Table 1.
Two additional 200 m W-configuration geothermal pipes were then placed 50 cm above the bottom of the roadbed in an identical manner to those placed on top of the bentonite membrane. Once the construction of the roadbed was complete, 25 m of the road were paved with permeable asphalt, allowing for vertical water flow directly through the pavement. The remaining 25 m were paved with traditional asphalt with drain grates in the roadsides, as shown in Figure 3.
The permeable asphalt (PermaGAB® from NCC, Solna, (Stockholm), Sweden) consists of crushed granite or similar gravel materials with a maximum grain size of 22 mm, mixed with a polymer modified bitumen, yielding a void porosity of 19–23%. A wear layer of PermaSLID® from NCC, Solna, (Stockholm), Sweden, similar to PermaGAB® in terms of composition and void porosity, but with smaller grains up to 16 mm, was paved on top of the PermaGAB®. The permeability of the permeable asphalt is >1 cm/s; however, clogging tends to occur over time and soil particles must be removed from the asphalt by a vacuum road sweeper once a year.
The roadbed was made to drain to a nearby basin for experimental reasons. In a commercial application, the roadbed drains to the existing wastewater network through a water brake that restricts discharge even during extreme precipitation events, where excess water is stored and thus delayed in the roadbed instead.

2.2. Temperature Model

A temperature model for the road should describe both the transport of heat between the fluid in the geothermal pipes and the surrounding sand and gravel, as well as the larger scale transport throughout the roadbed. Heat transport by conduction and advection in porous media (the roadbed in this case) is described by the partial differential equation [26]:
ρ s c s T s t = λ s 2 T s ρ f c f ( T s u d ) ,
where ρ s c s (J/m3/K) is the volumetric heat capacity of the roadbed gravel, T s (K) is the temperature in the roadbed, λ s (W/m/K) is the thermal conductivity, ρ f c f (J/m3/K) is the volumetric heat capacity of the fluid (water) in the pores, and u d (m/s) is the Darcy velocity vector. Equation (1) ignores the mechanical dispersion of heat and assumes instantaneous thermal equilibrium between the gravel matrix and the flowing groundwater. Moreover, the internal heat production in the porous medium (the source term) is assumed to be zero.

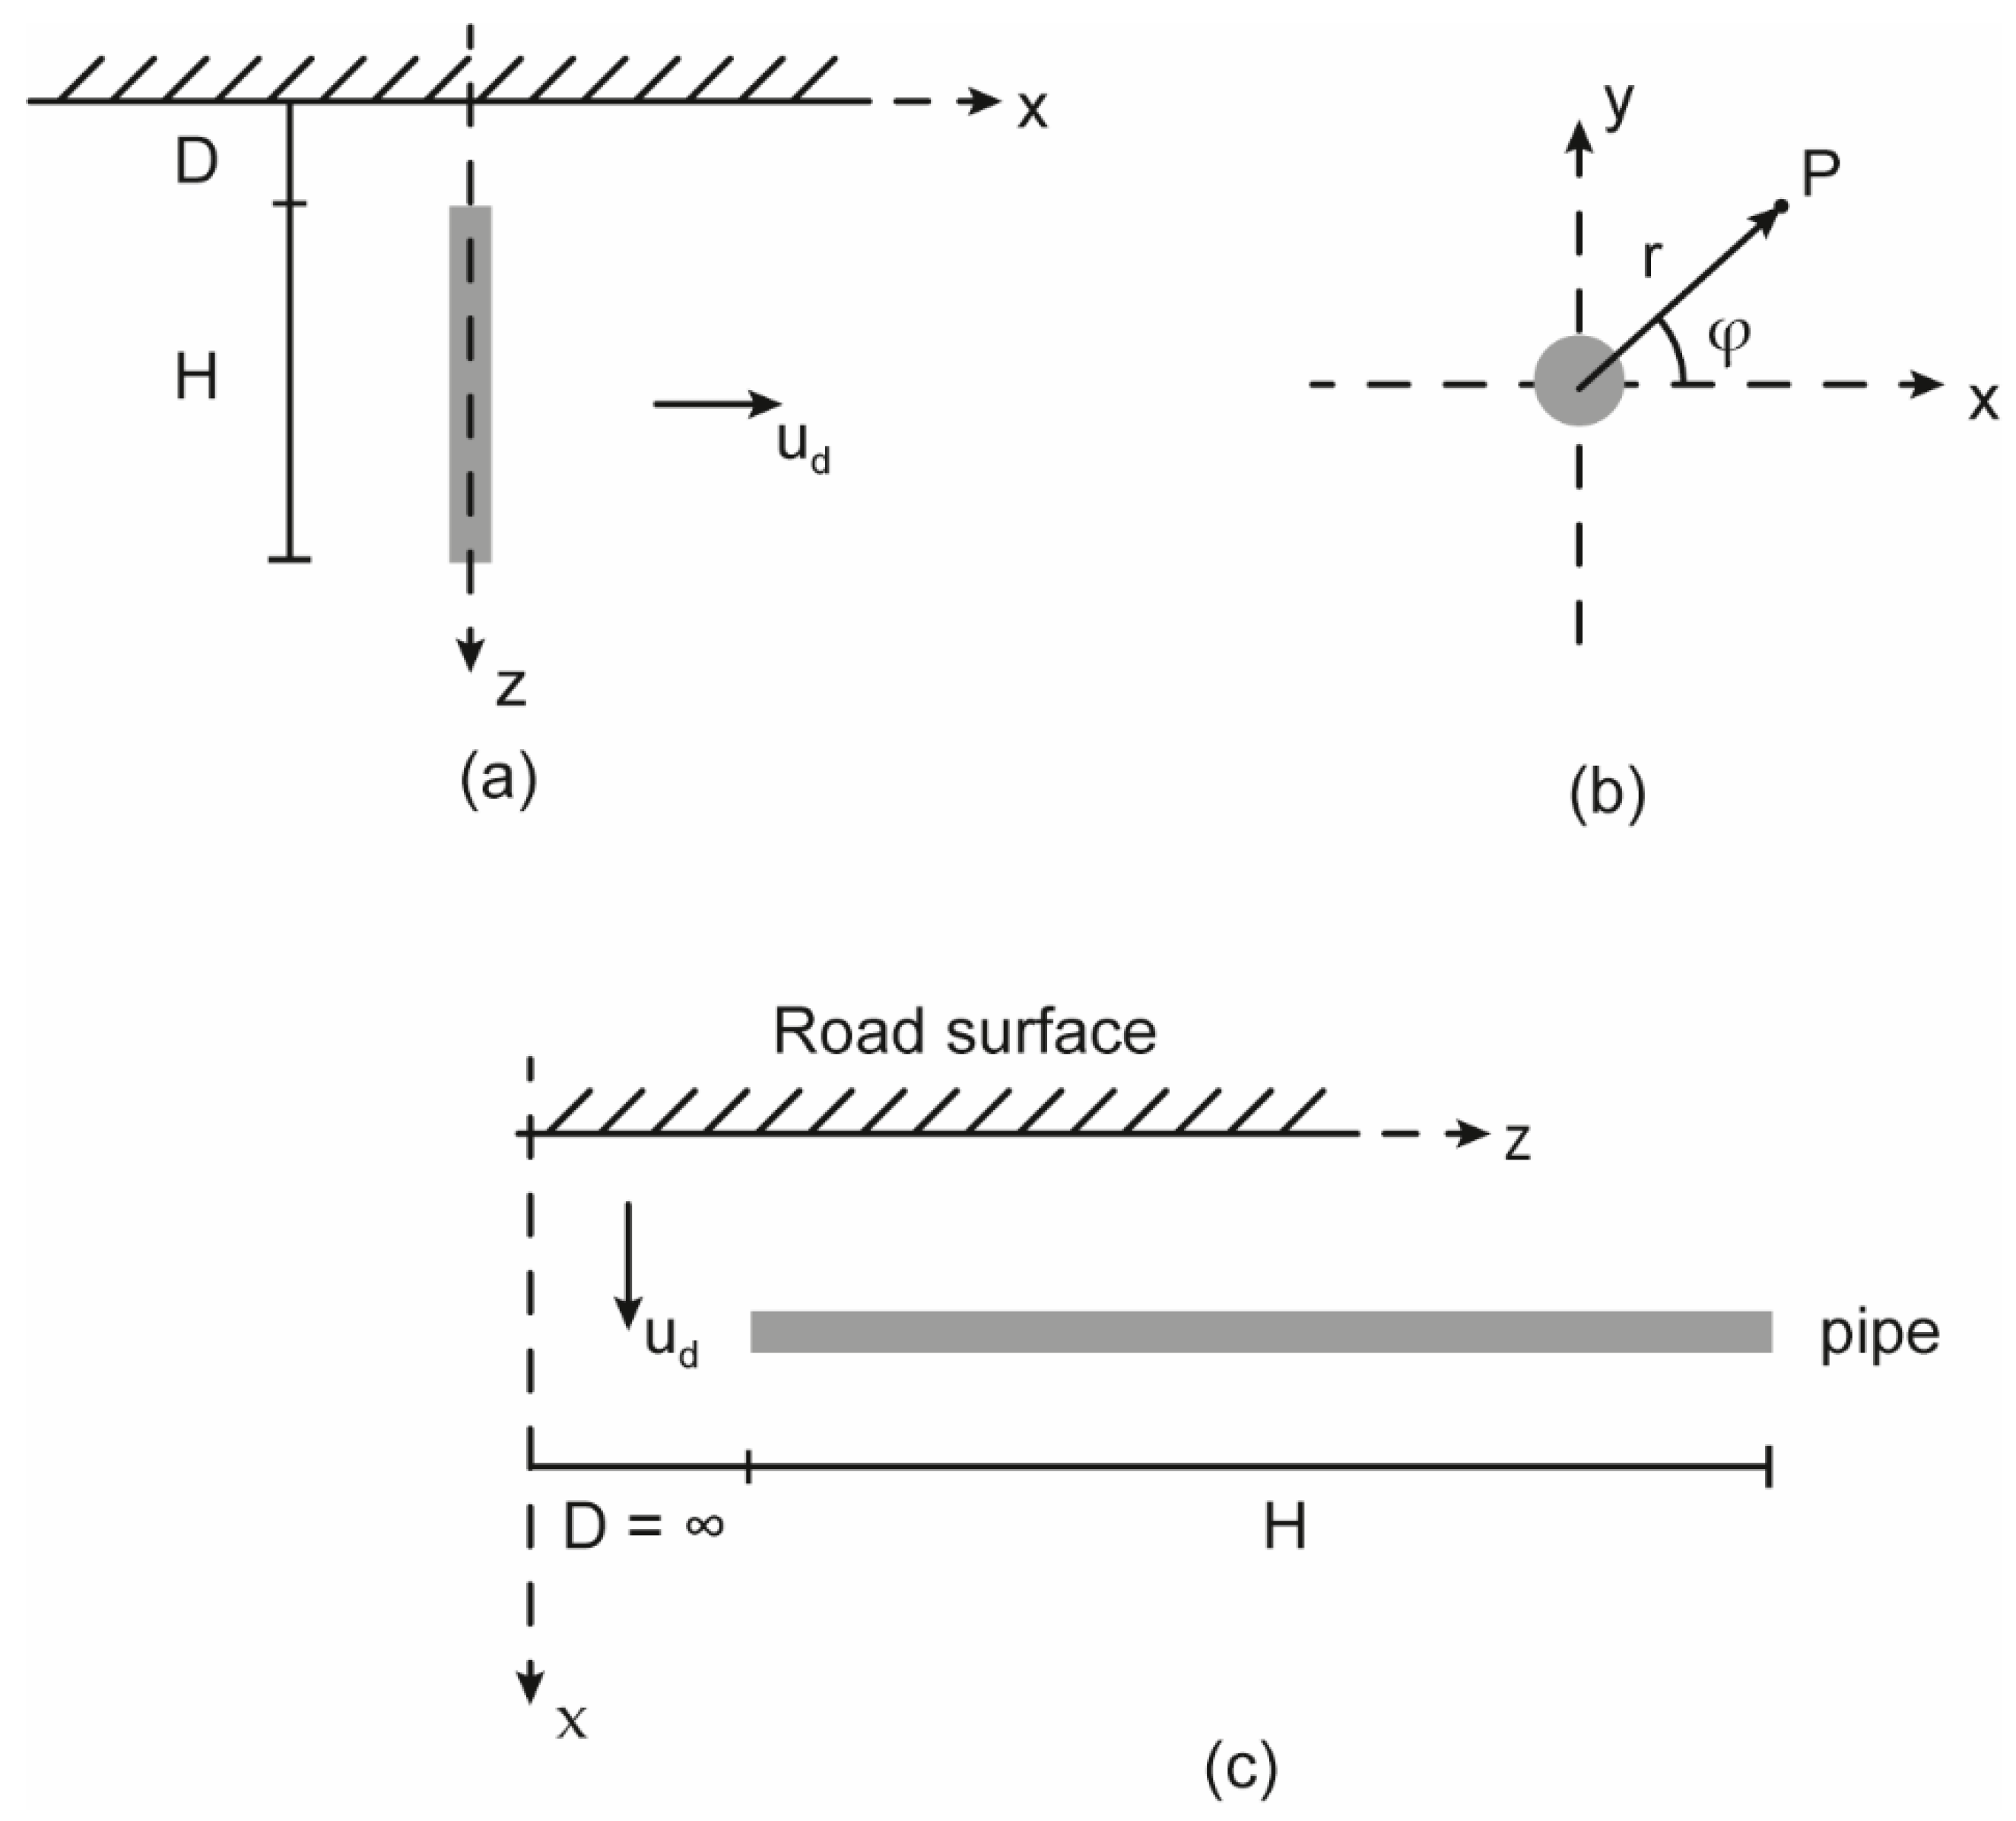
2.2.1. Single Pipe Model

Each of the four 200 m geothermal pipes is divided into four model segments, yielding 16 pipe segments in total (see Figure 3). Each segment is modelled as a finite line source under the influence of groundwater flow. We adapt the model developed by Guo et al. [27] for the radial temperature distribution from a single buried borehole heat exchanger (BHE), modelled as a vertical finite line source (see Figure 4a,b). Groundwater flow is considered to be one-dimensional along the x-axis, so the vector ud is reduced to the scalar ud in the following.
The temperature averaged over the length of the source is
T ¯ ( r , φ , t ) T u = q 4 π λ s exp ( r · cos φ · U 2 α s ) 1 / 4 α s t exp ( U 2 16 α s 2 s 2 r 2 · s 2 ) Fun ( Hs , Ds ) Hs 2 ds ,  
where T ¯ ( r , φ , t ) (K) is the temperature, T u (K) is the undisturbed temperature, q (W/m) is the thermal power transferred from the geothermal pipe fluid to the surrounding soil per unit length of pipe, U = ρ f c f ρ s c s · u d (m/s) is the effective thermal transfer velocity, α s (m2/s) is the thermal diffusivity, s = 1 / 4 α s t , H (m) is the length of the pipe, and D (m) is the burial depth.
The function under the integral is
Fun ( Hs , Ds ) = 2 · ierf ( Hs ) + 2 · ierf ( Hs + 2 Ds ) ierf ( 2 Hs + 2 Ds ) ierf ( 2 Ds ) ,
where ierf is the integral of the error function
ierf ( x ) = x · erf ( x ) 1 π [ 1 exp ( x 2 ) ] ,
The model was initially developed for vertical borehole heat exchangers (BHEs), where burial depth refers to the distance between the top of the BHE and the ground surface (see Figure 4a). In the present case, the geothermal pipes are placed horizontally with vertical infiltration. Therefore, the distance D effectively becomes infinite (see Figure 4c). The corresponding limit in Equation (3) is
lim D Fun ( Hs , Ds ) = 2 · ierf ( Hs ) ,
Disregarding the boundary condition at the road surface for now, Equation (2) finally becomes
T ¯ ( r , φ , t ) T u = q 4 π λ s exp ( r · cos φ · U 2 α s ) 1 / 4 α s t exp ( U 2 16 α s 2 s 2 r 2 · s 2 ) 2 · ierf ( Hs ) Hs 2 ds ,
At the outer wall of the pipe (r = rp), the temperature averaged over the circumference of the pipe (i.e., the average over the φ coordinate) becomes
T ¯ p T u = q 4 π λ s · I 0 ( r p U 2 α s ) 1 / 4 α s t exp ( U 2 16 α s 2 s 2 r p 2 s 2 ) 2 · ierf ( Hs ) Hs 2 ds ,
where I 0 is a modified Bessel function of the first kind. The dimensionless part of Equation (7) represents the step response, or g function, of the pipe.
T ¯ p T u = q 4 π λ s g p ( t ) ,
Similarly, for the temperature in the roadbed (i.e., at r > rp) from Equation (6),
T ¯ ( r , φ , t ) T u = q 4 π λ s g s ( r , φ , t )

2.2.2. Multiple Pipe Model

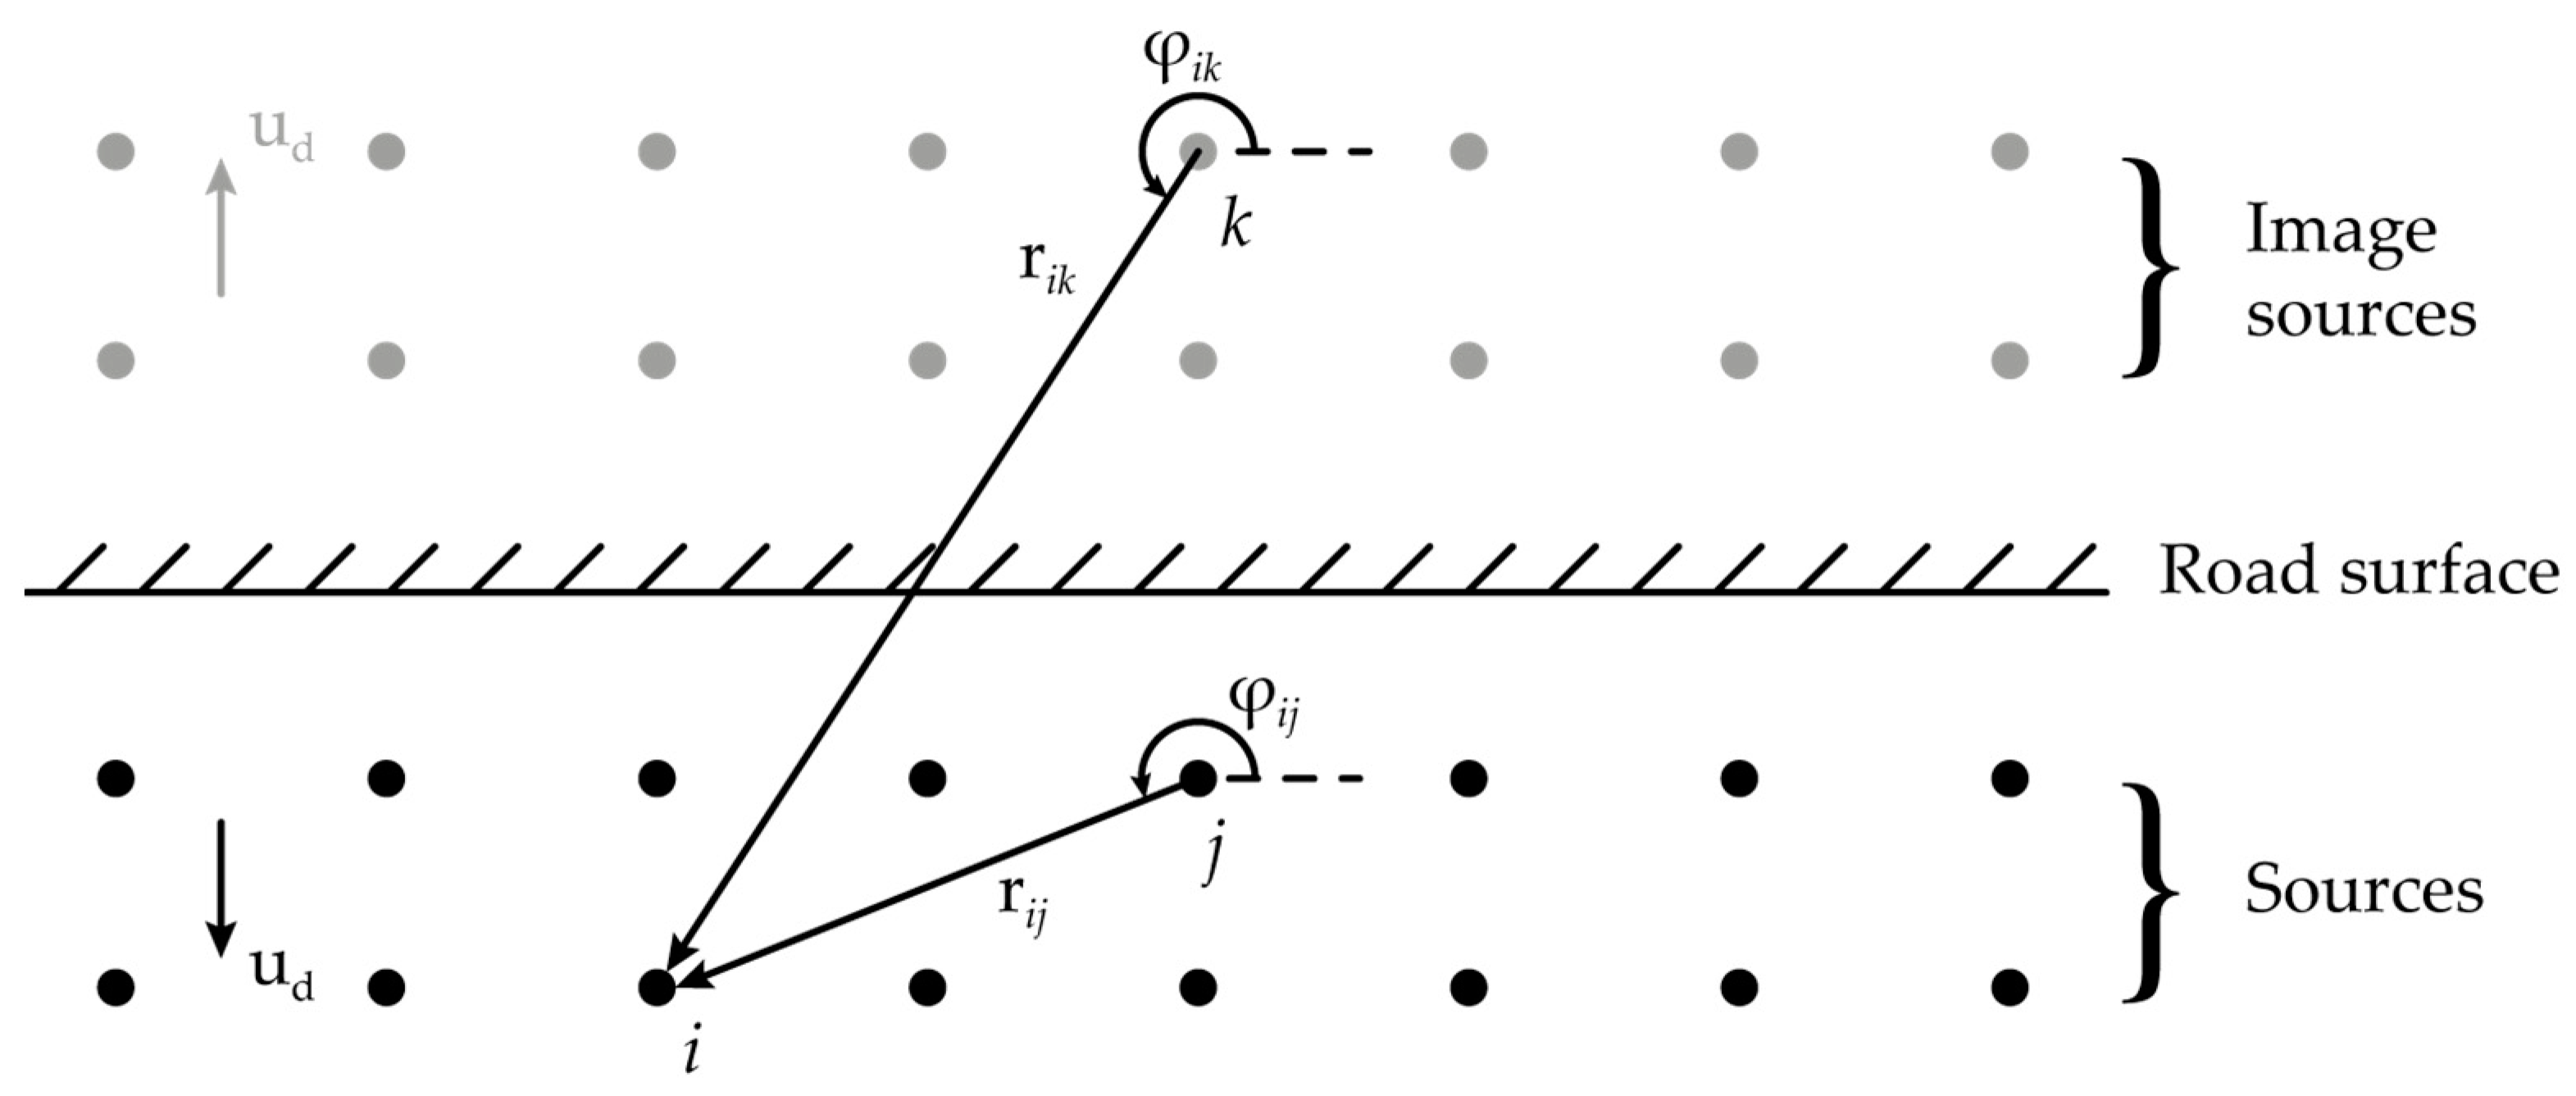
The 800 m of geothermal pipe in the Climate Road are modelled as 16 pipe segments, as described in Section 2.2.1. For simplicity, we assume equal thermal loads q for each segment. In order to enforce a boundary condition at the road surface we use the method of images and include a mirror source for each pipe, as indicated in Figure 5. The average pipe wall temperature response for the 16 pipe segments is
g p ave ( t ) = 1 N p i = 1 N p ( g p , i ( t ) + j i g s , j ( r ij , φ ij , t ) + w k = 1 N p g s , k ( r jk , φ ik , t ) ) ,
where Np = 16 is the number of pipes, g p , i ( t ) is the wall step response for the i’th pipe segment, g s , j ( r ij , φ ij , t ) is the temperature response in the road at the position of the i’th pipe from the j’th pipe, and g s , k ( r ik , φ ik , t ) is the temperature response at the position of the i’th pipe from the k’th mirror source.
The weight w determines the boundary condition at the road surface:
d dx Δ T rs ¯ = 0   for   w = 1 ,
Δ T rs ¯ = 0   for   w = 1 ,
For w = 1 the road surface is adiabatic; that is, there is no heat transport across the road surface. Conversely, for w = −1 the road surface is an infinite reservoir ensuring that temperature changes incurred by the GSHP at the road surface are always zero. Intermediate values imply a scaled heat flux at the road surface.
The evolution in the average brine temperature is calculated by temporal superposition of individual temperature responses from variations in the thermal load, the undisturbed temperature profile, and the thermal resistance of the geothermal pipe:
T b ¯ ( x , t ) = T u ( x , t ) + i = 0 N t 1 ( q i + 1 q i ) [ 1 4 π λ s g p ave ( t t i ) + R p ] ,
where Nt is the number of time steps to reach time t and q0 = 0 W/m. The time step is set uniformly to 24 h in all simulations and all measured data are aggregated accordingly.

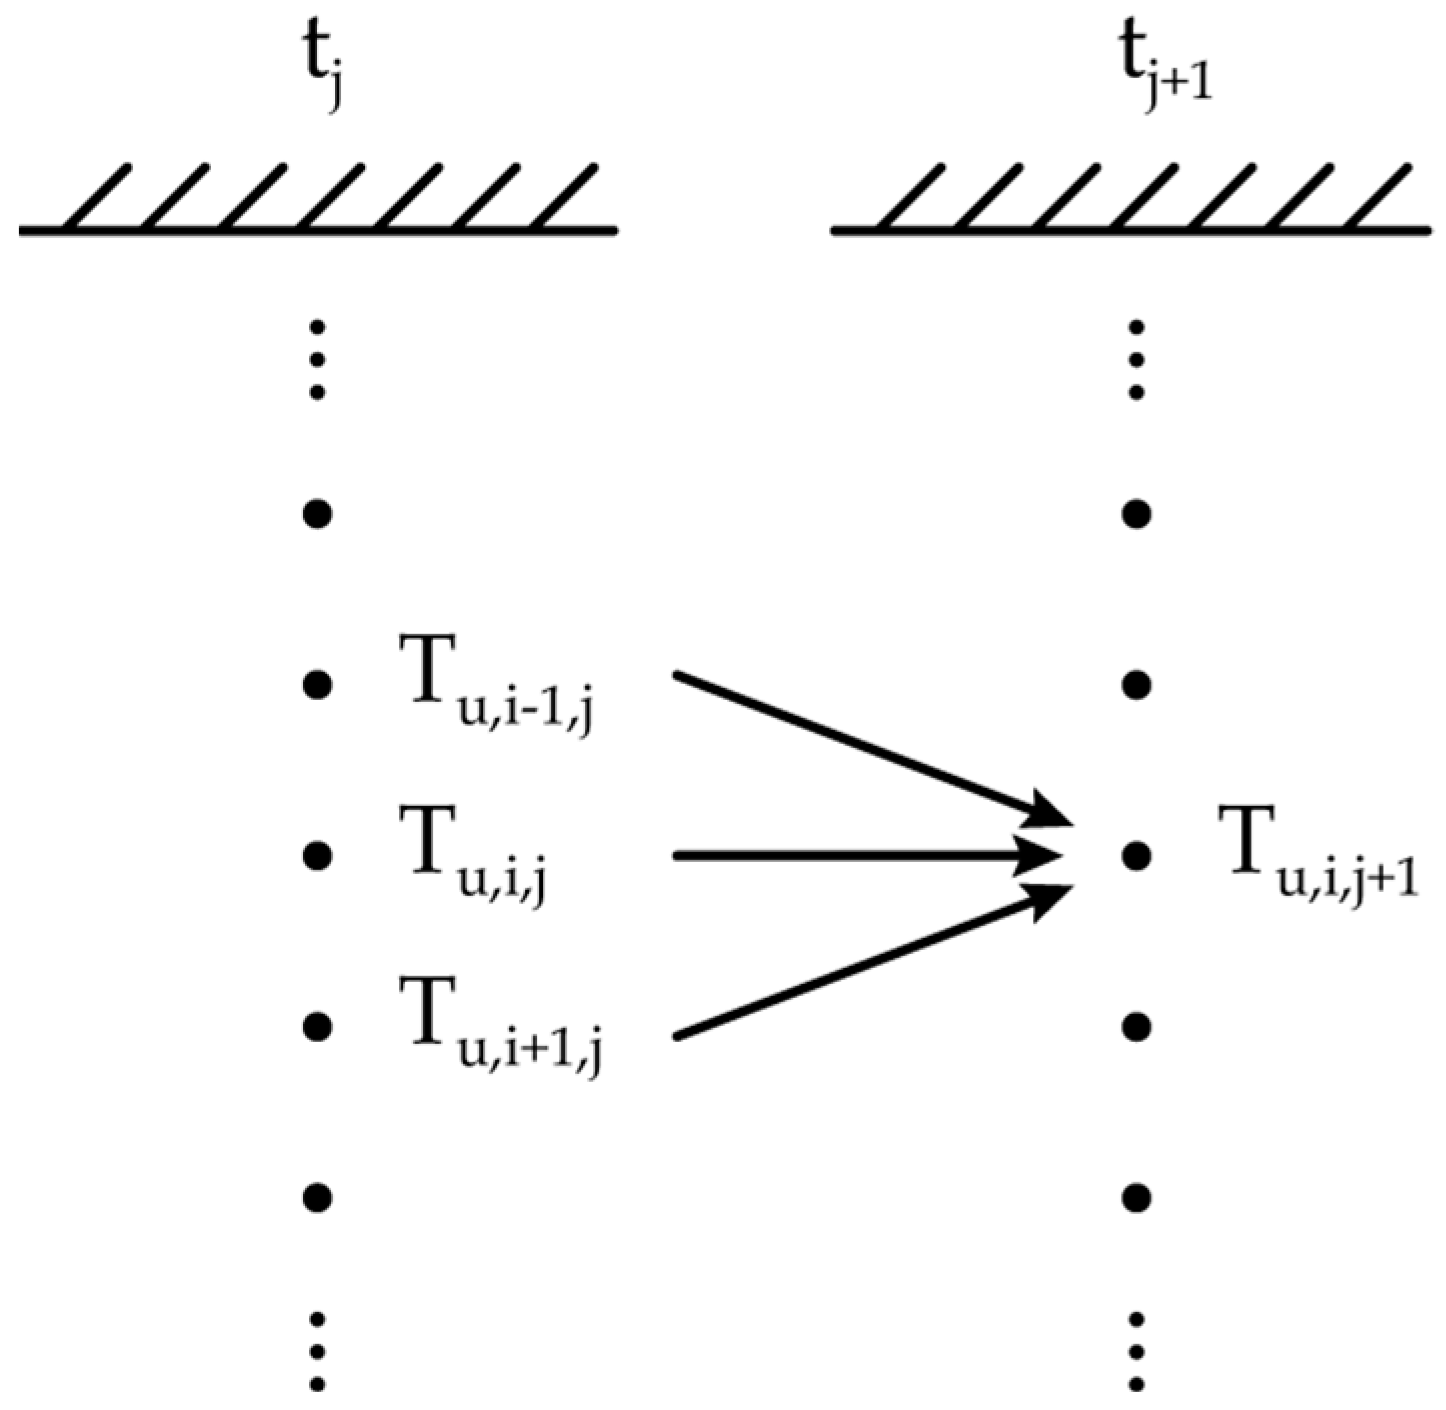
2.2.3. Undisturbed Temperatures

As indicated in Equation (13), the temperature of the roadbed during operation is calculated by superposition of the seasonal variations in roadbed temperatures and the temperature change incurred by GSHP heat extraction. The undisturbed roadbed temperature Tu(x,t) is estimated by a 1D numerical Crank–Nicolson finite difference discretization of Equation (1) that adequately captures the propagation of the road surface temperature variations into the subsurface [28]. The scheme is unconditionally stable for any combination of time and space discretization and is second-order accurate in time. The temperature T u , i , j at model node i and timestep j (see Figure 6) is calculated from the preceding timestep according to
0.5 KT u , i 1 , j + 1 + ( 1 + K ) T u , i , j + 1 0.5 KT u , i + 1 , j + 1 = 0.5 KT u , i 1 , j + ( 1 K ) T u , i , j + 0.5 KT u , i + 1 , j ,
where
K = ( α s Δ x + U ) Δ t Δ x
Equation (14) yields a linear system of equations for the temperature at all model nodes at each time step
C · T u , j + 1 = T u , j ,
where the vector T u , j contains the temperature at all model nodes at timestep j.
The tridiagonal coefficient matrix C is square due to specified temperature boundary conditions at the top and bottom of the model. The matrix is inverted by Gaussian elimination in MATLAB 2021a (software from Mathworks, Natick, MA, USA) using the built-in LU decomposition to obtain temperatures T u , j + 1 .
The numerical model extends to 50 m depth and is discretized into 5000 model layers with a uniform thickness of 1 cm. The time step is 360 s. The duration of the simulation is 1135 days for validation using observed temperatures, whereas for long-term projections, a period of 30 years is considered.
The initial temperatures in the roadbed are calculated from the following analytical equation that considers a sinusoidal variation in the surface temperature prior to road construction [29]:
T u ( x , t = 0 ) = 8.5 ° C + A · exp ( x ω 2 α s ) · cos ( ω t x ω 2 α s ) ,
where A (K) is the amplitude of surface temperature variation, and ω (rad/s) is the angular velocity of the temperature variation.
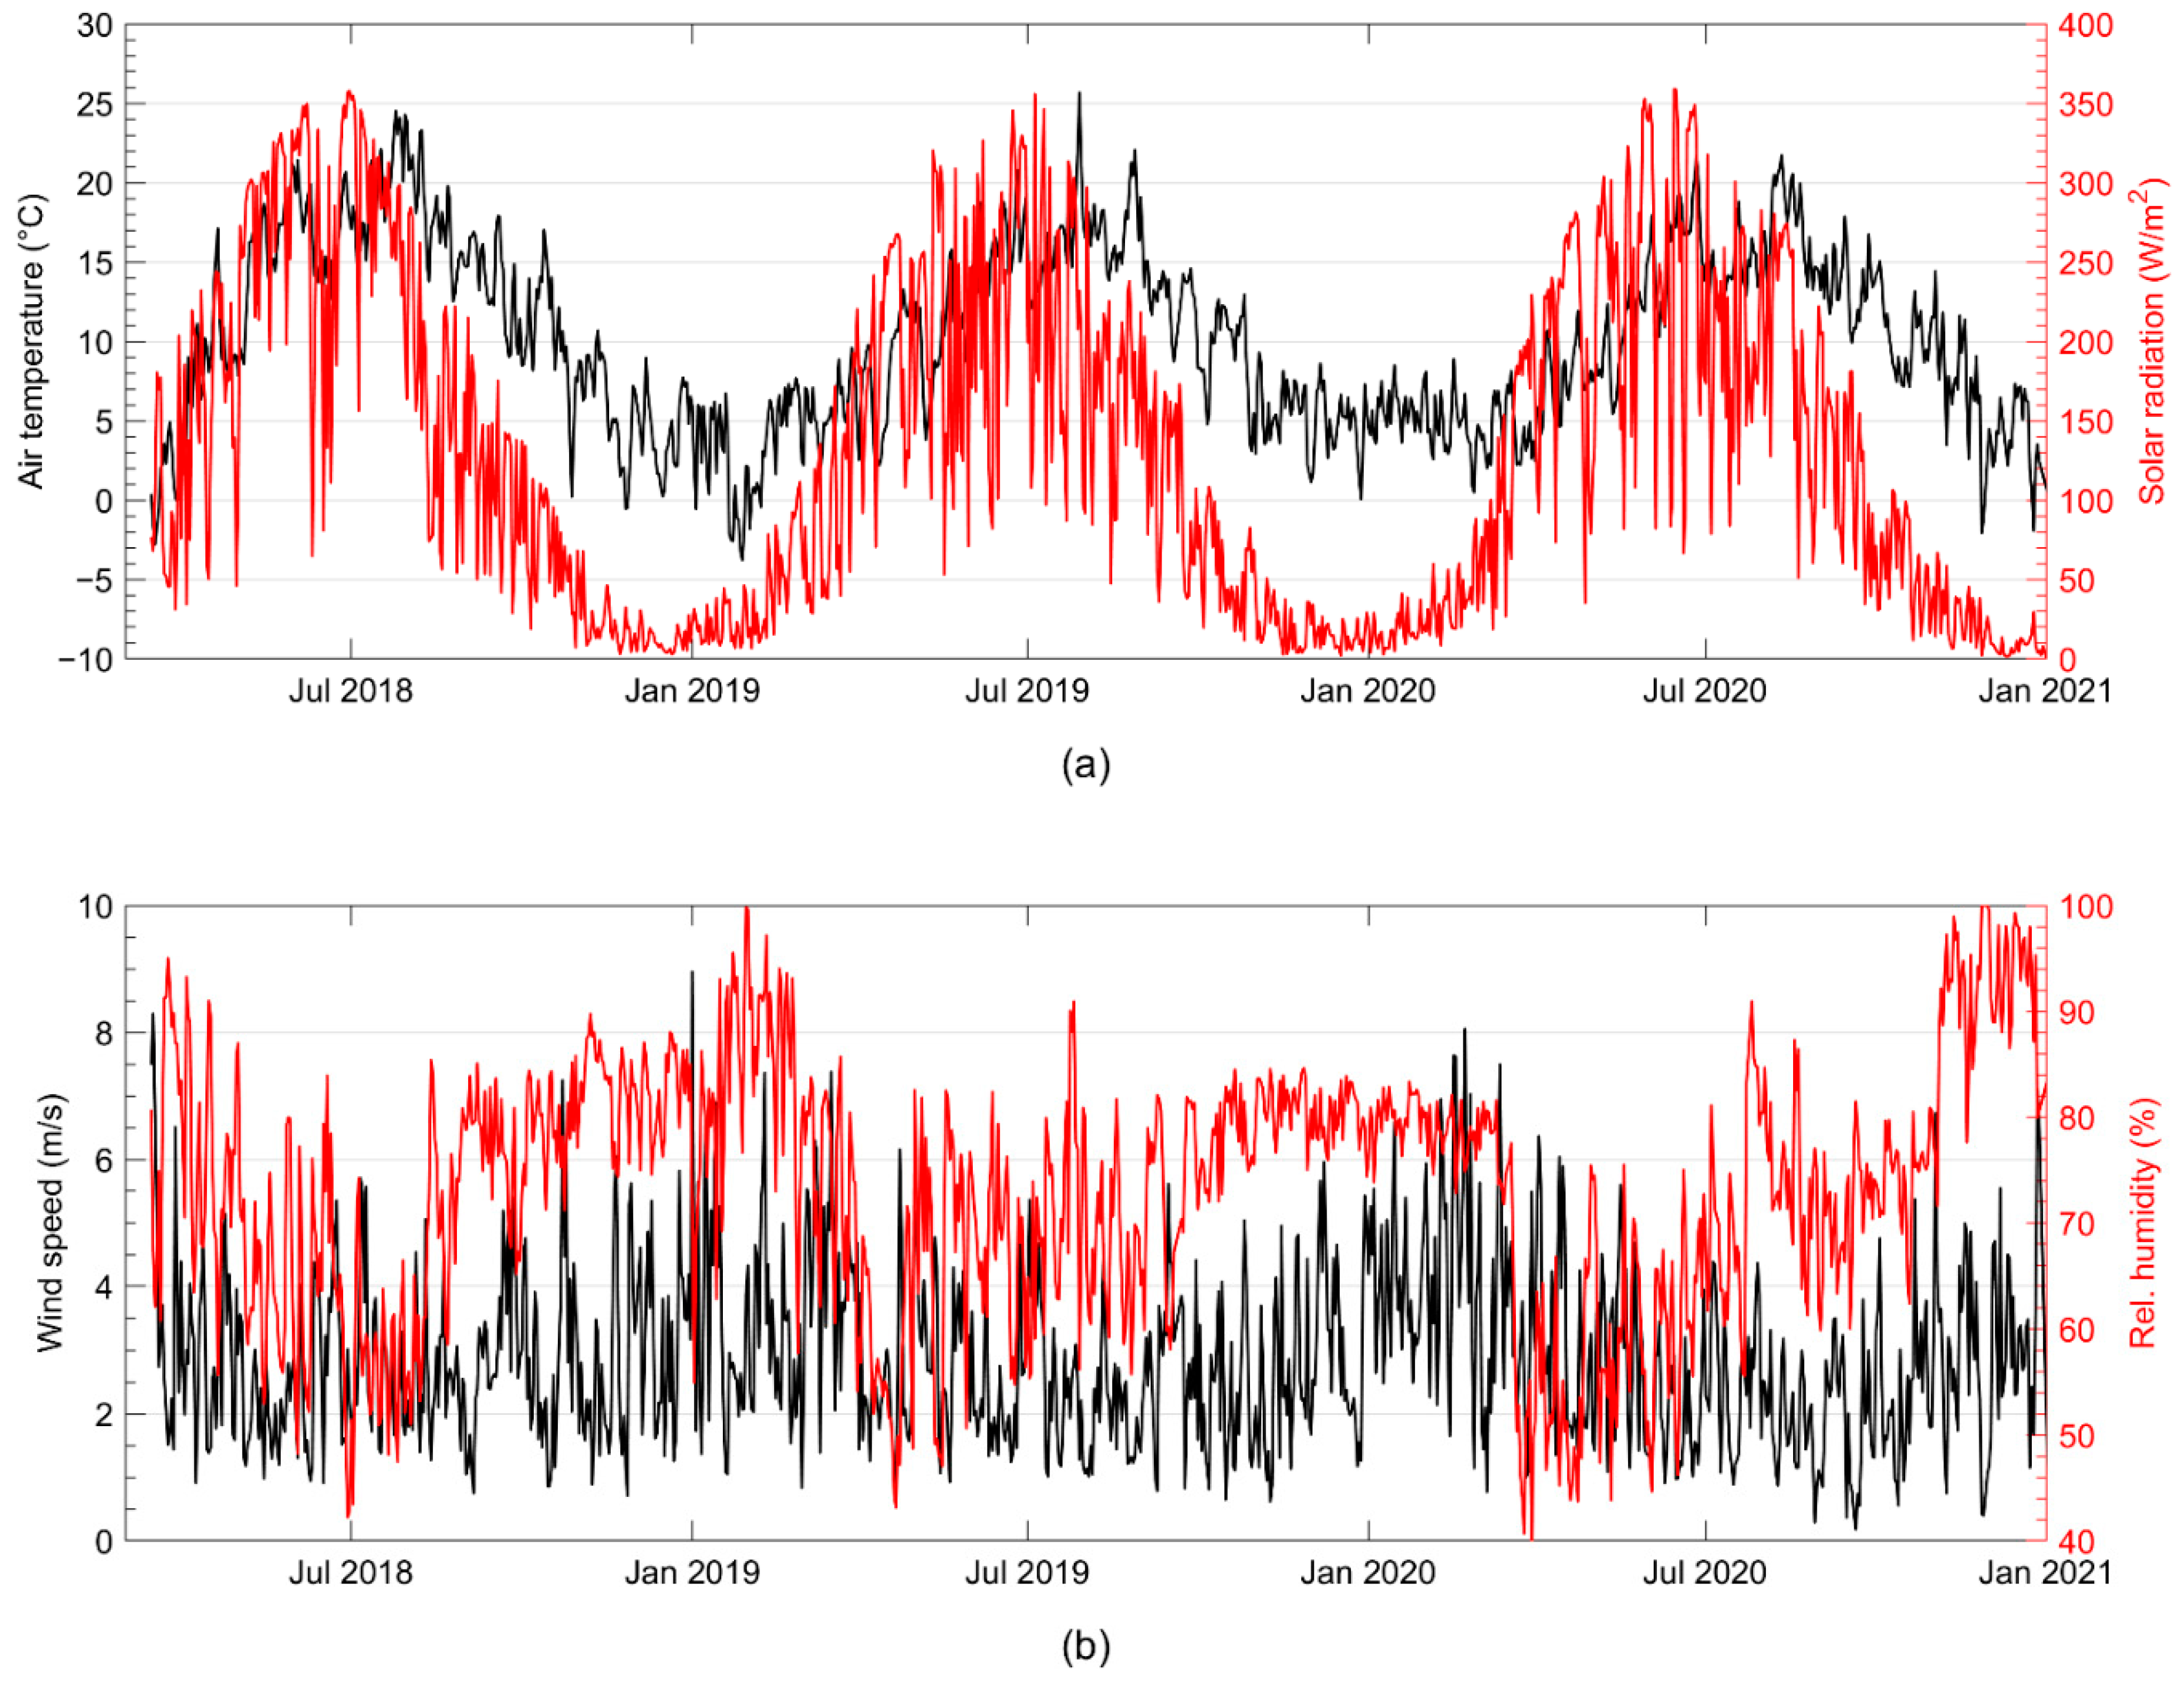
The temperature boundary condition at the top of the model (x = 0) is set equal to the road surface temperature, which is calculated from the empirical equation suggested by [30] Equation (1) from the wind speed, ambient temperature, relative humidity, and solar radiation.
The temperature boundary condition at the bottom of the model is set equal to the undisturbed value of Tu(x = 50 m,t) = 8.9 °C, as estimated by [31].
When calculating the brine temperature from Equation (13), we use the simplifying assumption that we can consider the average step response of the 16 pipes. This requires a single value for the background temperature Tu(x,t). As half of the pipes are buried at depth x = 50 cm and half at x = 100 cm, we calculate the temperature at both depths using the finite difference model in Equation (14) and use the arithmetic mean when calculating the brine temperature from Equation (13).

2.2.4. Model Parameters

The model parameters are either table values or fitted from operational data, as described in the following. The volumetric heat capacity of the roadbed gravel is ρ s c s = 2.6 MJ/m3/K, and the volumetric heat capacity of the rainwater permeating the roadbed is ρ f c f = 4.186 MJ/m3/K [32].
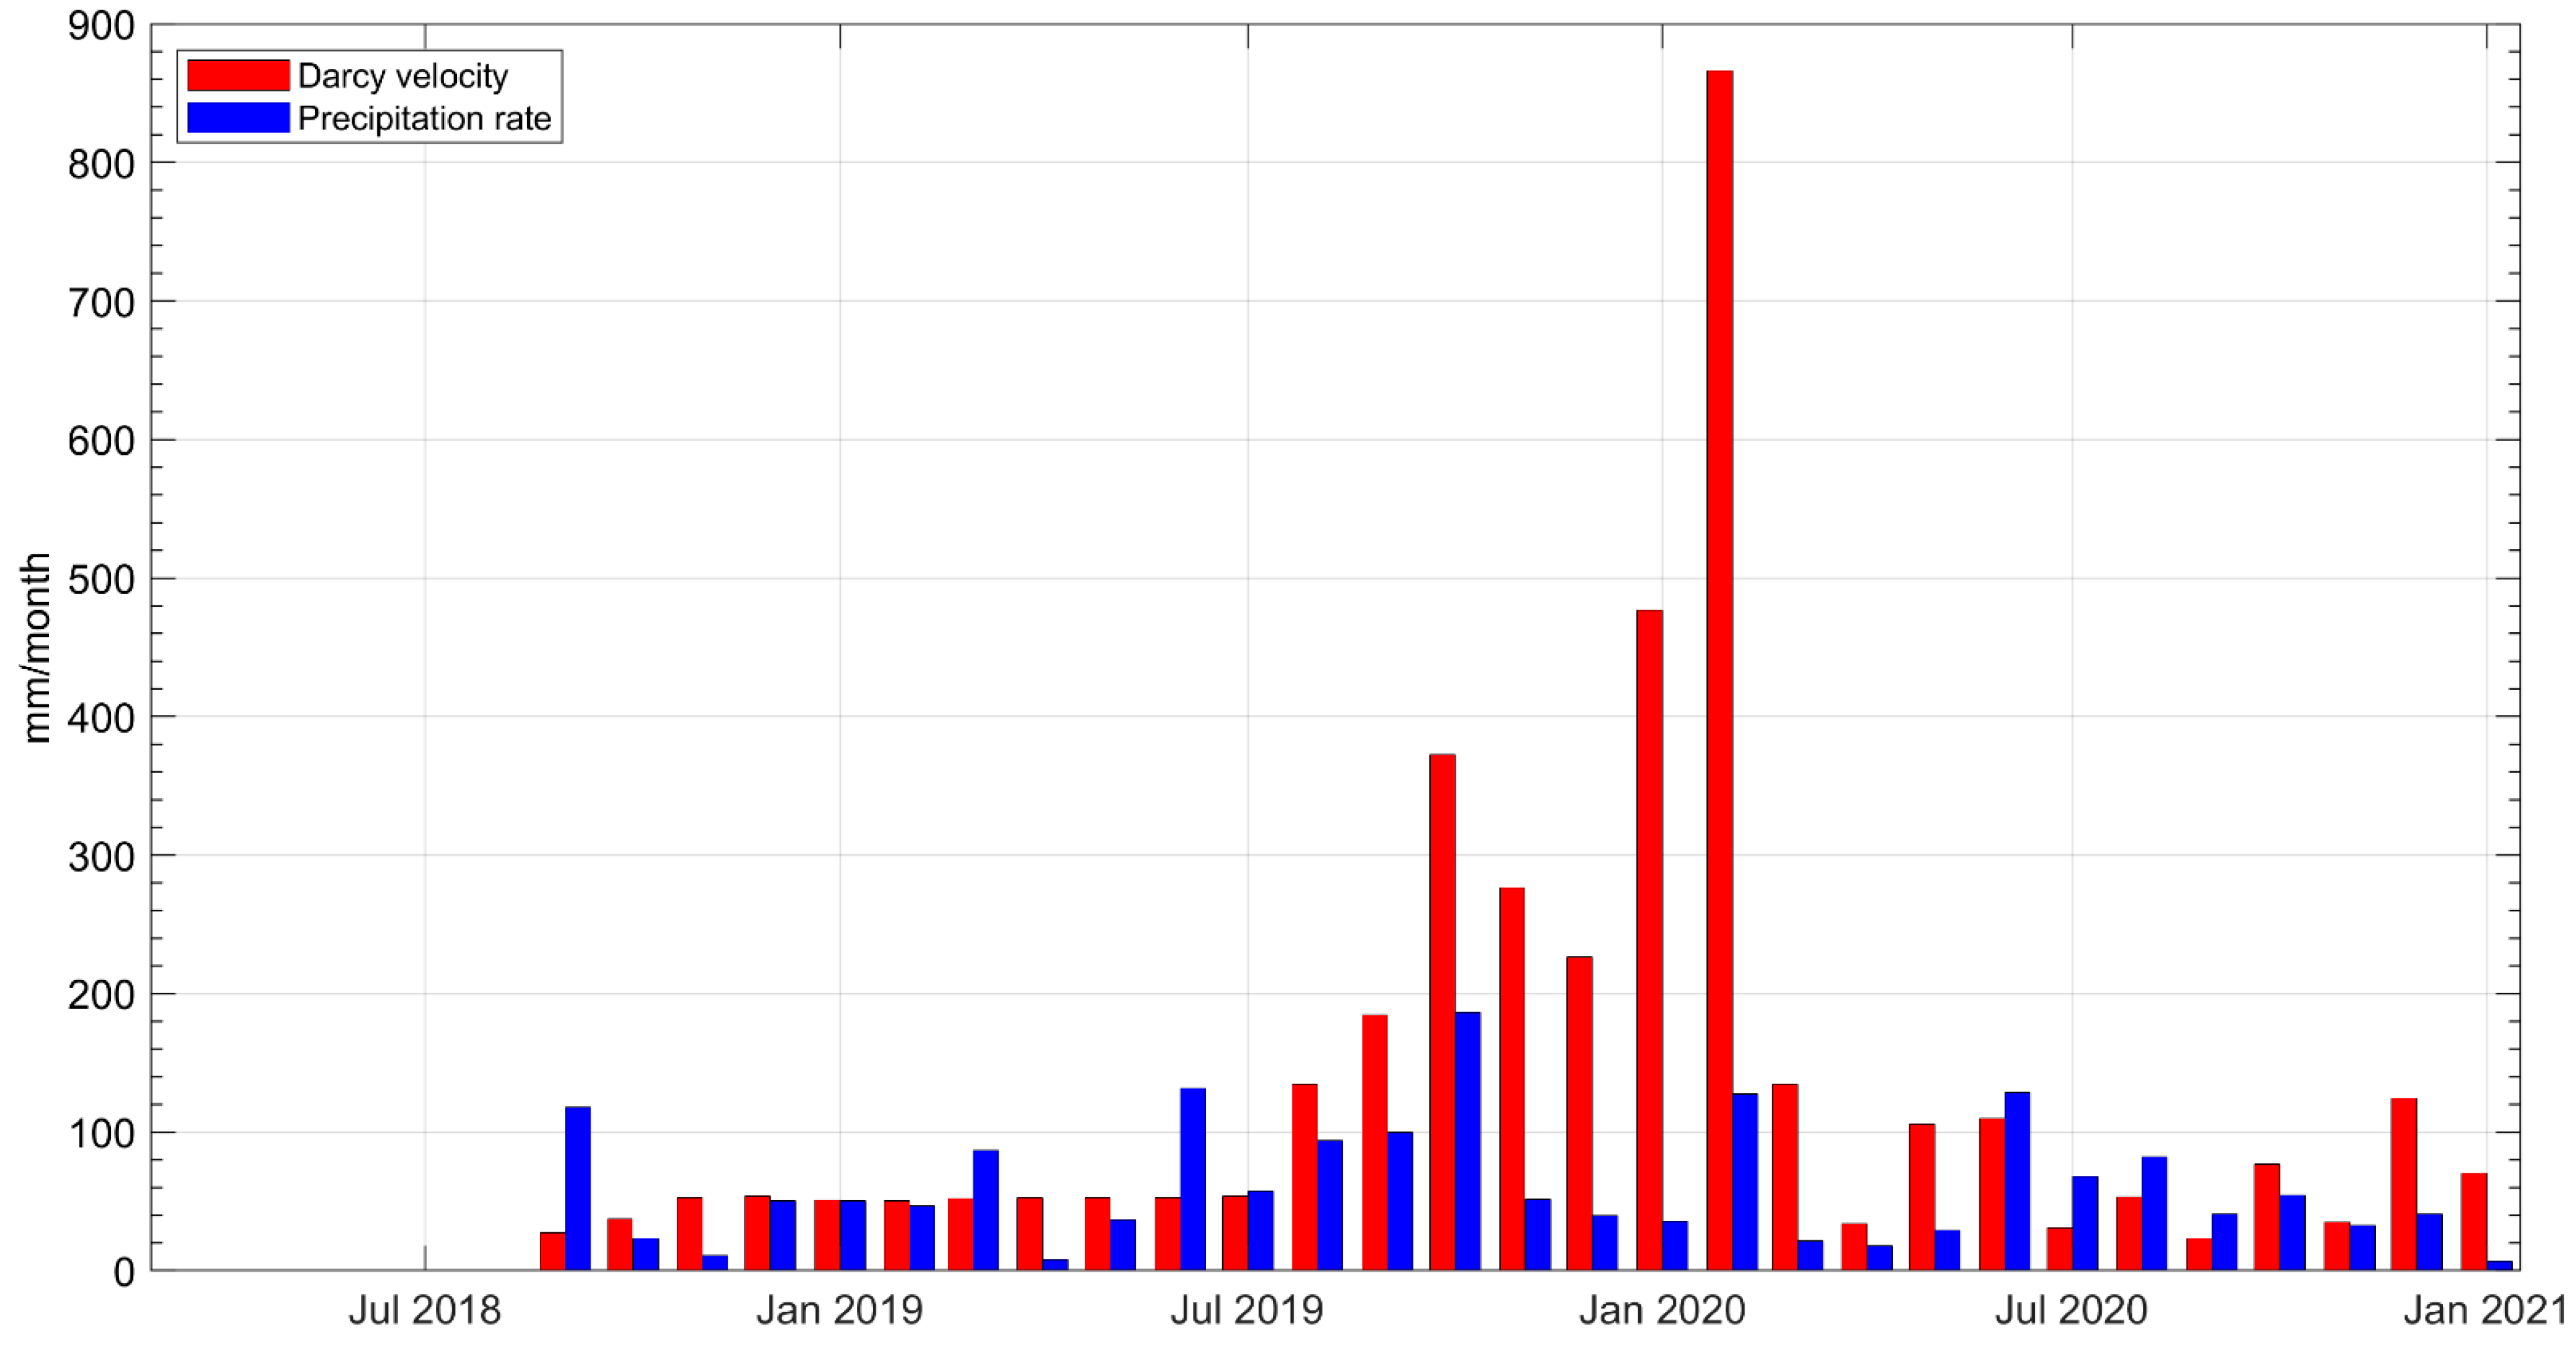
For the Darcy velocity in Equation (1), we use 1460 mm/yr, corresponding to u d = 4.63 · 10 8   m / s , which is the average value estimated from the measured flow rate at the site. Flow measurements are not available for the period from 23 March 2018 to 13 June 2018. For this period, we use the average flow measurements from the corresponding periods in 2019 and 2020. The thermal load q in Equation (13) was measured on the cold side of the heat pump with a Kamstrup energy meter.
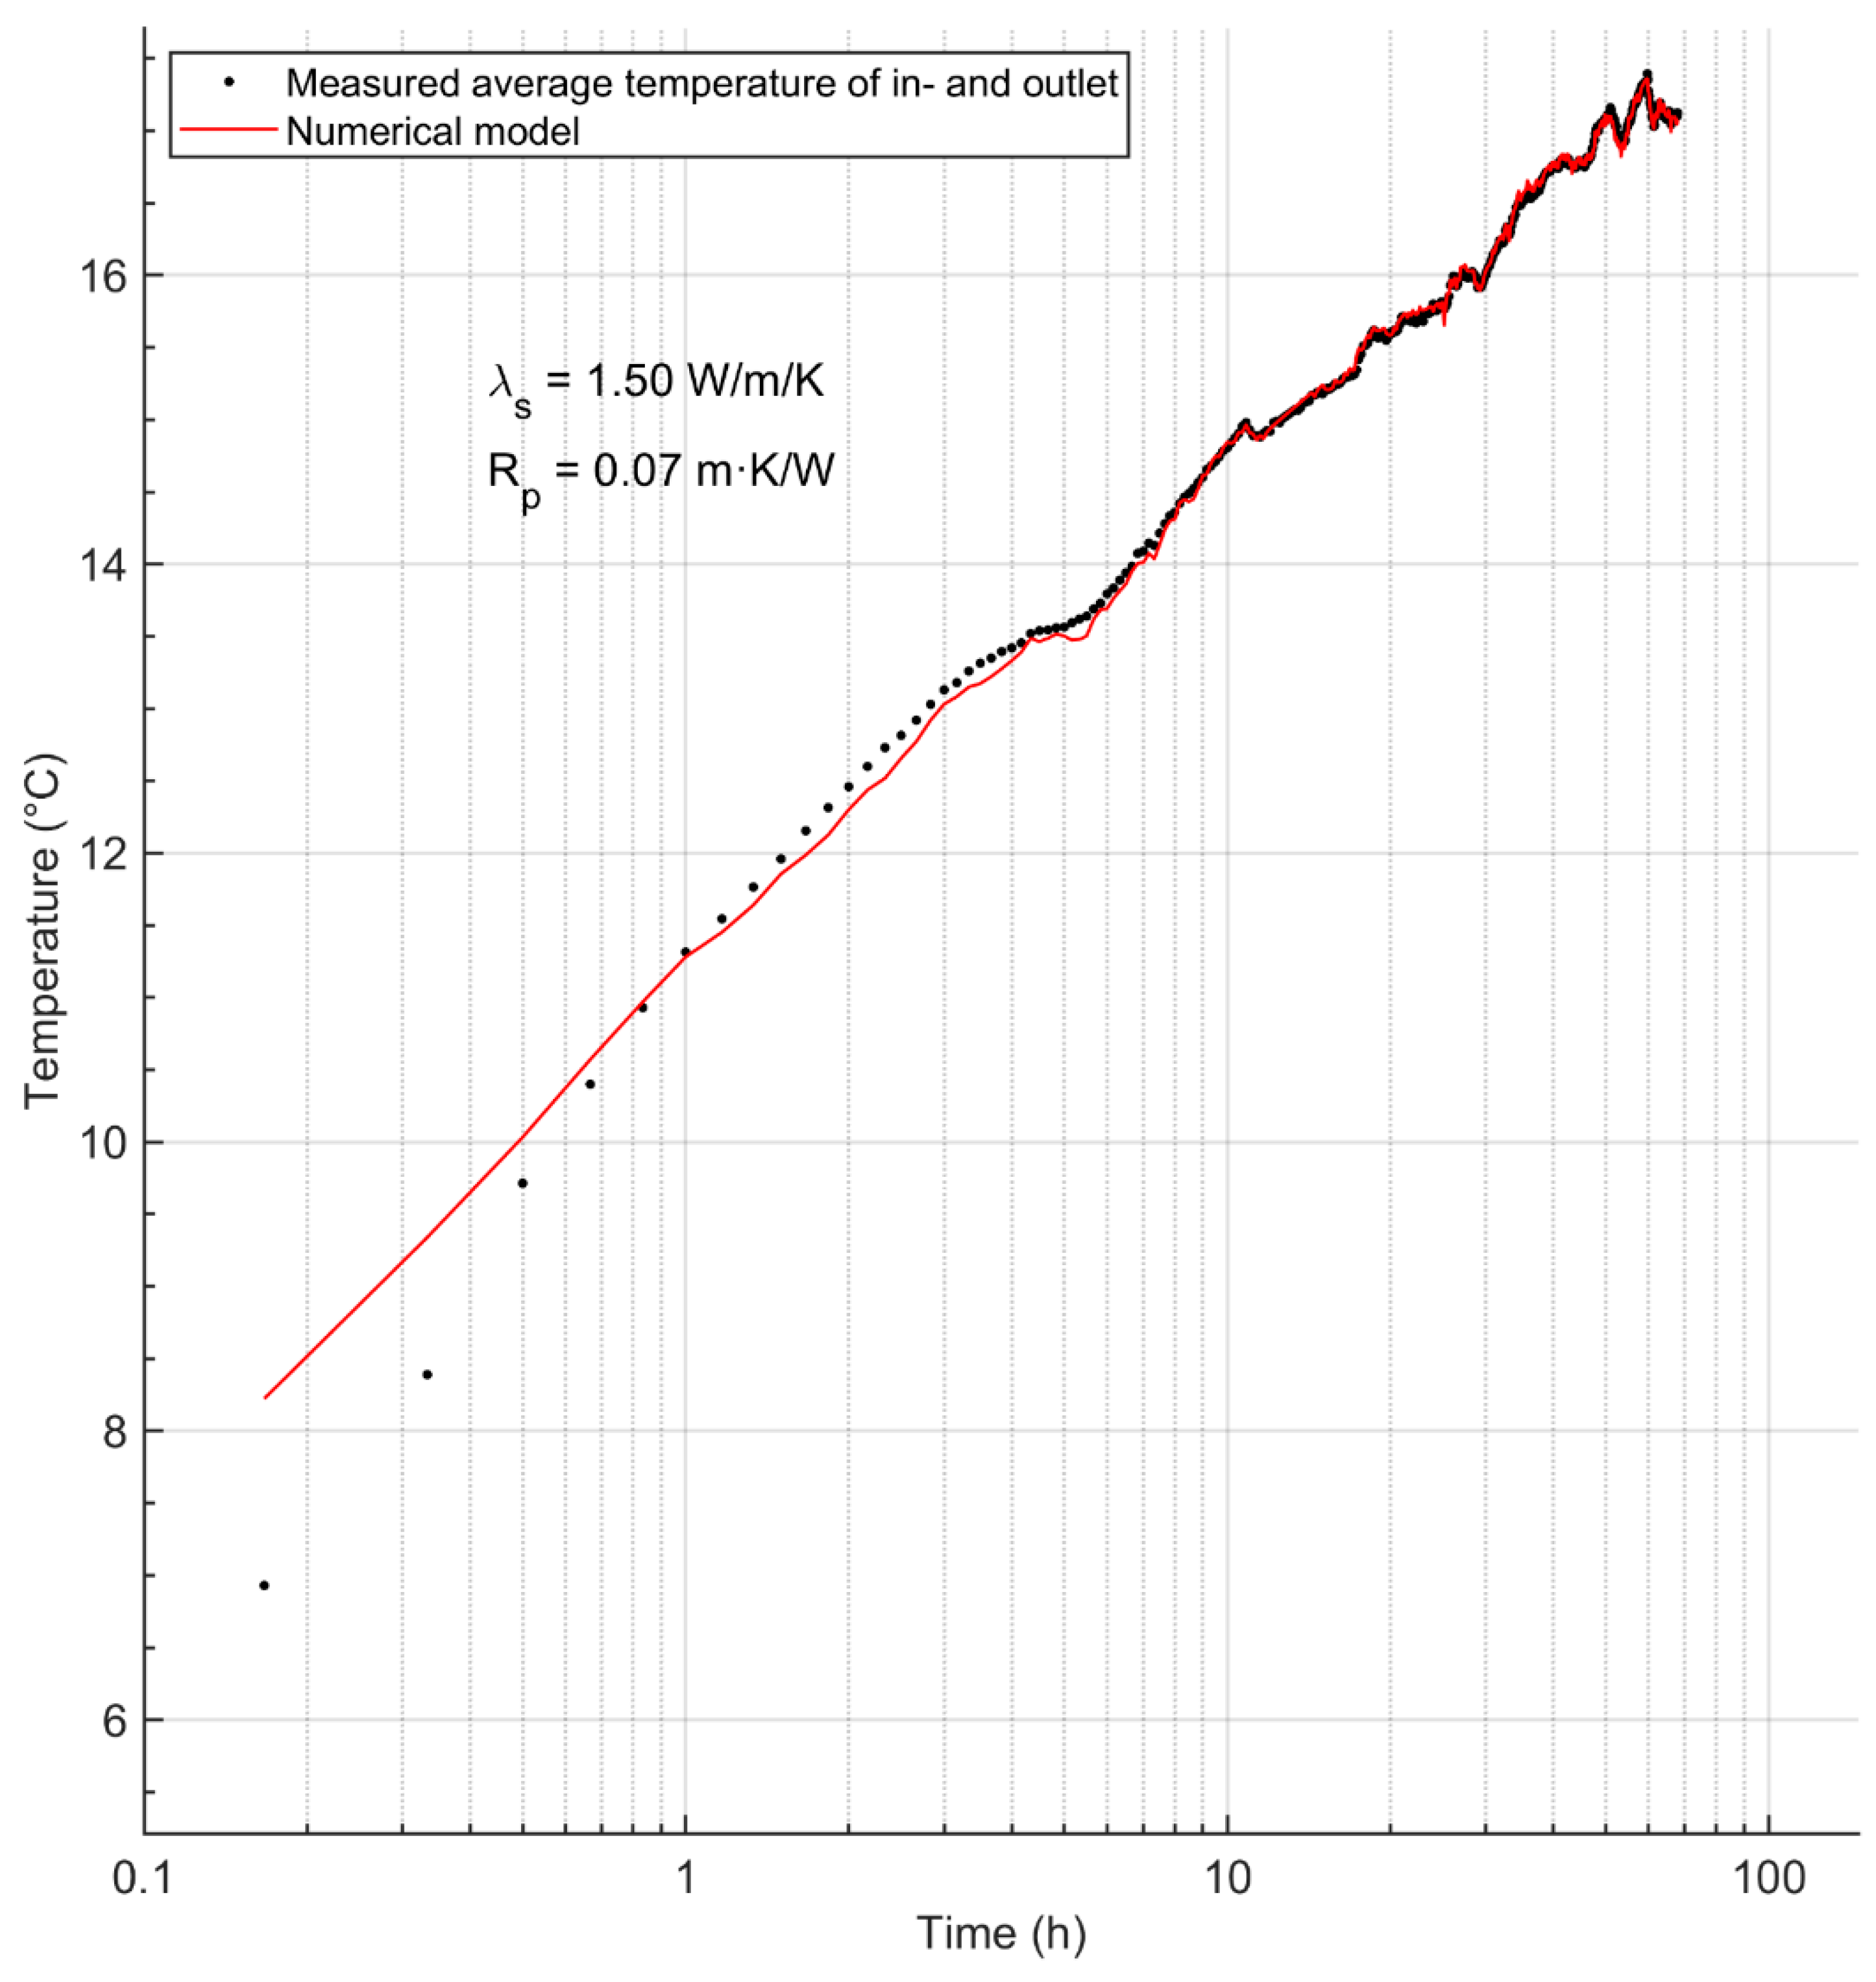
The thermal conductivity of the roadbed as well as the pipe thermal resistance is usually estimated from a thermal response test (TRT). No TRT was conducted during the construction of the Climate Road; however, in a similar project, an identical road (the Thermoroad) was constructed in 2020 and a TRT was performed on the geothermal pipes. The average fluid temperatures recorded during the TRT are shown in Figure 7. The interpretation of the TRT data was performed with the numerical model described in [33], yielding an estimate of λs = 1.50 W/m/K for the roadbed thermal conductivity and Rp = 0.07 m∙K/W for the pipe thermal resistance.
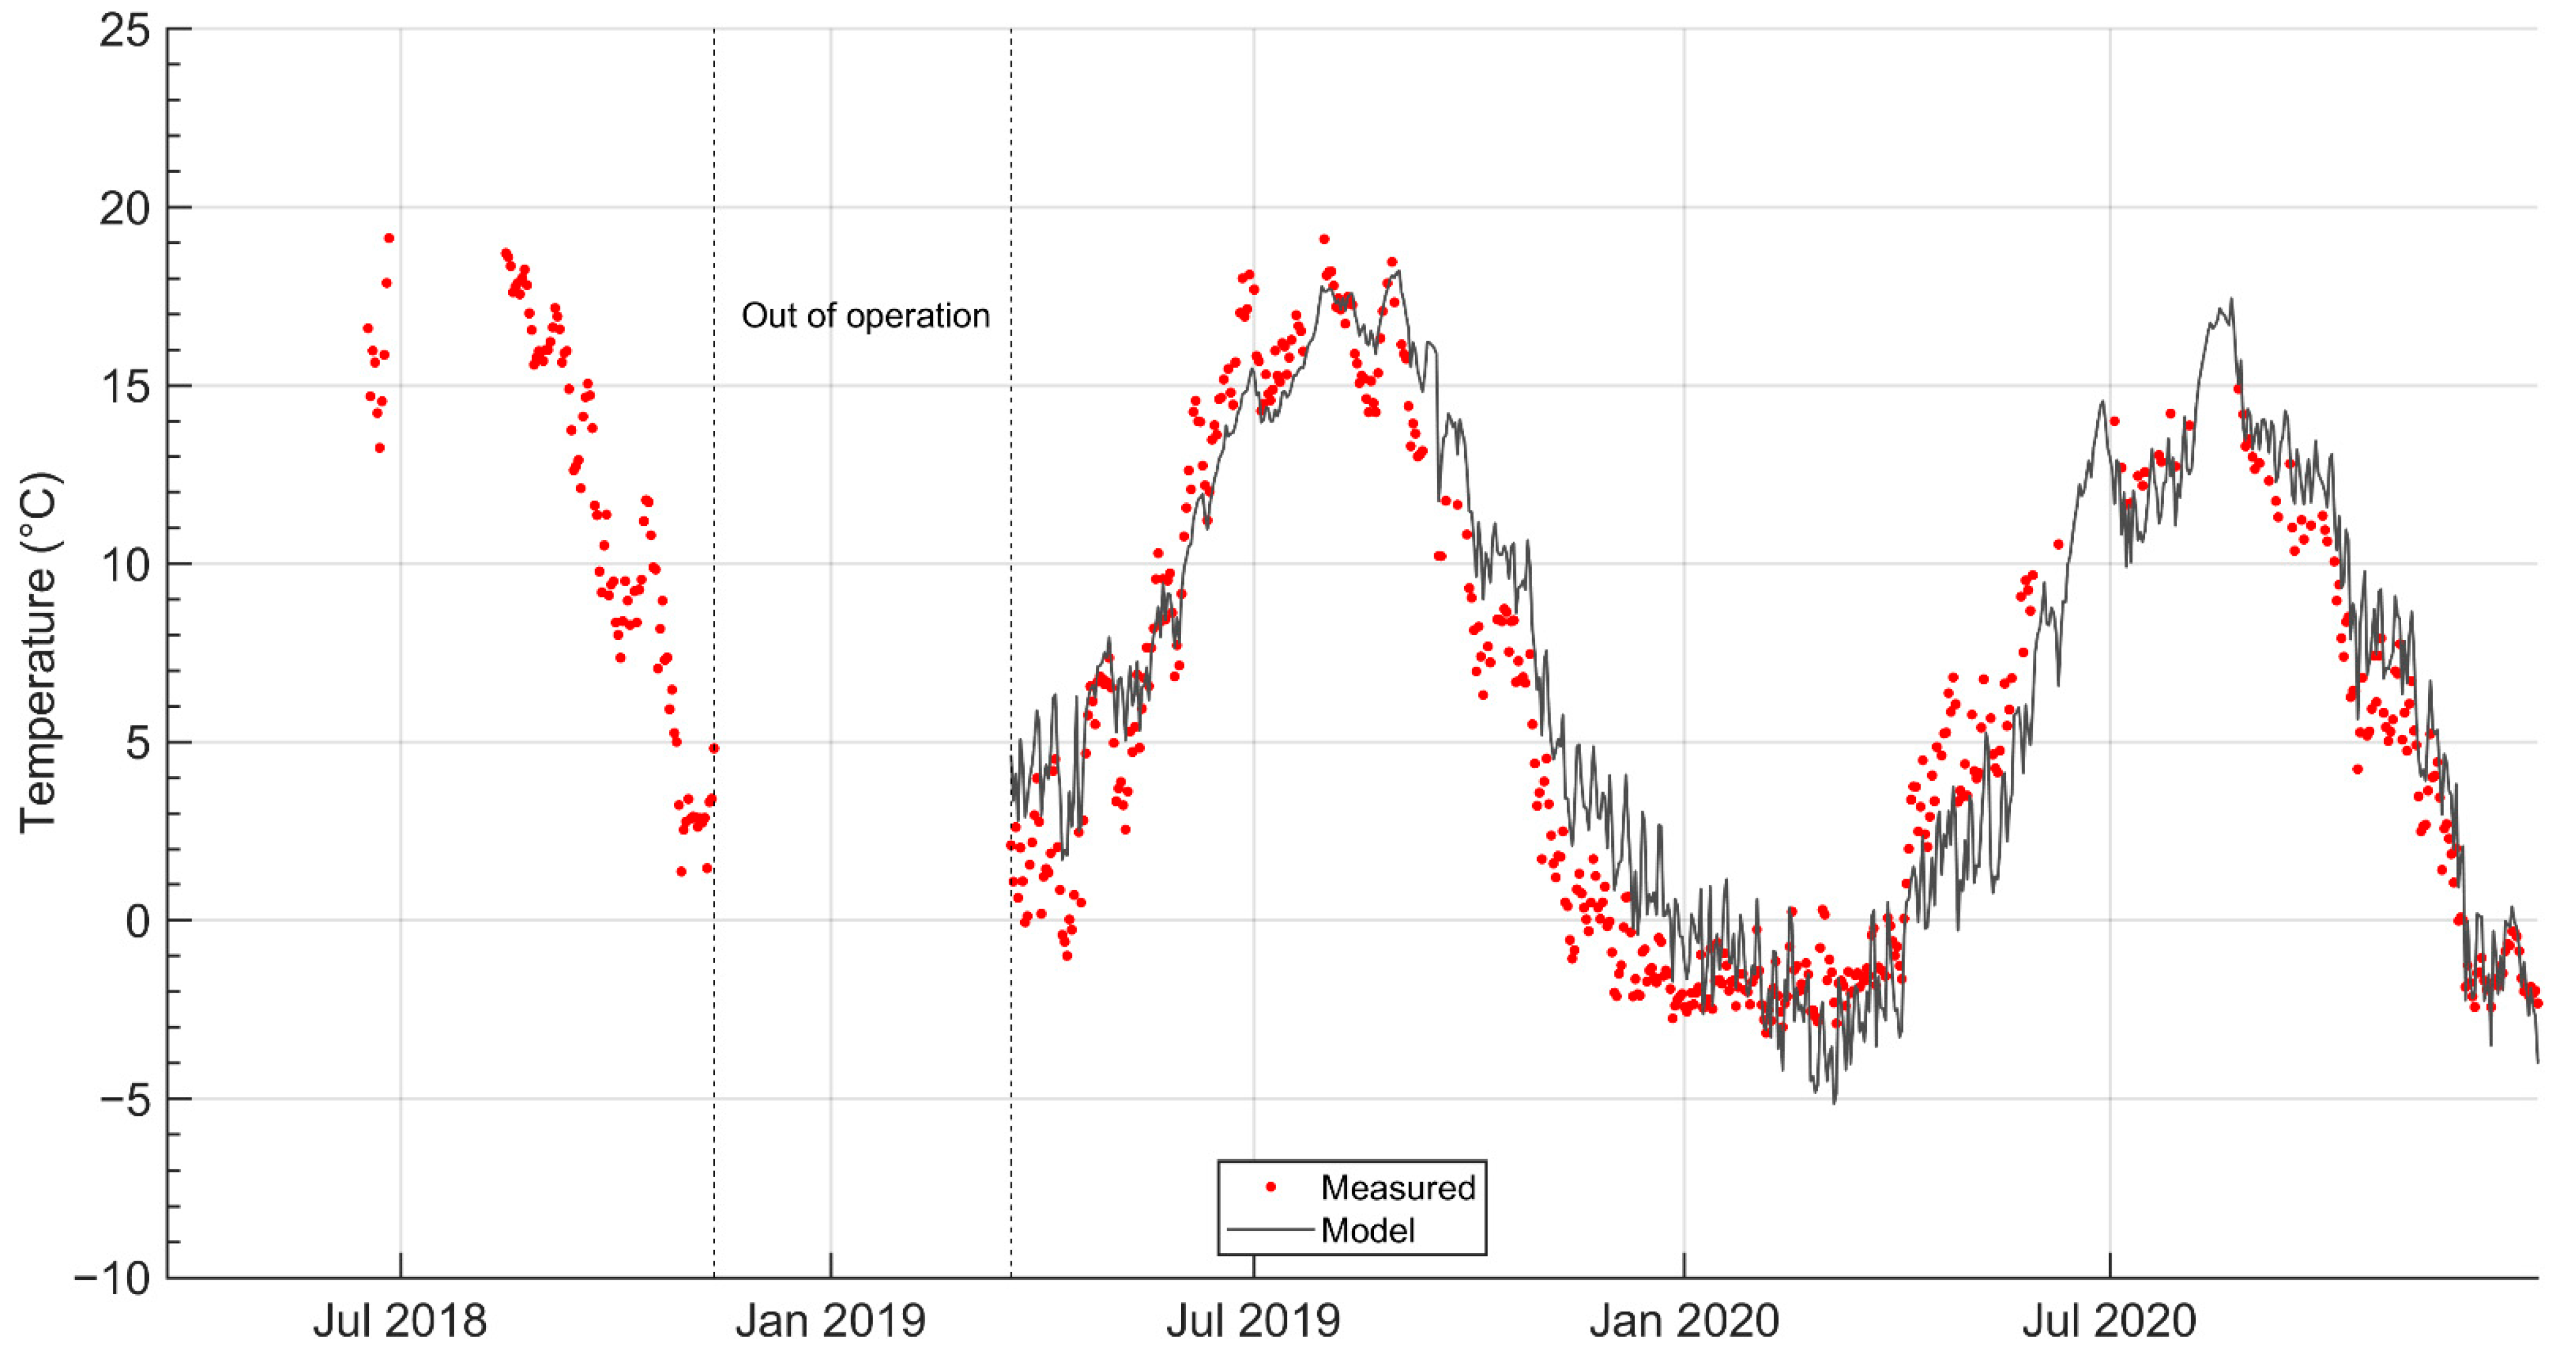
The final model parameter is the weight w for the mirror sources in Equation (10). This is the only free model parameter, and it was estimated by minimizing the squared residual between modelled and observed brine temperatures in the period from 1 April 2019 to 31 December 2020. The initial period from 23 March 2018 to 1 April 2019 is disregarded in the model calibration, as the Climate Road was out of operation for some time in this period, and also to avoid initial transients that would potentially bias estimates of w.

2.3. Instrumentation and Measuring Data

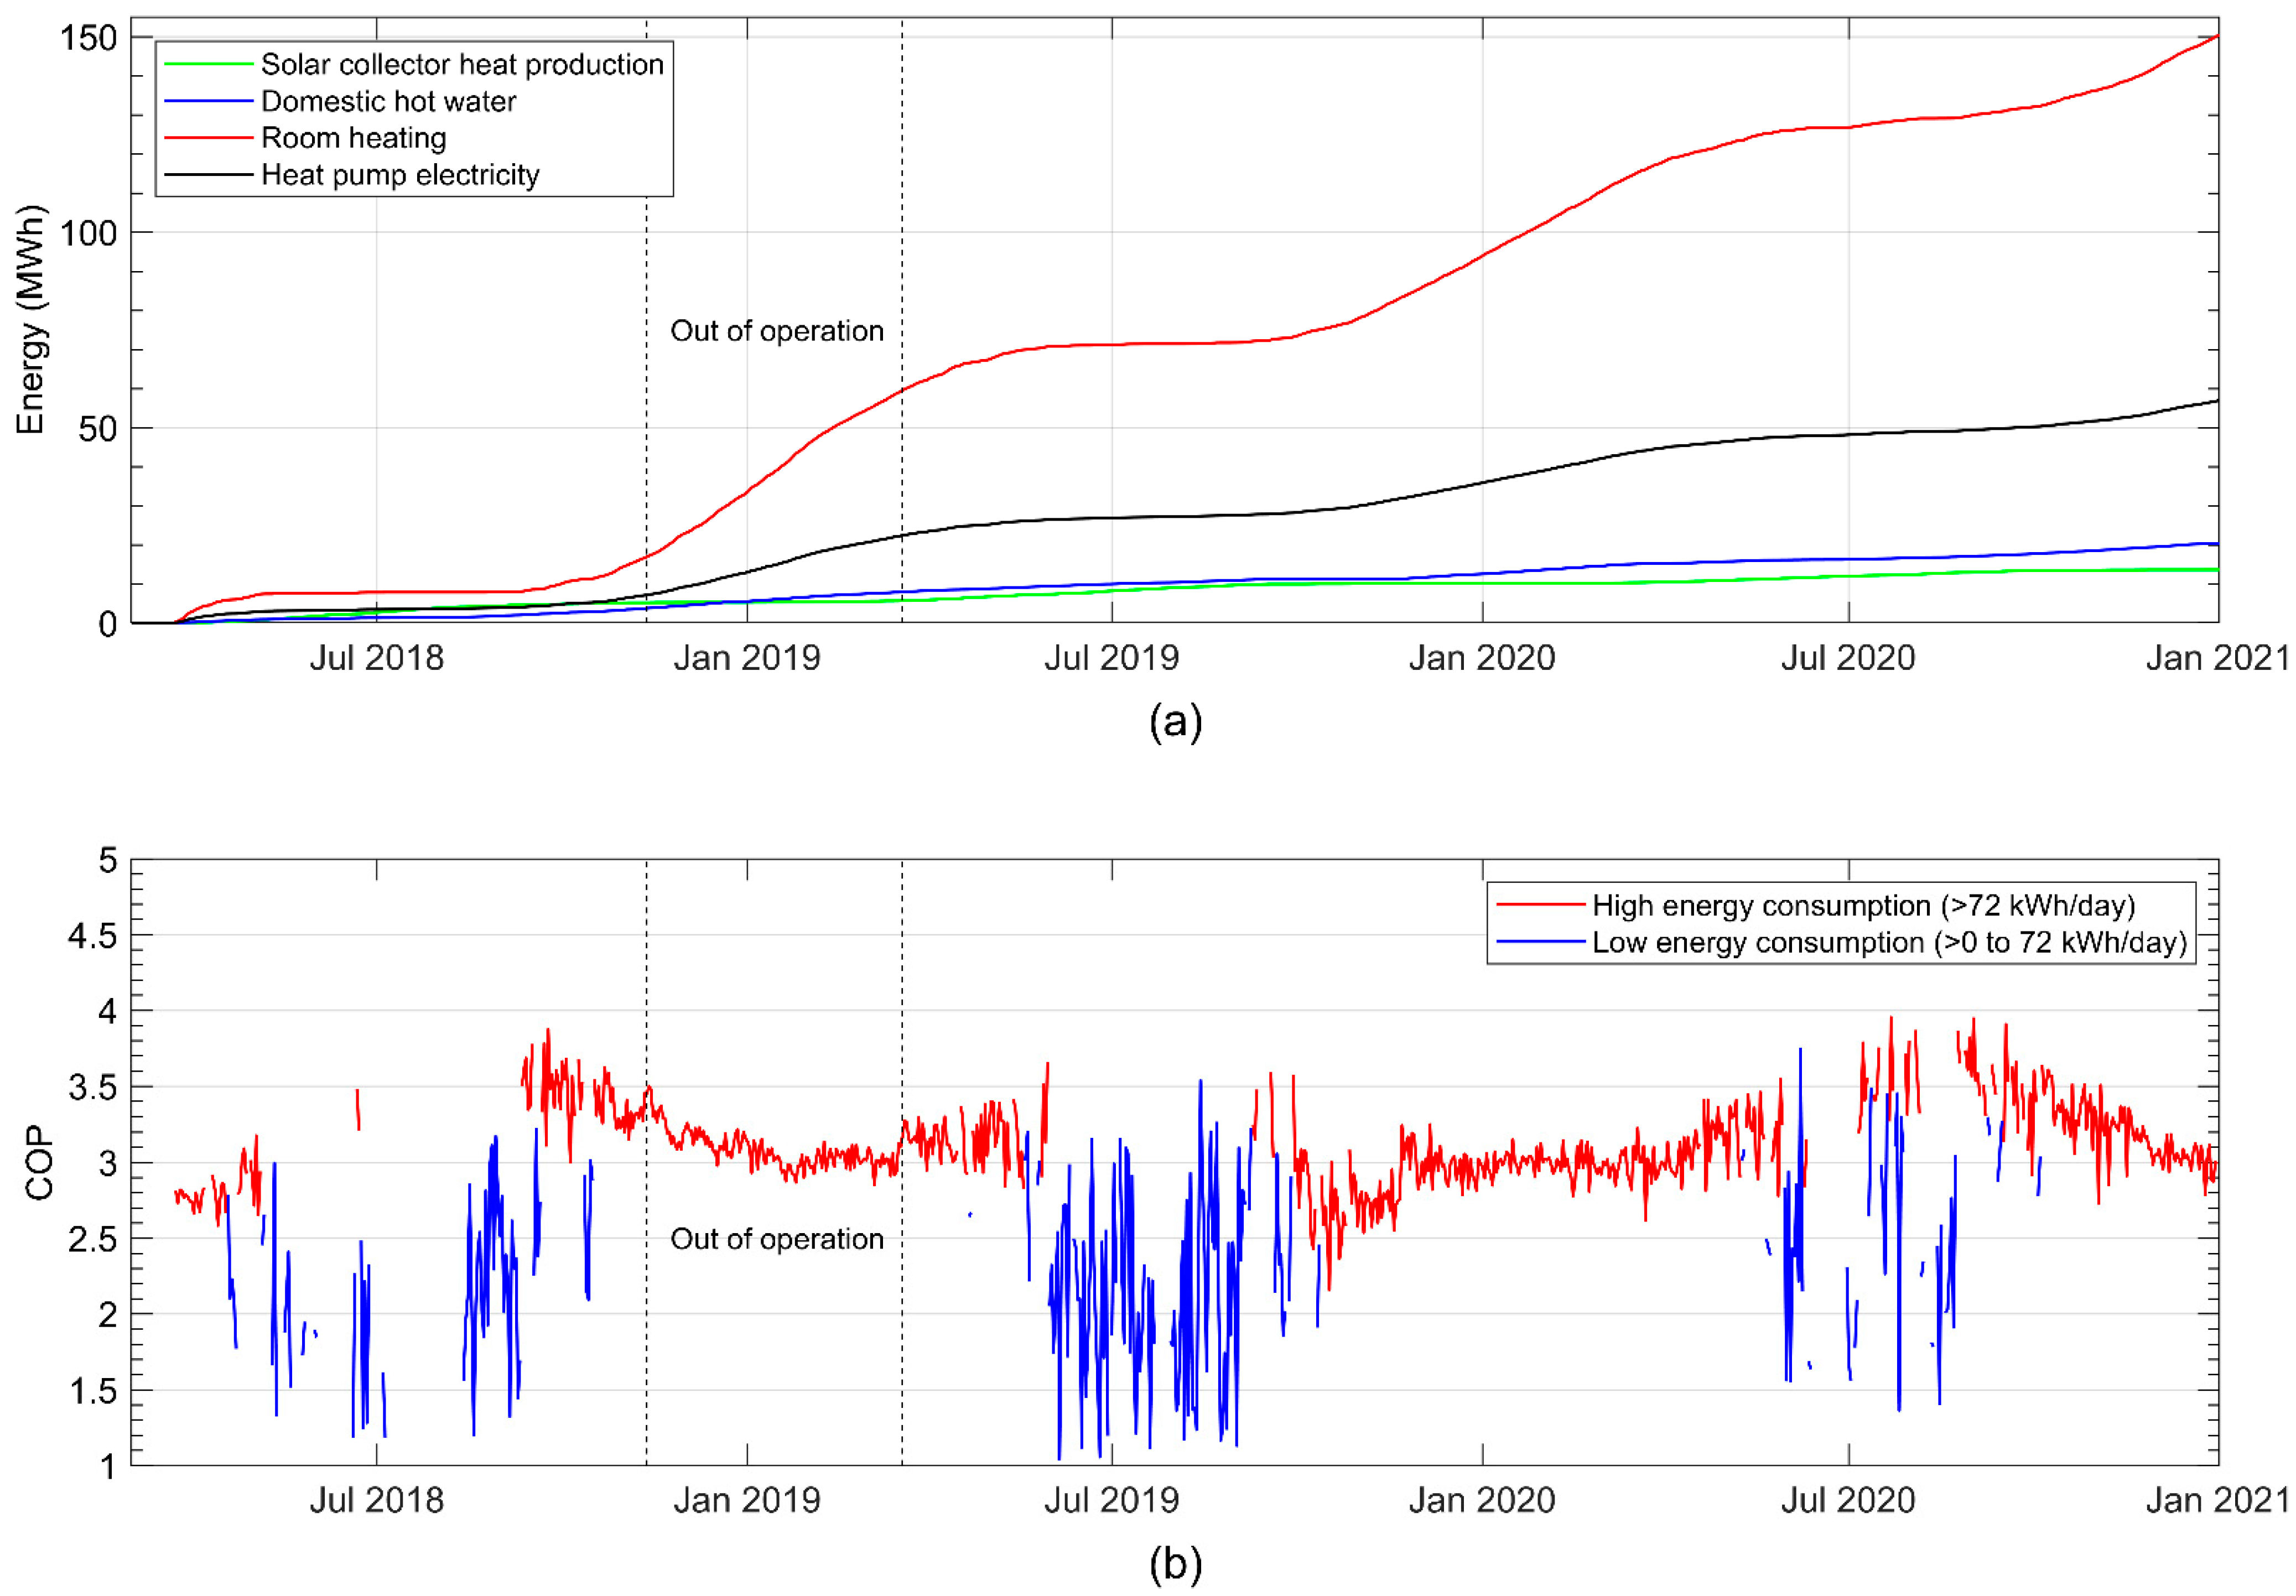
In the following, we present all data relevant to the system performance. This includes weather data for estimating the surface temperature of the road and operational data from the GSHP such as brine temperatures to and from the heat pump, energy extracted from the Climate Road, and electricity consumption of the heat pump. Moreover, two flow meters recorded the water discharge from the two road sections with and without permeable asphalt, respectively. Finally, a Kamstrup energy meter fitted on the cold side of the heat pump measured the thermal load on the roadbed.
A Davis Vantage Pro2 weather station was used to measure precipitation, air temperature, wind speed, and relative humidity. All quantities were aggregated to daily averages. Solar radiation data from the Danish Meteorological Institute (DMI) Bygholm weather station situated 12.5 km from the Climate Road were also used, as the Davis weather station does not measure solar radiation.
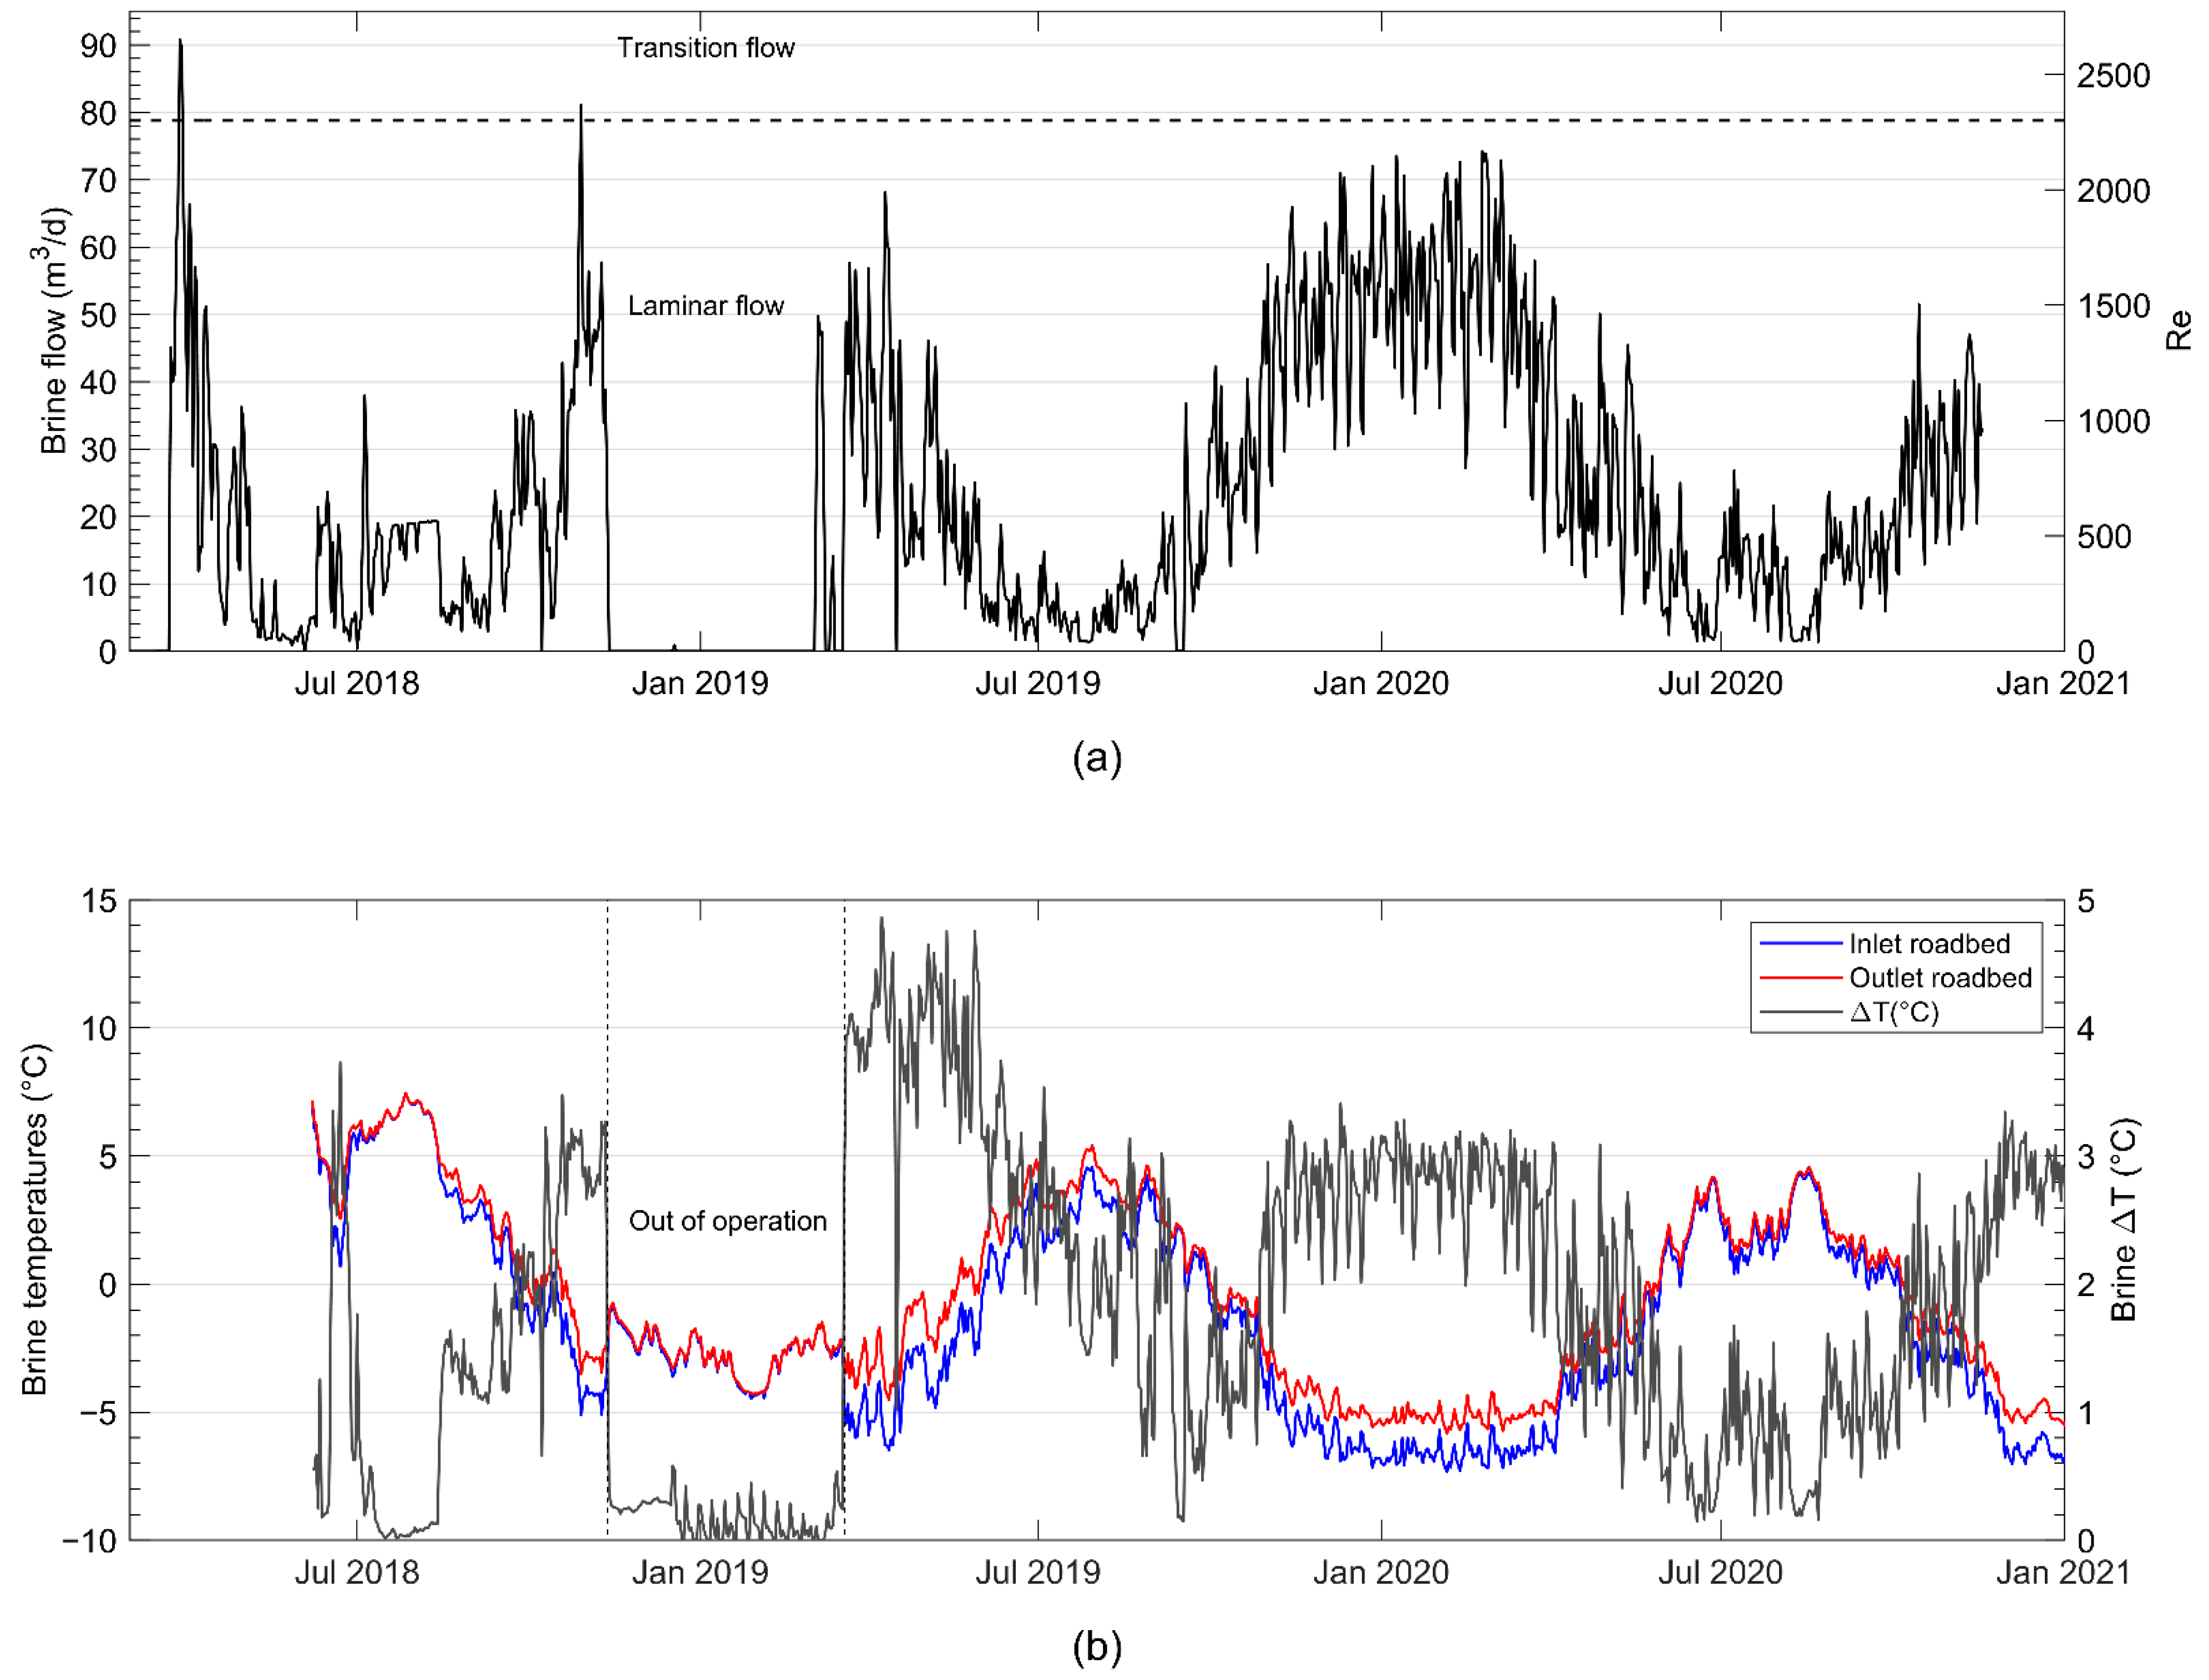
Brine fluid temperatures to the heat pump were measured by a Testo 176-T4 datalogger (produced by Test Ltd., Alton, (Hampshire), UK) with thermocouple sensors fitted on the exterior of the four geothermal pipes with brine flowing to the heat pump. The average brine fluid temperature was calculated from the temperature decrease across the evaporator, which was recorded by the heat pump. Brine temperatures were also measured by the heat pump; however, they are significantly disturbed by room temperature and are therefore not well-suited for comparison with calculated brine temperatures. Ideally, both the in- and outlet brine temperatures should have been measured with sensors embedded in the geothermal pipes at the manifold, rather than fitted on the exterior pipe wall.
On 20 November 2019, an inspection into a pressure loss issue revealed that one of the 200 m geothermal pipes was leaking brine. Consequently, the leaking pipe was disconnected at the manifold. From a model perspective, this implies recalculation of the g-function at this point in time, as the heat exchanger geometry changes. The corresponding four model segments were removed in the computation of a new g-function and the thermal load was redistributed on the remaining geothermal pipes in the temperature calculation. Consequently, two separate g-functions were computed for the time before and after the disconnection of the leaking pipe, respectively, to predict the observed brine temperatures.

3. Results

3.1. Weather Data and Flow Measurements

In the following, the weather data and roadbed flow meter measurements are presented.
Air temperatures generally reflected seasonal variations in the solar radiation; however, they were phase shifted and somewhat right skewed (Figure 8).
Denmark has oceanic climate conditions with a daily average air temperature close to zero during the winter months and high relative humidity.
Measured precipitation was compared to corresponding measured monthly Darcy flow rates, estimated by normalizing measured discharge volumes by the 400 m2 of road surface (Figure 9).
There was a significant increase in the runoff area that contributes water to the roadbed (i.e., the catchment area) during the winter 2019–2020. The year 2019 was the second wettest on record in Denmark, and the field site was visibly waterlogged during the autumn and winter of 2019. As a consequence, the rainwater basin to which water from the roadbed was pumped overflooded and caused damage to a nearby bicycle and walking path. Several of the wells with instrumentation were flooded at the time, cutting the power to the kindergarten twice.
As the potential evaporation decreased, which increased infiltration to the subsurface, the soil eventually became fully saturated and runoff coefficients increased significantly in the areas surrounding the Climate Road. The topographic conditions at the study site directed the increased surface water flow to the Climate Road, greatly increasing the infiltration rates during the winter of 2019–2020. The seasonal dynamics in the extent of the catchment area and runoff coefficients are well-known from studies on rivers and streams [34].

3.2. Brine Flow and Temperature

Brine flow was generally laminar during GSHP operation, as indicated by the computed Reynolds numbers for the test period (Figure 10).
To lower the convective thermal resistance of the brine and thereby increase the heat exchange with the ground, flow rates must be maximized to ensure turbulence. However, increasing the flow rate entails increased pumping costs, implying a trade-off between the efficiency of the ground heat exchanger and the cost of brine circulation. The study by Gehlin and Spitler [35] concluded that the pumping costs associated with maintaining fully turbulent or even transition flow exceed the savings from improved heat exchange in the ground. Consequently, they concluded that laminar flow is in fact desirable.
Brine temperatures varied between 10 and 20 °C in the summer and decreased to ca. 0 °C during winter as energy extraction from the roadbed increased. The temperature difference across the heat pump evaporator was 0–5 °C.

3.3. Energy Production and Consumption

The energy for domestic hot water and room heating produced by the heat pump amounted to 67.5 and 64.6 MWh in 2019 and 2020, respectively (Figure 11).
Solar collectors increased heat production by 4.9 MWh and 3.5 MWh in 2019 and 2020, respectively. The average COP was 2.85 in both years; however, in the six coldest months in the winters of 2018–2019, 2019–2020, and 2020–2021, the winter seasonal COP (SCOP) was 3.11, 2.94, and 3.15, respectively. The slightly higher SCOP in the winter was attributed to the heat pump being in operation for longer periods of time during the day, thus avoiding frequent starts and stops that are detrimental to performance, as illustrated by the blue and red lines in the bottom plot in Figure 11. Depending on the heating system for room conditioning, improvement of the COP is possible by controlling and lowering the supply temperature whenever possible, considering the actual heating demands of the building.

3.4. Temperature Model Analysis

In the following, we present the model validation, followed by a parametric study of infiltration rates and seasonal energy storage, both of which are considered design parameters.

3.4.1. Model Validation

The model performance was evaluated by comparing predicted and measured brine temperatures. The corresponding model fit to observed brine temperatures is shown in Figure 12.
The model predictions corresponded fairly well to measured brine temperatures in the period from April 2019 to January 2021.

3.4.2. Prediction of Sustainable Heat Extraction

To make long-term temperature model predictions, the measured thermal load on the roadbed was repeated until the desired simulation time of 30 years was reached. The Climate Road was out of commission from December 2019 to March 2020, and for this period, we used the total heat consumption measured on the condenser side of the heat pump, from which we subtracted the corresponding electricity consumption to obtain the thermal load on the Climate Road in that period. To estimate sustainable energy extraction rates, the thermal load time series was scaled until the minimum brine temperature supplying the heat pump exceeded −4 °C for the full 30-year period.
Assuming a roadbed thermal conductivity of 1.50 W/m/K and an annual infiltration of 1460 mm, the thermal load time series needed to be reduced by 54% to ensure brine temperatures above −4 °C during continued operation for 30 years, corresponding to a total annual heat production of 30.2 MWh, including the electricity consumption by the heat pump (Figure 13).
The average COP in the 30-year period was assumed to be comparable to current levels of around 2.9–3.1 provided that the supply temperature of the heat pump is not altered significantly.

3.4.3. The Impact of Active Infiltration and Seasonal Energy Storage

Infiltration and seasonal energy storage are considered to be design parameters, i.e., they can be engineered to a certain degree. A parametric study of the Darcy flow velocity and the seasonal energy storage was therefore carried out. The infiltration rate was varied between 0 and 2500 mm per year. Additionally, the impact of storing 30% of the annual heating demand was explored. The stored heat can be obtained from passive cooling during summer or from solar collectors or similar energy sources. In the analysis we assumed that the 50 m Climate Road was used as a collective supply for three single-family houses, as this represents the most typical and relevant application of the Climate Road.
Approximately 0.52 MWh of total heating (including the contribution from the electricity consumption of the heat pump) could be extracted annually per meter road section in the reference case with zero infiltration and no seasonal energy storage, representing a traditional GSHP system (Figure 14).
In this case, the 50 m road section was unable to support a consumption of 10 MWh of heating per year. High infiltration rates increased the extractable heat quite substantially, up to 35% for the considered range of infiltration rates and without seasonal energy storage. Given the current field conditions, the amount of extractable heat from the Climate Road increased by an estimated 17% when compared to the reference case with zero infiltration.
In Figure 14, the vertical dashed line indicates the expected Darcy velocity when draining rainwater from three dwellings directly to the roadbed (i.e., from house roofs and fortified surfaces). We assumed a direct runoff area fraction of 25%. Assuming a plot area of 800 m2 per dwelling, the road catchment area increased by 600 m2 in addition to the road surface (400 m2). Based on a total drained area of 1000 m2, a conservative estimate of the corresponding Darcy flux in the roadbed was 2000 mm per year, as runoff from non-fortified areas to the Climate Road was not considered. Compared to a traditional GSHP without infiltration, the extractable energy increased by 26% when 2000 mm of water was infiltrated annually. In this case, the Climate Road was clearly able to supply three dwellings each with an annual heating consumption of 8 MWh. It is also likely that 10 MWh of heating can be supplied to each dwelling annually. Seasonal energy storage of excess heat from the buildings, solar collectors, or other energy sources significantly increased the amount of extractable energy. Storing 30% of the annual heating consumption increased the extractable heat by 56% when infiltrating 2000 mm of rainwater per year. In this case, heat supply was guaranteed for an annual heat consumption well above 10 MWh per dwelling. Generally speaking, the increase in extractable energy is proportional to the energy stored.

4. Conclusions

The Climate Road presents an alternative to individual systems for rainwater management and domestic heating and cooling. It serves as a basis for a fully decentralized multifunctional 5th-generation district heating and cooling grid, and it provides the wastewater utility with additional water retardation capacity without any area use. The Climate Road employs GSHPs, which have superior efficiency relative to ASHPs, especially on the coldest days in winter. Moreover, the Climate Road voids the need for surface fan heat exchangers that are potentially perceived as both noisy and aesthetically displeasing. Finally, the heat collector thermal piping does not need to be placed on the individual plots.
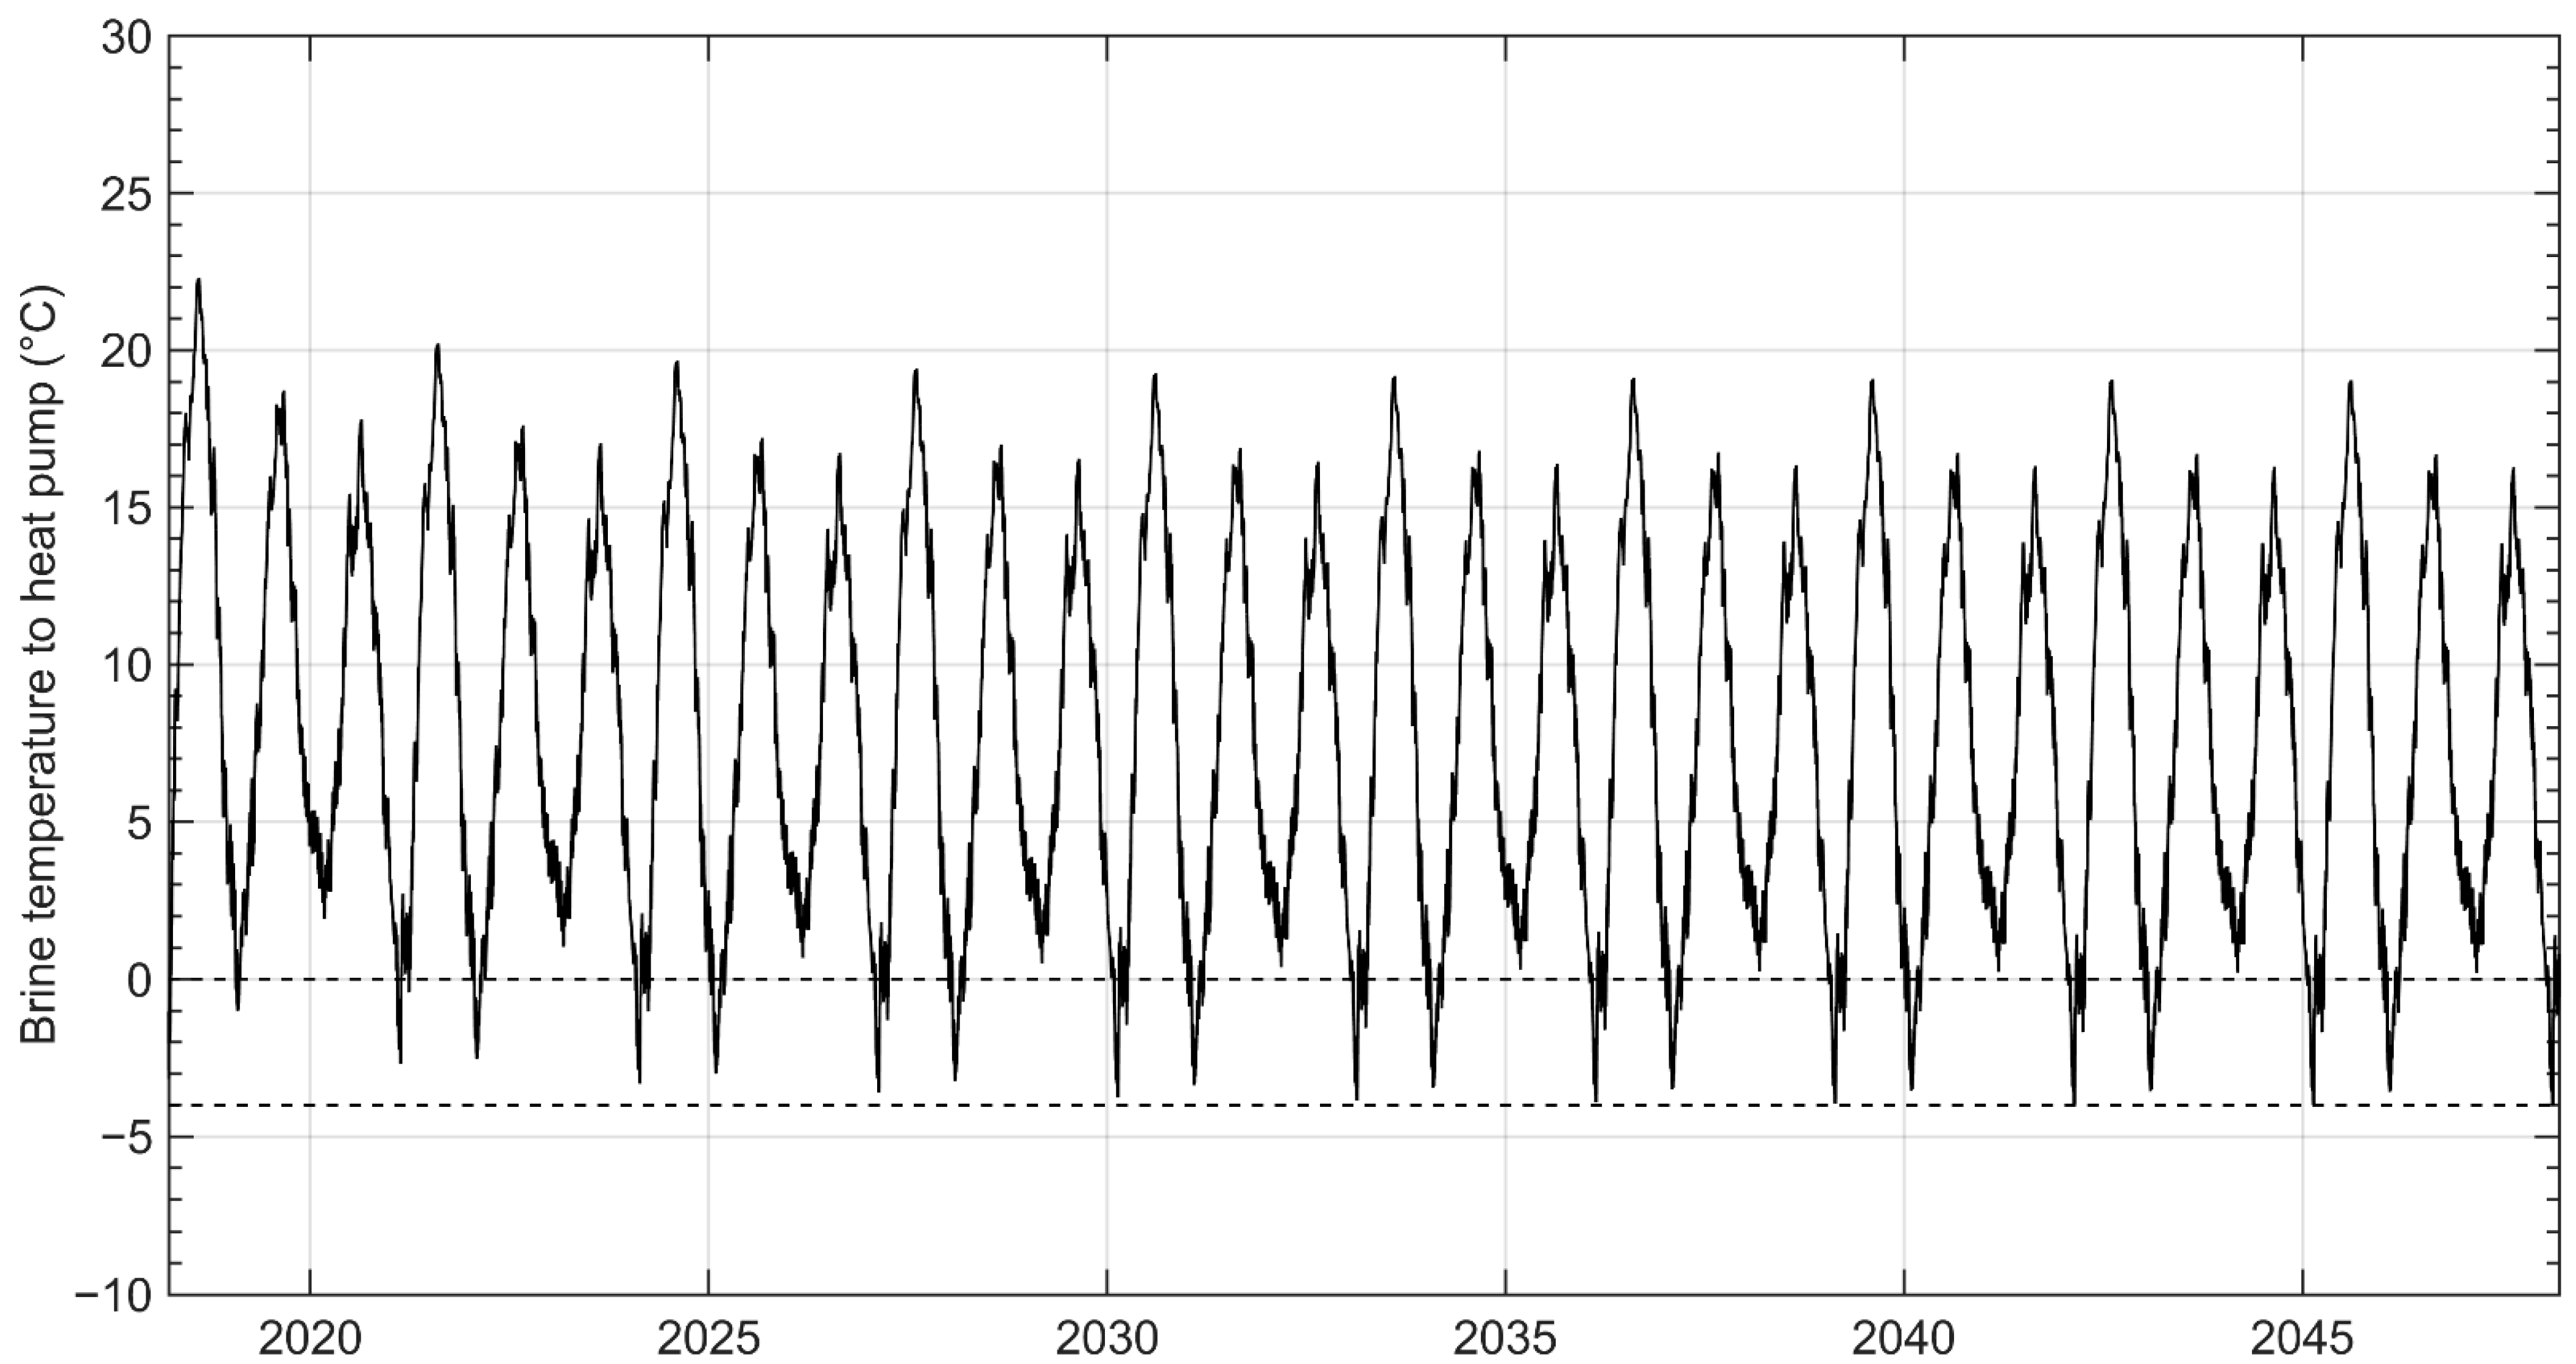
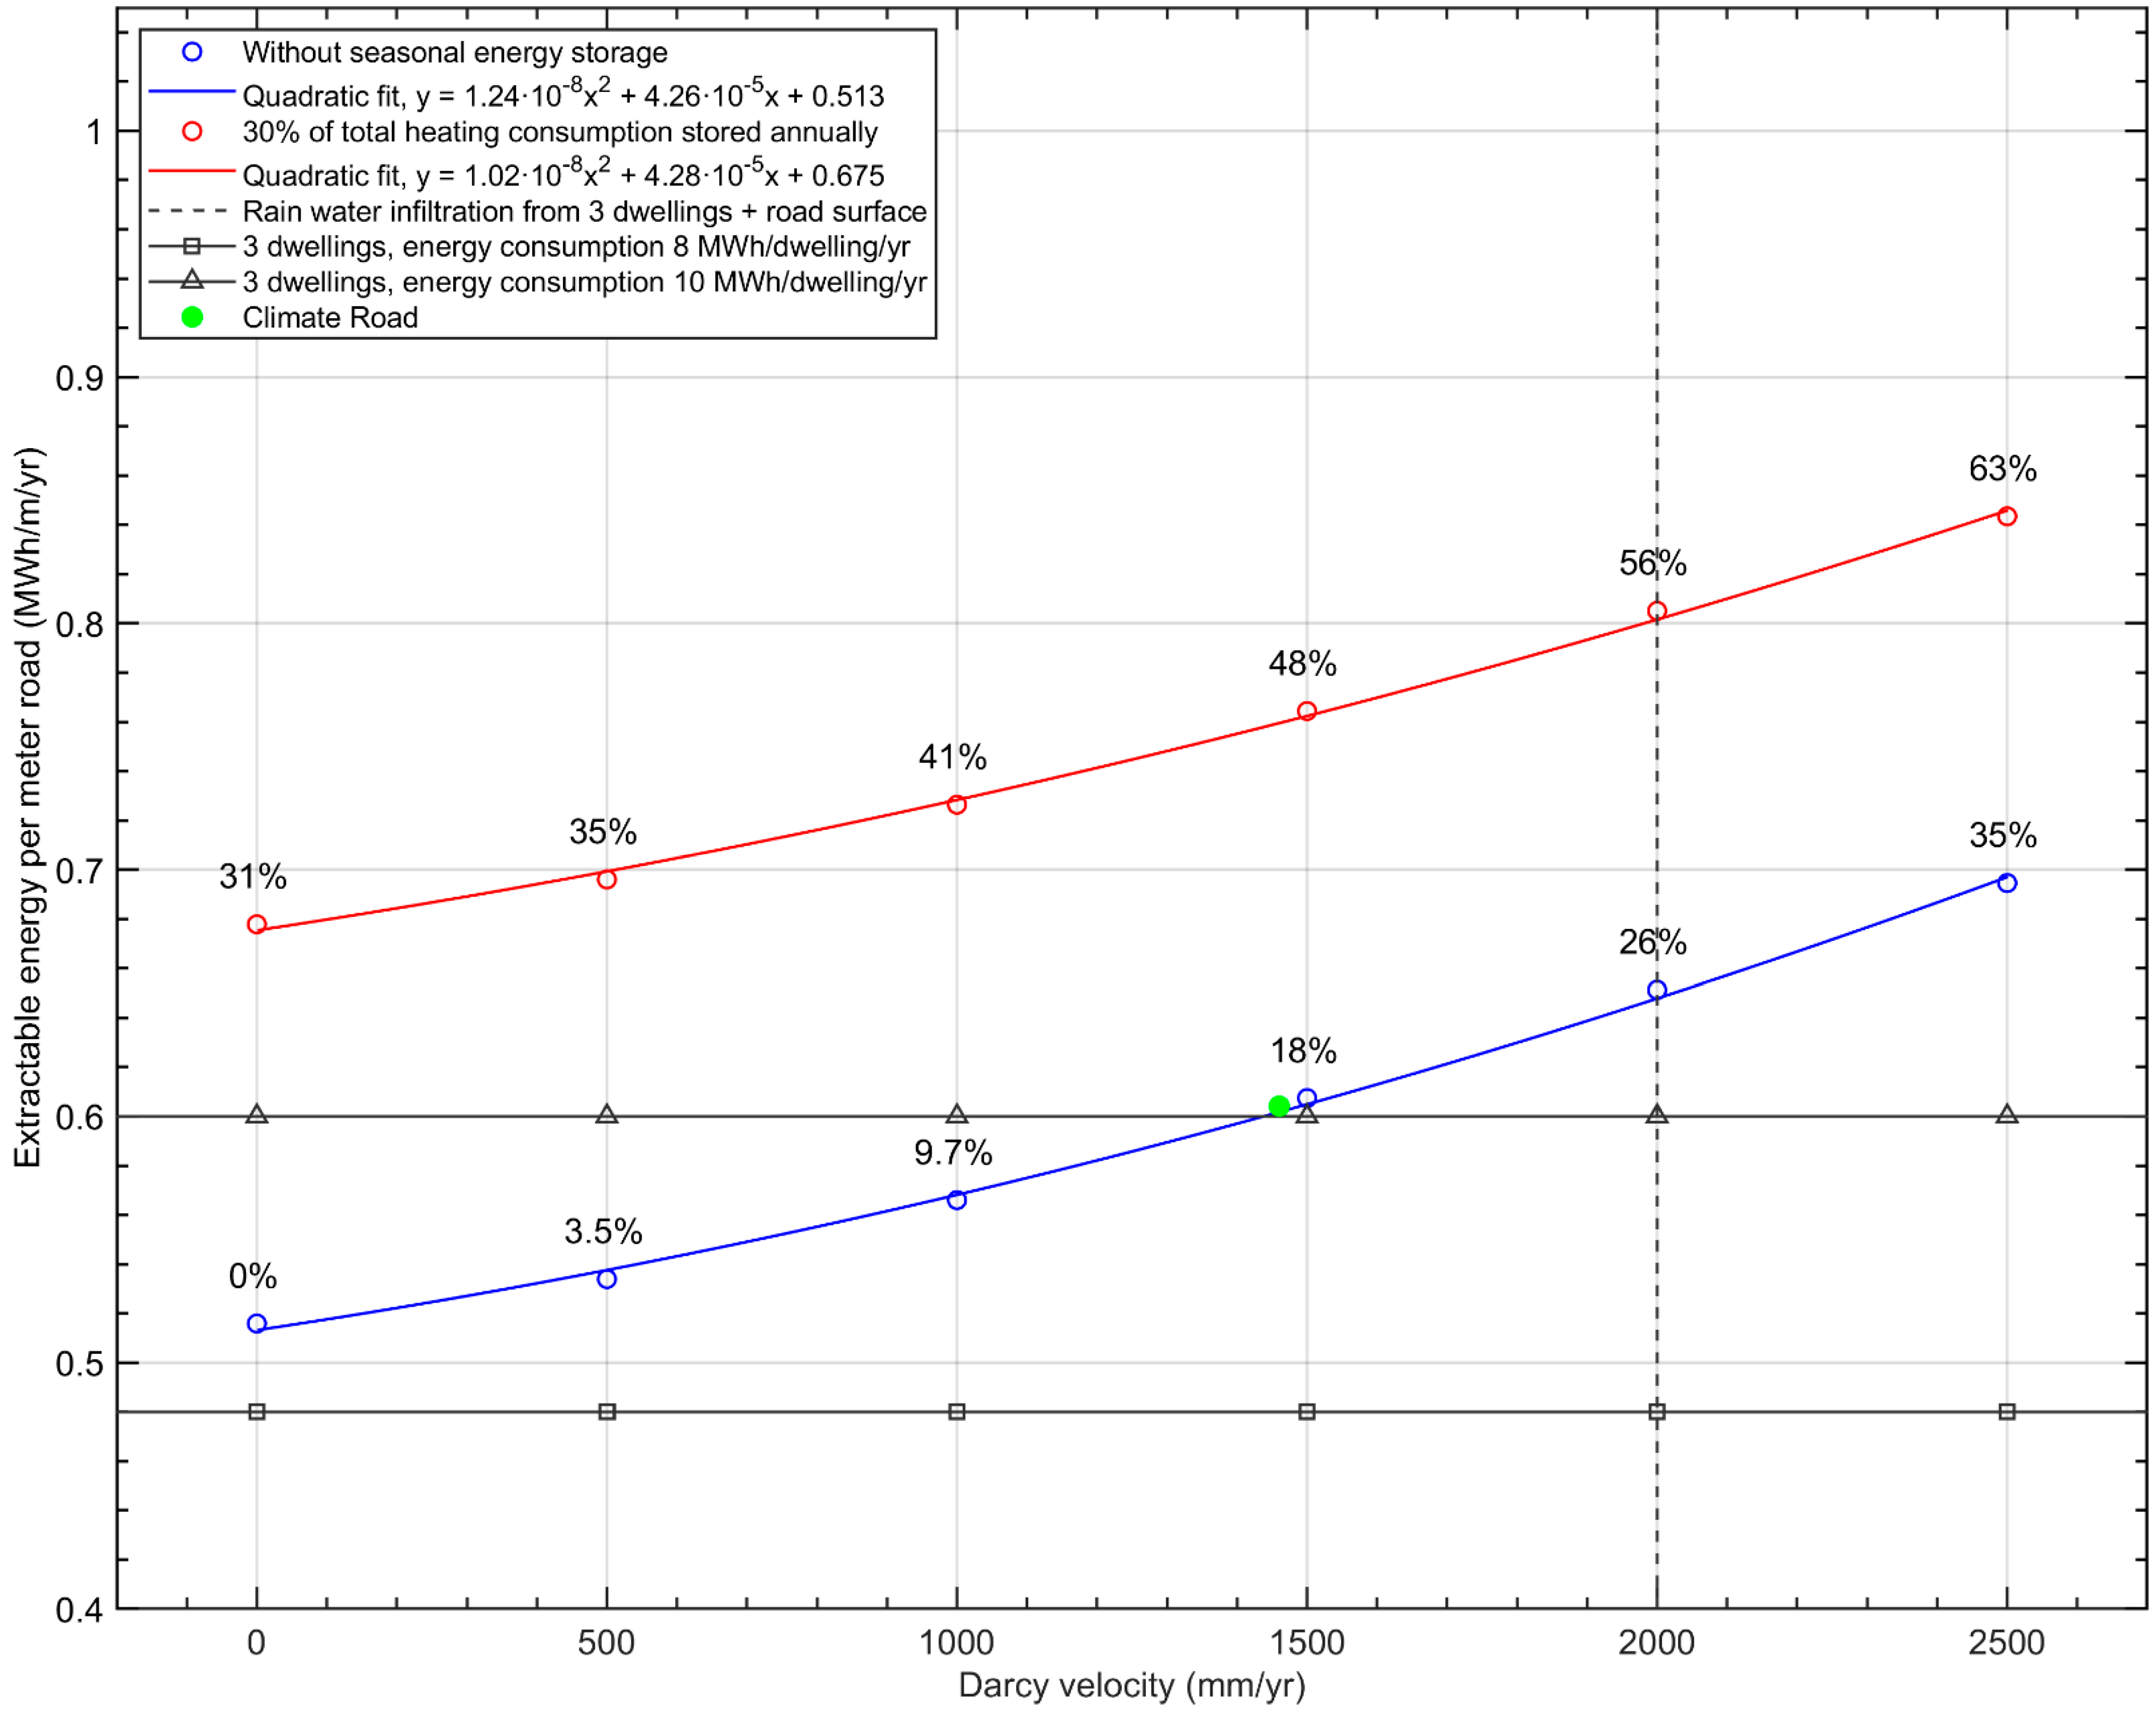
The parametric study suggests that the presence of groundwater flow from rainwater infiltration at the considered rates does not seem to significantly hamper the possibilities for seasonal energy storage in the Climate Road, which would otherwise have been a concern. The addition of seasonal energy storage ensures that the heating demand from three new dwellings can be fully supplied by the Climate Road. Active cooling is most likely required to provide reasonable performance, if cooling needs are considered as well, since brine temperatures are quite high during summer. The unwanted building heat is stored in the roadbed from summer to winter, presenting a cost-effective opportunity for seasonal energy storage. Using the subsurface as a thermal storage ensures relatively high source temperatures year-round, most importantly during the coldest days of winter. This way, the likelihood of peaks in electricity consumption from low-performing ASHPs is effectively reduced.
The present study targets a proof of technology, not a proof of business. There are some obvious savings to the initial investment that are made possible by the Climate Road as the roadbed is constructed in any case. However, typically, a traditional roadbed is just 50 cm deep, and an additional 50 cm must be excavated to ensure sufficient retardation capacity and that seasonal surface temperature variations do not significantly erode the thermal performance during winter. These additional costs must be considered in a business case study of the Climate Road. There are also some pivotal decisions to make regarding models for ownership and operation. The heating supply benefits significantly from water infiltration, sparking a discussion on how to distribute the initial investment and variable costs between the district heating company and the wastewater utility.

Author Contributions

Conceptualization, S.E.P. and T.R.A.; methodology, S.E.P., T.R.A. and K.W.T.; software, S.E.P. and K.W.T.; validation, S.E.P. and K.W.T.; formal analysis, S.E.P. and K.W.T.; investigation, T.R.A. and S.E.P.; resources, T.R.A. and S.E.P.; data curation, K.W.T., S.E.P. and T.R.A.; writing—original draft preparation, S.E.P.; writing—review and editing, S.E.P., K.W.T. and T.R.A.; visualization, S.E.P., K.W.T. and T.R.A.; supervision, T.R.A.; project administration, T.R.A.; funding acquisition, T.R.A. All authors have read and agreed to the published version of the manuscript.

Funding

This research project was funded by EU LIFE, grant number LIFE15 IPC/DK/000006-C2C CC.

Institutional Review Board Statement

Not applicable.

Informed Consent Statement

Not applicable.

Data Availability Statement

Not applicable.

Acknowledgments

The authors thank the municipality of Hedensted for their assistance and collaboration on constructing the Climate Road. We also kindly thank Kirsten Landkildehus Thomsen for her careful field and laboratory work. Finally, the authors would like to thank the journal reviewers whose constructive and relevant comments significantly improved the paper.

Conflicts of Interest

The authors declare no conflict of interest. The funders had no role in the design of the study; in the collection, analyses, or interpretation of data; in the writing of the manuscript, or in the decision to publish the results.

References

  1. IPCC. Climate Change 2022: Impacts, Adaptation, and Vulnerability. Contribution of Working Group II to the Sixth Assessment Report of the Intergovernmental Panel on Climate Change; Pörtner, H.-O., Roberts, D.C., Tignor, M., Poloczanska, E.S., Mintenbeck, K., Alegría, A., Craig, M., Langsdorf, S., Löschke, S., Möller, V., et al., Eds.; Cambridge University Press: Cambridge, UK, 2022.
  2. Vargas, C.A.; Caracciolo, L.; Ball, P.J. Geothermal energy as a means to decarbonize the energy mix of megacities. Commun. Earth Environ. 2022, 3, 66. [Google Scholar] [CrossRef]
  3. Mathiesen, B.V.; Lund, H.; Nielsen, S.; Sorknæs, P.; Moreno, D.; Thellufsen, J.Z. Varmeplan Danmark 2021—En Klimaneutral Varmeforsyning; Aalborg Universitet: Aalborg, Denmark, 2021. [Google Scholar]
  4. European Commission. An EU Strategy on Heating and Cooling; European Commission (EC): Brussels, Belgium, 2016.
  5. Lund, J.W.; Toth, A.N. Direct Utilization of Geothermal Energy 2020 Worldwide Review. In Proceedings of the World Geothermal Congress 2020, Reykjavik, Iceland, 26 April–2 May 2020. [Google Scholar]
  6. Reese, S. (Ed.) Advances in Ground Source Heat Pump Systems; Woodhead Publishing Series in Energy: Number 100; Woodhead Publisher: Duxford, UK, 2016; 452p. [Google Scholar]
  7. Staffell, I.; Brett, D.; Brandon, N.; Hawkes, A. A review of domestic heat pumps. Energy Environ. Sci. 2012, 5, 9291–9306. [Google Scholar] [CrossRef]
  8. Gabriela, L.; Bottarelli, M. Economic performance of ground source heat pump: Does it pay off? In Proceedings of the World Renewable Energy Congress, Linköping, Sweden, 8–13 May 2011. [CrossRef] [Green Version]
  9. Poulsen, S.E.; Alberdi-Pagola, M.; Cerra, D.; Magrini, A. An Experimental and Numerical Case Study of Passive Building Cooling with Foundation Pile Heat Exchangers in Denmark. Energies 2019, 12, 2697. [Google Scholar] [CrossRef] [Green Version]
  10. Pederson, S.; Jacobsen, E. Approval of Systems Entitled to Subsidies. Measurements Data Collection and Dissemination; Danish Technological Institute: Taastrup, Denmark, 2011. [Google Scholar]
  11. O’Hegarty, R.; Kinnane, O.; Lennon, D.; Colclough, S. Air-to-water heat pumps: Review and analysis of the performance gap between in-use and product rated performance. Renew. Sustain. Energy Rev. 2021, 155, 111887. [Google Scholar] [CrossRef]
  12. Gleeson, C.P.; Lowe, R. Meta-analysis of European heat pump field trial efficiencies. Energy Build. 2013, 66, 637–647. [Google Scholar] [CrossRef]
  13. The Danish Energy Agency Website. Available online: https://ens.dk/sites/ens.dk/files/Statistik/installation_af_varmepumper_2014-2021_ii.xlsx (accessed on 7 June 2021).
  14. Pellegrini, M.; Bianchini, A. The Innovative Concept of Cold District Heating Networks: A Literature Review. Energies 2018, 11, 236. [Google Scholar] [CrossRef] [Green Version]
  15. Buffa, S.; Cozzini, M.; D’Antoni, M.; Baratieri, M.; Fedrizzi, R. 5th generation district heating and cooling systems: A review of existing cases in Europe. Renew. Sustain. Energy Rev. 2019, 104, 504–522. [Google Scholar] [CrossRef]
  16. Lindhe, J.; Javed, S.; Johansson, D.; Bagge, H. A review of the current status and development of 5GDHC and characterization of a novel shared energy system. Sci. Technol. Built Environ. 2022, 28, 595–609. [Google Scholar] [CrossRef]
  17. European Commission. The Communication from Commission to the European Parliament, the Council, the European Economic and Social Committee and the Committee of the Regions. Powering a Climate-Neutral Economy: An EU Strategy for Energy System Integration; European Commission: Brussels, Belgium, 2020.
  18. D’Odorico, P.; Davis, K.F.; Rosa, L.; Carr, J.A.; Chiarelli, D.; Dell’Angelo, J.; Gephart, J.; MacDonald, G.K.; Seekell, D.A.; Suweis, S.; et al. The Global Food-Energy-Water Nexus. Rev. Geophys. 2018, 56, 456–531. [Google Scholar] [CrossRef]
  19. Price, S.J.; Terrington, R.L.; Busby, J.; Bricker, S.; Berry, T. 3D ground-use optimisation for sustainable urban development planning: A case-study from Earls Court, London, UK. Tunn. Undergr. Space Technol. 2018, 81, 144–164. [Google Scholar] [CrossRef]
  20. Cerra, D.; Alberdi-Pagola, M.; Andersen, T.; Tordrup, K.; Poulsen, S. Feasibility study of collective heating and cooling based on foundation pile heat exchangers in Vejle (Denmark). Q. J. Eng. Geol. Hydrogeol. 2020, 54, qjegh2020-114. [Google Scholar] [CrossRef]
  21. Brandl, H. Energy foundations and other thermo-active ground structures. Géotechnique 2006, 56, 81–122. [Google Scholar] [CrossRef]
  22. Laloui, L.; Loria, A.F.R. Analysis and Design of Energy Geostructures, 1st ed.; Academic Press: Cambridge, MA, USA; Elsevier: Amsterdam, The Netherlands, 2019; 1062p, ISBN 9780128206232. [Google Scholar]
  23. Loveridge, F.; McCartney, J.S.; Narsilio, G.A.; Sanchez, M. Energy geostructures: A review of analysis approaches, in situ testing and model scale experiments. Géoméch. Energy Environ. 2020, 22, 100173. [Google Scholar] [CrossRef] [Green Version]
  24. Charlesworth, S.; Faraj-Llyod, A.; Coupe, S. Renewable energy combined with sustainable drainage: Ground source heat and pervious paving. Renew. Sustain. Energy Rev. 2016, 68, 912–919. [Google Scholar] [CrossRef]
  25. Andersen, T.R.; Poulsen, S.E.; Tordrup, K.W. The Climate Road—A Multifunctional Full-Scale Demonstration Road That Prevents Flooding and Produces Green Energy. Water 2022, 14, 666. [Google Scholar] [CrossRef]
  26. Domenico, P.A.; Schwartz, F.W. Physical and Chemical Hydrogeology, 2nd ed.; John Wiley & Sons Inc.: New York, NY, USA, 1998; 528p. [Google Scholar]
  27. Guo, Y.; Hu, X.; Banks, J.; Liu, W. Considering buried depth in the moving finite line source model for vertical borehole heat exchangers—A new solution. Energy Build. 2020, 214, 109859. [Google Scholar] [CrossRef]
  28. Crank, J.; Nicolson, P. A practical method for numerical evaluation of solutions of partial differential equations of the heat-conduction type. Math. Proc. Camb. Philos. Soc. 1947, 43, 50–67. [Google Scholar] [CrossRef]
  29. Fowler, C.M.R. The Solid Earth, An Introduction to Global Geophysics; Cambridge University Press: Cambridge, UK, 2005; pp. 230–231, 685p. [Google Scholar]
  30. Khan, Z.H.; Islam, M.R.; Tarefdera, R.A. Determining asphalt surface temperature using weather parameters. J. Traffic Transp. Eng. 2019, 6, 577–588. [Google Scholar] [CrossRef]
  31. Møller, I.; Balling, N.; Ditlefsen, C. Shallow subsurface thermal structure onshore Denmark: Temperature, thermal conductivity and heat flow. Bull. Geol. Soc. Den. 2019, 67, 29–52. [Google Scholar] [CrossRef]
  32. Verein Deutscher Ingenieure (VDI). Thermische Nutzung des Untergrundes: Grundlagen, Genehmigungen, Umweltaspekte; Richtlinie 4640, Blatt 1; Verein Deutscher Ingenieure: Dusseldorf, Germany, 2010; 33p. [Google Scholar]
  33. Poulsen, S.; Alberdi-Pagola, M. Interpretation of ongoing thermal response tests of vertical (BHE) borehole heat exchangers with predictive uncertainty based stopping criterion. Energy 2015, 88, 157–167. [Google Scholar] [CrossRef]
  34. Latron, J.; Gallart, F. Seasonal dynamics of runoff-contributing areas in a small mediterranean research catchment (Vallcebre, Eastern Pyrenees). J. Hydrol. 2007, 335, 194–206. [Google Scholar] [CrossRef]
  35. Gehlin, E.A.; Spitler, J.D. Effects of Ground Heat Exchanger Design Flow Velocities on System Performance of Ground Source Heat Pump Systems in Cold Climates. In Proceedings of the ASHRAE Winter Meeting, Chicago, IL, USA, 24–28 January 2015. [Google Scholar]
Figure 1. Overview of the road sections with traditional and permeable asphalt. A-A’ and B-B’ indicate transects of the sections with permeable and impermeable asphalt, respectively.
Energies 15 04505 g001
Figure 2. The construction pit with the bentonite membrane (white geotextile), blue Ø160 mm drainage pipes on the sides, and black geothermal piping loops embedded in soft DrænAF gravel with the coarser DrænStabil gravel on top. The kindergarten with the GSHP using the Climate Road as a collector is visible in the top right corner of the picture.
Energies 15 04505 g002
Figure 3. Transect of the road sections with permeable (A-A’) and traditional asphalt (B-B’), respectively. A-A’ and B-B’ refer to the transects shown in Figure 1. The permille and arrow labels refer to the inclination of the road surface and its direction. The illustration is not to scale.
Energies 15 04505 g003
Figure 4. (a) Side view of a buried BHE in the model proposed in [27]. (b) Top view of the buried BHE. The finite line source model is used to calculate the temperature at a distance r from the borehole. (c) In the present case we adapt the model to describe a horizontal pipe section buried in the roadbed.
Energies 15 04505 g004
Figure 5. Conceptual illustration of the brine temperature model with the 16 pipe segments embedded in the roadbed. Infiltration into the roadbed is indicated by the Darcy flow vector ud. The image sources and Darcy flow vector are shown in grey.
Energies 15 04505 g005
Figure 6. 1D discretization of the subsurface. The temperature at node i is calculated from the temperatures at the node itself as well as both neighbors at the previous timestep.
Energies 15 04505 g006
Figure 7. Numerical model interpretation of the TRT of the roadbed geothermal piping from the Thermoroad (duration: 48 h).
Energies 15 04505 g007
Figure 8. (a) Measured daily average air temperature and solar radiation at the Climate Road. (b) Wind speed and relative humidity at the Climate Road.
Energies 15 04505 g008
Figure 9. Monthly measured precipitation and estimated Darcy velocity from flow meter measurements.
Energies 15 04505 g009
Figure 10. (a) Brine flow and Reynolds numbers (Re) during operation. (b) In- and outlet temperatures during operation. The hiatus in operation between 12 November 2018 and 19 March 2019 was due to a fluid pressure issue during which the original collector pipes for the GSHP were used.
Energies 15 04505 g010
Figure 11. (a) Domestic hot water, room heating, and electricity consumption by the heat pump and solar collector heat production. (b) Daily averages of COP. “Out of operation” refers to the geothermal piping in the roadbed, not the GSHP, as the original ground collectors were used instead during this period.
Energies 15 04505 g011
Figure 12. Model predictions of brine temperatures entering the cold side of the heat pump and corresponding measured brine temperatures.
Energies 15 04505 g012
Figure 13. Modelled brine temperatures to the heat pump assuming an annual heat consumption of 30.2 MWh, λs = 1.50 W/m/K, and ud = 1460 mm/yr.
Energies 15 04505 g013
Figure 14. Estimated extractable energy for different infiltration rates and seasonal energy storage. Percentages are relative to the reference case indicated by 0% (zero infiltration, no seasonal energy storage).
Energies 15 04505 g014
Table 1. Technical declarations for the roadbed materials. DS refers to Danish standards, which are available in English at https://www.ds.dk/en/about-standards, accessed on 3 May 2022. DrænStabil and DrænAF are registered trademarks of the NCC company.
PropertiesStandard/MethodDrænStabil®DrænAF®
Grain size distributionDS-EN 13285
DS-EN 933-1
GN
D50 = 17.0 ± 5 D15 = 5.3 ± 2
Gc85-15 GTC25/15 D50 = 3.3 ± 1 D15 = 2.1 ± 1
Fine grain contentDS-EN 13285/DS-EN 933-1Nonef2
Shape indexDS-EN 13242/DS-EN 933-4SI20-
Degree of crushingDS-EN 13242/DS-EN 933-5C50/10C50/30
Infiltration velocity (mm/s)Non-official guideline>1015 ± 5
Hydraulic conductivity (mm/s)DS CEN ISO TC 17892-110.510 ± 5
Drainable porosity (%)From reference density>30-
Reference density (kg/m3)DS-EN 13286-5. Vibration with water content = 3% ± 11800-
Los Angeles index (%)DS-EN 1097-2LA30-
E modulus (MPa)DS-EN 13286-7300-
Publisher’s Note: MDPI stays neutral with regard to jurisdictional claims in published maps and institutional affiliations.

