Abstract
Within the context for deep geological disposal (DGD) of high-level radioactive waste (HLW), thermo-hydro-mechanical (THM) coupled numerical modeling has become significantly important for studying the safe disposal of HLW. In this work, a 3D mechanical module is incorporated into the thermal–hydraulic (TH) coupled code TOUGH2, thus forming an integrated THM coupled simulator referred to as TOUGH2Biot. The Galerkin finite element method is used to discretize the space for rock mechanical calculation. The mechanical process is sequentially coupled with the fluid and heat flow processes, which further gives feedback to the flow through stress-dependent hydraulic properties (e.g., porosity and permeability). Based on the available geological data at the Meuse/Haute-Marne Underground Research Laboratory (MHM URL) in France, the improved simulator is used to analyze the coupled THM behaviors of the Callovo-Oxfordian claystone (COx) induced by thermal loading. The anisotropy of material parameters (e.g., permeability and thermal conductivity) caused by the bedding and of in-situ stresses are well considered in our model. The numerical simulation can reasonably reproduce the field observations, including changes in temperature and pore pressure at monitoring boreholes during the ALC1604 experiment. The modeling results indicate that the anisotropic effects are remarkable, and temperature, pore pressure, and effective stress along the bedding increase more rapidly than in the vertical direction. Insight into numerical results through the visual model is beneficial for helping us to interpret the field observations and to understand the complex THM problem in the COx claystone formation. The numerical method and the modeling results presented in this work can be effectively used in support of performance assessment studies of HLW disposal sites to build confidence in the safety of future applications of nuclear energy systems.
1. Introduction
Nuclear energy has become an important energy resource with the rapid development of societies and economies worldwide, and is widely used in military, energy, industry, aerospace, and other fields [1,2,3]. It is believed that nuclear energy is one of the most promising future energy sources for mankind. Compared with thermal power plants, nuclear power generation has significant advantages, such as less energy consumption, less pollution, less harm to the environment, and a low proportion of fuel costs in power generation costs [2,3]. Moreover, nuclear power can play a very significant role in stable energy supplies while also helping to reduce greenhouse gas emissions [1,2]. As a low-carbon energy source, nuclear power is an important component of new energy and an important basis for realizing sustainable energy development.
The disposal of high-level radioactive waste (HLW) comes with the development of nuclear power. Safe disposal of HLW is an unavoidable and urgent problem in the development of nuclear energy [1,4]. Currently, deep geological disposal (DGD) is regarded as a feasible and safe disposal method of HLW [1,4,5,6]. The choice of DGD method for radioactive waste disposal will be of more interest in the future, which ensures isolation from human access and retardation of radionuclide release in the geosphere (if any release occurs). Figure 1 shows a general architecture of the industrial DGD facility for the HLW. Generally, the DGD facility can be divided into four parts [6,7]: (1) surface facilities used for nuclear activities (e.g., rail terminal and inspecting) and excavation activities (e.g., workshops, storage and cement plant); (2) transport facilities (e.g., ramps) used for transporting waste packages down to the underground disposal area; (3) underground disposal facilities (e.g., micro-tunnels) used for emplacing the HLW; and (4) ventilation facilities (e.g., shafts) used for ventilation and workers’ transportation.
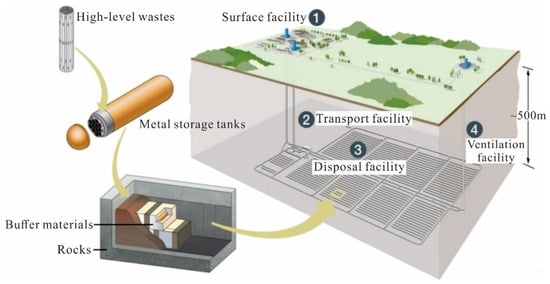
Figure 1.
Schematic diagram of deep geological disposal for the HLW.
Based on the DGD concept proposed by the French National Radioactive Waste Management Agency (ANDRA), vitrified HLWs are hot cast into stainless steel canisters and conditioned in the thick steel over-pack to prevent glass leaching induced by temperature increase during the thermal production stage [7]. In addition, the thick steel over-pack is also very important for blocking the flow of formation water into the glass matrix for hundreds of years [4]. The processed over-pack can be disposed in the deep disposal facility, which generally is the horizontal micro-tunnel with a diameter of 0.7 to 0.9 m [4,5,7].
The HLW is still very radioactive after being disposed underground for many years [1,5,8,9]. Moreover, its radioactivity is decreasing over time, and it takes hundreds of thousand years to become comparable to natural uranium. During the decay of radioactive elements, a large amount of heat is released and absorbed by the surrounding host rocks, which leads to significant changes in the thermal field around the HLW repository (e.g., temperature rise, thermal expansion) [1,9]. The distribution of pore pressure will also be significantly affected by temperature rise, the excavation/drilling of tunnels, and the backfill of the bentonite buffer barrier. Therefore, the potential fluid (water and gas) flow can be driven by the altered pore pressure gradients in the near field of the micro-tunnel (e.g., related to the excavation damage zone (EDZ) in which hydraulic properties are modified). Moreover, solute diffusion between the percolating fluid and the repository components will take place accompanied with fluid flow [1]. The changes of temperature will further alter the stress field and result in an increase of radial stress acting on the casing [4]. These simultaneous functions will induce thermo-hydro-mechanical (THM) coupled processes and have a significant effect on the long-term safe design of the underground HLW disposal facility [1,4,10]. Moreover, the geological disposal of HLW is very complex since many different THM processes occur over different time scales and at different rates [1,4].
Generally, clay/claystone geological formations offer very beneficial conditions (e.g., low molecular diffusion, low intrinsic permeability and high radionuclide retention capacity) as a potential formation for HLW repositories [10,11,12]. Recently, several clay formations are being considered for national repository concepts, included the Boom clay at the Hades laboratory in Belgium [13,14,15], the Opalinus clay at Mont Terri research laboratory in Switzerland [16,17,18], and the Callovo-Oxfordian claystone at the Meuse/Haute-Marne Underground Research Laboratory (MHM URL) in France [4,5,8]. These field laboratory experiments have highlighted the existence of a correlation between changes in the thermal field and variations in the hydraulic and mechanical behavior of clay formations [7].
In 2000, the ANDRA began to build the MHM URL in the deep Callovo-Oxfordian (COx) claystone formation. The MHM URL was mainly used to demonstrate the feasibility for operating the HLW disposal in the target geological formation by conducting the in-situ heating experiments [4,7,10]. To investigate the THM behaviors in the COx claystone induced by thermal loading, a step-by-step experimental program has been conducted since 2005 [4,5,8,10,19]. Small-scale experiments for heating boreholes (e.g., TER, TED and TFW experiments with diameter of 100 to 250 mm) and full-scale experiments for heating a micro-tunnel (e.g., ALC1604 experiment with diameter of approximately 0.7 m) were conducted at the main level of the URL. These in-situ experiments preliminarily proved the feasibility of constructing the radioactive waste disposal in the COx claystone, but the final design of disposal facility is not fixed yet, and specified optimizations are still in progress [4,19]. The field test also indicated that the THM coupling responses of surrounding formation and the stress loading on the casing are key issues for improving in the design of safe HLW disposal [4].
These heating experiments provide a large amount of observation data related to the THM behavior in the formation, which can be usefully employed to setup the numerical model. Based on the TER experiment, Jia et al., (2009) used a coupled theoretical formulation that incorporates a constitutive model especially developed for the COx material, to investigate thermal impact on the in-situ behaviour of the COx claystone [8]. The TOUGH-FLAC simulator using a sequential coupling scheme was employed to analyze thermally-driven THM coupled processes in COx claystone, both TED and ALC1604 experiments are simulated for model validation [20]. Tourchi et al., (2021) presented a 3D THM coupled numerical modelling of the ALC1604 experiment intended to assist in the proper interpretation of the field observations [5]. Their model fully considered the hydraulic, thermal and mechanical anisotropy of the COx claystone as well as the anisotropic in-situ stress. Moreover, a total of five research teams joined the DECOVALEX-2019 project and investigated upscaling THM modeling from a small-scale TED experiment to a full-scale ALC experiment [19]. These numerical results had proved able to match the field observations very satisfactorily. However, there are some differences between the modeling results of different simulators [19,21]. This means numerical simulators for underground engineering research need to be further developed to enhance our understanding of a complex THM problem induced by the HLW disposal.
The novelty of this work is developed a new 3D thermo-hydro-mechanical (THM) coupled simulator, to investigate the THM responses of the near/far field formation during the disposal of HLW. The thermo-poro-elastic model is applied for modelling the THM behavior of the COx claystone. In addition, we improved the ability of anisotropic heat conduction simulation, which was not considered in the original TOUGH2 code [22]. Compared to the TOUGH + FLAC simulator [20], it is easier to improve the TOUGH2Biot code to implement specific simulation functions for different site conditions and characteristics. Moreover, data exchange is carried out internally during simulation by TOUGH2Biot, thus the computational efficiency is higher compared to the TOUGH + FLAC. The improved simulator is used to numerically simulate the full-scale heating experiment conducted by the ANDRA in the COx formation at the MHM URL. The main targets of this work are to reproduce the field observations and to assist the essential explanation of the in-situ observations through the numerical model during the full-scale ALC1604 heating experiment. Moreover, a long-term cooling recovery stage was carried out to identify the THM responses after heating. The detailed changes in pore pressure, temperature, stress and mechanical deformation within the COx claystone are analyzed based on the validated model. These modeling studies are very beneficial for improving our understanding of a complex THM behavior in the COx claystone during the actual HLW disposal.
The paper continues with a description of the design and construction of the ALC1604 experiment test in Section 2. The general THM coupled governing equations used in the numerical analysis are briefly given in Section 3. The construction of the numerical model and the determination of model parameters are fully described in Section 4. The corresponding simulation results compared with the field measured data, and prediction of the far field (e.g., generally related to the host rock without damage) THM responses are analyzed and discussed in Section 5. The final conclusions of this work are provided in Section 6.
2. Description of the ALC1604 Experiment
Figure 2 shows the concept of the ALC1604 experiment in the MHM URL. This site was used to conduct an in-situ large scale heating test and characterize the THM behavior of HLW repository under thermal loading [4,5,7]. The ALC1604 cell micro-tunnel was excavated from the GAN gallery and placed in the major principal horizontal stress direction [4,12,23]. The full construction of the ALC1604 cell (e.g., excavation and casing) was finished within seven days in 2012. In addition, a total of nine boreholes were excavated from the GAN and GRD galleries to monitor the THM behavior of the surrounding host rocks [4,5,7].
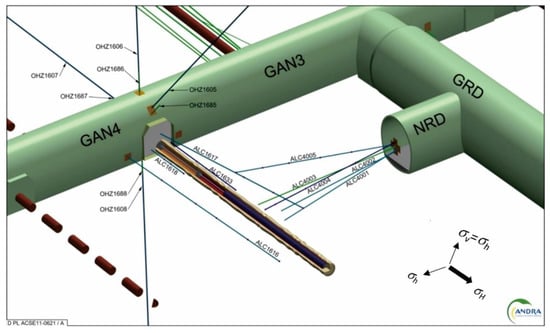
Figure 2.
Schematic view of the ALC1604 heating test. Reprinted from [4,5] with permission from Elsevier.
Figure 3 shows the detailed view of locations of monitor boreholes and observation points around the ALC1604 cell [5]. A total of six monitoring boreholes were drilled and equipped with one (ALC4001 and ALC 4002), three (ALC1617 and ALC1618), and five (ALC4005 and ALC 1616) pore pressure and temperature sensors to measure their changes induced by power heating. To guarantee the low permeability and compressibility, resins were used as the backfill materials in these six boreholes. Two monitoring boreholes were drilled and equipped with five (ALC4003 and ALC1633) temperature sensors. To reproduce the thermal properties (e.g., the thermal conductivity) of the in-situ formation, a blend of bentonite and grout was used as the backfill materials in these two boreholes. Another monitoring borehole was drilled and equipped (ALC4004) with twenty points of measurement of the displacement along the axis of the borehole using a magnet extensometer (Mag-X) method.
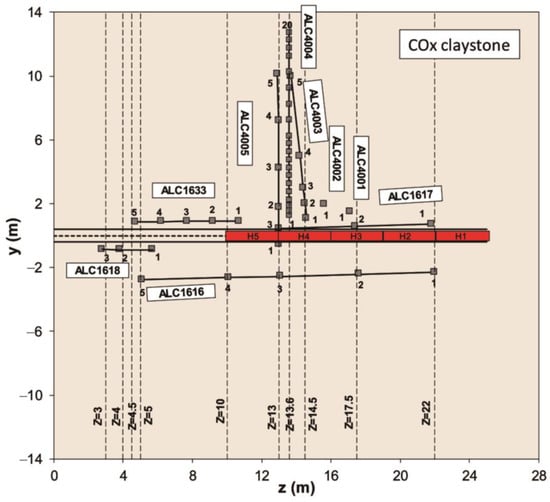
Figure 3.
Locations of monitor boreholes and observation points around the ALC1604 cell. Reprinted from [5] with permission from Elsevier.
The length and diameter of the ALC1604 cell are 25 m and 0.7 m, respectively, which is a horizontal micro-tunnel used for the in-situ heating experiment (see Figure 4). The ALC1604 cell involves a 6 m section (e.g., Cell head) and a 19 m useable section (e.g., Cell body). To enable the potential retrieval of waste containers and prevent the serious deformation of the host formation, both head and useable sections incorporates a non-alloy steel casing (e.g., S235 structural steel) with high mechanical strength [4,5]. The diameter of the casing in the useable section (“Casing”) is slightly smaller than in the head section (“Insert”). As a result, the “Casing” can easily slide through into the “Insert”. This design is particularly used to “absorb” the longitudinal thermal expansion occurred in the useable section and reduce the radial stress effects on the wall [4,7].
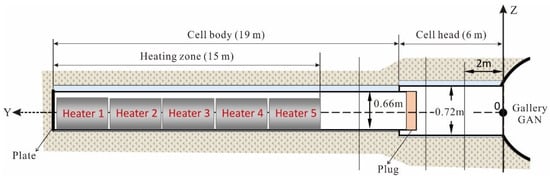
Figure 4.
Longitudinal view of the ALC1604 cell. Reprinted from [5] with permission from Elsevier.
Five heaters (Heaters 1~5, each of the length of 3 m) were installed contiguously in the useable section between 10 m and 25 m from the GAN drift wall [4]. A short two-week heating test with the low power of 33 W/m was applied first, to check the operability of the heating system and the acquisition of the monitoring system [4]. Then, the main heating stage was launched with a constant power of 220 W/m. This power was estimated to lead the maximum temperature of about 90 °C at the casing during the power heating stage [4,5]. After six years of heating, the experiment system entered a stage of gradual cooling. During the heating experiment, a number of short power outages and failures of the fans of the control cabinet were reported, but it was found that these disruptions had not caused any detectable variation in the thermal field of both the sleeve and in the COx formation [4,5].
3. Numerical Method
A specifically-designed simulator is needed to simulate the coupled thermo-hydro-mechanical (THM) behavior of a system that undergoes heating, such as the COx claystone during HLW disposal operations [4,5,6,7]. In this work, the coupled THM simulator TOUGH2Biot has been used. TOUGH2Biot has been developed by incorporating a 3D mechanical module into the existing TOUGH2 thermal–hydraulic (TH) framework [24]. In the following, we focus on the theoretical treatment of the coupling between multiphase heat flow and mechanical processes in porous media under heating conditions.
3.1. Governing Equations
3.1.1. Hydraulic Processes
The distribution of pore pressure is mainly controlled by the hydraulic gradient induced by thermal loading in the COx claystone. The general mass balance equation of multicomponent (e.g., water, salt and air) fluid flow can be described as
where indicates the component term, is mass accumulation, is mass flux, is mass source/sink, and div is the divergence operator.
The pore water can appear in aqueous (A) and gaseous (G) phases (induced by heating and evaporation), thus the term of the porous medium (e.g., the COx claystone formation) is calculated as
where is porosity, and are saturation and density of phase , respectively, and is mass fraction of component in phase . For simplicity, and are indicators of the component and phase, respectively. are water, salt and air components, respectively, and are aqueous and gaseous phases, respectively.
The term includes advective flux and diffusive flux can be described as
where and are advection flux and diffusion flux of component in phase , respectively.
For the aqueous phase, can be obtained by the multiphase version of Darcy’s law
where is the intrinsic permeability of rock, is the aqueous viscosity, is the aqueous density, is the aqueous relative permeability, is the aqueous pore pressure, and is the gradient operator.
For the gaseous phase, is calculated as by considering the Klinkenberg effects [25]
where is the gaseous viscosity, is the gaseous density, is the gaseous relative permeability, is the gaseous pore pressure, and is the Klinkenberg factor [25]. The calculation equations can be employed to estimate the value of are discussed in [26].
The diffusive mass flux is calculated by the Fick’s law of the simulation version as [22,27]
where is molecular diffusion coefficient of component in phase , and is the medium tortuosity of phase .
3.1.2. Thermal Processes
The disposal of HLW in the COx claystone can lead to a maximum temperature of 90 °C on the interface steel casing/rock wall based on the design criteria of the Cigéo project [4,7]. Heat produced from heaters in the casing gradually spreads to the surrounding rocks mainly by heat conduction. However, heat advection is slight since the mass flux is very small for the low permeability COx claystone. In addition, the gravitational potential energy is not considered in the energy balance due to its negligible effects [22,28].Thus, the general energy balance equation can be described as
where indicates the heat term, is the heat accumulation, is the heat flux, and is the heat source/sink.
The term includes the thermal energy of fluid and rock can be calculated as
where and are density and heat capacity of the host rock, respectively, is temperature, and is the specific internal energy of phase .
The term considers heat conduction and heat advection can be described as
where is the composite thermal conductivity of the host rock and is the specific enthalpy of phase .
3.1.3. Mechanical Processes
Under conditions similar to the COx claystone formation, changes in pore pressure and rock temperature are expected to induce variations in the local stress field. By neglecting the inertial term, the stress balance of the porous medium can be defined as
where indicates the total stress and is the body force.
In this work, the mechanical calculation obeys the assumptions of small deformation and material continuity. According to the stress equilibrium, stress–strain relationships (e.g., elastic material of this work), and compatibility equations, the 3D THM coupled calculation model can be obtained as [24]
where is the displacement, and are shear and bulk moduli, respectively, is the Poisson’s ratio, is the Biot coefficient, is the linear thermal expansion coefficient, and is a diagonal 1 tensor.
The infinitesimal strain is calculated from the displacement according to the geometric equations and written as
The incremental stress can be defined in a general form as
In Equation (11), the stress balance works on the effective stress, which is calculated by considering the Biot theory coefficient effects and is evaluated written as
where is the effective stress and is pore pressure ().
3.2. Numerical Coupling Method
Figure 5 indicates the coupling methods between the thermal, hydraulic and mechanical processes. For numerical solution in each time-step, the governing equations are sequentially solved in TOUGH2Biot. For the deformable rock media, the basic couplings between the fluid and heat flow and mechanical processes are developed based on (1) the effective stress law that calculates the effects of pressure and temperature changes on the stress and mechanical deformation, and (2) the empirical models used for calculating the changes in porosity and permeability of the COx claystone formation related to changes in stress and mechanical deformation [29,30,31,32].
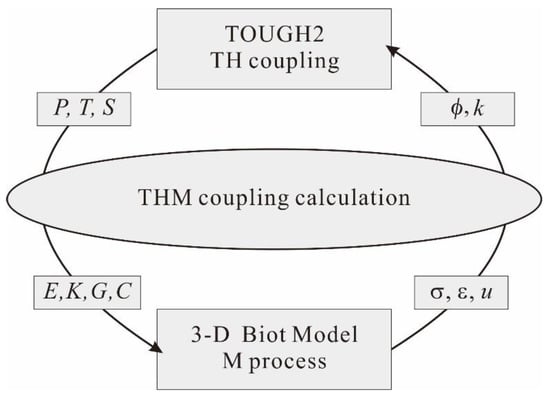
Figure 5.
Coupling methods used for the thermo-hydro-mechanical processes.
In this work, the mechanical response gives feedback to the fluid and heat flow through the stress-dependent hydraulic properties. Herein, the transient porosity of the porous medium can be calculated as [31]
For the water saturated COx claystone formation, the permeability changes are determined as
where is the residual porosity, and are porosity and permeability at zero stress, is the mean value of effective stresses, and are experimental coefficients.
The thermal and hydaylic (TH) processes are calculated using an integral finite difference method (IFDM) [22], while the mechanical model is implemented by the Galerkin finite element method (FEM) [24]. To take into account the consistence of finite-difference and finite element methods, cuboids are chosen to discretize the continuous space. Pressure and temperature at the nodes and displacement, strain and stress at the elements are calculated by interpolation method.
4. Model Setup
4.1. Conceptual Model, Geometry, and Spatial Discretization
According to the ALC1604 experiment field conditions, a three-dimensional (X × Y × Z) 50.7 m × 50 m × 50.7 m conceptual model is built as given in Figure 6. Axis Y is along the micro-tunnel direction, axis X is parallel to the gallery GAN direction, and axis Z is the vertical direction. The ALC1604 cell with a dimeter of 0.7 m is located in the model center. The distance of the micro-tunnel wall to the gallery GRD boundary is 25 m [4,5]. The Y-axis is the direction of the maximum horizontal principal stress with a value of 16.2 MPa; the minimum horizontal principal stress is along the X direction with a value of 12.4 MPa; and the vertical principal stress is 12.7 MPa at the 490 m main level of the URL [5,23]. The ALC1604 cell with a 25 m length is connected to the gallery GAN. Five heaters (Heaters 1~5) are located in the range of Y = 10~25 m from the gallery GAN.
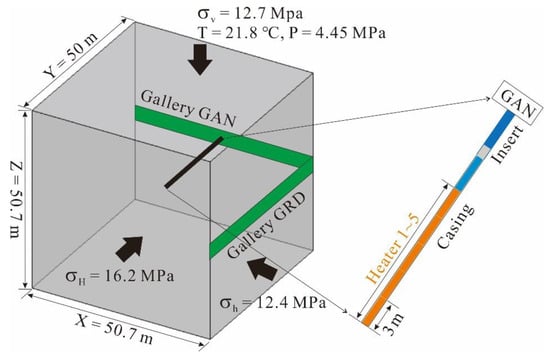
Figure 6.
The 3D conceptual model of the ALC1604 experiment with initial and boundary conditions.
To interpret the observed thermo-hydro-mechanical behavior of surrounding host rocks, a 2D plane strain analyses is constructed in this work due to the more time-consuming 3D simulation. Figure 7a shows the numerical grids used in the 2D simulation. Mesh refinement is performed in the surroundings of the ALC1604 micro-tunnel, where a minimum spatial increment of 0.1 m is considered. Internodal distances then progressively increase moving away from the micro-tunnel to 0.2, 0.3 m, and 0.5 m at the lateral boundary. This specifically-refined mesh is fundamental to realistically capture the transient evolution of pressure and temperature under the large gradients expected in this portion of the power heating system [5,6,10]. The total mesh of the 2D model contains 16,129 hexahedral elements and 32,768 nodes.
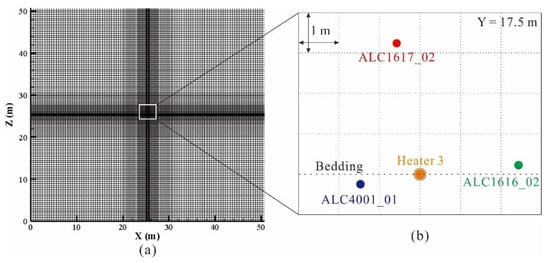
Figure 7.
(a) The numerical grids used in the 2D simulation and (b) the distribution of monitoring boreholes surrounding the Heater 3.
A vertical 2D X-Z section at Y = 17.5 m from the GAN gallery (i.e., passing through the middle point of the Heater 3) is used to investigate the patterns predicted by the numerical model. There are three monitoring boreholes that involve six temperature and pressure sensors in the target section as shown in Figure 7b [4,5]. In addition, monitoring boreholes ALC1616 and ALC1617 are placed along the bedding and in the vertical direction, respectively [4,5]. This is beneficial for investigating the anisotropic effects of thermal and hydraulic properties on THM behaviors in the COx claystone during thermal loading, since the distance difference between the sensors and the heat source is small (e.g., about 1.0 m).
4.2. Initial and Boundary Conditions
The initial pore pressure in the model top is 4.45 MPa and obeys the hydrostatic pressure distribution in the simulation domain [5]. The initial pore pressure in the ALC1604 cell is 0.1 MPa (e.g., atmospheric pressure) and saturated with air. The initial temperature in the model center is 21.8 °C [4,5]. The in-situ geothermal gradient is 4.0 °C/100 m [19]. Formation water is considered highly diluted (i.e., dissolved solids are not accounted for in the calculations). The initial water saturation is 1.0 in the host formation. The ALC1604 cell is considered draining throughout the simulation due to the micro-tunnel is not backfilled [4]. Constant pressure and temperature are simply specified for the top, bottom and lateral boundaries. In addition, normal to the lateral and bottom boundary surfaces are assigned with zero-displacement, but the top boundary surface can move freely [29,33].
4.3. Model Parameters
Table 1 shows the main petrophysical, hydraulic and thermal parameters for the host rock and their reference sources. Porosity at the in-situ formation is estimated at approximately 17.3% [5,7]. The permeability of the COx claystone is very low, since its pore diameter is very small with a mean value of 0.02 μm [4]. In addition, an anisotropy ratio of 2 to 3 is considered for the intrinsic permeability, based on the available information on the preferential orientation of minerals within the COx formation [4,7,34]. In this work, permeability values of the COx claystone parallel and vertical to the bedding are estimated at 2.0 × 10⁻²⁰ m2 and 1.0 × 10⁻²⁰ m2, respectively. These values are based on the back-analysis of the field measured pore pressure evolution during the ALC1604 experiment test [5]. The values of porosity and permeability at zero stress are calculated from Equations (15) and (16) based on the current stress conditions. Moreover, the field excavation induces damage and fracturing around the gallery or tunnel (see Figure 8), which is named as excavation damage zone (EDZ) [35]. The EDZ has significant effects on fluid flow and transport properties in the low permeability COx claystone [5,36]. In our model, the artificial EDZ of 0.5 m thick around the ALC1604 cell is simply considered by increasing permeability to 1.0 × 10⁻¹⁵ m2 [4]. The specific heat capacity of the solid particles is 800 J/kg/K [4,5]. The values of thermal conductivity parallel and vertical to the bedding are estimated at approximately 2.1 W/m/K and 1.3 W/m/K, respectively [4,5]. In addition, the ALC1604 cell is modeled as a porous medium, while with high porosity of 0.99 and high permeability of 1.0 × 10⁻¹⁵ m2, respectively [19].

Table 1.
The main petrophysical, hydraulic, and thermal parameters of the COx claystone used in the simulations.
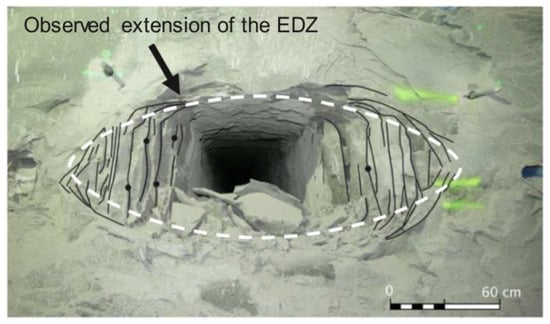
Figure 8.
The observed fractures around the micro-tunnel in COx claystone induced by excavation. Reprinted from [5] with permission from Elsevier.
Table 2 gives the mechanical properties of the host formation at the main level of ALC1604 experiment site. These mechanical model parameters are mainly based on the data reported by Mánica et al., (2017) [38] and Tourchi et al., (2021) [5]. The Young’s modulus is about 5200 MPa, and the Poisson’s ratio is 0.25. The peak friction angle is estimated at about 22.0°. The cohesion of the COx claystone is 3.55 MPa. To consider the casing effects, the ALC1604 cell is simulated with very high mechanical strength (e.g., the Young’s modulus is 210 GPa), which is much greater than that of the host formation. In addition, parameters related to porosity and permeability changes induced by mechanical response are also summarized in Table 2.
Table 2.
Mechanical parameters used for the COx claystone.
4.4. Operation Stages
According to the schedule of field operations [5,19], the various operation stages have been conducted in our numerical simulations for the ALC1604 experiment, as summarized in Table 3. The start time of simulation is specified on 23 October 2012 (e.g., the start time for drilling the ALC1604 cell). Noteworthy, only 89% of the designed heating power is explicitly simulated in our model, to realistically account for the heat dissipative effects induced by air convection and conduction/radiation processes in the non-heated zone [4,5]. The 89% value was obtained by Bumbieler et al. (2021) [4] following an iterative history matching procedure based on temperatures values measured in the field. In our model, the heating power is modeled as a heat source in the ALC1604 cell.
Table 3.
Stages of in-situ test at the ALC1604 cell. Reprinted from [5] with permission from Elsevier.
5. Results and Discussion
Based on the improved thermo-hydro-mechanical (THM) coupled code TOUGH2Biot, numerical simulations are employed to reproduce the THM behavior of the ALC1604 experiment in the MHM URL induced by thermal loading. In this section, the thermal, hydraulic and mechanical responses between the field observations and numerical results are compared and analyzed. The available field observation data are mainly cited from Tourchi et al., (2021) [5] and Bumbieler et al., (2021) [4].
5.1. Thermal Response
Figure 9 indicates the comparison of casing temperature evolution at the center of the Heater 3 (e.g., ALC1604_H3) between the field observation and numerical simulation. In our model, the temperature of the outermost layer of the ALC1604 cell is assumed as the casing temperature. Both the measured and modeled results indicate that the temperature increases rapidly in the first heating year followed by a smooth increase over the last 5 heating years. However, the field measured temperature reaches a maximum of 88 °C at the main heating stage, while the model temperature reaches a higher value of 92 °C after 6 years of heating. This is mainly due to the fact that the two-dimensional model limiting heat dissipation along the Y-axis direction (e.g., ALC1604 cell excavation direction), which has been well proved by Tourchi et al., (2021) [5]. In general, a good history match of the casing temperature evolution is obtained by our numerical model.
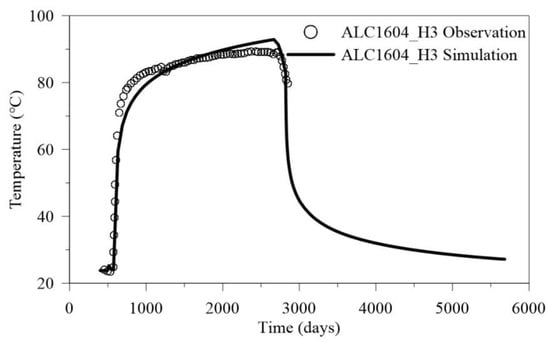
Figure 9.
Casing temperature evolution obtained by numerical simulation in comparison with the measurements.
Consistent with casing temperature evolution, both the measured and modeled temperatures at sensors in three monitoring boreholes increase rapidly in the first heating year followed by a smooth increase in the later heating stage (Figure 10). The highest temperatures of about 50 °C and 40 °C were recorded at ALC1616_02 (about 2 m from the cell wall along the bedding) and ALC1617_02 (about 3 m from the cell wall in the orthogonal direction), respectively [4,5]. A review of the temperatures at ALC1616_02 and ALC1617_02 indicates that the anisotropic has significant effects on the heat conduction. Both measured and modeled temperatures increase more rapidly along the bedding direction than in the vertical direction. The numerical model predicts the same temperature patterns at all monitoring boreholes. However, the highest temperatures are slightly higher than the measured data (e.g., no more than 4 °C) due to the limiting heat dissipation along the Y-axis direction. In addition, similar tendency of temperature changes is predicted in both directions during the cooling stage. After a cooling of six years, temperatures at these monitoring points rapidly drop to about 25 °C.
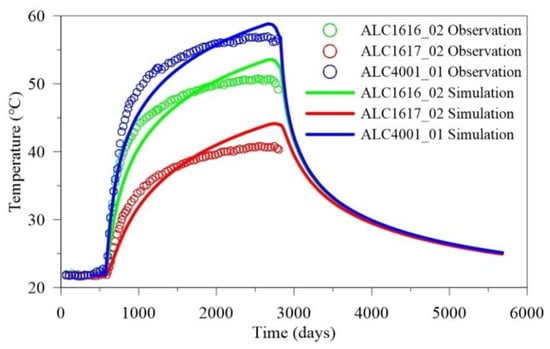
Figure 10.
Comparison of temperature evolution between the measurements and numerical results at sensors in three monitoring boreholes.
Figure 11 shows the spatial distributions of computed temperatures at different times, e.g., (a) after instrumentation of the apparatus, (b) after one year of heating, (c) after three years of heating, (d) after six years of heating, (e) after one year of cooling, and (f) after five years of cooling. As the heating continues, the region of high temperature gradually expands outwards around the ALC1604 cell (Figure 11b–d). Temperature shows an elliptical distribution, with higher values preferentially distributed along the bedding direction, in agreement with the anisotropic distribution of thermal conductivity values in the geological formation. During the cooling stage, formation temperature gradually decreases back to the initial value due to the heat dissipation effects (Figure 11e,f).
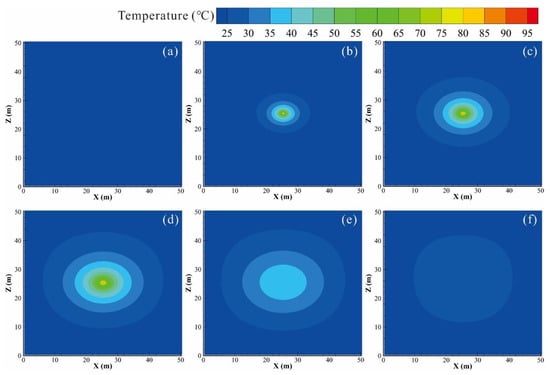
Figure 11.
Spatial distributions of model predicted temperatures at (a) 496.5 days, (b) 938.5 days, (c) 1668.5 days, (d) 2763.5 days, (e) 3128.5 days, and (f) 4588.5 days.
5.2. Hydraulic Response
A crucial goal of the full-scale ALC1604 experiment is to obtain a clear knowledge about the pore pressure change induced by excavation and thermal loading [4,5,19]. Figure 12 shows the comparison of pore pressure evolutions between the field observation and numerical simulation at three monitoring boreholes. In the excavation stage, the pore pressure surrounding the ALC1604 cell rapidly decreases due to the drainage condition of the cell. In the heating stage, temperature increase results in a significant increase of pore pressures in the COx formation. This is mainly due to the fact that the solid skeleton and pore water have different values of the thermal expansion coefficient [4,19]. In addition, the in-situ COx formation with very low permeability (~10−20 m2) means the excess pore pressure cannot dissipate rapidly. This promotes the significant growth of the excess pore pressure in the COx formation. As a result, the formation water continues to flow into the cell induced by pressure gradient in the excavation and heating stages, resulting in increased water saturation in the cell (Figure 13).
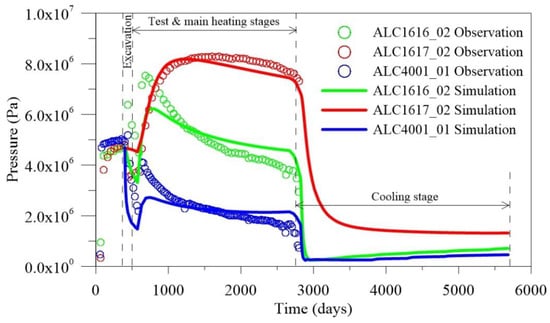
Figure 12.
Comparison of pore pressure evolution between the measurements and numerical results at sensors in three monitoring boreholes.
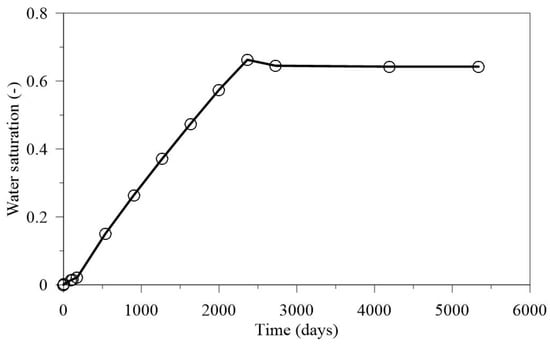
Figure 13.
Water saturation evolution at the ALC1604 cell.
A review of temperature (Figure 10) and pore pressure (Figure 12) evolutions suggests an interesting insight that the change of pore pressure is not exactly consistent with the change of formation temperature. Particularly, the increase in pore pressure stops at a point, but the temperature rises further. This point is the time that the dissipation of pore pressure overcomes the thermal effect, thus with the peak value of the excess pore pressure at this time during heating. As shown in Figure 12, the observed interesting phenomenon is notably apparent at the ALC1616 and ALC4001, and both of which are located along the bedding direction. The peak excess pore pressures occur on approximately 200 days after the beginning of the main heating stage at the ALC1616 and ALC4001, while peak pressures occur on approximately 800 days at the ALC1617. In addition, the peak value of excess pore pressure at the ALC1617 is greatly larger than that at the ALC1616 and ALC4001. These differences related to the hydraulic responses along the bedding and its vertical directions are mainly controlled by the anisotropic thermal and hydraulic properties in the COx claystone [4,5,10,19]. Although there are complex coupling behaviors, a good history match of the pore pressure evolution in the COx claystone can be obtained by our numerical model.
Figure 14 shows the spatial distributions of computed pore pressures at different times. After the excavation and instrumentation of the ALC1604 cell, a low pore pressure region forms surrounding the cell due to its drainage condition (Figure 14a). In the main heating stage, the high pore pressure front gradually moves into the formation around the ALC1604 cell as time goes on, as shown in Figure 14b–d. This stage is dominated by the increase in temperature due to the heating of the system, as already recognized in Figure 11. However, hydraulic effects are minimized in the surroundings of the heating cell due to the intrinsic low permeability of the COx formation. The maximum pore pressure predicted by the numerical model around the cell reaches about 10 MPa after the 6 years of heating (Figure 14d). This value remains below the in-situ minimum stress (e.g., 12.4 MPa) at the 490 m main level of the URL [4,5], but the potential mechanical response should be further analyzed. As expected, the pore pressure gradually decreases in the cooling stage (Figure 14e,f). After 5 years of cooling, an elliptically-shaped, low-pressure region has developed around the ALC1604 cell (Figure 14f). The low pressure boundary extends more along the bedding direction (about 15 m), compared to the vertical direction (less than 10 m), due to the aforementioned anisotropic distribution of the permeability in the COx formation.
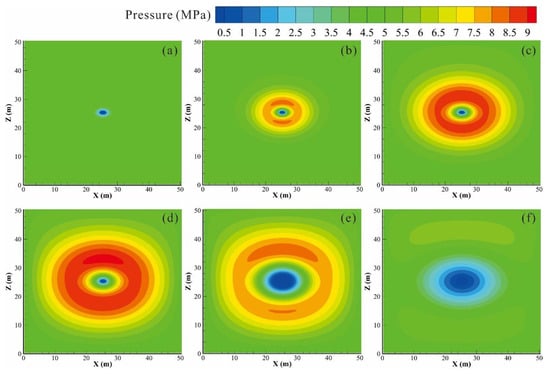
Figure 14.
Spatial distributions of model predicted pore pressure at (a) 496.5 days, (b) 938.5 days, (c) 1668.5 days, (d) 2763.5 days, (e) 3128.5 days, and (f) 4588.5 days.
5.3. Mechanical Response
According to the thermo-poro-elastic theory, the changes of pore pressure and temperature result in mechanical stress changes in the COx claystone. To quantify the stress changes in the formation induced by excavation and thermal loading, two points are monitored to investigate the total stress and effective stress evolutions, for example at 1.0 m and 5.0 m away from the ALC1604 cell along the bedding direction, respectively (Figure 15). As expected, the total stress rapidly decreases, while the effective stress rapidly increases in the excavation stage due to the drastic decrease in pore pressure in the COx formation near the ALC1604 cell (Figure 15a). The maximum drop of the total stress is 2.6 MPa (e.g., decreases from 16.2 MPa to 13.6 MPa) in the excavation stage. However, the excavation operation has no significant effect on the stress evolutions in the far field (e.g., >5.0 m away from the cell, see Figure 15b). This is mainly due to the fact that the COx claystone with very low permeability that blocks the quickly flow of pore water.
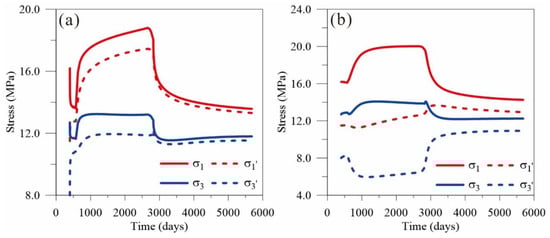
Figure 15.
Temporal evolutions of the total stresses ( and ) and effective stresses ( and ) at (a) 1.0 m and (b) 5.0 m away from the ALC1604 cell along the bedding direction.
In the main heating stage, the total stress in the formation continues to increase due to the increase in thermal stress (e.g., thermal expansion). However, the variation of effective stress is not consistent in the near 1.0 m point (Figure 15a) and in the far 5.0 m point (Figure 15b). This is mainly due to the fact that the pore pressure measured normal to bedding dissipates slower than that horizontal to the bedding (see Figure 14). Thus, the effective stress in the far field shows a decreasing phenomenon in the heating stage. However, the effective stress in the near field of the ALC1604 cell is mainly controlled by the depressurization effect and shows an increasing phenomenon. These interesting evolutions of the effective stress in the COx claystone can be observed through the contours of effective stress at different times, as shown in Figure 16. In addition, both the high effective stress region controlled by the drainage effect and the low effective stress region controlled by the heating effect show a typical elliptical shape (see Figure 16). As mentioned above, these characteristics are mainly induced by the anisotropic thermal and hydraulic properties in the COx claystone. In the cooling stage, the region of high effective stress gradually expands outwards around the ALC1604 cell due to the continuous drainage (Figure 16e,f).
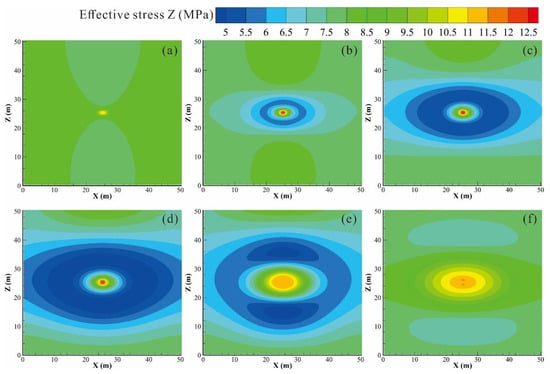
Figure 16.
Spatial distributions of model predicted effective stress in Z direction at (a) 496.5 days, (b) 938.5 days, (c) 1668.5 days, (d) 2763.5 days, (e) 3128.5 days, and (f) 4588.5 days.
Since the lateral and bottom boundary surfaces are designed with the normal zero-displacement, thus significant vertical deformation (e.g., displacement along the Z direction) can be observed, as shown in Figure 17. It is important to note that a negative value in Figure 17 indicates the vertical expansion, while a positive value indicates the vertical subsidence. In the excavation stage, there is weak subsidence above the cell and weak expansion below the cell due to stress release induced by the excavation operation (Figure 17a). The model predicted maximum subsidence is approximately 0.5 mm after 96.5 days excavation. In the heating stage, the expansion phenomenon occurs mainly in the COx claystone due to the thermal loading. However, the amount of expansion above the ALC1604 cell is significantly greater than that below it, as shown in Figure 17b. This is mainly due to the fact that the model considers the bottom of the domain as a zero-displacement boundary, while the top of the domain is allowed to move freely. After about six years heating, the maximum vertical expansion reaches 20.5 mm at the top of the ALC1604 cell. In the cooling stage, the thermal expansion effect gradually recovers due to the poro-elastic constitutive model is considered in this work.
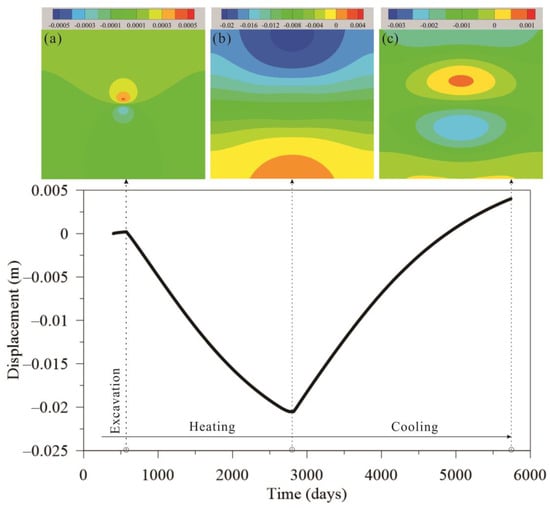
Figure 17.
Temporal evolution of vertical deformation at the top of the ALC1604 cell, and also shows spatial distributions of vertical deformation after (a) excavation, (b) heating, and (c) cooling stage.
Due to the poro-elastic constitutive model implemented in the simulator, the thermal expansion effect associated with the heating of the system is being progressively canceled during the successive stage of cooling. After about six years cooling, the vertical deformation in the COx claystone is mainly controlled by the drainage effect of the ALC1604 cell. As a consequence, a region of weak deflation and a region of week inflation are predicted to develop just above and below the reference cell (Figure 17c), respectively.
As a result of the mechanical response, changes in porosity and permeability at different times are given in Figure 18. In the heating stage, the formation porosity (Figure 18a,b) and permeability (Figure 18d,e) slightly increase and gradually expand outwards around the ALC1604 cell. This is mainly own to the expansion effect caused by thermal loading. This phenomenon related to the hydraulic properties changes have also been reported by Tourchi et al., (2021) [5]. The variations in hydraulic properties predicted by the numerical model are only minimally related (e.g., less than 1%) to the excavation and heating processes.
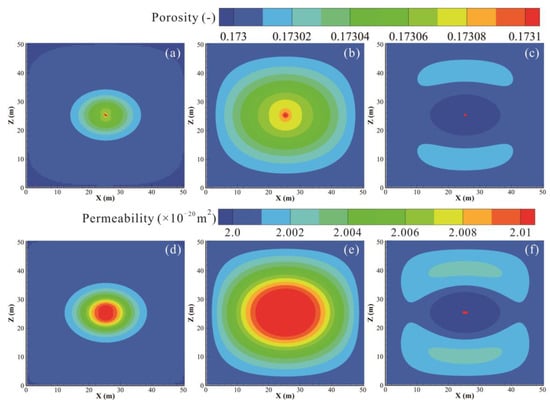
Figure 18.
Spatial distributions of model predicted porosity at (a) 938.5 days, (b) 2763.5 days, (c) 4588.5 days, and permeability at (d) 938.5 days, (e) 2763.5 days, and (f) 4588.5 days.
6. Conclusions
In this work, a 3D mechanical module was incorporated into the TOUGH2 thermal–hydraulic code to create the TOUGH2Biot, a thermo-hydro-mechanical (THM) coupled simulator. This code was successfully applied to predict and analyze the near and far field THM behavior of a claystone (the COx formation) during the disposal of HLW. Our modeling exercise benefited from a large dataset of field information generated by ANDRA during the ALC1604 experiment conducted at the MHM URL in France.
Modeling results indicate that the method has the potential to adequately reproduce relevant field observations, starting from variations in temperature and pore pressure measured in the monitoring boreholes during the heating of the experiment system. However, the numerical results obtained under plane strain conditions overestimate the temperature due to the assumption of zero longitudinal heat flux. This assumption also explains why the pore pressure dissipates lower in the simulation than in the experiment, which is remarkable for the points located parallel to the bedding. The spatial distributions of pore pressure, temperature and stress are significantly affected by the hydraulic and thermal anisotropy of the COx claystone. Formation temperature and pore pressure increase more rapidly along the bedding direction than in the vertical direction.
The effective stress in the formation shows increase in the near field, but shows decrease in the far field of the ALC1604 cell. After about six years heating, the maximum vertical expansion is 20.5 mm at the top of the ALC1604 cell (25 m distance). The slightly increases in porosity and permeability induced by stress changes have slight effect on THM responses in the COx formation. Moreover, the results suggest that thermo-poro-elastic model works well to represent the THM behavior of the formation in the far field and have proved to be a reliable tool for modeling a large-scale deep geological repository.
The reliability of the numerical predictions emerges as a key to decode complex flow-field patterns, and to advance in the characterization of the MHM URL site in France. Overall, by explicitly accounting for the coupled interplay of water flow, heat conduction, stress change and mechanical deformation, our numerical models can be considered as a preliminary support tool for the design of a HLW disposal scheme, and, in general, to develop recommendations for future test design in an effort to reduce prediction uncertainties in the performance assessment of nuclear waste disposal.
Author Contributions
Funding acquisition, T.X.; Investigation, Y.Y.; Methodology, Y.Y. and H.L.; Project administration, T.X. and F.G.; Software, Y.Y. and H.L.; Validation, F.G.; Writing—original draft, Y.Y.; Writing—review & editing, T.X. and F.G. All authors have read and agreed to the published version of the manuscript.
Funding
This work was jointly supported by the National Natural Science Foundation of China (Nos. 42130303 and 42006178). This research has also been funded by the College of New Energy and Environment of the Jilin University and the Istituto di Geoscienze e Georisorse (IGG) of the National Council of Italy (CNR) in collaboration project under the frame of the MOD-GRE (MODelling conventional and unconventional Geothermal Resources in Italy and China). Our deepest gratitude also goes to the anonymous reviewers for their careful work and thoughtful suggestions that have helped improve this paper substantially.
Institutional Review Board Statement
Not applicable.
Informed Consent Statement
Not applicable.
Data Availability Statement
Available on request.
Conflicts of Interest
The authors declare no conflict of interest.
Nomenclature
| Mass accumulation of component , kg/m3 | |
| Mass flux of component , kg/(m2·s) | |
| Sink/source of component , kg/(m3·s) | |
| Energy accumulation, J/m3 | |
| Energy flux, J/(m2·s) | |
| Sink/source of heat, J/(m3·s) | |
| Time, s | |
| Porosity | |
| Residual porosity with high stress | |
| Porosity at aero stress | |
| Saturation of phase | |
| Density of phase , kg/m3 | |
| Mass fraction of component in phase | |
| Mass diffusion of component in phase , kg/(m2·s) | |
| Permeability, m2 | |
| Permeability at zero stress, m2 | |
| Relative permeability of phase | |
| Viscosity of phase , Pa·s | |
| Pressure of phase , Pa | |
| Capillary pressure, Pa | |
| Gravitational acceleration vector, m/s2 | |
| Klinkenberg factor, Pa | |
| Medium tortuosity of phase | |
| Molecular diffusion coefficient of component in phase , m2/s | |
| Density of rock grain, kg/m3 | |
| Specific heat of rock grain, J/(kg·°C) | |
| Temperature, °C | |
| Internal energy of phase , J/kg | |
| Hydrate reaction heat, J | |
| Average thermal conductivity, W/(m·K) | |
| Specific enthalpy of phase , J/kg | |
| Phase, is aqueous and gasous, respectively | |
| Component, is water, salt and air, respectively | |
| Total stress, Pa | |
| Effective stress, Pa | |
| The mean effective stress, Pa | |
| Strain | |
| Displacement, m | |
| Elastic modulus, Pa | |
| Shear modulus, Pa | |
| Bulk modulus, Pa | |
| Poisson’s ratio | |
| Biot coefficient | |
| Linear thermal expansion coefficient, 1/°C | |
| Body force, Pa | |
| The experimental coefficient for porosity changes | |
| The experimental coefficient for permeability changes | |
| The given rock functions | |
| The transpose of a tensor | |
| The increment operator |
References
- Kim, J.S.; Kwon, S.K.; Sanchez, M.; Cho, G.C. Geological storage of high level nuclear waste. KSCE J. Civ. Eng. 2011, 15, 721–737. [Google Scholar] [CrossRef]
- Murshed, M.; Saboori, B.; Madaleno, M.; Wang, H.; Doğan, B. Exploring the nexuses between nuclear energy, renewable energy, and carbon dioxide emissions: The role of economic complexity in the G7 countries. Renew. Energy 2022, 190, 664–674. [Google Scholar] [CrossRef]
- Çakar, N.D.; Erdoğan, S.; Gedikli, A.; Öncü, M.A. Nuclear energy consumption, nuclear fusion reactors and environmental quality: The case of G7 countries. Nucl. Eng. Technol. 2022, 54, 1301–1311. [Google Scholar] [CrossRef]
- Bumbieler, F.; Plua, C.; Tourchi, S.; Minh-Ngoc, V.; Vaunat, J.; Gens, A.; Armand, G. Feasibility of constructing a full-scale radioactive high-level waste disposal cell and characterization of its thermo-hydro-mechanical behavior. Int. J. Rock Mech. Min. Sci. 2021, 137, 104555. [Google Scholar] [CrossRef]
- Tourchi, S.; Vaunat, J.; Gens, A.; Bumbieler, F.; Vu, M.N.; Armand, G. A full-scale in situ heating test in Callovo-Oxfordian claystone: Observations, analysis and interpretation. Comput. Geotech. 2021, 133, 104045. [Google Scholar] [CrossRef]
- Lee, C.; Lee, J.; Park, S.; Kwon, S.; Cho, W.-J.; Kim, G.Y. Numerical analysis of coupled thermo-hydro-mechanical behavior in single-and multi-layer repository concepts for high-level radioactive waste disposal. Tunn. Undergr. Space Technol. 2020, 103, 103452. [Google Scholar] [CrossRef]
- Armand, G.; Bumbieler, F.; Conil, N.; de la Vaissiere, R.; Bosgiraud, J.M.; Vu, M.N. Main outcomes from in situ thermo-hydro-mechanical experiments programme to demonstrate feasibility of radioactive high-level waste disposal in the Callovo-Oxfordian claystone. J. Rock Mech. Geotech. Eng. 2017, 9, 415–427. [Google Scholar] [CrossRef]
- Jia, Y.; Bian, H.B.; Duveau, G.; Su, K.; Shao, J.F. Numerical modelling of in situ behaviour of the Callovo-Oxfordian argillite subjected to the thermal loading. Eng. Geol. 2009, 109, 262–272. [Google Scholar] [CrossRef]
- Carter, J.; Luptak, A.; Gastelum, J.; Stockman, C.; Miller, A. Fuel Cycle Potential Waste Inventory for Disposition; U.S. Department of Energy, Office of Used Fuel Disposition: Washington, DC, USA, 2012.
- Wang, W.; Shao, H.; Nagel, T.; Kolditz, O. Analysis of coupled thermal-hydro-mechanical processes during small scale in situ heater experiment in Callovo-Oxfordian clay rock introducing a failure-index permeability model. Int. J. Rock Mech. Min. Sci. 2021, 142, 104683. [Google Scholar] [CrossRef]
- Armand, G.; Conil, N.; Talandier, J.; Seyedi, D.M. Fundamental aspects of the hydromechanical behaviour of Callovo-Oxfordian claystone: From experimental studies to model calibration and validation. Comput. Geotech. 2017, 85, 277–286. [Google Scholar] [CrossRef]
- Conil, N.; Vitel, M.; Plua, C.; Vu, M.N.; Seyedi, D.; Armand, G. In Situ Investigation of the THM Behavior of the Callovo-Oxfordian Claystone. Rock Mech. Rock Eng. 2020, 53, 2747–2769. [Google Scholar] [CrossRef]
- Ma, Y.-S.; Chen, W.-Z.; Yu, H.-D.; Gong, Z.; Li, X.-L. Variation of the hydraulic conductivity of Boom Clay under various thermal-hydro-mechanical conditions. Eng. Geol. 2016, 212, 35–43. [Google Scholar] [CrossRef] [Green Version]
- Ma, Y.-S.; Chen, W.-Z.; Gong, Z.; Yu, H.-D.; Li, F.-F.; Li, X.-L. Coupled thermo-hydro-mechanical anisotropy characteristics of clay Based on the ATLAS III in situ heating test. Rock Soil Mech. 2018, 39, 426–436. [Google Scholar] [CrossRef]
- Chen, W.Z.; Ma, Y.S.; Yu, H.D.; Li, F.F.; Li, X.L.; Sillen, X. Effects of temperature and thermally-induced microstructure change on hydraulic conductivity of Boom Clay. J. Rock Mech. Geotech. Eng. 2017, 9, 383–395. [Google Scholar] [CrossRef]
- Mueller, H.R.; Garitte, B.; Vogt, T.; Kohler, S.; Sakaki, T.; Weber, H.; Spillmann, T.; Hertrich, M.; Becker, J.K.; Giroud, N.; et al. Implementation of the full-scale emplacement (FE) experiment at the Mont Terri rock laboratory. Swiss J. Geosci. 2017, 110, 287–306. [Google Scholar] [CrossRef] [Green Version]
- Marschall, P.; Giger, S.; De la Vassiere, R.; Shao, H.; Leung, H.; Nussbaum, C.; Trick, T.; Lanyon, B.; Senger, R.; Lisjak, A.; et al. Hydro-mechanical evolution of the EDZ as transport path for radionuclides and gas: Insights from the Mont Terri rock laboratory (Switzerland). Swiss J. Geosci. 2017, 110, 173–194. [Google Scholar] [CrossRef]
- Bossart, P.; Jaeggi, D.; Nussbaum, C. Experiments on thermo-hydro-mechanical behaviour of Opalinus Clay at Mont Terri rock laboratory, Switzerland. J. Rock Mech. Geotech. Eng. 2017, 9, 502–510. [Google Scholar] [CrossRef]
- Seyedi, D.M.; Plúa, C.; Vitel, M.; Armand, G.; Rutqvist, J.; Birkholzer, J.; Xu, H.; Guo, R.; Thatcher, K.E.; Bond, A.E.; et al. Upscaling THM modeling from small-scale to full-scale in-situ experiments in the Callovo-Oxfordian claystone. Int. J. Rock Mech. Min. Sci. 2021, 144, 104582. [Google Scholar] [CrossRef]
- Xu, H.; Rutqvist, J.; Plúa, C.; Armand, G.; Birkholzer, J. Modeling of thermal pressurization in tight claystone using sequential THM coupling: Benchmarking and validation against in-situ heating experiments in COx claystone. Tunn. Undergr. Space Technol. 2020, 103, 103428. [Google Scholar] [CrossRef]
- Plúa, C.; Vu, M.N.; Armand, G.; Rutqvist, J.; Kolditz, O. A reliable numerical analysis for large-scale modelling of a high-level radioactive waste repository in the Callovo-Oxfordian claystone. Int. J. Rock Mech. Min. Sci. 2021, 140, 104574. [Google Scholar] [CrossRef]
- Pruess, K.; Oldenburg, C.M.; Moridis, G.J. TOUGH2 User’s Guide Version 2; Lawrence Berkeley National Lab. (LBNL): Berkeley, CA, USA, 1999; 204p. [Google Scholar]
- Wileveau, Y.; Cornet, F.H.; Desroches, J.; Blumling, P. Complete in situ stress determination in an argillite sedimentary formation. Phys. Chem. Earth 2007, 32, 866–878. [Google Scholar] [CrossRef]
- Lei, H.; Xu, T.; Jin, G. TOUGH2Biot-A simulator for coupled thermal-hydrodynamic-mechanical processes in subsurface flow systems: Application to CO2 geological storage and geothermal development. Comput. Geosci. 2015, 77, 8–19. [Google Scholar] [CrossRef]
- Klinkenberg, L.J. The Permeability of Porous Media To Liquids and Gases. In Proceedings of the Drilling and Production Practice, New York, NY, USA, 1 January 1941; pp. 200–213. [Google Scholar]
- Moridis, G.J. User’s Manual for the Hydrate v1.5 Option of TOUGH+ v1.5: A Code for the Simulation of System Behavior in Hydrate-Bearing Geologic Media; Lawrence Berkeley National Lab. (LBNL): Berkeley, CA, USA, 2014. [Google Scholar]
- Stauffer, P.H.; Vrugt, J.A.; Turin, H.J.; Gable, C.W.; Soll, W.E. Untangling Diffusion from Advection in Unsaturated Porous Media: Experimental Data, Modeling, and Parameter Uncertainty. Vadose Zone J. 2009, 8, 510–522. [Google Scholar] [CrossRef] [Green Version]
- Stauffer, P.H.; Lewis, K.C.; Stein, J.S.; Travis, B.J.; Lichtner, P.; Zyvoloski, G. Joule–Thomson Effects on the Flow of Liquid Water. Transp. Porous Media 2014, 105, 471–485. [Google Scholar] [CrossRef]
- Jin, G.; Lei, H.; Xu, T.; Xin, X.; Yuan, Y.; Xia, Y.; Juo, J. Simulated geomechanical responses to marine methane hydrate recovery using horizontal wells in the Shenhu area, South China Sea. Mar. Pet. Geol. 2018, 92, 424–436. [Google Scholar] [CrossRef]
- Rutqvist, J.; Moridis, G.J. Numerical Studies on the Geomechanical Stability of Hydrate-Bearing Sediments. Spe J. 2009, 14, 267–282. [Google Scholar] [CrossRef]
- Rutqvist, J.; Wu, Y.S.; Tsang, C.F.; Bodvarsson, G. A modeling approach for analysis of coupled multiphase fluid flow, heat transfer, and deformation in fractured porous rock. Int. J. Rock Mech. Min. Sci. 2002, 39, 429–442. [Google Scholar] [CrossRef]
- Leverett, M.C. Capillary Behaviour in Porous Solids. Trans. AIME 1941, 142, 151–169. [Google Scholar] [CrossRef]
- Yuan, Y.; Xu, T.; Jin, C.; Zhu, H.; Gong, Y.; Wang, F. Multiphase flow and mechanical behaviors induced by gas production from clayey-silt hydrate reservoirs using horizontal well. J. Clean. Prod. 2021, 328, 129578. [Google Scholar] [CrossRef]
- Robinet, J.C.; Paul, S.; Coelho, D.; Parneix, J.C.; Pret, D.; Sammartino, S.; Boller, E.; Altmann, S. Effects of mineral distribution at mesoscopic scale on solute diffusion in a clay-rich rock: Example of the Callovo-Oxfordian mudstone (Bure, France). Water Resour. Res. 2012, 48, 5554. [Google Scholar] [CrossRef]
- Tsang, C.F.; Bernier, F.; Davies, C. Geohydromechanical processes in the Excavation Damaged Zone in crystalline rock, rock salt, and indurated and plastic clays—In the context of radioactive waste disposal. Int. J. Rock Mech. Min. Sci. 2005, 42, 109–125. [Google Scholar] [CrossRef]
- Armand, G.; Leveau, F.; Nussbaum, C. Geometry and Properties of the Excavation-Induced Fractures at the Meuse/Haute-Marne URL Drifts. Rock Mech. Rock Eng. 2014, 47, 21–41. [Google Scholar] [CrossRef]
- Moridis, G.J.; Freeman, C.M. The RealGas and RealGasH2O options of the TOUGH+ code for the simulation of coupled fluid and heat flow in tight/shale gas systems. Comput. Geosci. 2014, 65, 56–71. [Google Scholar] [CrossRef] [Green Version]
- Mánica, M.; Gens, A.; Vaunat, J.; Ruiz, D.F. A time-dependent anisotropic model for argillaceous rocks. Application to an underground excavation in Callovo-Oxfordian claystone. Comput. Geotech. 2017, 85, 341–350. [Google Scholar] [CrossRef]
Publisher’s Note: MDPI stays neutral with regard to jurisdictional claims in published maps and institutional affiliations. |
© 2022 by the authors. Licensee MDPI, Basel, Switzerland. This article is an open access article distributed under the terms and conditions of the Creative Commons Attribution (CC BY) license (https://creativecommons.org/licenses/by/4.0/).